

Abstract
ULTIVA® (remifentanil hydrochloride) is a sterile, nonpyrogenic, preservative-free, white to off-white lyophilized powder for intravenous (IV) administration after reconstitution and dilution. Each vial contains 1, 2, or 5 mg of remifentanil base; 15 mg glycine; and hydrochloric acid to buffer the solutions to a nominal pH of 3 after reconstitution. ULTIVA® is a μ-opioid agonist with rapid onset and peak effect, and short duration of action.
Intra-lot and inter-lot variability in the spectra of ULTIVA® was measured in the Drug Quality Study (DQS) using Fourier transform near-infrared spectrometry (FTNIR). In 6 vials sampled, 1 came from lot 220453F while 5 came from lot 30020BF. The 1 vial sampled from lot 220453F appeared 122 multidimensional SDs from the other vials from lot 30020BF, suggesting that it represents a different formulation or material. Consequently, additional spectra from other lots were analyzed.
Spectra of 90 vials from 9 lots in the spectral library contained vials that were outside the main group (50.3 SDs using a subcluster detection test), suggesting that the 35 library vials (39% of the total) contain different materials from the other 55 vials.
Introduction
The University of Kentucky’s (UK) Drug Quality Study was established in August of 2019 to engage in consumer-level quality assurance screening for drugs used within UK HealthCare’s pharmacies. DQS currently screens medications using FTNIR and Raman spectroscopy for potential quality defects indicated by variability in absorbance peak intensities and locations. Through years of continuous monitoring, DQS has assembled a spectral library containing medications typically used in a health system setting. Statistical analyses using DQS’ spectral library are performed to identify potential intra-lot and inter-lot variability in medications under review. Using MedWatch, DQS reports its findings in an effort to hold manufacturers accountable for GMP requirements and to improve patient outcomes by providing information on quality to augment the information on price that is already available. The increasing transparency is designed to improve the pharmaceutical supply chain. At all levels, DQS staff are committed to achieving service excellence by pursuing compliance with the standards set forth by our patients and broad GxP requirements (Isaacs, 2022a).
Drug Product
ULTIVA® (remifentanil) is a sterile, nonpyrogenic, preservative-free, white to off-white lyophilized powder for intravenous (IV) administration after reconstitution and dilution. Each vial contains 1, 2, or 5 mg of remifentanil base; 15 mg glycine; and hydrochloric acid to buffer the solutions to a nominal pH of 3 after reconstitution. ULTIVA® is a μ-opioid agonist with rapid onset and peak effect, and short duration of action. The μ-opioid activity of ULTIVA® is antagonized by opioid antagonists such as naloxone. A representative photo of the vials appears in Figure 1.
Figure 1.
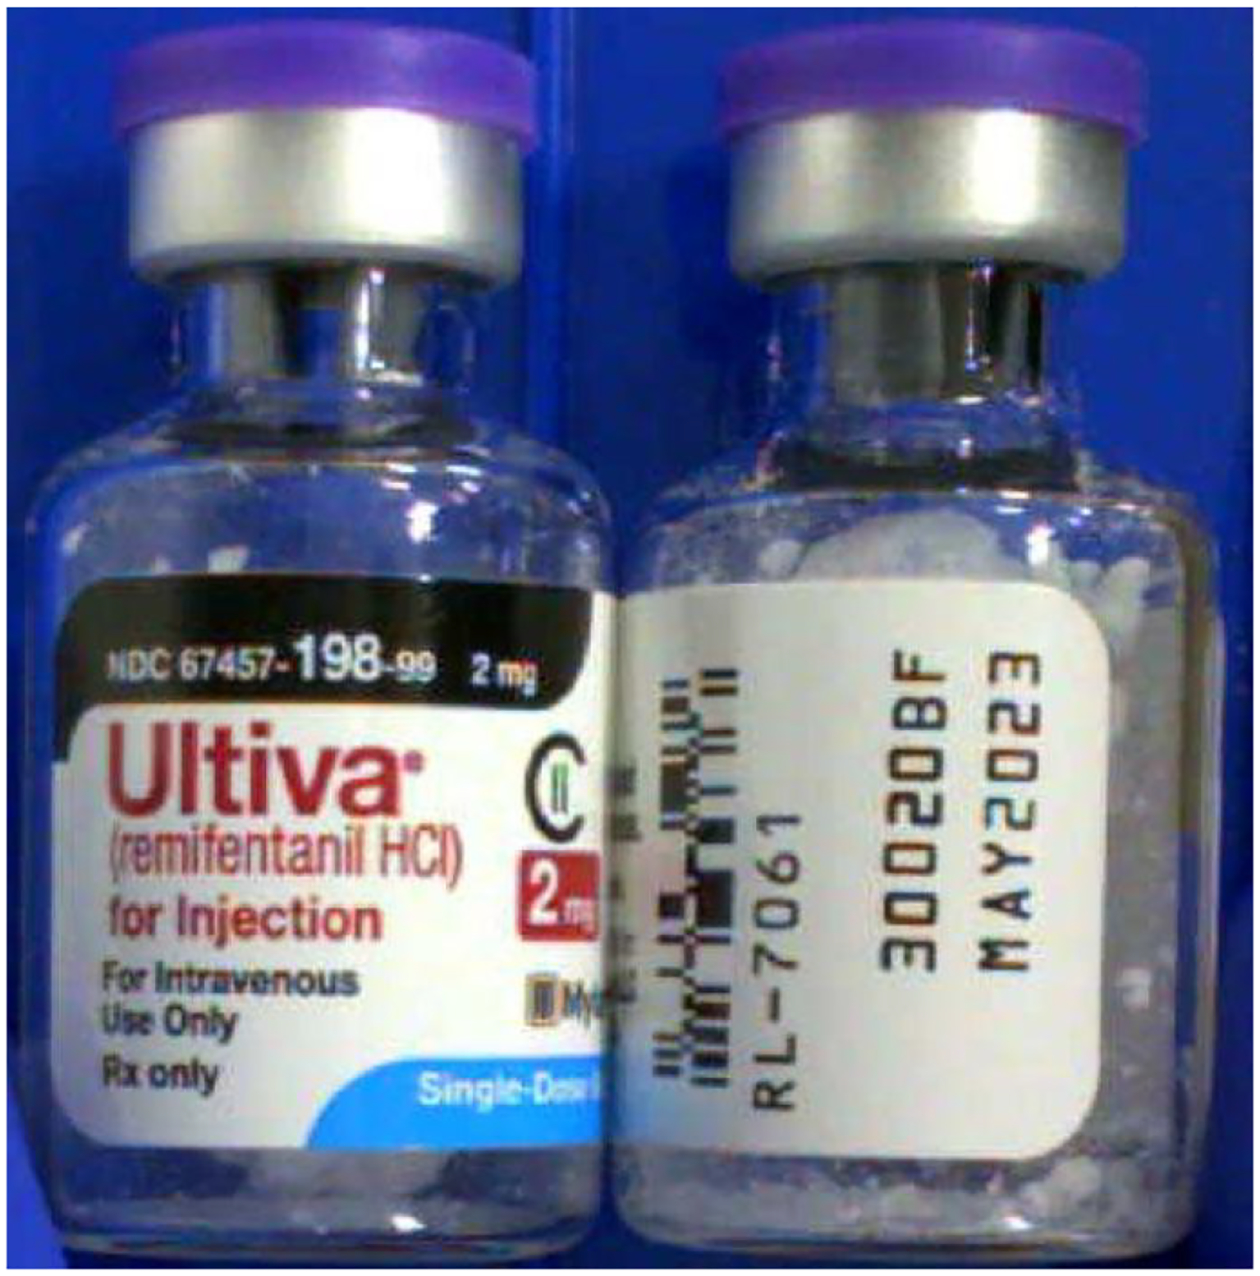
Vials of ULTIVA®(remifentanil) for injection. The drug appears as an off- white freeze-dried powder in the vial on the right. The vials were scanned nondestructively in the near-infrared spectral region through the bottom of the vials.
ULTIVA® is indicated for IV administration: (1) as an analgesic agent for use during the induction and maintenance of general anesthesia for inpatient and outpatient procedures, (2) for continuation as an analgesic into the immediate postoperative period in adult patients under the direct supervision of an anesthesia practitioner in a postoperative anesthesia care unit or intensive care setting, (3) as an analgesic component of monitored anesthesia care in adult patients (FDA, 2005).
The lot numbers making up the ULTIVA® spectral library were 010303F, 30020BF, 33015BF, 070353F, 110053F, 110103F, 200753F, 220453F, and 300208F.
Background
In April 2019, Johnson Matthey, Inc. recalled a single lot of remifentanil hydrochloride due to an unknown impurity that was greater than specification limits, according to the April 24, 2019, US Food and Drug Administration (FDA) Enforcement Report. The recall involved remifentanil hydrochloride active pharmaceutical ingredient (API) for processing, manufacturing, or repackaging, a 416.95 g glass container, from lot B1319–170101. The recalled remifentanil hydrochloride was shipped to Morgantown, WV (where Mylan had a facility), which may have incorporated the API in manufacturing and distributed it further at the retail level across the United States (Tumolo, 2019).
In 2016 GlaxoSmithKline (GSK) began a temporary and voluntary hold on manufacturing and release of ULTIVA® For Injection 1 mg/vial (Remifentanil Hydrochloride) from its Parma, Italy manufacturing establishment (GSK, 2016). This hold was a precautionary action while GSK probed and solved an issue with data inconsistencies at this plant. GSK warned healthcare providers of a possible temporary disruption to the supply of the product.
In December 2007 Health Canada issued a recall for ULTIVA® 1 mg owing to the fact that the product label had a printing defect in which a small area of ink was not transferred onto the vial label (Health Canada, 2007). This defect, the size of a decimal point, appeared on certain labels directly before the ULTIVA® strength (1 mg) and could have been mistaken for 0.1 mg instead of 1 mg.
FDA Medwatch
An FDA Form 3500 Medwatch describing the findings of this Rapid Communication was filed on Sep 14 2022 (FDA Form 3500, 2022).
Methods
FTNIR (Fourier Transform Near-Infrared) Spectrometry
Using nondestructive analytical techniques, FTNIR spectra were collected for inventory belonging to lots 010303F, 30020BF, 33015BF, 070353F, 110053F, 110103F, 200753F, 220453F, and 300208F as part of routine medication quality screening. The vials were stored under the conditions required by the manufacturer in their original packaging. FTNIR spectra were collected noninvasively and nondestructively through the bottom of the vials using a Thermo Scientific Antaris II FTNIR Analyzer (Waltham, MA, USA)(Isaacs, 2022b).
Multiplicative Scatter Correction (MSC)
Multiplicative scatter correction (MSC) is a widely used spectrometric normalization technique. Its purpose is to correct spectra in such a way that they are as close as possible to a reference spectrum, generally the mean of the data set, by changing the scale and the offset of the spectra (Isaksson, 1988).
BEST (Bootstrap Error-Adjusted Single-sample Technique)
The BEST calculates distances in multidimensional, asymmetric, nonparametric central 68% confidence intervals in spectral hyperspace (roughly equivalent to standard deviations)(Dempsey, 1996). The BEST metric can be thought of as a “rubber yardstick” with a nail at the center (the mean). The stretch of the yardstick in one direction is therefore independent of the stretch in the other direction. This independence enables the BEST metric to describe odd shapes in spectral hyperspace (spectral point clusters that are not multivariate normal, such as the calibration spectra of many biological systems). BEST distances can be correlated to sample composition to produce a quantitative calibration, or simply used to identify similar regions in a spectral image. The BEST automatically detects samples and situations unlike any encountered in the original calibration, making it more accurate in chemical investigation than typical regression approaches to near-IR analysis. The BEST produces accurate distances even when the number of calibration samples is less than the number of wavelengths used in calibration, in contrast to other metrics that require matrix factorization. The BEST is much faster to calculate as well (O(n) instead of the O(n3) required by matrix factorization.)
Principal Components (PCs)
Principal component analysis is the process of computing the principal components of a dataset and using them to execute a change of basis (change of coordinate system) on the data, usually employing only the first few principal components and disregarding the rest (Joliffe, 2016). PCA is used in exploratory data analysis and in constructing predictive models. PCA is commonly utilized for dimensionality reduction by projecting each data point onto only the first few principal components to obtain lower-dimensional data while preserving as much of the original variation in the data as possible. The first principal component is the direction that maximizes the variance of the projected data. The second principal component is the direction of the largest variance orthogonal to the first principal component. Decomposition of the variance typically continues orthogonally in this manner until some residual variance criterion is met. Plots of PC scores help reveal underlying structure in data.
Subcluster Detection
In typical near-infrared multivariate statistical analyses, samples with similar spectra produce points that cluster in a certain region of spectral hyperspace. These clusters can vary significantly in shape and size due to variation in sample packings, particle-size distributions, component concentrations, and drift with time. These factors, when combined with discriminant analysis using simple distance metrics, produce a test in which a result that places a particular point inside a particular cluster does not necessarily mean that the point is actually a member of the cluster. Instead, the point may be a member of a new, slightly different cluster that overlaps the first. A new cluster can be created by factors like low-level contamination, moisture uptake, or instrumental drift. An extension added to part of the BEST, called FSOB (Fast Son of BEST) can be used to set nonparametric probability-density contours inside spectral clusters as well as outside (Lodder, 1988), and when multiple points begin to appear in a certain region of cluster-hyperspace the perturbation of these density contours can be detected at an assigned significance level using r values, and visualized using quantile-quantile (QQ) plots. The detection of unusual samples both within and beyond 3 SDs of the center of the training set is possible with this method. Within the ordinary 3 SD limit, however, multiple instances are needed to detect unusual samples with statistical significance.
Results and Discussion
Intralot Analysis
Spectra of a group of 6 vials from 2 different lots of remifentanil are shown in Figure 2. In Figure 2, 5 spectra are very similar and one vial, number 1 in Figure 2 from lot 220453F, appears to be very different. Almost every peak is different between vial 1 and vials 2 through 6. Later, vial 1 turned out to be 122 multidimensional standard deviations (SDs)(see Figure 4) from the rest of the spectra (lot 30020BF).
Figure 2.
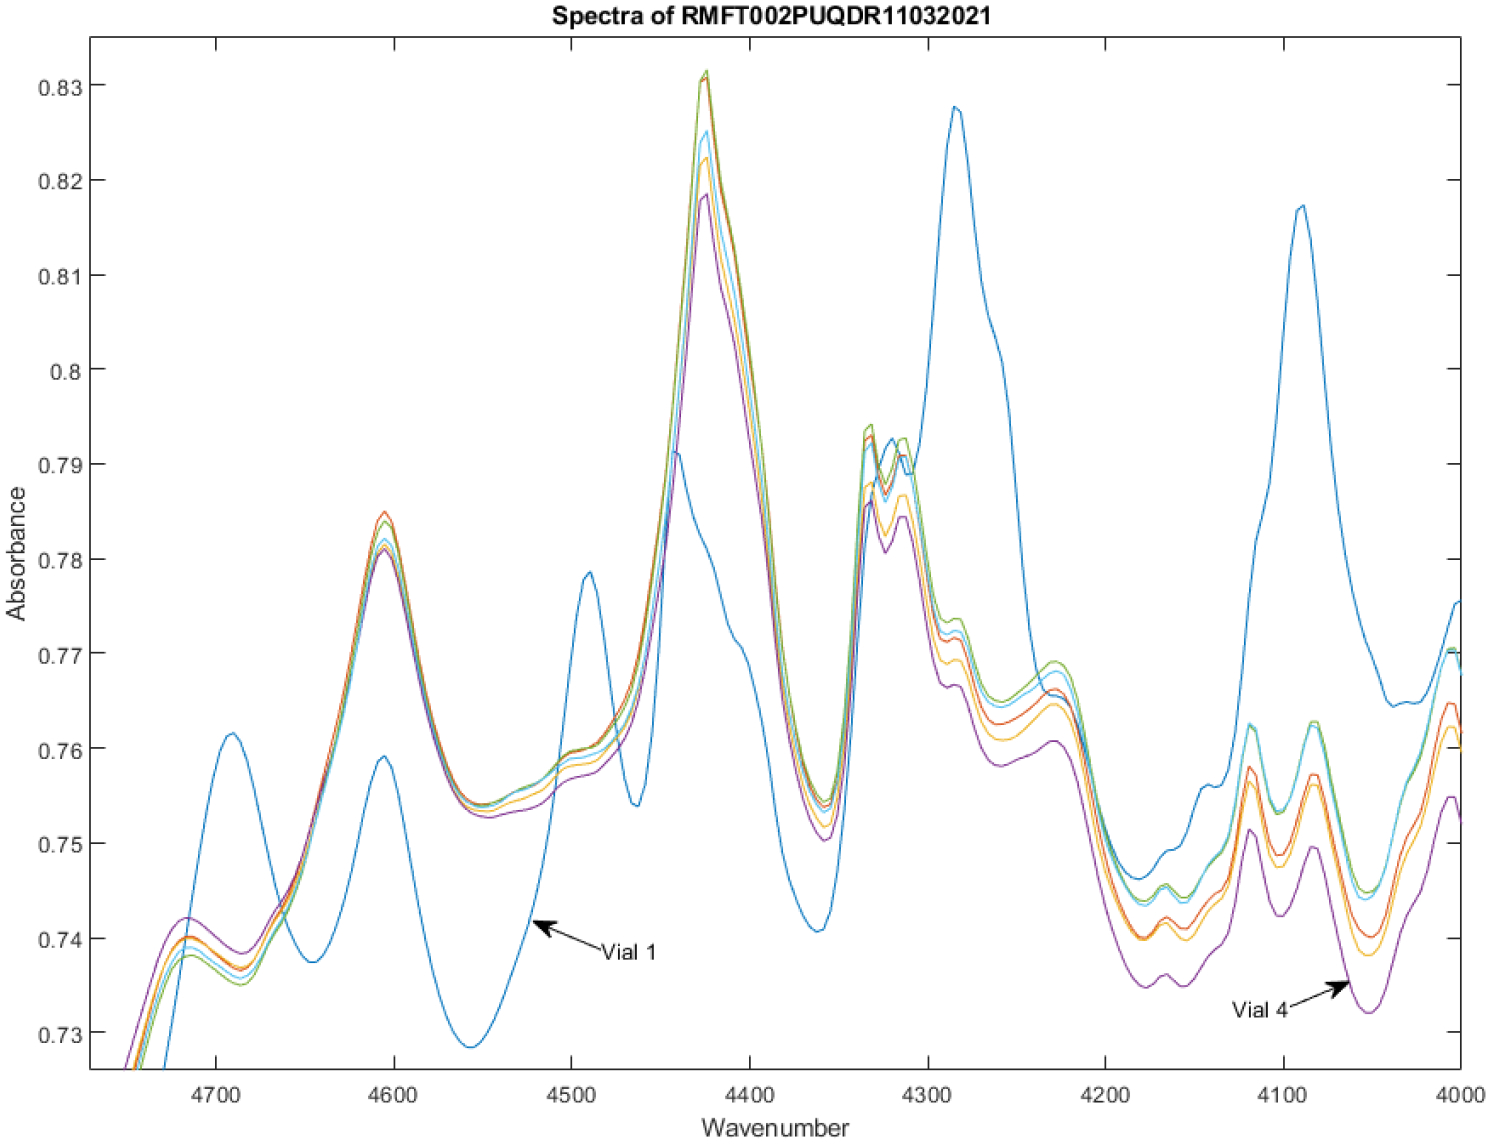
FTNIR spectra of vials of Lots 220453F (Vial 1) and 30020BF (Vials 2–6) from 4000–4800 cm−1. In the PC plot (Figure 4), both vial 1 (dark blue line) and vial 4 (violet line) appear to be outliers from the main group. However, only vial 1 is displaced orthogonally (122 SDs) from the maximum variation (major axis) of the group of spectra.
Figure 4.
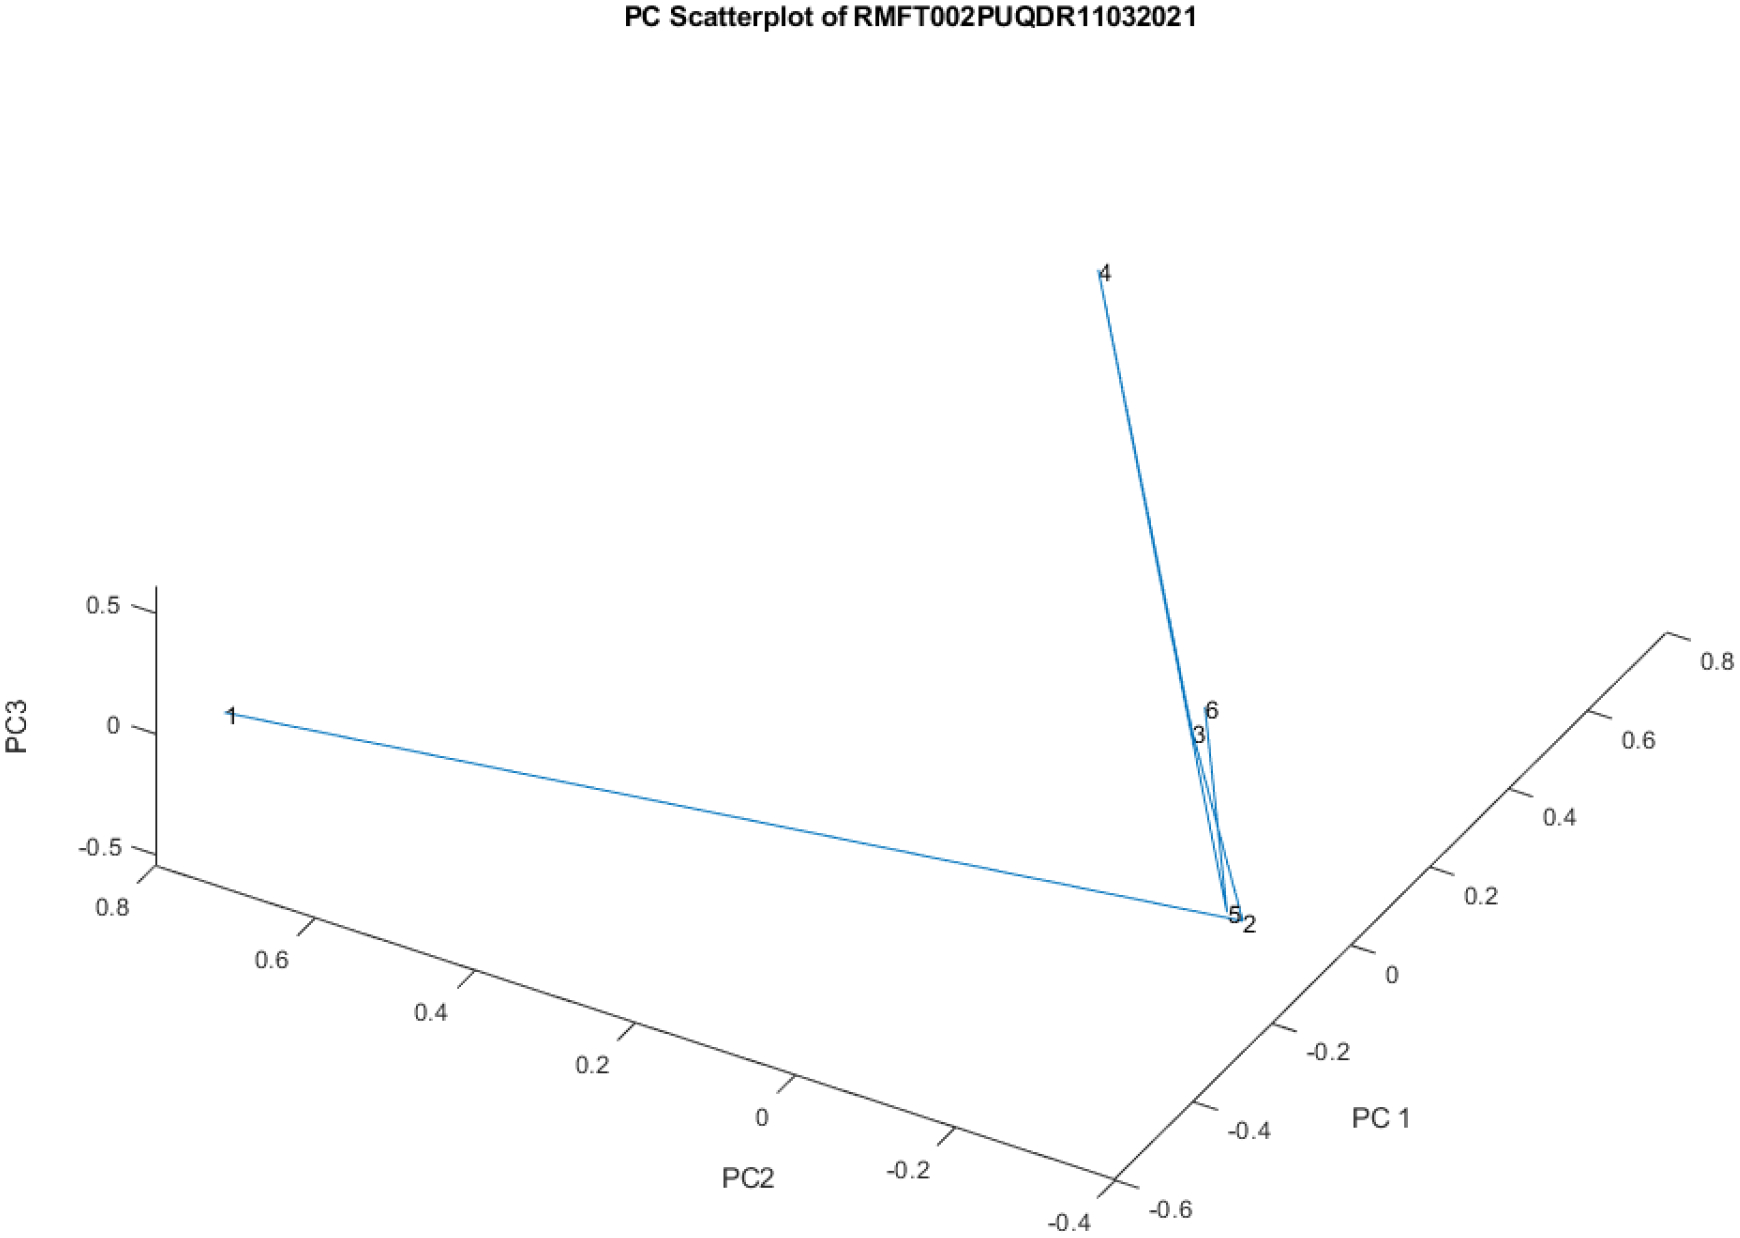
PC score plot of the spectra of the vials in Lots 220453F and 30020BF. VIal 1 is displaced 122 SDs from the other vials.
The same vials appearing in Figure 2 are plotted in Figure 3 in a different spectral region, 5600–6300 cm−1. While the peak differences in this region are not as dramatic as in the region depicted in Figure 2, peaks near 5780, 6130, and 6190 cm−1 are all different between vial 1 and the remaining vials.
Figure 3.
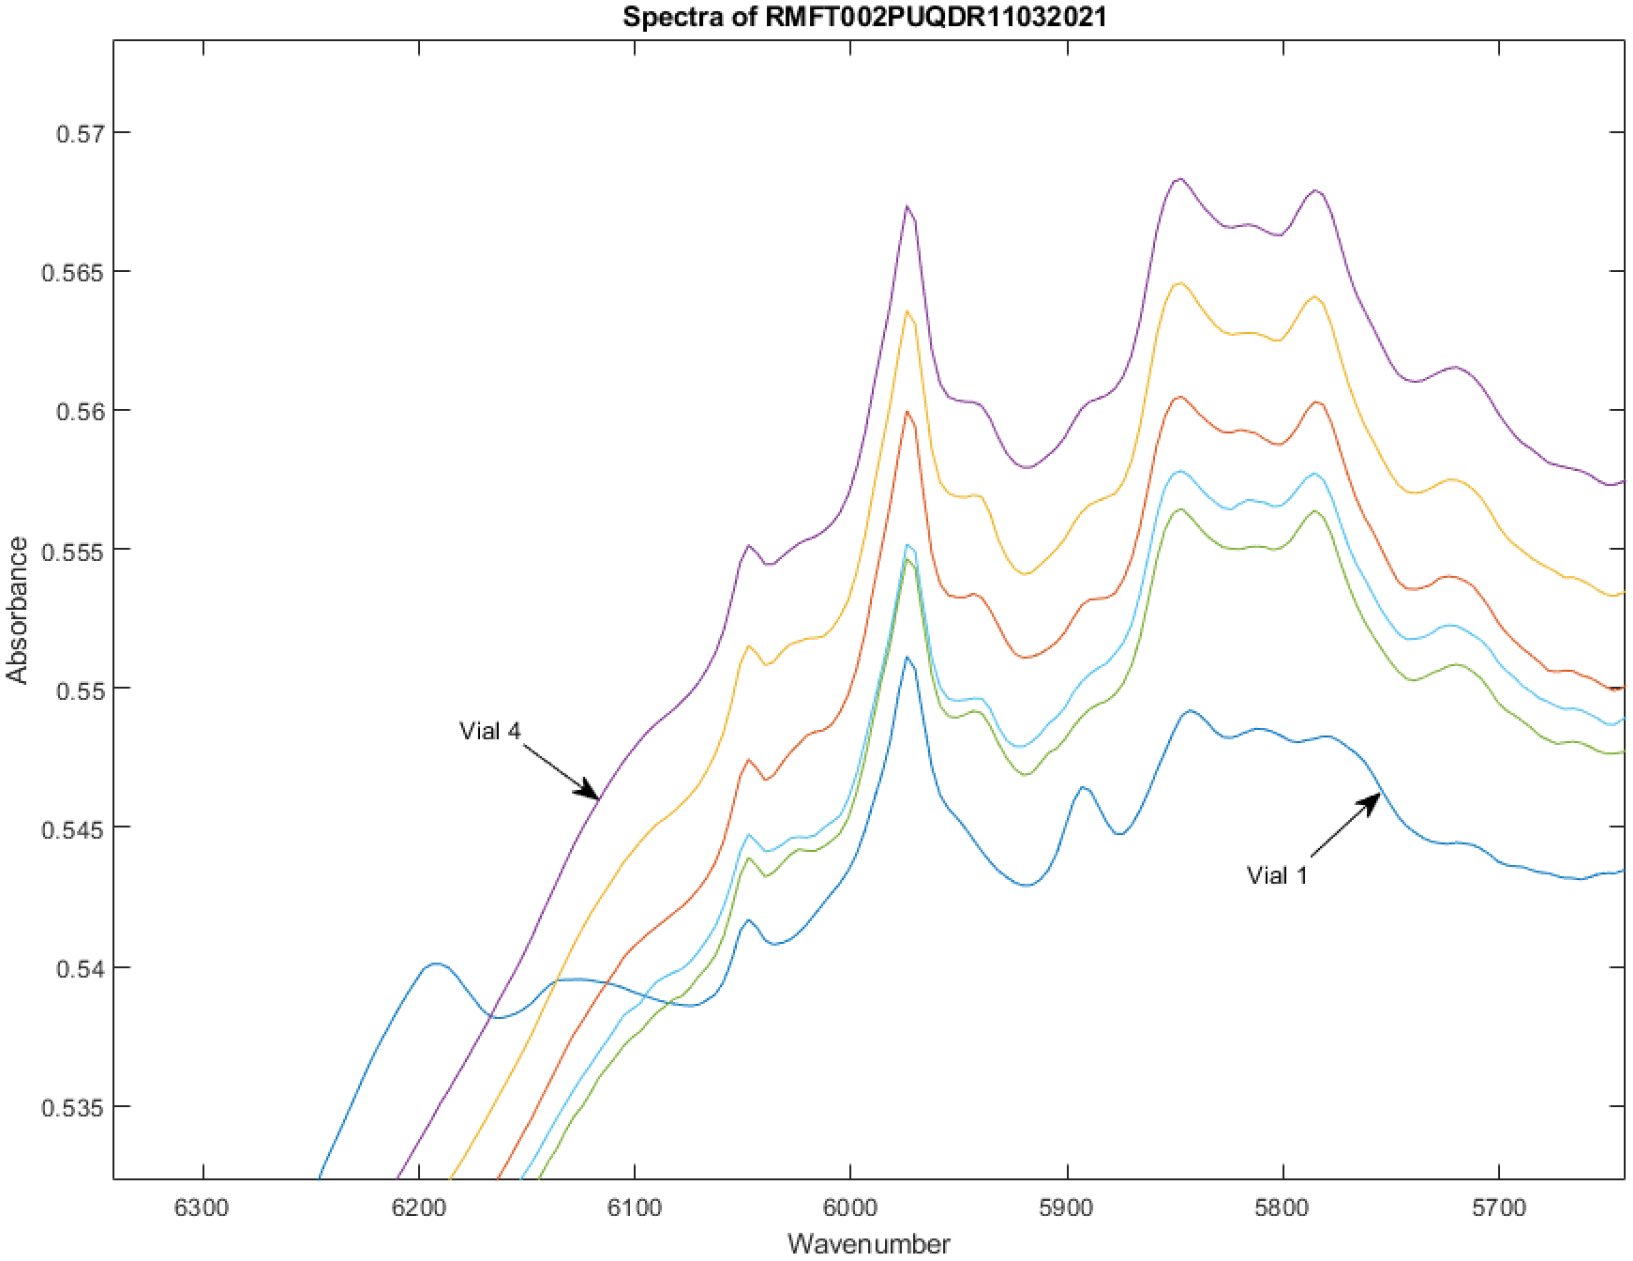
FTNIR spectra of vials of Lots 220453F and 30020BF from 5600–6300 cm−1.These are the same vials depicted in the spectra in Figure 2.
Using the full spectra collected at 1557 wavenumbers, vial 1 appeared 9.9 SDs from vials 2–6. Using only PCs 1–3 of the spectra, vial 1 appeared 122.5 SDs from the other vials (see Figure 4). It is unusual for samples of the same drug to appear so dissimilar.
Table 1 lists the PC number, fraction of the total variation accounted for by that PC, and the cumulative fraction of the total variation accounted for by that PC for the data in Figures 1–4.
Table 1.
| PC Number | Variation in this PC | Cumulative PC Variation |
|---|---|---|
| 1 | 0.5398 | 0.5398 |
| 2 | 0.2384 | 0.7782 |
| 3 | 0.1279 | 0.9061 |
| 4 | 0.0519 | 0.9580 |
| 5 | 0.0420 | 1.0000 |
| 6 | 0.0000 | 1.0000 |
Figure 5 is a graph of the loadings for PC 1.
Figure 5.
PC 1 loadings spectrum for Lot 220453F and Lot 30020BF. Baseline variations are weighted most heavily in forming this principal component.
The loadings spectrum of PC 1 weights most heavily baseline variations in the spectra, which is typical. Nevertheless spectral features are apparent at 4242, 4316, 4503, 4695, 4808, 6222, 6304, 7153, 7234, 7346, and 8552 cm−1.
The loadings spectrum of PC 2 appears in Figure 6. The PC 2 loadings do not reflect much baseline variation, and instead reveal peaks in regions similar to those seen in Figure 2 and Figure 3.
Figure 6.
PC 2 loadings spectrum for Lot 220453F and Lot 30020BF
The loadings spectrum of PC 3 is shown in Figure 7. Other peaks in the regions shown in Figure 2 and Figure 3 are receiving relatively high weighting. Noise is creeping into the loadings from the direction of the spectrum of visible light.
Figure 7.
PC 3 loadings spectrum for Lot 220453F and Lot 30020BF
The huge difference between the vial from lot 220453F and the vials from lot 30020BF led to the interlot variation analysis of the remifentanil library below.
Interlot Analysis
After inspecting the spectra in Lot 220453F and Lot 30020BF, a full interlot analysis of the library of remifentanil spectra was conducted. The 9 lot numbers making up the ULTIVA® spectral library were 010303F, 30020BF, 33015BF, 070353F, 110053F, 110103F, 200753F, 220453F, and 300208F. The FTNIR spectra were transformed to principal axes and the first three PCs of the vials in the spectral library are plotted in Figure 8. The spectral variation accounted for by each PC is given in Table 2. Figure 8 shows that there are two distinct groups of spectra in the remifentanil library. The group on the right with more spread contains 35 vials (39% of the total), while the tighter group on the left contains 55 vials (61% of the total).
Figure 8.
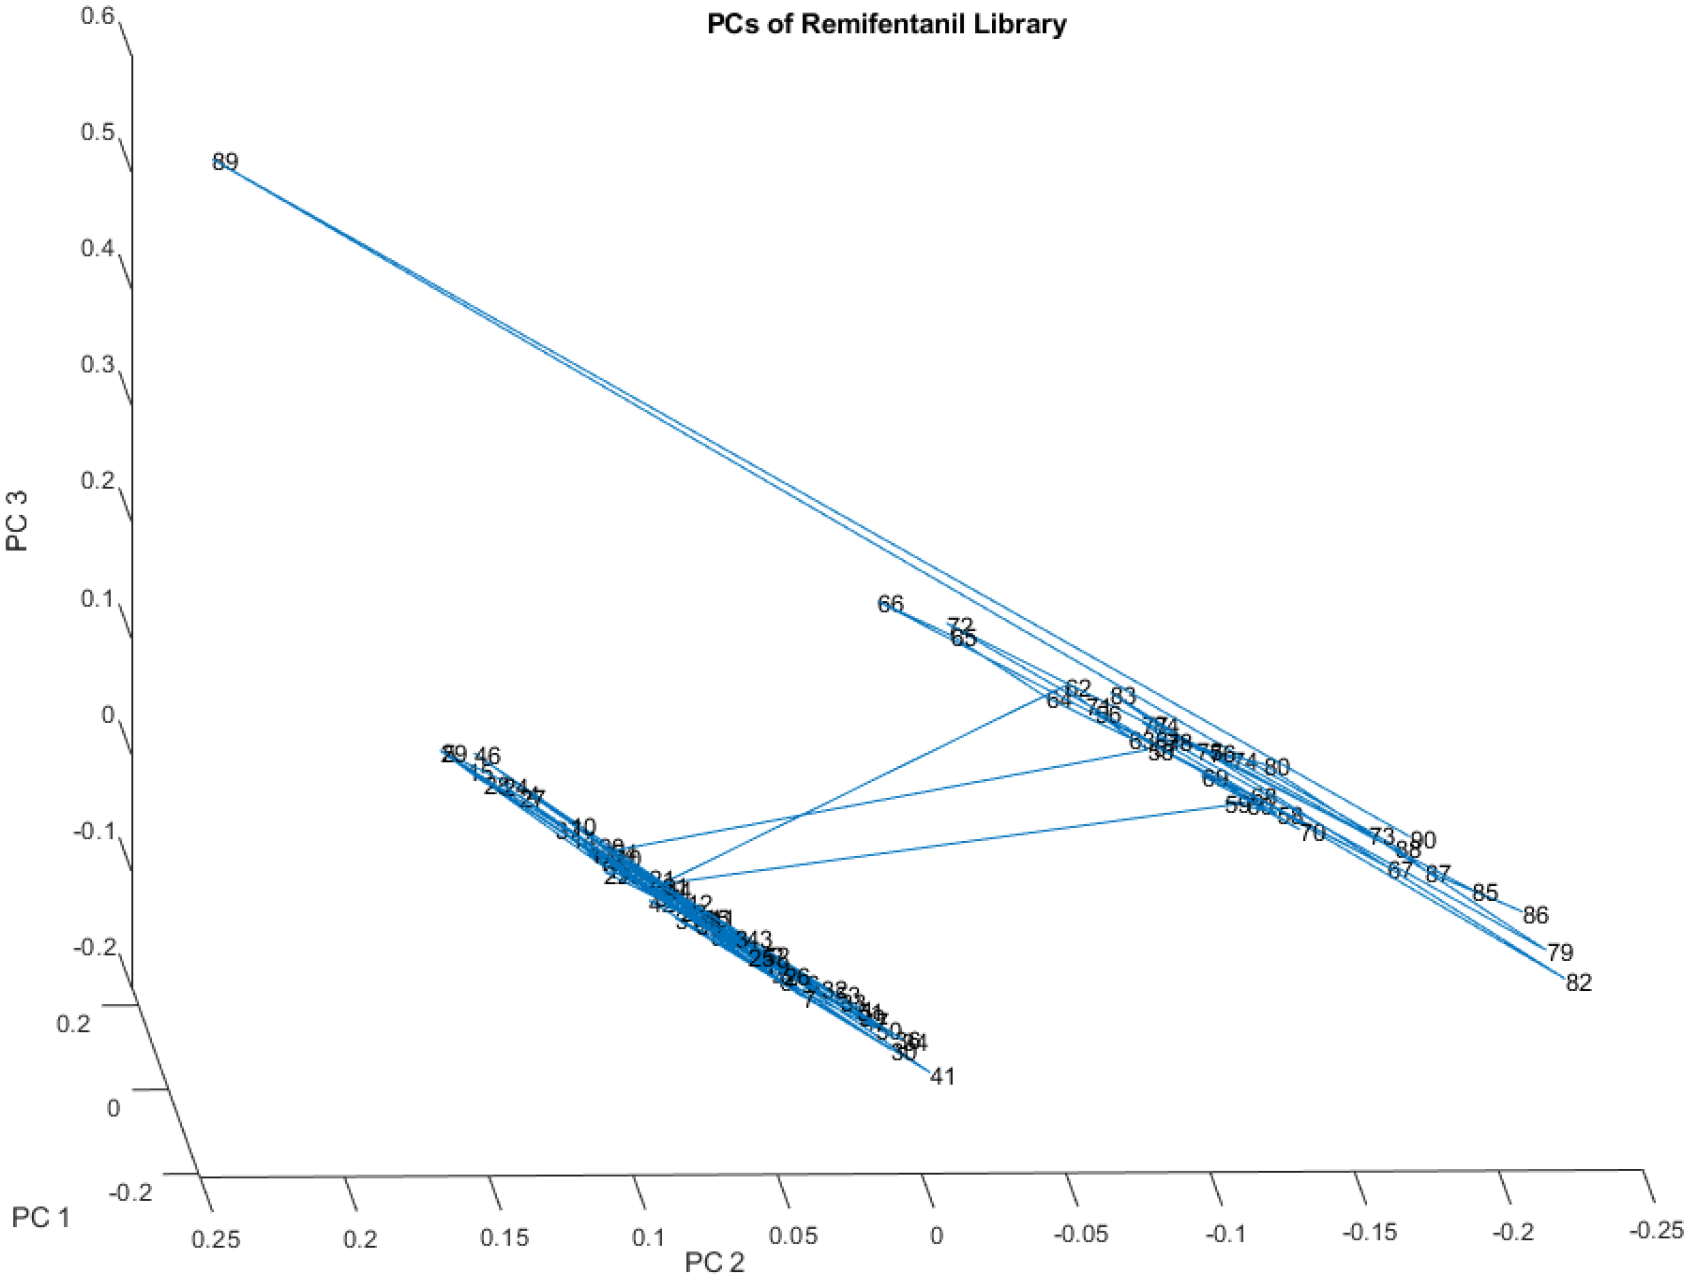
PC score plot of the spectra of the 90 vials in the remifentanil library. The group on the right with more spread contains 35 vials, while the tighter group on the left contains 55 vials. The 2 groups of spectra are 50.3 SDs apart using the subcluster detection test (rtn=0.99, rtst= 0.86).
Table 2.
Variation accounted for by the largest principal components of the library spectra plotted in Figure 8
| PC Number | Variation in this PC | Cumulative PC Variation |
|---|---|---|
| 1 | 0.3438 | 0.3438 |
| 2 | 0.2133 | 0.5571 |
| 3 | 0.1298 | 0.6870 |
| 4 | 0.0531 | 0.7401 |
| 5 | 0.0348 | 0.7749 |
| 6 | 0.0202 | 0.7951 |
Clearly, the spectral library is not homogeneous. An examination of the spectra for the two groups reveals that these two groups are the same groups that were observed in lots 220453F and 30020BF. Figure 8 also shows that each lot is either in one group or the other; in other words, each lot of one group does not contain outliers from the other group. The extreme spectra from the top and bottom of the larger group on the right of Figure 8 appear similar, but there is a baseline difference as well as a difference in peak heights near 4100, 4160, 4220, 4530, and 4720 cm−1 (see Figure 9).
Figure 9.
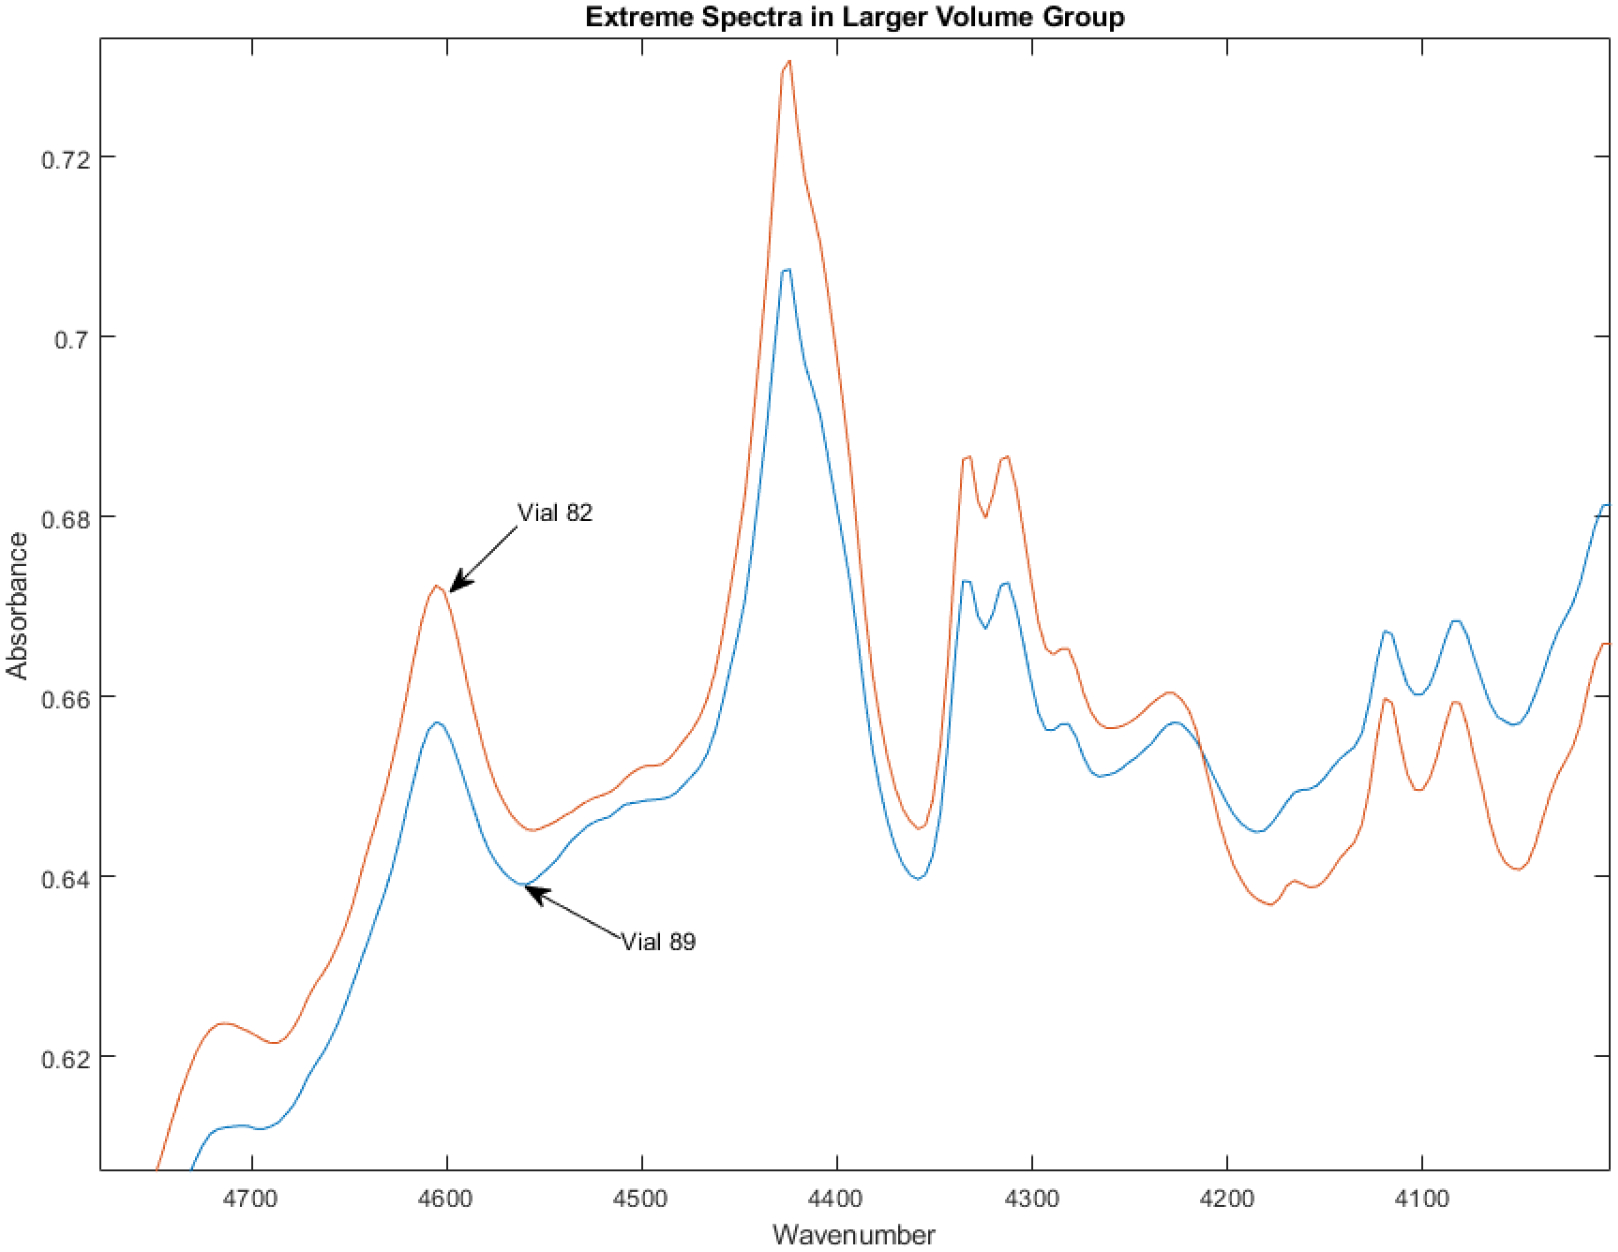
The extreme spectra from the larger group on the right of Figure 8 look similar, but there is a baseline difference as well as a small difference in peak heights near 4100, 4160, 4220, 4530, and 4720 cm−1.
Figure 10 compares a spectrum from the middle of the group of 55 vial spectra on the left of Figure 8 to the lower extreme spectra of the group of 35 vials on the right of Figure 8. The two groups look very different, with only a few shared peaks. Most of the vials in the spectral library of 90 samples (55) look like vial 11, with only 35 looking like vial 82.
Figure 10.
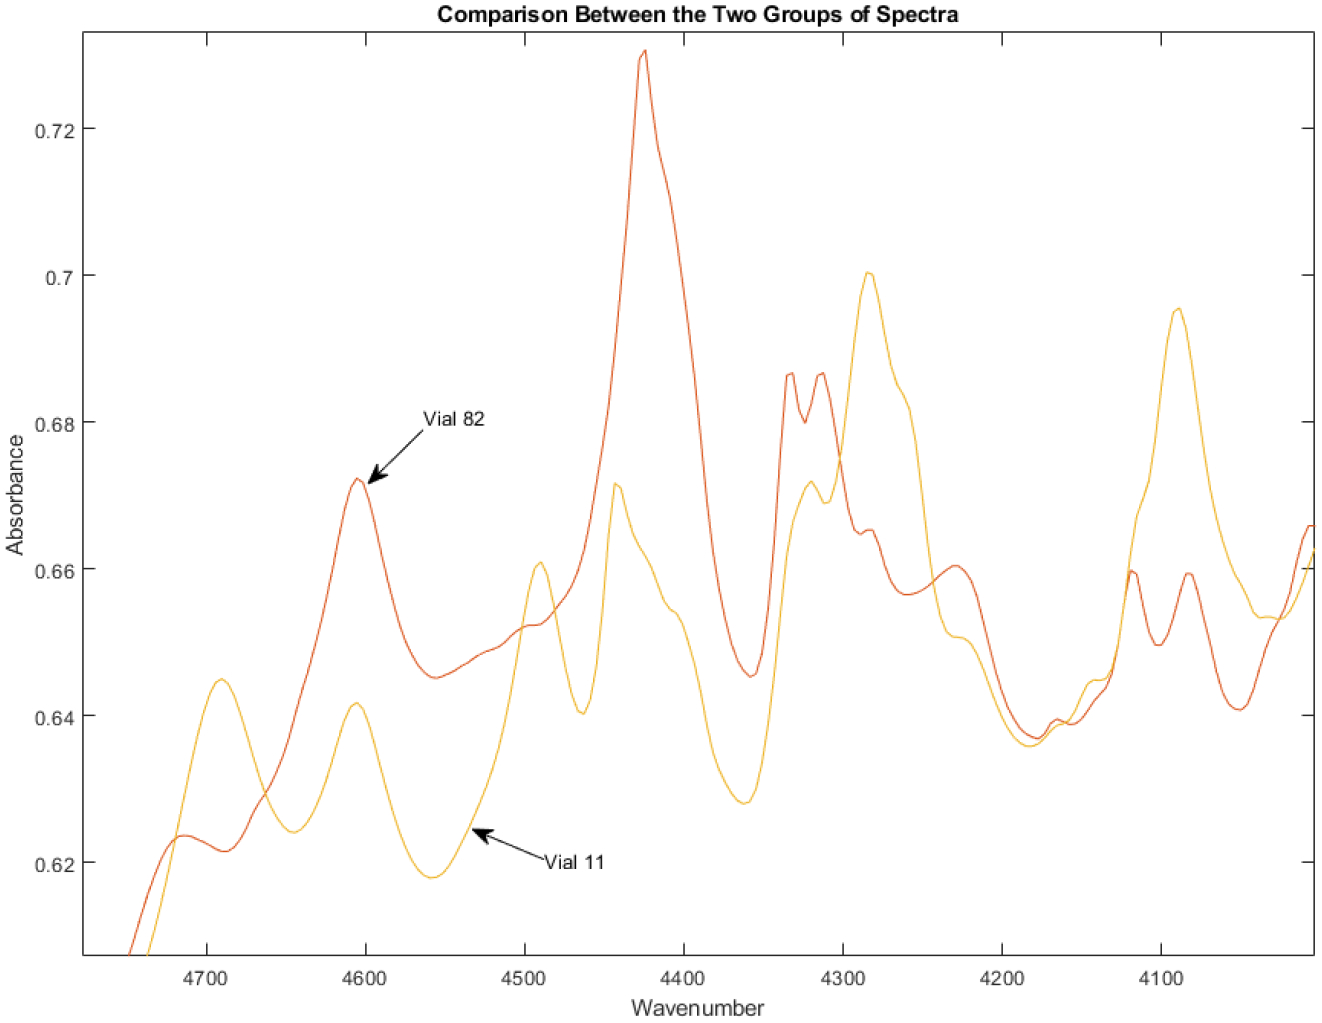
The lower extreme spectrum from the larger group on the right of Figure 8 (vial 82) looks very different from a central spectrum of the group on the left (vial 11). Most of the vials in the spectral library (55) look like vial 11, with only 35 looking like vial 82.
Figure 11 displays the spectra of vials 11 and 82 in the spectral region of 5500–6300 cm−1. Again, there are very apparent differences between the spectra of the two groups of vials in the library.
Figure 11.
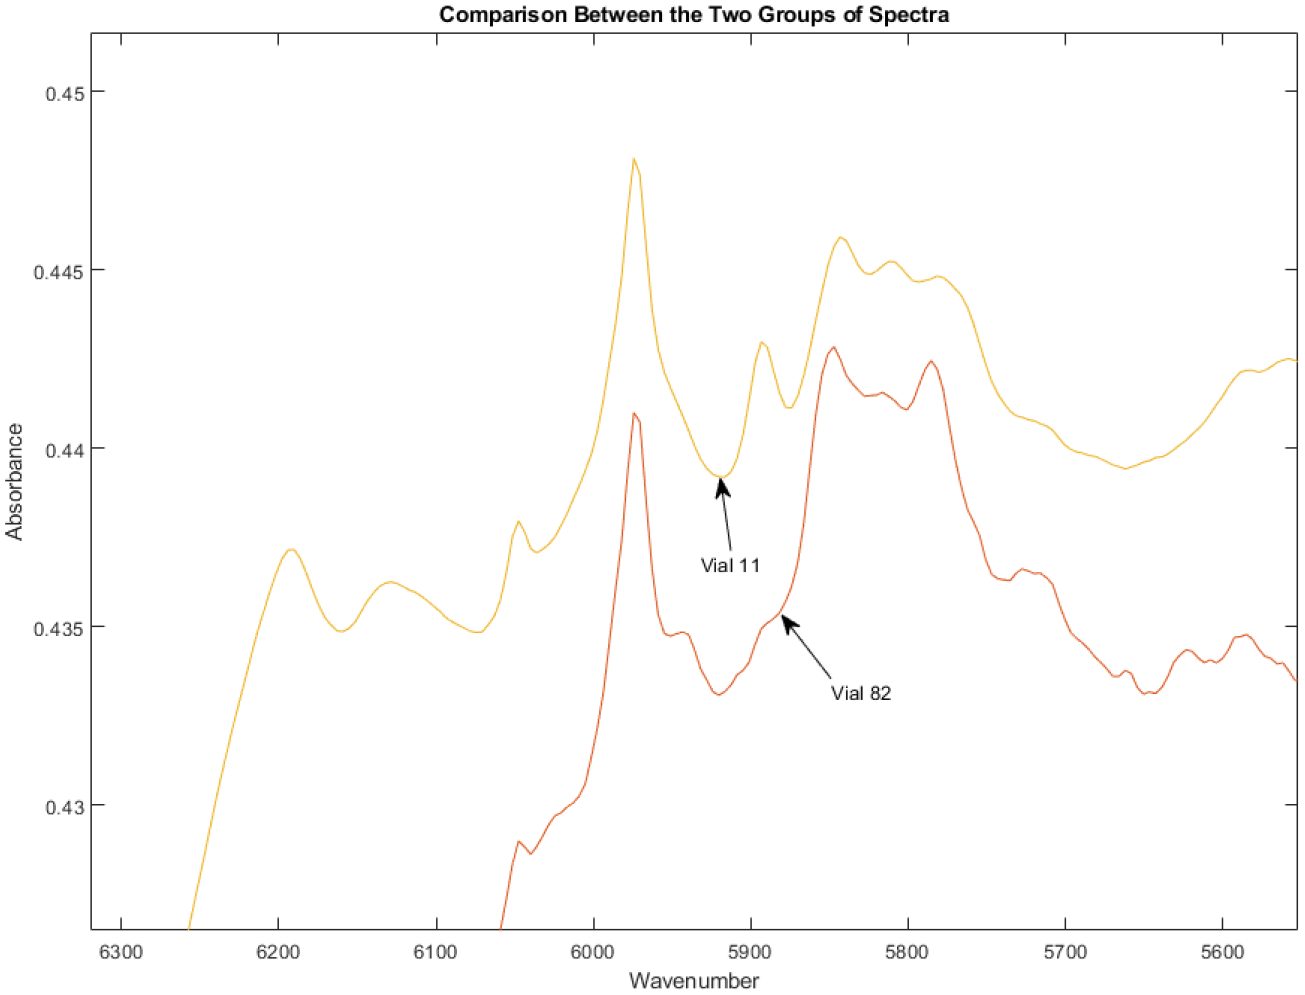
The extreme spectrum from the larger group on the right (vial 82) of Figure 8 looks very different from a central spectrum of the group on the left (vial 11).
Table 2 lists the variation accounted for by the largest principal components of the library spectra plotted in Figure 8. Figure 8 is plotted using the first 3 PCs. Plotting the scores on PCs 4, 5, and 6 (see Figure 12) does not show the two groups in the library, but does reveal a few possible outliers (vials 75, 88, 89, and 90).
Figure 12.
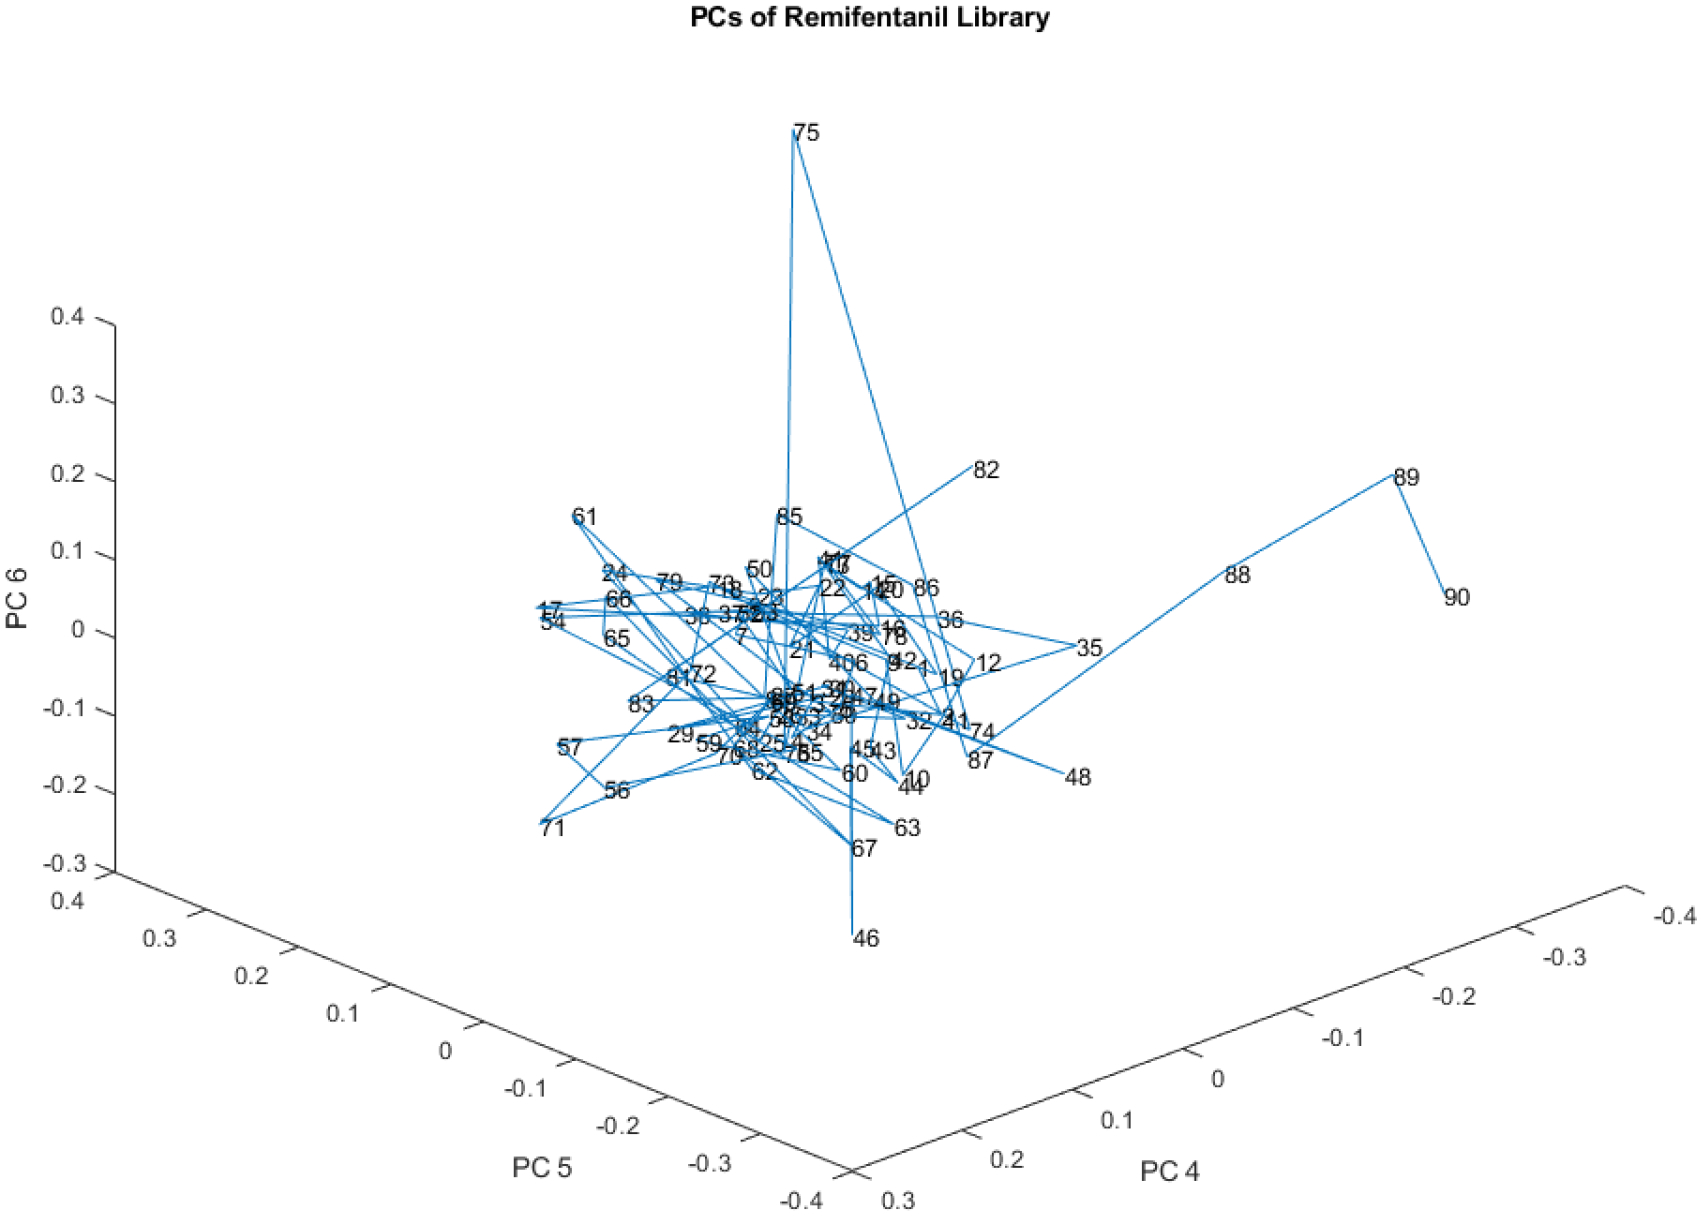
PC score plot of the spectra of the 90 vials in the remifentanil library. The two groups seen in PCs 1–3 are gone, but in these smaller PCs some apparent outliers still appear (vials 75, 88, 89, 90).
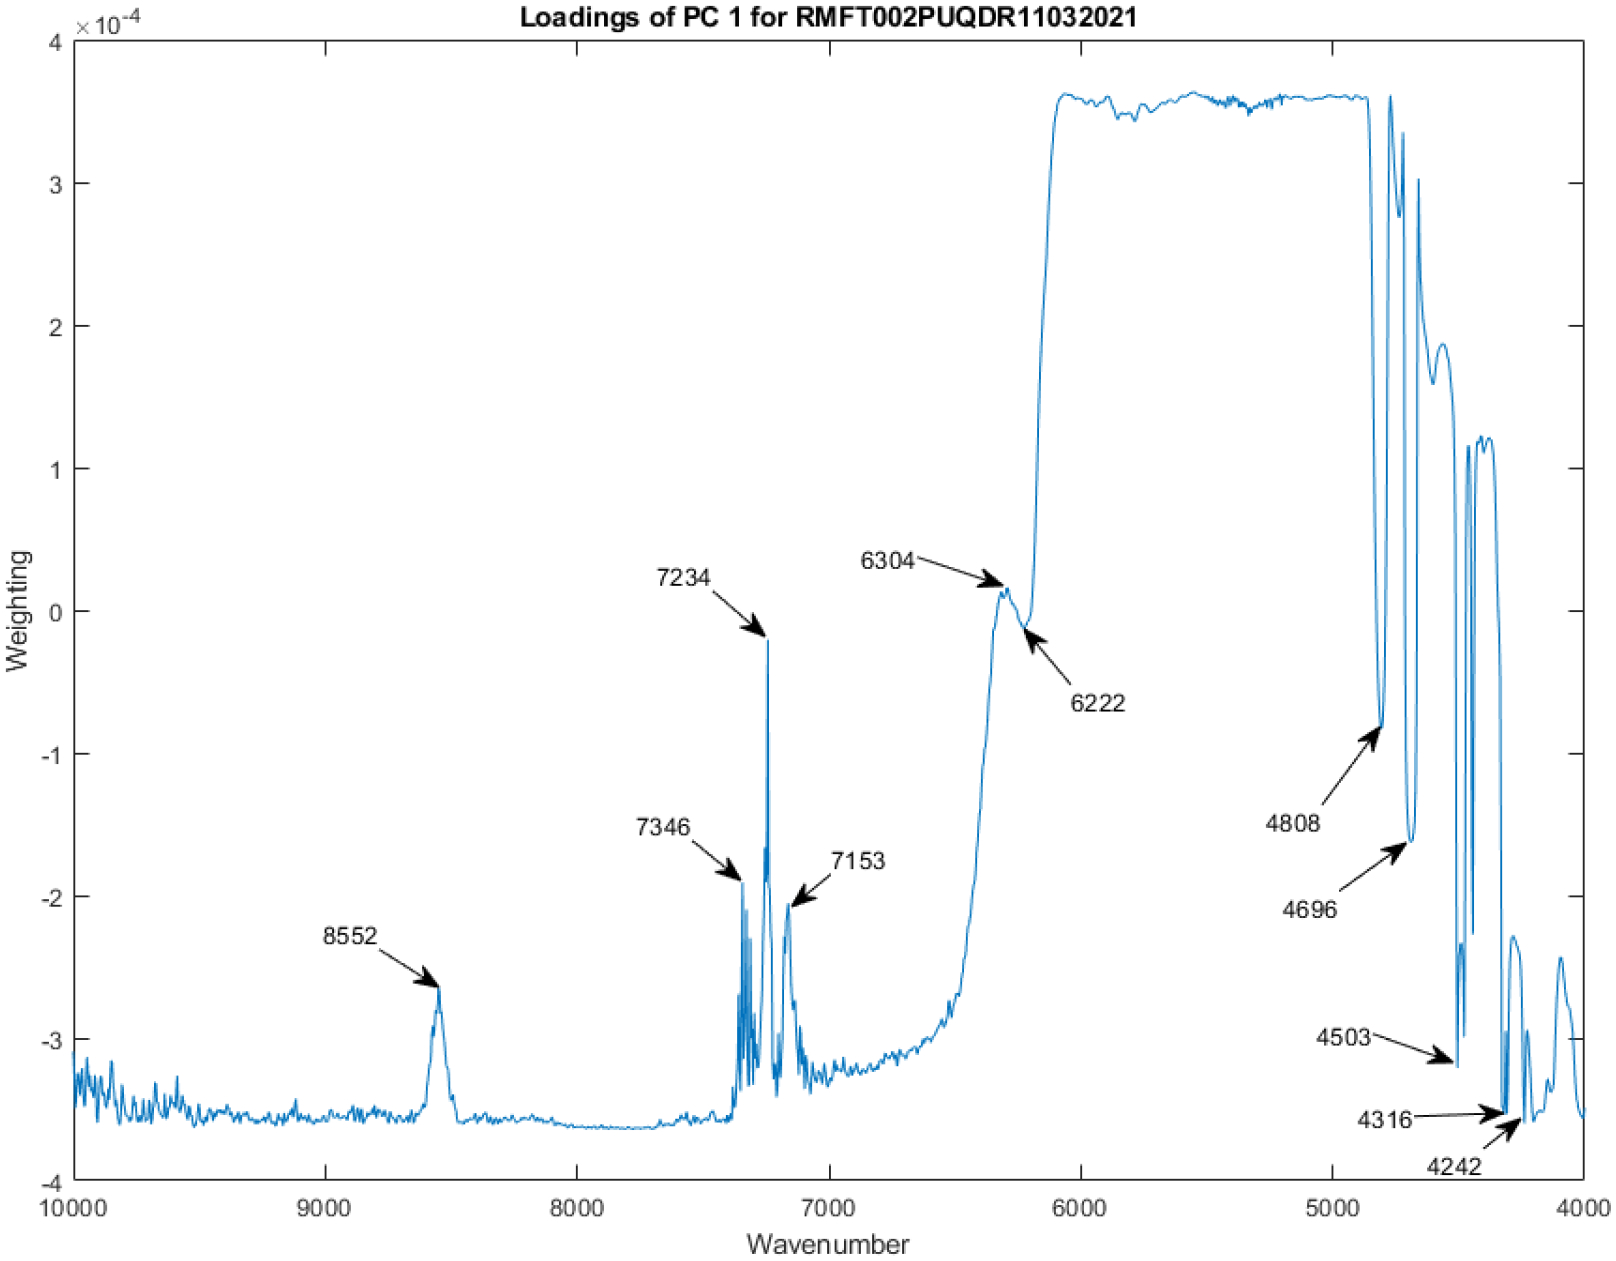
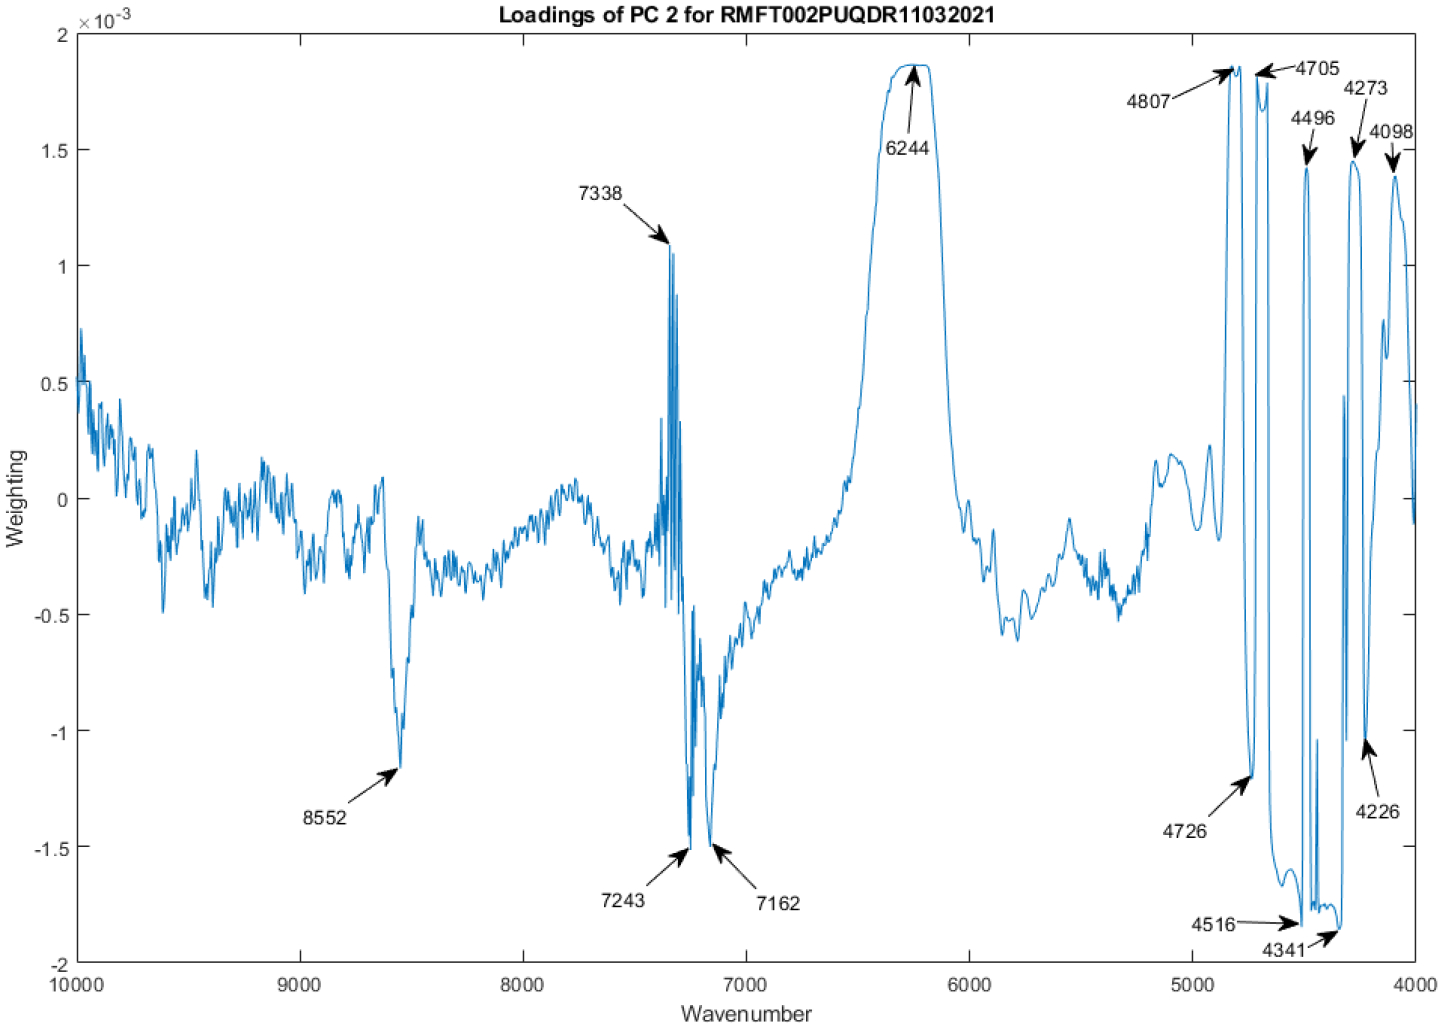
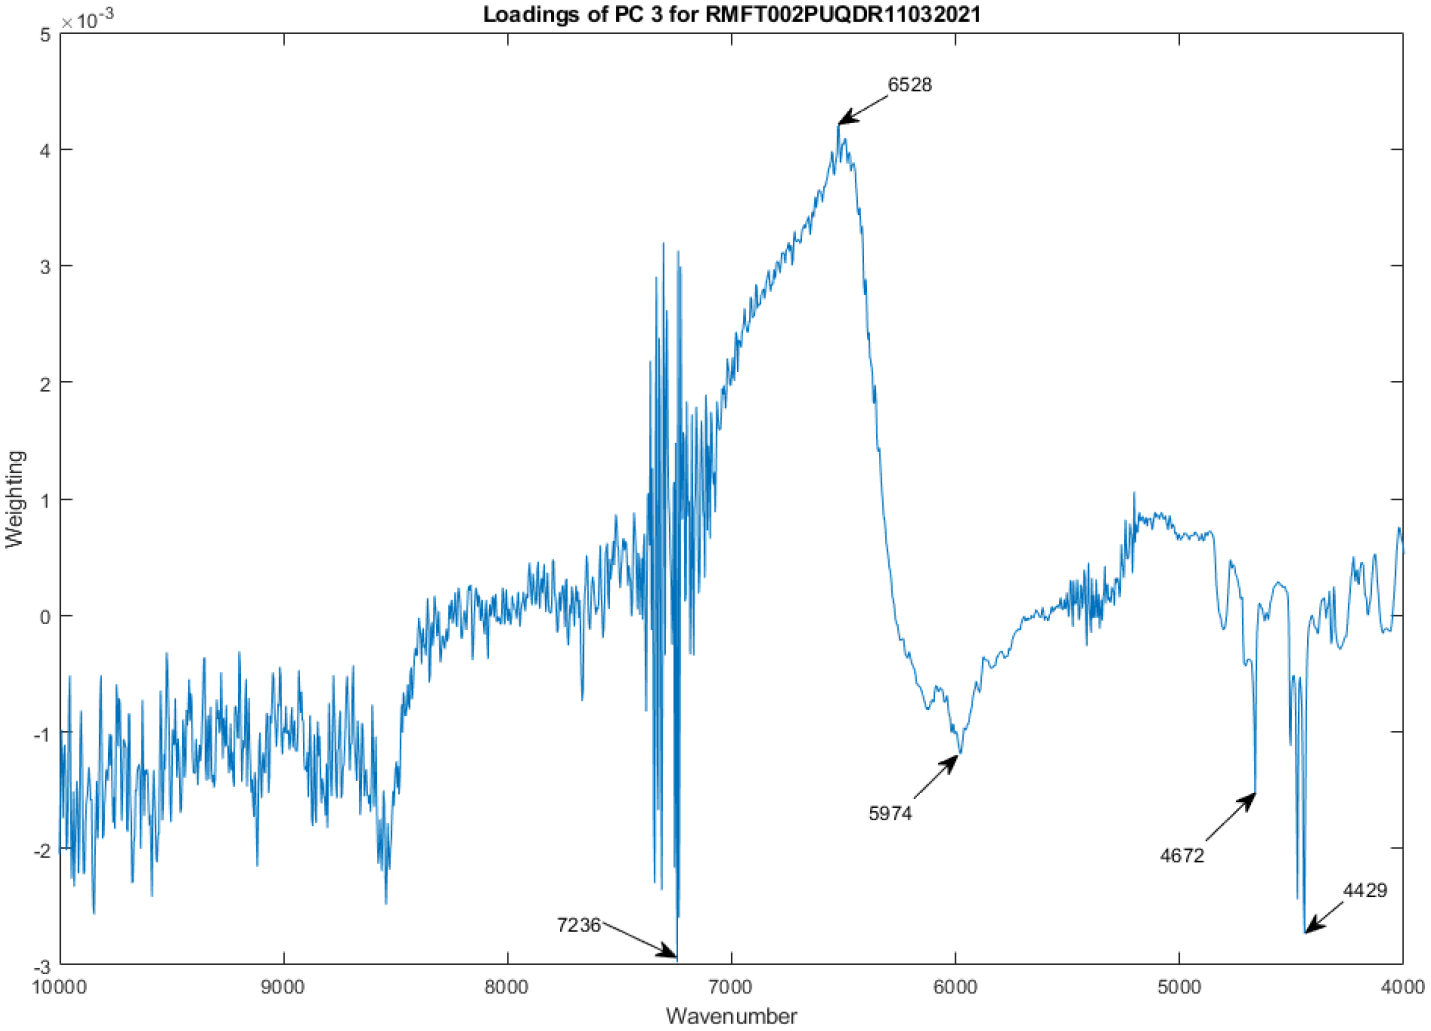
Figure 13 graphs the PC loadings spectrum for the first PC of the spectral library of 90 vials. Likewise, Figure 14 graphs PC 2, Figure 15 graphs PC 3, Figure 16 graphs PC 4, Figure 17 graphs PC 5, and Figure 18 graphs PC 6.
Figure 13.
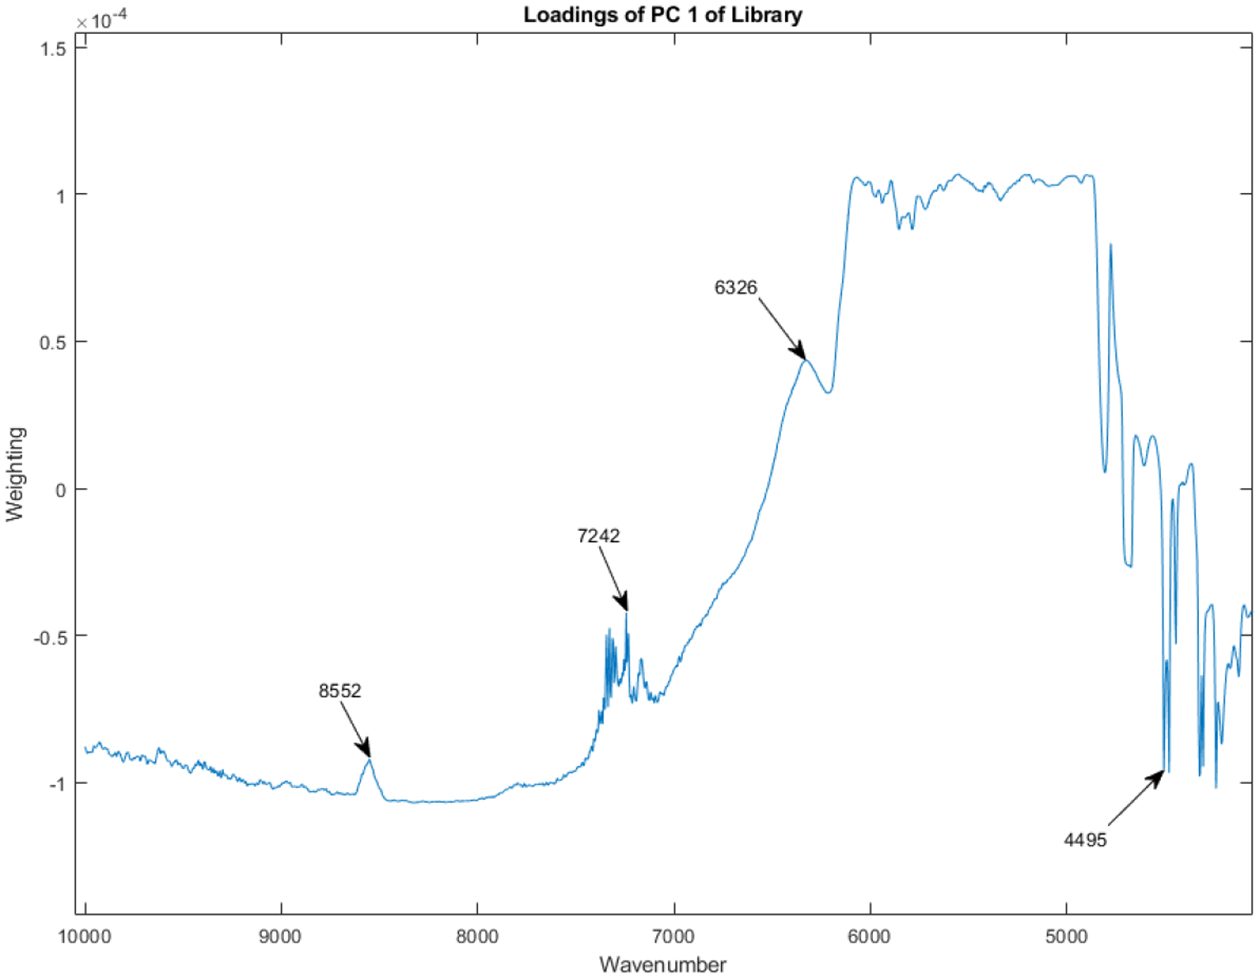
PC loadings spectrum for PC 1 of the remifentanil library. Like Figure 5, baseline variations are weighted most heavily in forming this principal component.
Figure 14.
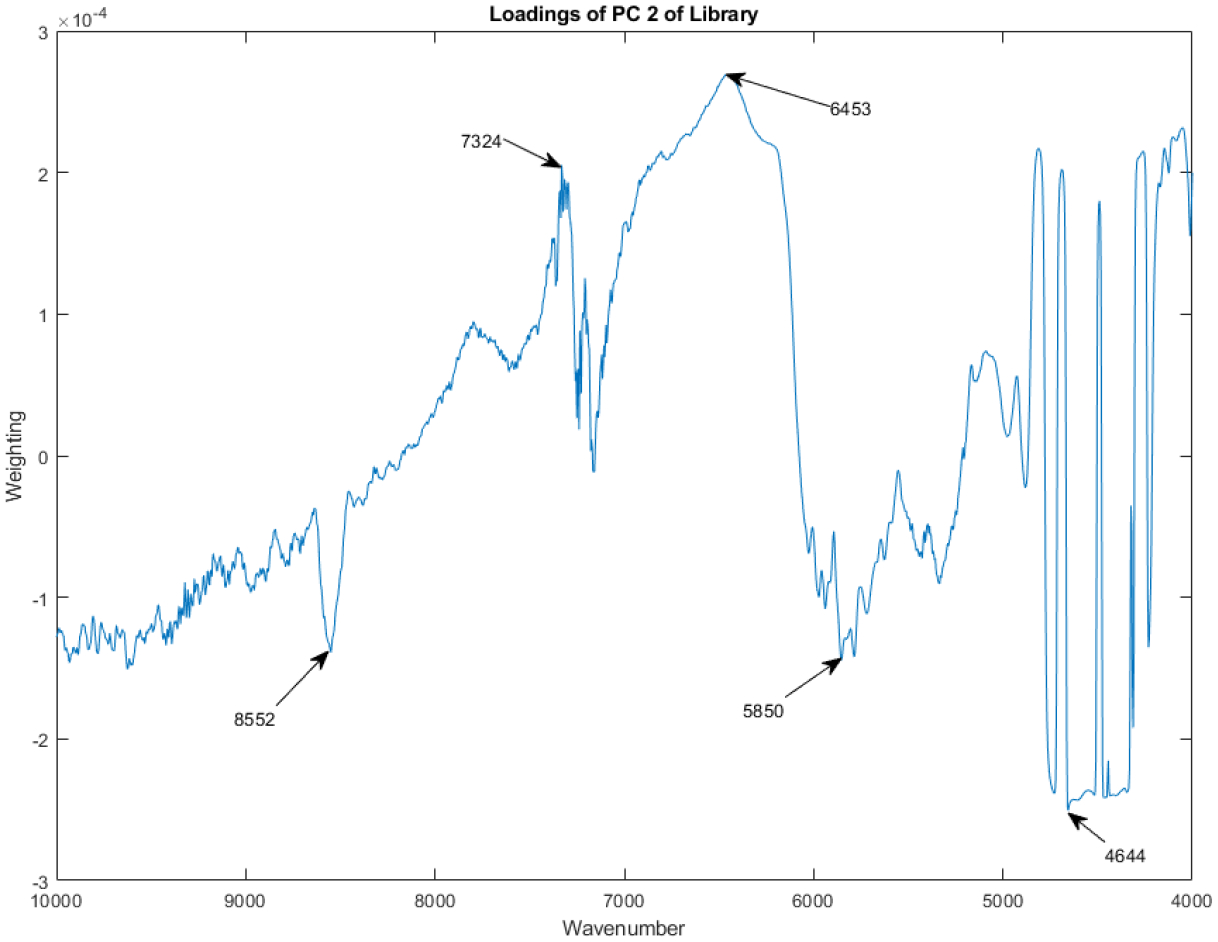
PC loadings spectrum for PC 2 of the remifentanil library. PC 2 is a major descriptor in Figure 8.
Figure 15.
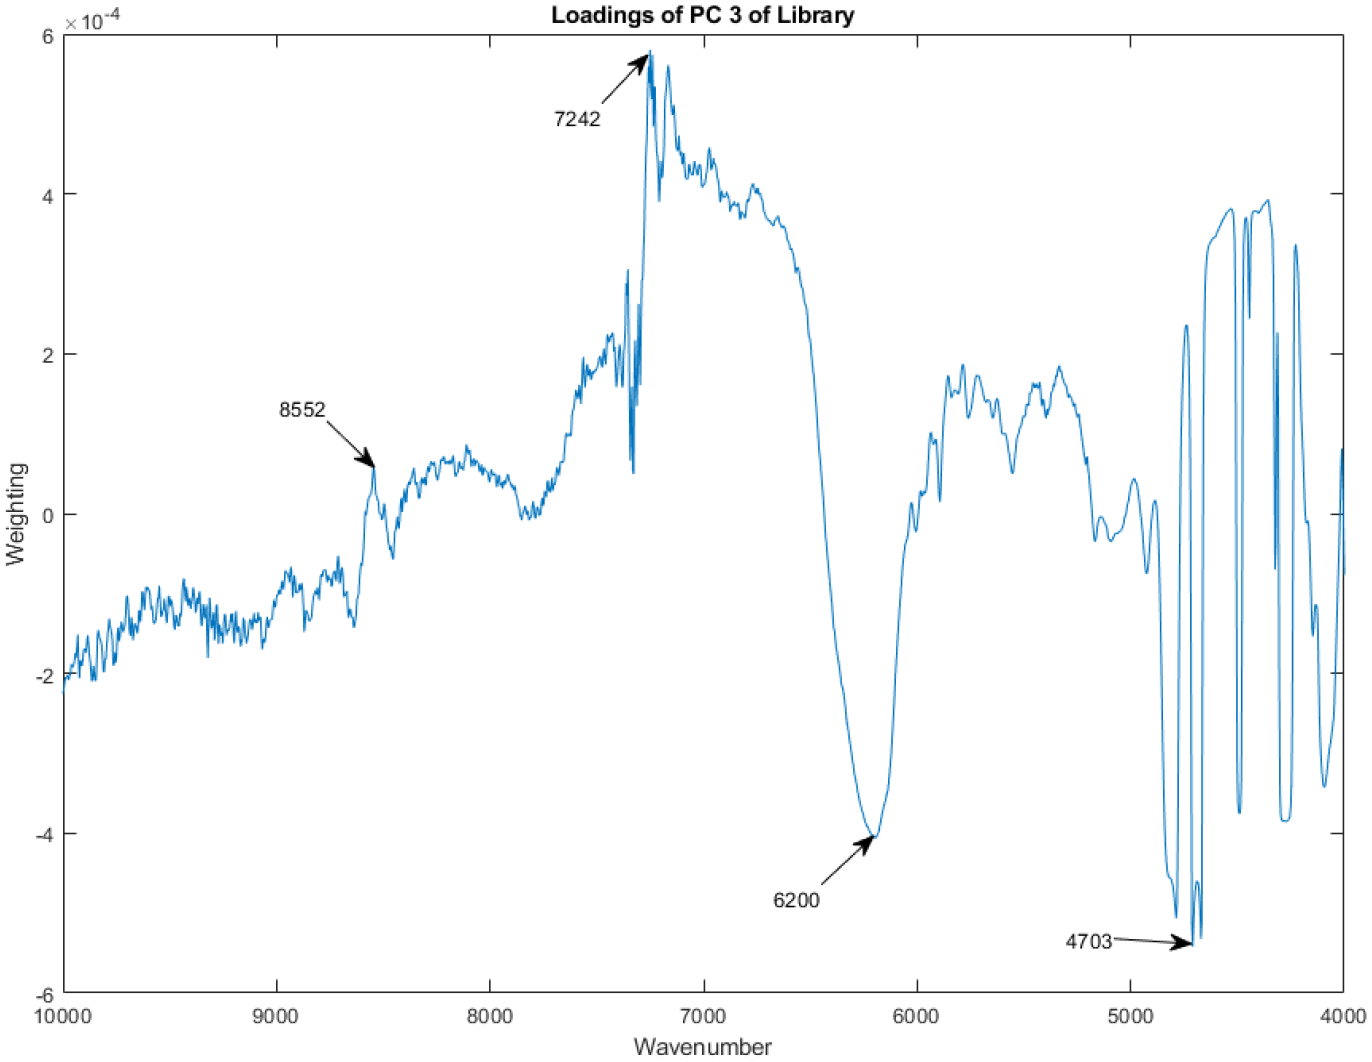
PC loadings spectrum for PC 3 of the remifentanil library. PC 3 is a major descriptor in Figure 8.
Figure 16.
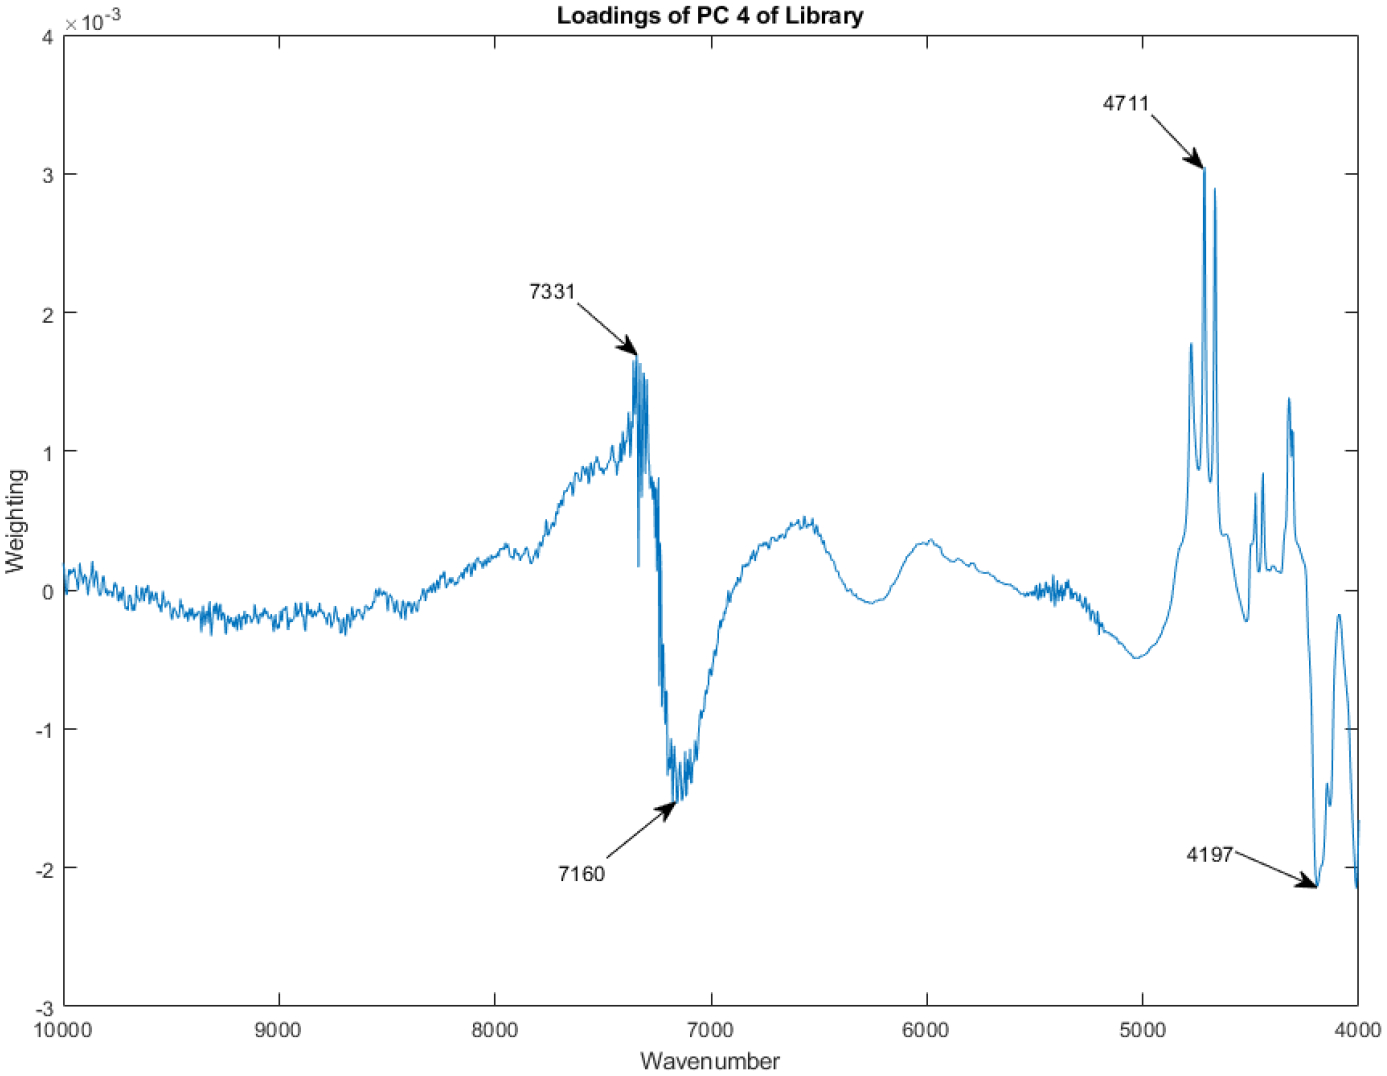
PC loadings spectrum for PC 4 of the remifentanil library. PC 4 is a major descriptor in Figure 12.
Figure 17.
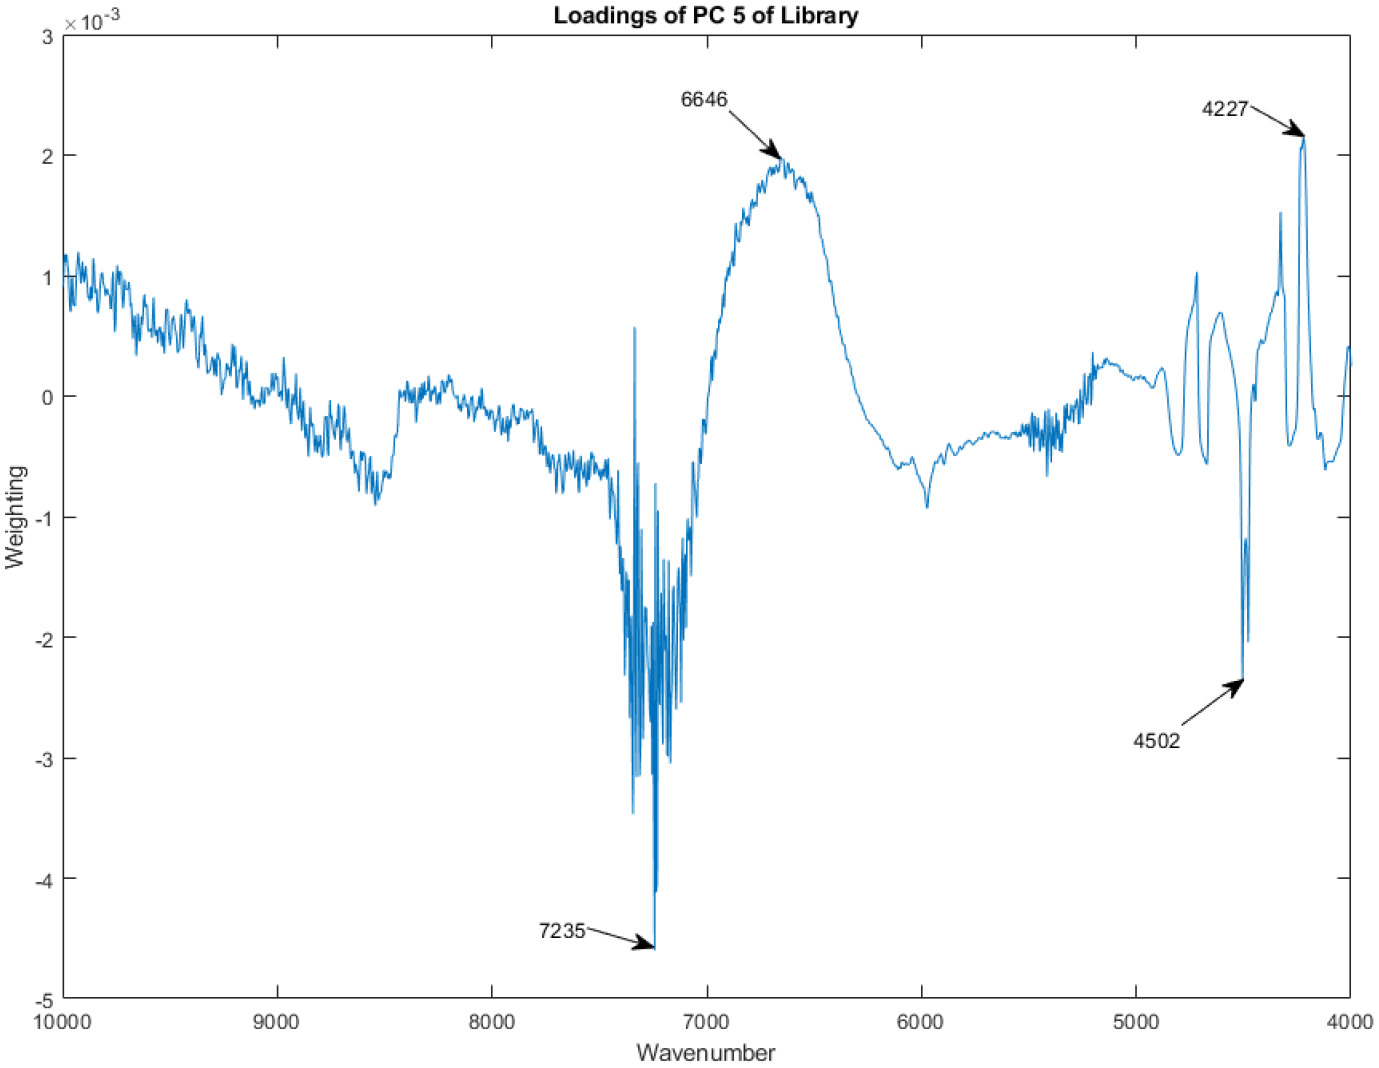
PC loadings spectrum for PC 5 of the remifentanil library. PC 5 is a major descriptor in Figure 12.
Figure 18.
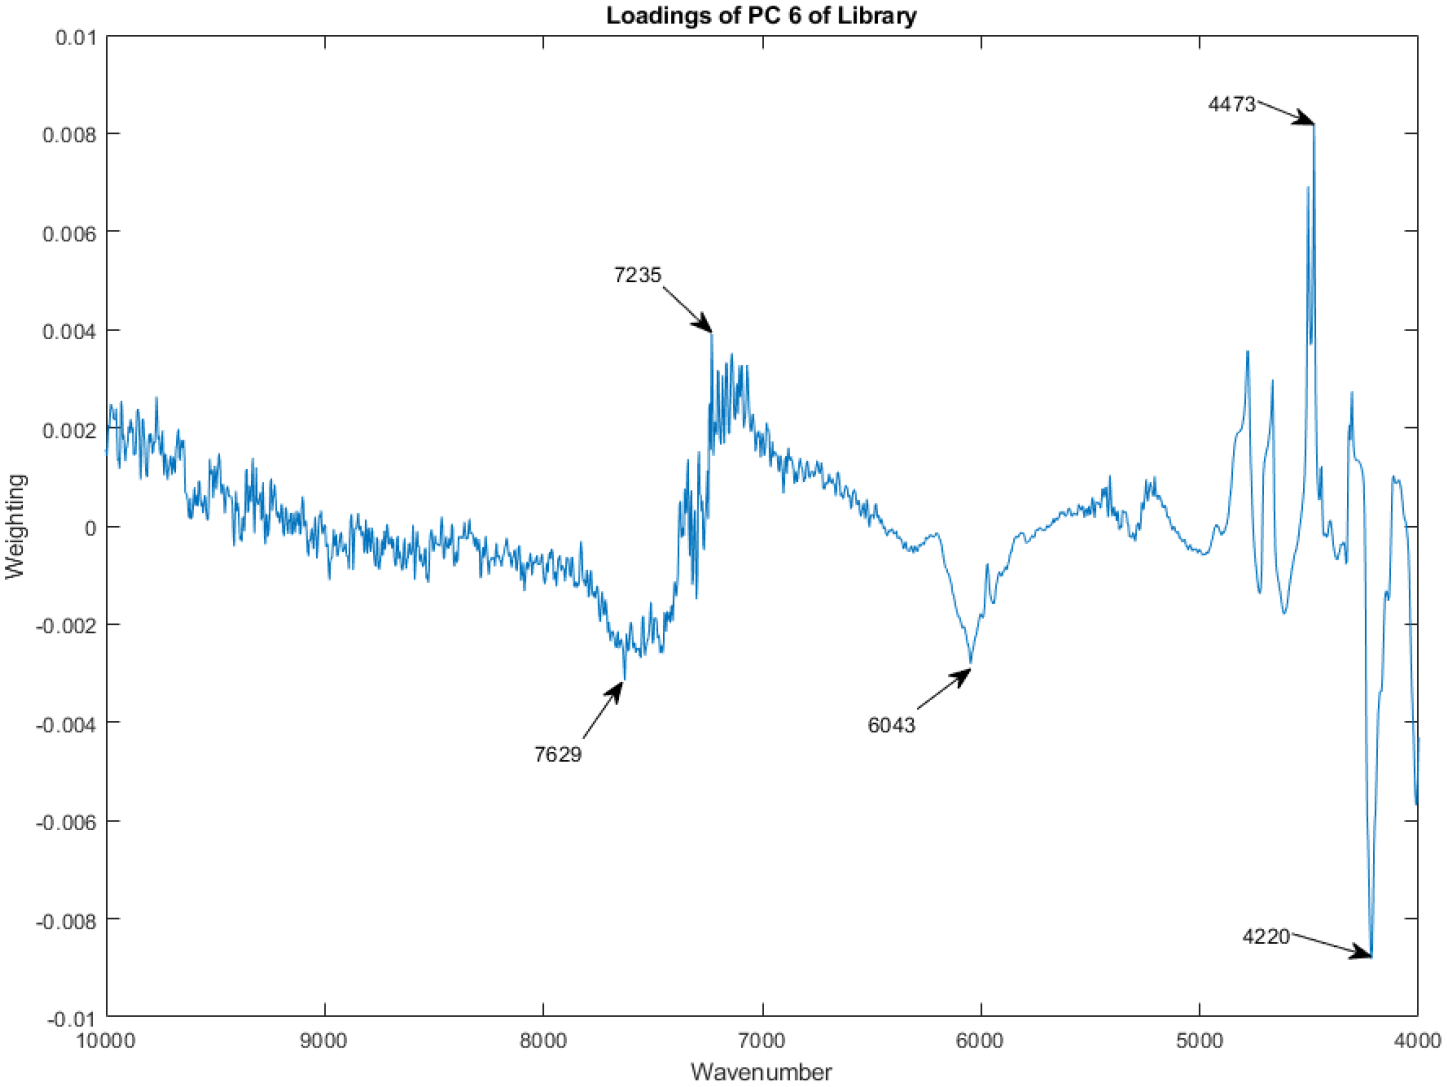
PC loadings spectrum for PC 6 of the remifentanil library. PC 6 is a major descriptor in Figure 12.
Figure 19 is a QQ plot from the subcluster detection test on the 90 vials in the spectral library of remifentanil. The two groups of spectra are sufficiently different to suggest that there might have been a formulation change in ULTIVA®. However, in a private communication to Viatris Medical Information from DQS inquiring about the difference between spectra of the lots, the company responded “The following statement is based on Viatris’ current knowledge at this point in time. This information is provided in good faith and does not constitute any guarantee or warranty. There have been no recent changes to Ultiva® (remifentanil hydrochloride) for Injection’s formulation.”
Figure 19.
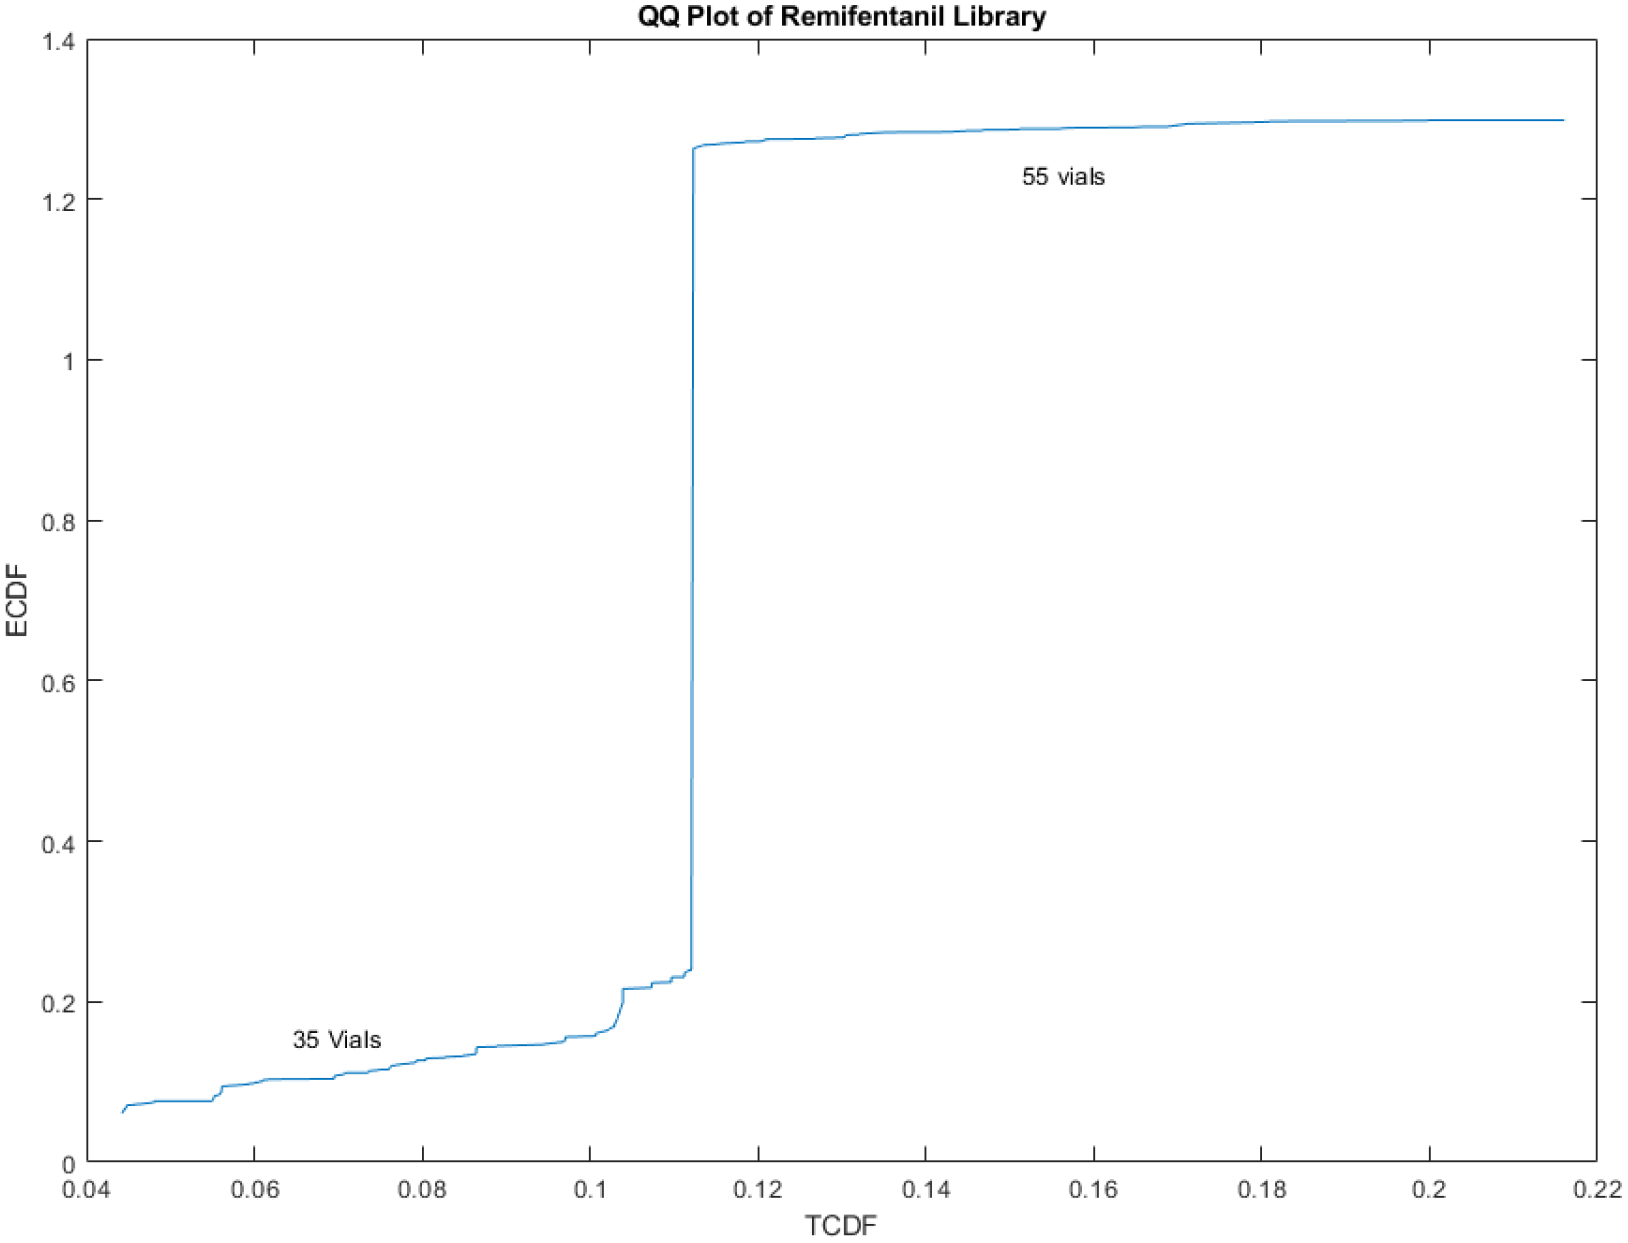
QQ plot of the spectra of the remifentanil library. The 2 groups of spectra are 50.3 SDs apart using the subcluster detection test (rtn=0.99, rtst= 0.86), suggesting that the two groups represent a different formulation or material.
Conclusions
Remifentanil hydrochloride is a sterile, nonpyrogenic, preservative-free, white to off-white lyophilized powder for intravenous (IV) administration after reconstitution and dilution. Each vial contains 1, 2, or 5 mg of remifentanil base; 15 mg glycine; and hydrochloric acid to buffer the solutions to a nominal pH of 3 after reconstitution. Remifentanil hydrochloride is a μ-opioid agonist with rapid onset and peak effect, and short duration of action.
Intra-lot and inter-lot variability in the spectra of ULTIVA® was measured in the Drug Quality Study (DQS) using Fourier transform near-infrared spectrometry (FTNIR). In 6 vials sampled, 1 came from lot 220453F while 5 came from lot 30020BF. The 1 vial sampled from lot 220453F appeared 122 multidimensional SDs from the other vials from lot 30020BF, suggesting that it represents a different formulation or material. Consequently, additional spectra from other lots were analyzed.
Spectra of 90 vials from 9 lots in the spectral library contained 35 vials that were outside the main group of 55 vials (50.3 SDs using a subcluster detection test, rtn=0.99, rtst= 0.86), suggesting that the 35 library vials (39% of the total) contain different materials from the other 55 vials.
Quality control is important in drug manufacturing. Good drugs lead to good patient outcomes. Remifentanil hydrochloride is potent and patients in whom it is used must be carefully monitored. For this reason content uniformity is important. These FTNIR results do not prove an excess level of impurities or adulteration. However, they suggest that the manufacturing process may have been operating outside of a state of process control. Additional investigation is needed.
Acknowledgements
The project described was supported in part by NSF ACI-1053575 allocation number BIO170011 and the National Center for Research Resources and the National Center for Advancing Translational Sciences, National Institutes of Health, through Grant UL1TR001998. The content is solely the responsibility of the authors and does not necessarily represent the official views of the NIH.
References
- Dempsey RJ, Davis DG, Buice RG Jr, & Lodder RA (1996). Biological and medical applications of near-infrared spectrometry. Applied Spectroscopy, 50(2), 18A–34A. [Google Scholar]
- FDA (2005). NDA 20–630/S-005. Ultiva® for Injection (remifentanil hydrochloride). https://www.accessdata.fda.gov/drugsatfda_docs/label/2004/20630se5-005_ultiva_lbl.pdf
- FDA Form 3500 Medwatch, filed Sep 14, 2022.
- GSK, 2016. Singapore. https://www.hsa.gov.sg/announcements/dear-healthcare-professional-letter/temporary-and-voluntary-hold-on-manufacturing-and-release-of-anaesthetic-medicines-ultiva-tracrium-mivacron-at-its-manufacturing-site
- Health Canada (2007). Retrieved Sep 12, 2022. https://healthycanadians.gc.ca/recall-alert-rappel-avis/hc-sc/2007/9596r-eng.php
- Isaacs JT, Almeter PJ, Henderson BS, Hunter AN, Platt TL, & Lodder RA (2022a). Potential Process Control Issues with Pemetrexed. Contact in Context, 2022. [DOI] [PMC free article] [PubMed] [Google Scholar]
- Isaacs JT, Almeter PJ, Henderson BS, Hunter AN, Platt TL, & Lodder RA (2022b). Levothyroxine Variations by Process Analytical Technology. Contact in Context, 2022. [DOI] [PMC free article] [PubMed] [Google Scholar]
- Isaksson T, & Næs T (1988). The effect of multiplicative scatter correction (MSC) and linearity improvement in NIR spectroscopy. Applied Spectroscopy, 42(7), 1273–1284. [Google Scholar]
- Jolliffe IT, & Cadima J (2016). Principal component analysis: a review and recent developments. Philosophical Transactions of the Royal Society A: Mathematical, Physical and Engineering Sciences, 374(2065), 20150202. [DOI] [PMC free article] [PubMed] [Google Scholar]
- Lodder RA, & Hieftje GM (1988). Detection of subpopulations in near-infrared reflectance analysis. Applied spectroscopy, 42(8), 1500–1512. [Google Scholar]
- Tumolo Jolynn. (2019) Recalled Narcotic API May Have Been Used in Other Drugs. Pharmacy Learning Network, https://www.hmpgloballearningnetwork.com/site/pln/content/recalled-narcotic-api-may-have-been-used-other-drugs