Figure 6.
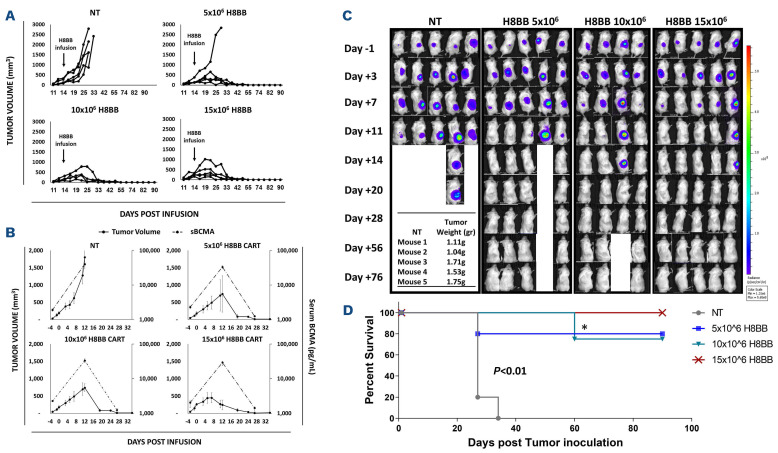
Anti-myeloma effect of H8BB CAR-T cells. (A) NSG mice (4-5 animals per group) with an average of approximately 200 mm3 subcutaneous NCI-H929 tumors per treatment group received a single intravenous (i.v.) administration of 15x106 non-transduced (NT) control cells, or 5, 10 or 15×106 H8BB-CAR+ T cells/mouse, respectively. Tumor size was measured by calipers twice weekly by personnel blinded to treatment conditions. (B) Serum B-cell maturation antigen (BCMA) protein levels assessed by enzyme-linked immunosorbant assay (grey dashed line) were plotted with corresponding tumor volume measurements (black line). Error bars show standard error of the mean (SEM). (C) Myeloma development was monitored by bioluminescence imaging (BLI). BLI measurement in photons per second per cm2 per steradian (p/s/cm2/sr) was translated to color to indicate disease activity in the mice by the legend shown. The weight of the tumors that were excised from NSG xenografts in the NT group is indicated in the table, to show that BLI reduction at this time was rather due to tumor necrosis than to a reduction in the tumor size. (D) Kaplan–Meier survival curves of study shown in (A and C); * represents NSG mouse that was found dead at day 60 post tumor inoculation, without any apparent relation to multiple myeloma.

