

Abstract
Purpose:
The number of elderly patients with head and neck squamous cell carcinoma (HNSCC) continues to grow. Management of this cohort remains poorly defined. We investigated treatment tolerability and clinical outcomes in this underrepresented population.
Methods:
We identified patients aged ≥70 with nonrecurrent, nonmetastatic HNSCC treated curatively from 2007–2018 and analyzed clinical covariates.
Results:
Two hundred and twenty patients with a median age of 75 (interquartile range:72–80) were identified. Age and comorbidities were not correlated with toxicity (P ≥ .05). Patients who experienced a treatment interruption had significantly greater weight loss (P = .042) and worse overall survival (OS) (P < .001), but not worse disease-specific survival (P = .45), or locoregional control (P = .21).
Conclusions:
Treatment interruptions were associated with weight loss and worse OS, but not disease related outcomes, suggesting an interruption in the elderly may be a surrogate for another issue. In sum, our data should guide clinical trial design to benefit this growing, neglected cohort.
Keywords: elderly, geriatric, head and neck cancer, squamous cell carcinoma, treatment tolerability
1 |. INTRODUCTION
Head and neck cancer is the sixth most common malignancy worldwide.1,2 Approximately 30% of patients are aged at least 70.3 This number of elderly patients with head and neck squamous cell carcinoma (HNSCC) will continue to grow as the population ages and life expectancy increases. In fact, between 2012 and 2016 the highest incidence rates of oral cavity and pharyngeal cancers were among those aged ≥70 years.4 Still, despite the relative frequency of HNSCC in the elderly, there is limited understanding of treatment tolerability and outcomes in this population and the elderly remain underrepresented in cancer related clinical trials,5 constituting less than 5% of enrolled participants.6,7
Due to the lack of evidence-based guidelines, there is a tendency for physicians to prescribe elderly patients’ nonstandard therapies, even at our institution.8 Elderly patients may be overtreated leading to adverse events affecting patient compliance, or undertreated, reducing survival.9–13 There are common age-related characteristics specific to the elderly, including differences in psychosocial support, functional and performance status, comorbidities, and medication management.7,14 Aging is correlated with higher rates of medical complications, including treatment interruptions.15,16 It was previously shown that increased age affects overall survival (OS), but not disease-specific survival (DSS) in elderly patients,17 and that comorbidity status independently affects survival outcomes of all HNSCC patients.18 Similarly, one retrospective study found comorbidity status was the strongest prognosticator of overall, disease free, and DSS in the elderly.19
Still, there is a paucity of data on toxicity and on local tumor control in this population, useful endpoints to guide appropriate treatment. As the incidence of HNSCC in the elderly increases, a comprehensive understanding of how this population tolerates treatment is required. Here, we sought to identify prognostic factors in this neglected cohort that influence treatment tolerability/toxicity and mediate disease and survival outcomes.
2 |. PATIENTS AND METHODS
2.1 |. Study cohort inclusion criteria
Study participants were identified from a retrospective database of HNSCC patients consecutively treated from 2007 to 2018 at our institution’s cancer center. Patients aged ≥70 with newly diagnosed, nonrecurrent, nonmetastatic, curatively treated HNSCC (oropharynx, larynx, oral cavity, nasopharynx, or hypopharynx), with a minimum follow-up of 1 month, were included in this study. Those treated for HNSCC previously or who have received prior radiation to the neck were excluded. Approval for this study was obtained from the Institutional Review Board at our institution (HS 12–00457) and informed consent was waived given the retrospective nature of the study.
2.2 |. Data processing
REDCap (Vanderbilt, NIH NIH/NCATS UL1 TR00045) electronic database20,21 was used to organize data, including cause of death, last follow-up, and recurrence. Stage was recorded in the electronic medical record as AJCC seventh edition and was restaged retroactively using AJCC eighth edition criteria, taking p16 status into account for the staging of oropharynx tumors. Hematological events during treatment and adverse events post-treatment were graded and recorded according to common terminology criteria (CTCAE v5.0).
2.3 |. Definition of variables and terminology
Alcohol status was categorized as never drinkers, light drinkers (≤1 or ≤ 2 alcoholic drinks/day for females and males respectively, or in moderation) or heavy drinkers (defined as ≥8 or ≥ 15 drinks/wk for females and males respectively).22 Smoking status was categorized as never smokers (≤100 lifetime cigarettes), former smokers (quit smoking at time of diagnosis), or current smokers (smoking at time of diagnosis). Pack-years were calculated for patients. For every patient, Charlson comorbidity index (CCI) was calculated.23
A treatment interruption was defined as prolonged (missing ≥1 unexcused radiation treatment) or premature discontinuation (receiving <90% of prescribed treatment). Excused absences included federal holidays. A treatment interruption was then subdivided as health initiated (eg, hospitalization from treatment, comorbidity, or other cause, resulting in no treatment) or non-health initiated (eg, missed appointment due to weather, transport, etc.). A treatment-related death was defined as a death during treatment due to acute toxicity while a non-treatment-related death was defined as a death during treatment due to a pre-existing comorbidity (other than the patient’s malignancy). Gastrostomy(G)-tube dependence length was calculated from treatment completion to removal, percent weight lost was calculated as the difference between weight final (Wf) and weight start (Ws) divided by weight at treatment initiation (Ws): [(Wf−Ws)/Ws * 100%], and decline in performance status was defined as a worse performance status at the end of treatment than at the start of treatment (eg, ECOG start was 1 and ECOG final was 2 indicating a decline in performance status).
Follow-up length was calculated from end of treatment to last follow-up. Data was censored at date of last follow-up or death. Follow-up survival data included: locoregional control (LRC), defined as date of treatment completion to date of last follow-up for patients with local control of the primary cancer; overall survival (OS), defined as date of treatment completion until date of last follow-up for living patients; DSS, defined as date of treatment completion to date of last follow-up for living patients or until death of something other than HNSCC.
2.4 |. Statistical analysis
Data are provided as medians with interquartile ranges (IQR). Continuous and categorical data were tested for significance using linear regression and chi-squared or Fischer’s test. Continuous and ordinal data were analyzed using the Mann-Whitney test. The correlation between parameters and weight at start and completion of radiation treatment was analyzed using a linear mixed model with fixed effect for time and random effect for patient.
The association of categorical parameters with categorical outcomes was analyzed by univariate logistic regression analysis and multinomial logistic regression for multiple outcomes. Kaplan-Meier curves for locoregional control, DSS, and overall survival were stratified by site, age, treatment interruption, ECOG, CCI, or stage. Log-rank test was used to determine significance. Cox proportional hazards models were used to generate HRs and 95% CI to estimate the associations over the follow-up period. Multivariable regression analyzes were performed to identify independent determinants. Parameters entering these models were selected based on a cut-off of P < .05. Collinearity was tested before model creation; variables were selected a priori if present.
3 |. RESULTS
3.1 |. Study cohort
3.1.1 |. Patient characteristics
Two hundred and twenty patients with HNSCC were identified with a median age of 75 (IQR: 72–80). The majority of patients were male (75%), white (60%), never/light drinkers (81%), and former or active smokers (71%). Forty-seven percent were ECOG 1 and median CCI was 6 (IQR: 5–7). Tumors were mostly of oropharynx (42%), larynx (25%), and oral cavity (21%) origin. Less common sites were hypopharynx (7%) and nasopharynx (5%). Baseline demographic and disease characteristics are outlined in Tables 1 and 2, respectively.
TABLE 1.
Demographic characteristics of elderly patients with HNSCC by primary tumor site
| Variable | Oropharynx (n = 92) | Larynx (n = 55) | Oral cavity (n = 47) | Hypopharynx (n = 15) | Nasopharynx (n = 11) | All (n = 220) | P-value |
|---|---|---|---|---|---|---|---|
| Age, years | .41 | ||||||
| Median (range) | 73 (71–77) | 76 (72–81) | 78 (74–82) | 74 (73–77) | 75 (74–75) | 75 (72–80) | |
| Sex, n (%) | <.001 | ||||||
| Male | 72 (78) | 49 (89) | 23 (49) | 13 (87) | 9 (82) | 166 (75) | |
| Female | 20 (22) | 6(11) | 24 (51) | 2(13) | 2(18) | 54 (25) | |
| Race/ethnicity, n (%) | .62 | ||||||
| White | 61 (66) | 32 (58) | 31 (66) | 6 (40) | 3 (27) | 133 (60) | |
| Black | 13 (14) | 8(15) | 3(6) | 4(27) | 1 (9) | 29 (13) | |
| Asian | 2(2) | 3 (5) | 3 (6) | 0 (0) | 0 (0) | 8 (4) | |
| Hispanic | 13 (14) | 11 (20) | 7(15) | 4(27) | 6 (55) | 41 (19) | |
| Other | 3 (3) | 1 (2) | 3 (6) | 1 (7) | 1 (9) | 9 (4) | |
| Alcohol, n (%) | .25 | ||||||
| Never/light drinker | 73 (79) | 41 (75) | 40 (85) | 11 (73) | 10 (91) | 179 (81) | |
| Former heavy drinker | 10(11) | 9 (16) | 4(9) | 1 (7) | 1 (9) | 25 (11) | |
| Current heavy drinker | 9(10) | 5 (9) | 3(6) | 3 (20) | 0 (0) | 20 (9) | |
| Smoking, n (%) | .005 | ||||||
| Never | 29 (31) | 5 (9) | 24 (51) | 2 (13) | 5 (46) | 65 (29) | |
| Former | 55 (60) | 34 (62) | 17 (36) | 8 (53) | 2(18) | 116 (53) | |
| Current | 8(9) | 16 (29) | 6 (13) | 5 (33) | 4 (36) | 39 (18) | |
| Pack years, n (%) | <.001 | ||||||
| ≤ 10 | 16 (17) | 4 (7) | 7(15) | 2 (13) | 0 (0) | 29 (13) | |
| > 10 and ≤ 20 | 9(10) | 4 (7) | 0(0) | 3 (20) | 1 (9) | 17 (8) | |
| ≥ 20 | 38 (41) | 42 (76) | 16 (34) | 8 (53) | 5 (45) | 109 (5) | |
| Performance status, n (%) | .012 | ||||||
| ECOG 0 | 38 (41) | 12 (22) | 10 (21) | 2 (13) | 7 (64) | 69 (31) | |
| ECOG 1 | 37 (40) | 28 (51) | 26 (53) | 8 (53) | 4 (36) | 104 (47) | |
| ECOG 2 | 14 (15) | 14 (26) | 10 (21) | 4(27) | 0 (0) | 40 (18) | |
| ECOG 3 | 3(3) | 1 (2) | 2 (4) | 0 (0) | 0 (0) | 6(3) | |
| ECOG 4 | 0 (0) | 0 (0) | 0 (0) | 1 (7) | 0 (0) | 1 (0) | |
| Charlson comorbidity index | .99 | ||||||
| Median (IOR) | 6(5–7) | 6(6–7) | 6 (5–7) | 6 (5.5–8.5) | 6 (5–6.25) | 6 (5–7) |
Abbreviation: IOR, interquartile range.
TABLE 2.
Disease and treatment characteristics of elderly patients with HNSCC by primary tumor site
| Variable | Oropharynx (n = 92) | Larynx (n = 55) | Oral cavity (n = 47) | Hypopharynx (n = 15) | Nasopharynx (n = 11) | All (n = 220) | P-value |
|---|---|---|---|---|---|---|---|
| Stage (eighth edition), n (%) | .005 | ||||||
| I | 23 (25) | 15 (27) | 7(15) | 0(0) | 0 (0) | 45 (21) | |
| II | 30(33) | 11 (20) | 9(19) | 0 (0) | 3(27) | 53 (24) | |
| III | 16(17) | 11 (20) | 5 (11) | 4 (27) | 2(18) | 38 (17) | |
| IVA | 12 (13) | 14 (26) | 22 (47) | 7(17) | 6 (55) | 61 (28) | |
| IVB | 11 (12) | 4(7) | 4 (8) | 4 (27) | 0 (0) | 23 (10) | |
| Treatment, n (%) | .005 | ||||||
| Surgery alone | 7(8) | 0 (0) | 12 (26) | 0 (0) | 0 (0) | 19(9) | |
| Adjuvant RT | 17(18) | 6(11) | 17 (36) | 3 (0) | 0 (0) | 40 (18) | |
| Adjuvant CRT | 7 (8) | 2 (4) | 9(19) | 0 (0) | 0 (0) | 19(9) | |
| Definitive RT | 7 (8) | 32 (58) | 4(9) | 4 (27) | 0 (0) | 47 (21) | |
| Definitive CRT−induction | 26 (28) | 13 (24) | 5(11) | 5 (33) | 8 (73) | 56 (25) | |
| Definitive CRT+induction | 28 (30) | 2 (4) | 0(0) | 6 (40) | 3 (27) | 39 (18) | |
| Treatment complications, n (%) | .012 | ||||||
| Treatment interruption | 24 (26) | 17 (31) | 13 (28) | 11 (73) | 7 (64) | 72 (33) | |
| Prolonged treatment | 15 (16) | 10(18) | 4(9) | 5 (33) | 2 (18) | 36 (16) | |
| Death on treatment | 2 (2) | 1 (2) | 2(4) | 0 (0) | 1 (9) | 6 (3) | |
| Stopped prematurely | 7 (7) | 6(11) | 7(15) | 6 (40) | 4 (4) | 30 (14) | |
| G-tube placement, n (%) | .015 | ||||||
| Prophylactic | 22 (24) | 13 (24) | 8 (17) | 8 (53) | 3 (27) | 53 (24) | |
| Reactive | 26 (28) | 5 (9) | 5 (11) | 2 (13) | 2 (18) | 40 (18) | |
| Follow-up, years | .52 | ||||||
| Median (IQR) | 2.4 (0.9–4.7) | 1.3 (0.8–3.0) | 0.8 (0.3–1.8) | 1.1 (0.5–2.8) | 1.65 (1.0–2.8) | 1.5 (0.6–3.8) |
Abbreviation: IQR, interquartile range.
With the exception of HNSCC of oral cavity, cancers displayed male predominance, with gender ratios (male: female) ranging from ~8:1 to 3.5:1 (P < .001). Smoking status varied based upon origin site, with more non-smokers in patients with oral cavity and nasopharynx tumors (51% and 46% respectively, P = .005). A larger percentage of patients with nasopharyngeal carcinoma were ECOG 0 (64%), compared to patients with cancers of other sites. A larger proportion of oral cavity (66%), hypopharynx (100%), and nasopharynx (73%) cancers were staged as advanced, whereas stage was equally distributed between larynx and oropharynx types. There was no significant difference in age, race/ethnicity, alcohol use, and CCI across disease sites (P ≥ .05).
3.1.2 |. Treatment characteristics
A total of 78 patients underwent surgical intervention. Of those, 76% were treated with adjuvant RT. Of the 220 patients, 52% received concurrent chemotherapy (18% carboplatin, 37% cisplatin, 16% cetuximab, 29% dual-therapy). Sixty-five percent of patients underwent definitive RT. Of those receiving definitive CRT (43%), 41% (n = 18) also received induction chemotherapy. Induction chemotherapy was typically 3 cycles of docetaxel, cisplatin, and 5-fluorouracil (TPF). Treatment significantly differed by tumor site (P = .005) and stage (P = .001, not shown). The median radiation dose was 70 Gy (IQR: 63–70) for definitive RT and 60 Gy (IQR:60–66) for adjuvant RT. Treatment characteristics are outlined in Table 2.
3.1.3 |. Risk factors associated with tolerance and toxicity
Hematologic grade 3 or 4 toxicities occurred in 13% of patients during RT (5% anemia, 5% leukopenia, 5% neutropenia, or 1% thrombocytopenia) with no difference among site (P = .48, not shown). There was a significantly increased association among those who received induction chemotherapy (OR: 3.69 [95% CI: 1.53–8.93], P = .004, not shown) or concurrent chemotherapy (OR: 3.70 [95% CI: 1.34–10.62], P = .012, not shown), with more chance of occurrences of hematological toxicities. Acute (0–3 month) grade 3 or 4 mucositis, dysphagia, odynophagia, xerostomia, and dermatitis occurred in 28%, 50%, 38%, 16%, and 10% of patients receiving RT, respectively. Subacute grade 3 mucositis, dysphagia, odynophagia, and xerostomia occurred in 1%, 20%, 4%, and 4%, respectively. Twelve patients experienced a chronic grade 3 toxicity. Before or during treatment, 42% of patients had gastrostomy tubes inserted for nutritional support (24% prophylactic and 18% reactive) with 0.82 years (IQR:0.35–1.5) as a median time of dependence. Eleven percent of patients experienced a decline in performance status during treatment, with no differences among tumor sites (P = .21). Thirty-three percent of patients experienced a treatment interruption (16% prolonged treatment, 14% premature discontinuation, 3% death on treatment) with a significant difference observed by tumor site (P = .012). Five deaths during treatment were non-treatment related deaths due to patients’ pre-existing health conditions (eg, congestive heart failure) while one death was due to aspiration pneumonia in a patient with dementia being treated with CRT. Of non-fatal treatment interruptions, 59% (n = 39) were non-health initiated and 41% (n = 27) were health initiated (Table 2).
3.1.4 |. Risk factors associated with toxicity
By univariate and multivariable logistic regression analyzes, treatment was the only variable associated with grade 3/4 mucositis, dysphagia, and odynophagia. Definitive CRT (with and without induction) and adjuvant CRT had higher odds of grade 3/4 mucositis and odynophagia. By multivariate analysis, all treatment types had greater odds of experiencing grade 3/4 dysphagia compared to RT alone (Table 3). Treatment was not associated with grade 3/4 xerostomia or dermatitis (Table S1).
TABLE 3.
Associations between clinical, disease, and treatment characteristics with mucositis, dysphagia, and odynophagia in elderly patients with HNSCC in univariate and multivariate logistic model
| Mucositis |
Dysphagia |
Odynophagia |
||||||||||||||||
|---|---|---|---|---|---|---|---|---|---|---|---|---|---|---|---|---|---|---|
| Univariate |
Multivariate |
Univariate |
Multivariate |
Univariate |
Multivariate |
|||||||||||||
| Predictor | Odds ratio | 95% CI | P-value | Odds ratio | 95% CI | P-value | Odds ratio | 95% CI | P-value | Odds ratio | 95% CI | P-value | Odds ratio | 95% CI | P-value | Odds ratio | 95% CI | P-value |
| Primary site | ||||||||||||||||||
| Oropharynx | Ref | Ref | Ref | Ref | Ref | Ref | ||||||||||||
| Hypopharynx | 0.5 | 0.13–1.61 | .27 | 0.4 | 0.099–1.62 | .2 | 1.59 | 0.5–5.56 | .44 | 1.48 | 0.34–6.42 | .6 | 2 | 0.61–7.78 | .27 | 1.64 | 0.42–6.36 | .47 |
| Larynx | 0.14 | 0.046–0.37 | <.001 | 0.31 | 0.089–1.06 | .061 | 0.32 | 0.15–0.66 | .003 | 0.64 | 0.23–1.77 | .39 | 0.32 | 0.15–0.65 | .002 | 0.57 | 0.23–1.43 | .23 |
| Oral cavity | 0.52 | 0.21–1.22 | .15 | 1.49 | 0.4–5.47 | .55 | 0.51 | 0.22–1.15 | .11 | 0.49 | 0.16–1.43 | .19 | 0.59 | 0.26–1.33 | .2 | 1.32 | 0.47–3.71 | .6 |
| Nasopharynx | 0.92 | 0.22–3.48 | .91 | 0.57 | 0.14–2.32 | .44 | 1.33 | 0.32–5.52 | .68 | 0.83 | 0.22–3.67 | .88 | 1.2 | 0.32–4.5 | .8 | 0.88 | 0.22–3.61 | .86 |
| Age | ||||||||||||||||||
| 70–80 | Ref | Ref | Ref | |||||||||||||||
| ≥ 80 | 0.55 | 0.23–1.2 | .15 | 0.67 | 0.32–1.3 | .24 | 1.03 | 0.52–2.03 | .93 | |||||||||
| Performance status | ||||||||||||||||||
| ECOG 0 | Ref | Ref | Ref | |||||||||||||||
| ECOG 1 | 2.28 | 1.07–5.17 | .04 | 1.73 | 0.87–3.51 | .12 | 1.27 | 0.65–2.5 | .5 | |||||||||
| ECOG 2/3 | 1.9 | 0.44–3.14 | .7 | 2.2 | 0.97–5.11 | .06 | 1.35 | 0.6–3.05 | .47 | |||||||||
| Comorbidity Index | ||||||||||||||||||
| CCI 5 or 6 | Ref | Ref | Ref | |||||||||||||||
| CCI ≥7 | 0.681 | 0.345–1.344 | .2679 | 0.74 | 0.403–1.36 | .33 | 0.72 | 0.39–1.31 | .28 | |||||||||
| AJCC eighth edition state | ||||||||||||||||||
| Stage I/II | Ref | Ref | Ref | Ref | Ref | |||||||||||||
| Stage III/IV | 3.8 | 1.42–13.41 | .01 | 1.01 | 0.41–2.52 | .98 | 2.3 | 1.04–5.2 | .04 | 2.0 | 0.91–4.55 | .084 | 1.92 | 0.91–4.24 | .1 | |||
| Treatment | ||||||||||||||||||
| Definitive RT | Ref | Ref | Ref | Ref | Ref | |||||||||||||
| Definitive CRT−induction chemo | 14.5 | 3.18–66.5 | <.001 | 9.1 | 1.7–48.923 | .01 | 12.4 | 3.87–39.7 | <.001 | 8.09 | 2.19–29.89 | .002 | 3.41 | 1.42–8.17 | .006 | 2.65 | 0.99–7.1 | .05 |
| Definitive CRT+induction chemo | 25 | 5.32–117 | <.001 | 14.9 | 2.4–93.502 | .004 | 19.7 | 5.8–67.1 | <.001 | 10.2 | 2.32–44.85 | .002 | 9.71 | 3.53–26.7 | <.001 | 6.71 | 2.08–21.68 | .002 |
| Adjuvant RT | 1.11 | 0.15–8.3 | .92 | 0.45 | 0.053–3.805 | .46 | 4.75 | 1.39–16.2 | .013 | 4.3 | 1.09–16.81 | .038 | 0.62 | 0.21–1.8 | .38 | 0.42 | 0.12–1.43 | .16 |
| Adjuvant CRT | 18.2 | 3.3–100.6 | <.001 | 7.57 | 1.16–49.396 | .034 | 13.6 | 3.31–55.7 | <.001 | 1.01 | 2.22–52.84 | .003 | 6.76 | 1.94–23.6 | .003 | 4.6 | 1.16–18.19 | .03 |
Tumor origin site was a predictor of grade 3/4 mucositis, dysphagia, odynophagia, xerostomia, and dermatitis in univariate models. Specifically, patients with primary larynx tumors had a significant lower odds of experiencing grade 3/4 mucositis, dysphagia, and odynophagia when compared to oropharynx in univariate model (mucositis: OR: 0.14 [95% CI: 0.05–0.37], P < .001; dysphagia OR: 0.32, [95% CI: 0.15–0.66], P = .003; odynophagia OR: 0.32, [95% CI: 0.15–0.65], P = .002). Larynx tumors were associated with a lower odds (OR: 0.23 [95% CI: 0.03–0.87], P = .04) and hypopharynx was associated with a greater odds (OR: 4.31, [95% CI: 1.23–14.8], P = .02) of experiencing grade 3/4 xerostomia. Hypopharynx trended toward being associated with a higher odds of grade 3/4 dermatitis (OR: 4.23 [95% CI: 0.97–16.85], P = .051). Advanced stage was associated with more occurrences of grade 3/4 mucositis, dysphagia, and xerostomia in univariate analysis, but lost significance in multivariate analysis (Table 3, Table S1). However, none of the tumor sites remained significantly associated with toxicities in the adjusted multivariate model. Age and comorbidities were not correlated with toxicity by either univariate or multivariate analysis. Odds ratios for toxicity are outlined in Tables 3 and S1.
3.1.5 |. Risk factors associated with treatment interruption and G-tubes
By both univariate and multivariable analysis, advanced stage and treatment type were associated with treatment interruption. Advanced stage had significantly higher odds of treatment interruption compared to Stage I/II (OR: 2.64 [95% CI: 1.29–5.41], P = .008). Definitive CRT with induction was associated with greater odds of treatment interruptions (OR: 2.99 [95% CI: 1.03–8.63], P = .044). In terms of tumor site, hypopharynx was significantly associated with treatment interruption (OR: 5.6 [95% CI: 1.7–21.6], P = .006), whereas patients with nasopharynx tumors trended toward higher odds of treatment interruptions in univariate analysis only (OR: 3.56 [95% CI: 0.90–14.5], P = .057) (Table S2). Patients experiencing grade 3/4 mucositis, dysphagia, odynophagia, and xerostomia had a significant higher odds of having experienced treatment interruption (OR: 3.41 [95% CI: 1.78–6.54], P < .001; OR: 3.28 [95% CI: 1.77–6.10], P < .001; OR: 3.98 [95% CI: 2.11–7.51], P < .001; OR: 2.47 [95% CI: 1.14–5.34], P = .022; not shown).
Treatment was both a predictor for prophylactic and reactive G-tube placement. By univariate regression analysis, patients receiving definitive and adjuvant CRT had greater odds of receiving a prophylactic or reactive G-tube placed as compared to those with definitive RT, while adjuvant RT was associated with prophylactic G-tube placement only (Table S3). For those patients that received a G-tube (n = 93), there was a significant difference in G-tube dependence length by treatment type (P = .003). Patients receiving adjuvant RT had a lower G-tube dependence length (adjuvant RT: 0.61 and adjuvant CRT: 0.50 years) compared to those receiving definitive RT (definitive RT: 0.98, definitive CRT-induction 0.93, definitive CRT+induction: 0.90 years). G-tube dependence length did not vary by primary tumor site, age, performance statue, comorbidity status, or treatment interruption (Table S4).
3.1.6 |. Risk factors associated with weight loss
Average percent weight loss during radiation treatment was 7.3% (±6.2%) for all patients, though no differences were observed by primary tumor site, performance status, stage, comorbidity status, or age. Percent weight loss did, however, significantly vary by treatment, G-tube status, and treatment interruptions. Patients who underwent chemotherapy (CRT–induction: 10.0 ± 5.9%; CRT +induction: 7.8 ± 5.5%; adjuvant CRT: 8.1 ± 6.94) had a greater decrease in weight (P = .002) compared to those who did not receive chemotherapy (definitive RT: 4.21 ± 3.7%; adjuvant RT: 6.49 ± 7.3%). Patients with a reactive G-tube placement showed greater weight loss (10.2 ± 5.3%; P = .018) compared to either those with prophylactic G-tube placement (5.9 ± 7.2%) or those without a G-tube (7.1 ± 5.5). Treatment interruption was also associated with weight loss—patients with a treatment interruption experienced a greater percent change in weight compared to those with continued treatment (8.93 ± 6.9% vs 6.6 ± 5.7%).
Of note, by random effects modeling, the relationship between treatment interruption and weight loss remained significant (Estimate: −6.42, [95% CI: −12.39, −0.46], P = .042). All other predictors failed to show a statistical difference (Table S5).
3.2 |. Survival analyzes
The median time to follow-up was 1.5 years (0.6–3.8). Of the 220 patients, 147 had no evidence of disease at their last follow-up, 26 were alive with disease (13 with locoregional recurrence, 8 with distant metastasis, and 6 with both), 41 died of disease, 37 died of other causes. Other causes included comorbidity present at diagnosis (12), old age (7), infection (6), cardiac problems (5), respiratory problems (5), and gastrointestinal issue (2). Of those who experienced distant metastasis (n = 41), the most common place of metastasis was the lung (n = 27) followed by bone (n = 6).
There was a significant difference in OS by tumor site, age, performance status, treatment interruption and stage. At 3 years, there was a 78.1% (69.3–88.2) chance of OS for oropharynx, 55.1% (33.6–90.3) chance for hypopharynx, 59.3% (44.2–79.5) for larynx, 34.6% (20.0–59.8) for oral cavity, and 100% for nasopharynx. DSS revealed a similar pattern when stratified by site. Estimated LRC stratified by site showed estimated control of 83.7% (74.6–94.0) for oropharynx tumors, 74.1% (52.6–100.0) hypopharynx tumors, 75.5% (62.1–91.8) for larynx tumors, 51.0% (30.0–86.7) for oral cavity tumors, and 80.0% (51.6–100.0) for nasopharynx tumors (Figure 1).
FIGURE 1.

Kaplan–Meier survival curves stratified by site. (A) Overall survival for patients stratified by primary site. Three-year overall survival was 78.1% (95% CI: 69.3–88.2), 59.3% (95% CI: 44.2–79.5), 34.6% (95% CI: 20.0–59.8), 55.1% (95% CI: 33.6–90.3), and 100.0% (95% CI, 100.0–100.0) for tumors originating in the oropharynx, larynx, oral cavity, hypopharynx, and nasopharynx respectively (P < .001). (B) Disease-specific survival for patients stratified by primary site. Three-year disease-specific survival was 87.4% (95% CI: 79.9–95.6), 82.1% (95% CI: 70.6–95.6), 60.5% (95% CI: 45.5–80.5), 59.3% (95% CI: 37.0–95.1), and 100.0% (95% CI, 100.0–100.0) for tumors originating in the oropharynx, larynx, oral cavity, hypopharynx, and nasopharynx, respectively (P = .003). (C) Locoregional control for patients stratified by primary site. Three-year locoregional control was 83.7% (95% CI: 74.6–94.0), 75.5% (95% CI: 62.1–91.8), 51.0% (95% CI: 30.0–86.7), 74.1% (95% CI: 52.6–100.0), and 80.0% (95% CI, 51.6–100.0) for tumors originating in the oropharynx, larynx, oral cavity, hypopharynx, and nasopharynx respectively (P = .012)
At 3 years, OS stratified by age was 70.7% (62.9–79.5) for those aged 70–80 and 48.7% (34.2–69.5) for those ≥80. There was no significant difference in DSS and LRC when stratified by age (Figure 2). Poor performance status was associated with worse OS, DSS, and LRC. Notably, lower ECOG scores correlated with a stepwise decline in OS at 3 years, decreasing from 81.2% (69.3–95.2) with ECOG 0, 63.1% (53.3–74.8) with ECOG 1, and 48% (33.9–68.0%) ECOG 2,3. This stepwise decrease was mirrored when DSS and LRC were stratified by performance status (Figure 3).
FIGURE 2.
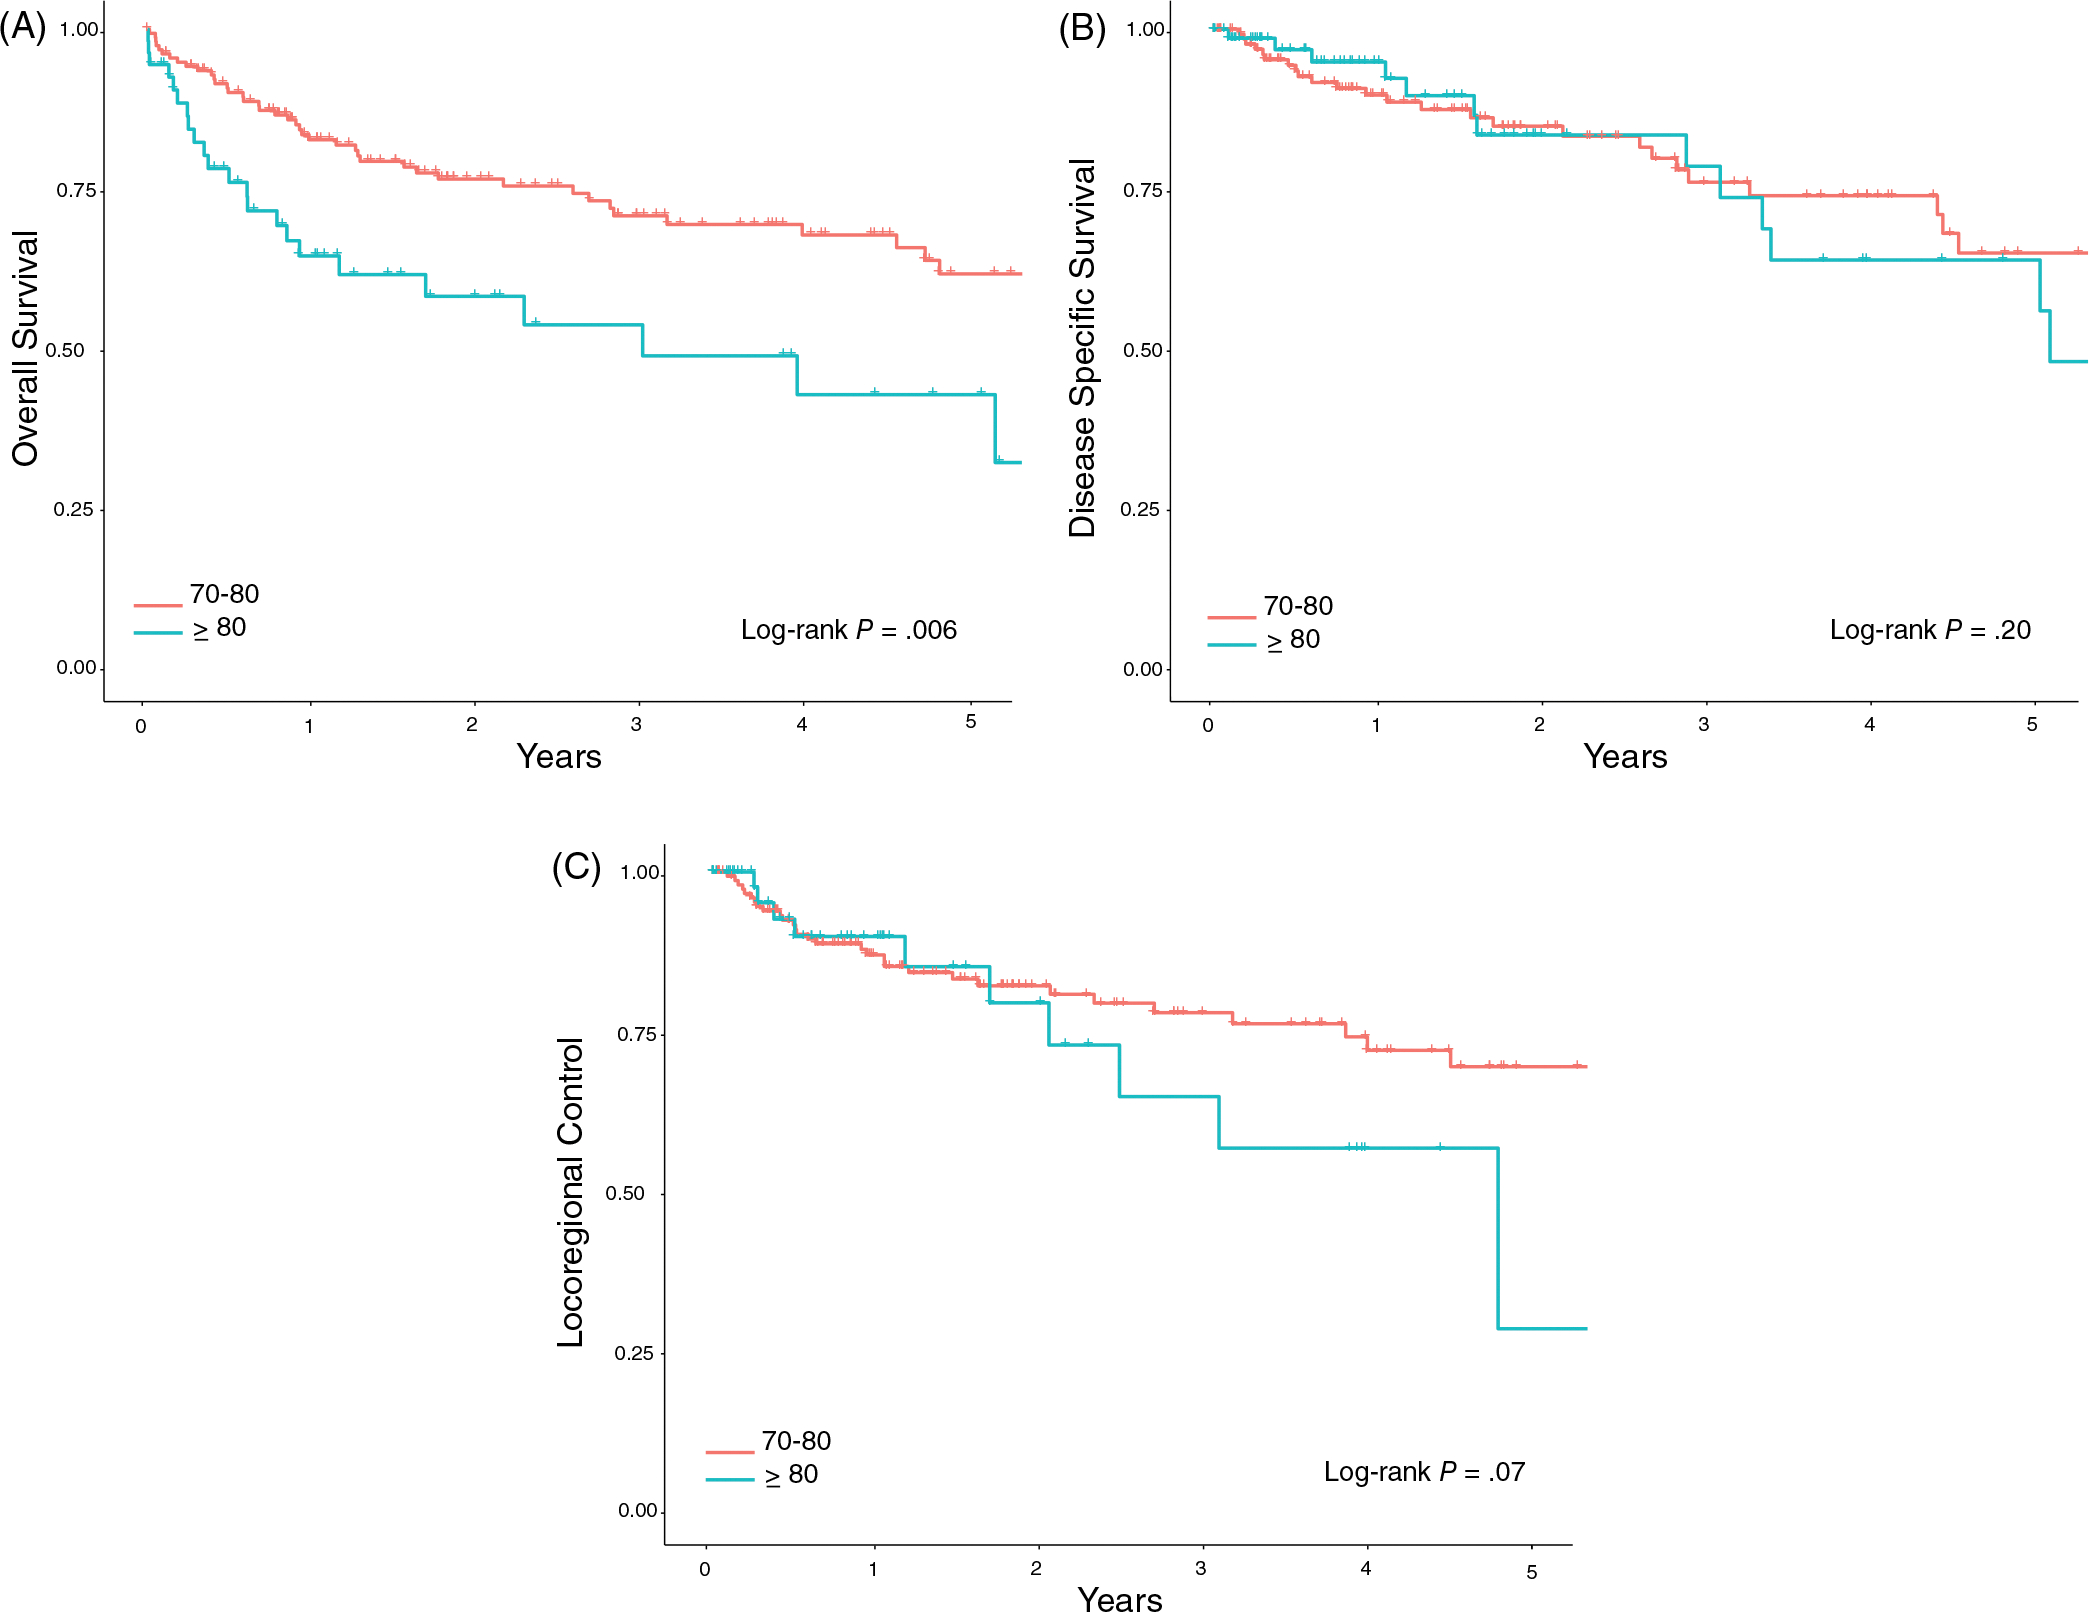
Kaplan-Meier survival curves stratified by age. (A) Overall survival for patients stratified by age. Three-year overall survival was 70.7% (95% CI: 62.9–79.5) and 48.7% (95% CI: 34.2–69.5) for patients age 70–80 and > 80, respectively (P = .007). (B) Disease-specific survival for patients stratified by age. Three-year disease-specific survival was 82.3% (95% CI: 75.7–89.5) and 73.0% (95% CI: 60.3–88.3) for patients age 70–80 and > 80, respectively (P = .27). (C) Locoregional control for patients stratified by age. Three-year locoregional control was 77.9% (95% CI: 70.4–86.2) and 64.7% (95% CI: 45.5–91.9) for patients age 70–80 and > 80, respectively (P = .29)
FIGURE 3.

Kaplan-Meier survival curves stratified by performance status. (A) Overall survival for patients stratified by performance status. Three-year overall survival was 81.2% (95% CI: 69.3–95.2), 63.1% (95% CI: 53.3–74.8), and 48.0% (95% CI: 33.9–68.0) for patients with ECOG 0, ECOG 1, and ECOG 2 or 3 performance status, respectively (P < .001). (B) Disease-specific survival for patients stratified by performance status. Three-year locoregional control was 92.2% (95% CI: 83.4–100.0), 78.0% (95% CI: 69.4–87.6), and 64.0% (95% CI: 49.5–82.8) for patients with ECOG 0, ECOG 1, and ECOG 2 or 3 performance status, respectively (P = .001). (C) Locoregional control for patients stratified by performance status. Three-year locoregional control was 84.8% (95% CI: 72.3–99.5), 74.4% (95% CI: 64.8–85.4), and 62.6% (95% CI: 44.3–88.5) for patients with ECOG 0, ECOG 1, and ECOG 2 or 3 performance status, respectively (P = .019)
Similarly, AJCC eighth edition stage was predictive of survival outcome. Stage III/IV, in particular, was associated with worse OS and DSS (Figure 4). At 3 years, OS for patients with stage III/IV tumors was 58.3% (48.8–69.6) and 73.7% (63.4–85.8), respectively. A similar effect was observed when DSS was stratified by stage (Figure 4).
FIGURE 4.

Kaplan-Meier survival curves stratified by AJCC eighth edition staging. (A) Overall survival stratified by stage. Three-year overall survival was 73.7% (95% CI: 63.4–85.8) and 58.3% (95% CI: 48.8–69.6) for patients with stage I/II and stage III/IV tumors, respectively (P < .001). (B) Disease-specific survival stratified by stage. Three-year locoregional control was 89.8% (95% CI: 82.6–97.6) and 71.5% (95% CI: 62.7–81.6) for patients with stage I/II and stage III/IV tumors, respectively (P = .002). (C) Locoregional control stratified by stage. Three-year locoregional control was 79.1% (95% CI: 68.6–91.3) and 72.4% (95% CI: 62.6–83.8) for patients with stage I/II and stage III/IV tumors, respectively (P = .081)
Patients who experienced a treatment interruption had an OS of 62.5% (51.0–76.5) compared to an OS of 70.1% (61.2–80.3) in those with continued treatment at 3 years. No differences were observed for DSS or LRC (Figure 5). Similarly, CCI trended toward significance in OS, but not for DSS or LRC, as patients with more comorbidities (CCI ≥ 7) had an estimated 3 year survival of 69.5% (60.9–79.2) compared to 58% (46.0–73.2) for patients with CCI 5 or 6 (Figure 6, Table S6).
FIGURE 5.

Kaplan-Meier survival curves stratified by treatment interruption. (A) Overall survival for patients who experienced a treatment interruption and uninterrupted treatment. Three-year overall survival was 70.1% (95% CI: 61.2–80.3) and 62.5% (95% CI: 51.0–76.5) for patients who experienced uninterrupted and interrupted treatment, respectively (P = .010). (B) Disease-specific survival for patients who experienced a treatment interruption and uninterrupted treatment. Three-year overall survival was 82.5% (95% CI: 75.4–90.3) and 73.6% (95% CI: 62.1–87.2) for patients who experienced uninterrupted and interrupted treatment, respectively (P = .45). (C) Locoregional control for patients who experienced a treatment interruption and uninterrupted treatment. Three-year locoregional control was 82.0% (95% CI: 73.9–91.0) and 68.9% (95% CI: 56.0–84.7) for patients who experienced uninterrupted and interrupted treatment, respectively (P = .21)
FIGURE 6.

Kaplan-Meier survival curves stratified by CCI. (A) Overall survival for patients stratified by CCI. Three-year overall survival was 69.5% (95% CI: 60.9–79.2) and 58.0% (95% CI: 46.0–73.2) for patients with a CCI of 5/6 or a CCI ≥ 7 (P = .069). (B) Disease-specific survival for patients stratified by CCI. Three-year disease-specific survival was 82.5% (95% CI: 75.5–90.2) and 75.5% (95% CI: 64.6–87.6) for patients with a CCI of 5/6 or a CCI ≥ 7 (P = .52). (C) Locoregional control for patients stratified by CCI. Three-year locoregional control was 78.4% (95% CI: 70.4–87.3) and 68.5% (95% CI: 53.7–87.4) for patients with a CCI of 5/6 or a CCI ≥ 7 (P = .46)
Site remained a significantly prognosticator for locoregional control, overall survival, and DSS in the fully adjusted Cox regression models. Hypopharynx was associated with worse OS and DSS (OS: HR 2.1, [95% CI: 0.8, 5.7]; P = .015; DSS: HR 4.35, [95% CI: 1.18, 5.18], P = .026). Oral cavity similarly correlated with worse OS, DSS, and LRC (OS: HR 2.39, [95% CI: 1.2, 4.9]; P < .001; DSS: HR 4.3, [95% CI: 1.86, 9.98], P < .001; LRC: HR 3.59, [95% CI: 1.57, 8.23], P = .00).
Poor performance status, specifically ECOG 2 or 3, remained a significant predictor in the multivariable model for OS and DSS (OS: HR 4.88, [95% CI: 1.85, 11.04]; P < .001; DSS: HR 3.42, [95% CI: 1.24, 9.3], P = .010; LRC: HR 2.60, [95% CI: 0.9, 7.4], P = .054). Performance status of ECOG 1 was similarly associated with DSS (HR 3.42, [95% CI: 1.24, 9.3]; P = .01). In addition, treatment interruption was independently associated with worse OS (HR 2.05, [95% CI: 1.19, 3.53]; P < .001). Of note, because of significant collinearity between performance status and stage, both variables were unable to be included in the same models (Table 4).
TABLE 4.
Univariate and multivariate Cox proportional hazards models in elderly patients with HNSCC
| Overall survival |
Disease specific survival |
Lacoregional control |
||||||||||
|---|---|---|---|---|---|---|---|---|---|---|---|---|
| Univariate |
Multivariate |
Univariate |
Multivariate |
Univariate |
Multivariate |
|||||||
| Predictor | HR (95% CI) | P-value | HR (95% CI) | P-value | HR (95% CI) | P-value | HR (95% CI) | P-value | HR (95% CI) | P-value | HR (95% CI) | P-value |
| Primary site | ||||||||||||
| Oropharynx | Ref | Ref | Ref | Ref | Ref | Ref | ||||||
| Hypopharynx | 2.87 (1.15,7.17) | .023 | 2.1 (0.8, 5.7) | .015 | 4.7 (1.64,13.47) | .003 | 4.35 (1.18,15.18) | .026 | a | |||
| Larynx | 1.82 (0.97,3.4) | .059 | 1.39 (0.79, 2.82) | .32 | 1.18 (0.48,2.89) | .71 | 1.8 (0.95,3.4) | .16 | 1.94 (0.85,4.41) | .11 | 1.78 (0.78, 4.1) | .11 |
| Oral cavity | 3.79 (2.04,7.05) | <.001 | 2.39 (1.2, 4.9) | <.001 | 3.4 (1.53,7.57) | .0024 | 4.3 (1.86,9.98) | <.001 | 3.97 (1.74, 9.05) | .001 | 3.59 (1.57, 8.23) | .001 |
| Nasopharynx | a | a | a | |||||||||
| Age | ||||||||||||
| 70–80 | Ref | Ref | Ref | Ref | ||||||||
| ≥80 | 2.1 (1.3,3.3) | .003 | 1.57 (0.88, 2.82) | .12 | 1.64(0.81,3.32) | .17 | 1.47(0.72, 3.03) | .72 | ||||
| Performance status | ||||||||||||
| ECOG 0 | Ref | Ref | Ref | Ref | Ref | Ref | ||||||
| ECOG 1 | 1.9 (1.1,3.6) | .041 | 2.1 (0.95, 5.0) | .10 | 3.4(1.16,9.91) | .020 | 1.68 (0.68, 4.23) | .070 | 1.91 (1.01, 3.67) | .042 | 1.78 (0.78, 4.11) | .27 |
| ECOG 2/3 | 3.7 (1.8,7.4) | <.001 | 4.88 (1.85, 11.0) | <.001 | 7.03(2.29,21.6) | <.001 | 3.42 (1.24,9.3) | .011 | 3.8 (1.85,7.8) | <.001 | 2.6(0.9, 7.4) | .054 |
| Comorbidity index | ||||||||||||
| CCI 5 or 6 | Ref | Ref | Ref | |||||||||
| CCI ≥7 | 1.54 (0.96,2.5) | .069 | 1.3 (0.67,2.52) | .44 | 1.1 (0.6, 2.1) | .72 | ||||||
| AJCC eighth edition stage | ||||||||||||
| Stage I/II | Ref | b | Ref | b | Ref | |||||||
| Stage III/IV | 2.6 (1.5,4.3) | .001 | 3.78(1.73,8.26) | <.001 | 0.52 (0.23, 1.18) | .20 | ||||||
| Treatment interruption | ||||||||||||
| No | Ref | Ref | Ref | Ref | ||||||||
| Yes | 1.7 (1.1,2.7) | .036 | 2.05 (1.19, 3.53) | <.001 | 1.5(0.77,2.9) | .23 | 2.05 (0.9, 4.68) | .073 | ||||
Insufficient number of events for appropriate inclusion in Cox Proportional Hazards Model.
Not included in final mode due to collinearity with another predictor.
4 |. DISCUSSION
To our knowledge, this study is among the first to investigate therapeutic toxicity/tolerability and disease outcomes in elderly patients with HNSCC and characterize this neglected cohort. Prior studies were limited by outcomes and few reported on the interplay between therapeutic effects and outcomes.
In contrast to some studies, comorbidity was not shown to be a predictor of overall survival,19,24 although a trend was noted. This trend is consistent with other studies where CCI predicted worse overall survival, but not worse disease specific outcomes. Comorbidity was also not shown to predict toxicity in this cohort. Results are variable,14 as CCI is a composite score of multiple organ specific diseases, with issues inherent to a composite scoring system.25 As a result, research has been done to create more accurate comorbidity indices including a head and neck specific CCI.17,18,26
There was a higher G-tube placement than expected in our cohort, consistent with previous studies suggesting G-tubes are more frequently placed in elderly patients with HNSCC compared to their younger counterparts.12 Because weight loss during radiation has been shown to be a prognosticator of worse outcomes,27 prophylactic G-tube feeding can be used for nutritional support.28 However, current practice adheres to more conservative management given the risks inherent to prophylactic G-tube placement.29 Although our data suggest that prophylactic G-tubes were associated with the smallest degree of weight loss, it remains unclear if the benefits for such a procedure outweigh the risks, especially in an elderly patient population. Further studies are required to evaluate such a role for prophylactic G-tube placement.
HNSCC treatment course, which typically requires 7 weeks, can be demanding for elderly patients, leading to increased risk of treatment interruptions.30 Studies in patients with HNSCC have shown that treatment interruptions portend worse tumor control31,32 and outcomes.33–35 In our cohort, while treatment interruptions did not prognosticate disease-specific outcomes, it was predictive of overall survival, suggesting that the etiology of treatment interruptions in the elderly population is likely multifactorial and that it may be a surrogate for other specific issues that contribute directly to poor outcomes. This may include socioeconomic status,35 access to insurance,33 issues with transporation,36 or issues more common in the elderly.37–39 In our cohort, patients with treatment interruptions experienced greater weight loss than those who experienced continuous treatment. Although the respective nature of our study precludes a determination of causality, a recent report found that in HNSCC patients, age-related weight loss, termed sarcopenia, was associated with worse overall survival.40
The results of this study should be viewed in light of some limitations. Of note, our institution routinely prescribes induction chemotherapy with TPF and concurrent carboplatin for the treatment of locally advanced HNSCC in patients of all age groups. Moreover, current research points to large systemic differences across cancer treatment centers for the management and treatment of elderly patients with HNSCC.39 Additionally, the lack of a standard definition for treatment interruption complicates direct comparisons to previous studies that employed alternative definitions. Our patient cohort was also limited in sample size resulting in a small number of on treatment deaths. As a retrospective study, we used a strict definition to delineate treatment related and non-treatment related deaths; however, these deaths were likely multifactorial. For example, aspiration pneumonia in our patient may have been due to both pre-existing dementia41 and chemoradiation induced muscle weakening and xerostomia.42 A larger sample size would be needed for a mechanistic understanding of the etiology of on treatment deaths. Nonetheless, this cohort is one of the largest to date to specifically study outcomes, tolerability, and toxicity in elderly patients with HNSCC. It is of note that this study did not include all patients who had an initial consult for head and neck cancer. As compared to other cohorts, elderly patients may decide to undergo palliative therapy or no treatment at all suggesting that our reported 3% of treatment attributed deaths may be understated and may be greater if all patients intended to treat were included.
In light of research ethics, the paucity in toxicity and outcomes data has discouraged clinical trial enrollment of elderly patients. Although elderly patients have historically been excluded from trials due to practical and ethical considerations, including unique medical demands as well as concerns regarding dosing and adverse events, the current consensus is that the elderly should be enrolled with protective measures in place (eg, more frequent follow-up).43,44 Additionally, this cohort in particular may benefit from the use of emerging and re-emerging low toxicity therapeutic strategies including brachytherapy45 and de-intensified hypofractionation.46 These treatment strategies have already been found to minimize toxicity and improve tolerability which will be especially useful for this patient population. Thus, our data can serve to guide such clinical trial design for elderly patients with primary HNSCC—more specifically it can serve to help refine treatment for elderly patients with good outcomes as well as to assist elderly patients with both poor outcomes and tolerability.
5 |. CONCLUSION
Overall, these data lay a foundation for prospective studies aimed at understanding this vulnerable and neglected population. As described previously, our study supports the widely accepted fact that chronological age does not equate to biological age. We identified multiple risk factors, including performance status, tumor origin, and treatment interruptions, which were associated with toxicity, tolerability, and survival outcomes. Our work should guide clinical trial design and encourage the developmental of novel treatment regimens for this growing population.
Supplementary Material
ACKNOWLEDGMENTS
The authors acknowledge the Claude D. Older Americans Independent Pepper Center for providing funding (Funding number: 5P30AG028741–07).
Footnotes
CONFLICT OF INTEREST
The authors declare no conflicts of interest.
SUPPORTING INFORMATION
Additional supporting information may be found online in the Supporting Information section at the end of this article.
DATA AVAILABILITY STATEMENT
The data that support the findings of this study are available from the corresponding author, RLB, upon reasonable request.
REFERENCES
- 1.Parkin DM, Bray F, Ferlay J, Pisani P. Global cancer statistics. CA Cancer J Clin. 2002;55(2):74–108. [DOI] [PubMed] [Google Scholar]
- 2.Clayburgh DR. Grandis JR. 3 - molecular biology. In: Bell RB, Fernandes RP, Andersen PE, eds. Oral, Head and Neck Oncology and Reconstructive Surgery. Amsterdam, Netherlands: Elsevier; 2018:79–89. [Google Scholar]
- 3.Sikora AG. The changing demographics of head and neck squamous cell carcinoma in the United States. Laryngoscope. 2004;114(11):1915–1923. [DOI] [PubMed] [Google Scholar]
- 4.SEER Cancer Statistics Review, 1975–2016. National Cancer Institue; 2019. https://seer.cancer.gov/csr/1975_2016/. Accessed August 8, 2019. [Google Scholar]
- 5.Talarico L, Chen G, Pazdur R. Enrollment of elderly patients in clinical trials for cancer drug registration: a 7-year experience by the US Food and Drug Administration. J Clin Oncol. 2004; 22(22):4626–4631. [DOI] [PubMed] [Google Scholar]
- 6.Pignon J-P, Al M, Maillard E, Bourhis J. Meta-analysis of chemotherapy in head and neck cancer (MACH-NC): an update on 93 randomised trials and 17,346 patients. Radiother Oncol. 2009;92(1):4–14. [DOI] [PubMed] [Google Scholar]
- 7.VanderWalde NA, Fleming M, Weiss J, Chera BS. Treatment of older patients with head and neck cancer: a review. Oncologist. 2013;18(5):568–578. [DOI] [PMC free article] [PubMed] [Google Scholar]
- 8.Dave E, Su W, Gupta V, et al. Human papilloma virus-positive oropharyngeal squamous cell carcinoma in the elderly. Anti-cancer Res. 2017;37(4):1847–1851. [DOI] [PubMed] [Google Scholar]
- 9.Olmi P, Ausili Cèfaro G. Radiotherapy in the elderly: a multicentric prospective study on 2060 patients referred to 37 Italian radiation therapy centers. Rays. 1997;22:53–56. [PubMed] [Google Scholar]
- 10.Camilon PR, Stokes WA, Nguyen SA, Lentsch EJ. Are the elderly with oropharyngeal carcinoma undertreated? Laryngoscope. 2014;124(9):2057–2063. [DOI] [PubMed] [Google Scholar]
- 11.VanderWalde NA, Meyer A-M, Liu H, et al. Patterns of care in older patients with squamous cell carcinoma of the head and neck: a surveillance, epidemiology, and end results-medicare analysis. J Geriatr Oncol. 2013;4(3):262–270. [DOI] [PMC free article] [PubMed] [Google Scholar]
- 12.Sachdev S, Refaat T, Bacchus ID, Sathiaseelan V, Mittal BB. Age most significant predictor of requiring enteral feeding in head-and-neck cancer patients. Radiat Oncol. 2015;10:93–93. [DOI] [PMC free article] [PubMed] [Google Scholar]
- 13.van der Schroeff MP, Derks W, Hordijk GJ, de Leeuw RJ. The effect of age on survival and quality of life in elderly head and neck cancer patients: a long-term prospective study. Eur Arch Otorhinolaryngol. 2007;264(4):415–422. [DOI] [PubMed] [Google Scholar]
- 14.Bøje CR. Impact of comorbidity on treatment outcome in head and neck squamous cell carcinoma – a systematic review. Radiother Oncol. 2014;110(1):81–90. [DOI] [PubMed] [Google Scholar]
- 15.Schofield CP, Sykes AJ, Slevin NJ, Rashid NZZ. Radiotherapy for head and neck cancer in elderly patients. Radiother Oncol. 2003;69(1):37–42. [DOI] [PubMed] [Google Scholar]
- 16.Pignon T, Horiot JC, Van den Bogaert W, Van Glabbeke M, Scalliet P. No age limit for radical radiotherapy in head and neck tumours. Eur J Cancer. 1996;32(12):2075–2081. [DOI] [PubMed] [Google Scholar]
- 17.Bøje CR, Dalton SO, Grønborg TK, et al. The impact of comorbidity on outcome in 12 623 Danish head and neck cancer patients: a population based study from the DAHANCA database. Acta Oncol. 2013;52(2):285–293. [DOI] [PubMed] [Google Scholar]
- 18.Reid BC, Alberg AJ, Klassen AC, et al. A comparison of three comorbidity indexes in a head and neck cancer population. Oral Oncol. 2002;38(2):187–194. [DOI] [PubMed] [Google Scholar]
- 19.Sanabria A, Carvalho AL, Vartanian JG, Magrin J, Ikeda MK, Kowalski LP. Comorbidity is a prognostic factor in elderly patients with head and neck cancer. Ann Surg Oncol. 2007;14 (4):1449–1457. [DOI] [PubMed] [Google Scholar]
- 20.Harris PA, Taylor R, Minor BL, et al. The REDCap consortium: building an international community of software platform partners. J Biomed Inform. 2019;95:103208. [DOI] [PMC free article] [PubMed] [Google Scholar]
- 21.Harris PA, Taylor R, Thielke R, Payne J, Gonzalez N, Conde JG. Research electronic data capture (REDCap)—a metadata-driven methodology and workflow process for providing translational research informatics support. J Biomed Inform. 2009;42(2):377–381. [DOI] [PMC free article] [PubMed] [Google Scholar]
- 22.U.S. Department of Health and Human Services and U.S. Department of Agriculture. Appendix 9. Alcohol. 2015–2020 Dietary Guidelines for Americans. 8th ed. Washington, DC: U.S. Department of Health and Human Services; U.S. Department of Agriculture; 2015. [Google Scholar]
- 23.Charlson ME, Pompei P, Ales KL, MacKenzie CR. A new method of classifying prognostic comorbidity in longitudinal studies: development and validation. J Clin Epidemiol. 1987;40 (5):373–383. [DOI] [PubMed] [Google Scholar]
- 24.Coca-Pelaz A, Halmos GB, Strojan P, et al. The role of age in treatment-related adverse events in patients with head and neck cancer: a systematic review. Head Neck. 2019;41(7):2410–2429. [DOI] [PubMed] [Google Scholar]
- 25.Barclay M, Dixon-Woods M, Lyratzopoulos G. The problem with composite indicators. BMJ Qual Saf. 2019;28(4):338. [DOI] [PMC free article] [PubMed] [Google Scholar]
- 26.Piccirillo JF, Lacy PD, Basu A, Spitznagel EL. Development of a new head and neck cancer–specific comorbidity index. JAMA Otolaryngol Head Neck Surg. 2002;128(10):1172–1179. [DOI] [PubMed] [Google Scholar]
- 27.Shen L-J, Chen C, Li B-F, Gao J, Xia Y-F. High weight loss during radiation treatment changes the prognosis in under–/normal weight nasopharyngeal carcinoma patients for the worse: a retrospective analysis of 2433 cases. PLoS One. 2013;8(7): e68660–e68660. [DOI] [PMC free article] [PubMed] [Google Scholar]
- 28.Orphanidou C, Biggs K, Johnston ME, et al. Prophylactic feeding tubes for patients with locally advanced head-and-neck cancer undergoing combined chemotherapy and radiotherapy-systematic review and recommendations for clinical practice. Curr Oncol. 2011;18(4):e191–e201. [DOI] [PMC free article] [PubMed] [Google Scholar]
- 29.Madhoun MF, Blankenship MM, Blankenship DM, Krempl GA, Tierney WM. Prophylactic PEG placement in head and neck cancer: how many feeding tubes are unused (and unnecessary)? World J Gastroenterol. 2011;17(8):1004–1008. [DOI] [PMC free article] [PubMed] [Google Scholar]
- 30.Chang S, Goldstein NE, Dharmarajan KV. Managing an older adult with cancer: considerations for radiation oncologists. Biomed Res Int. 2017;2017:1695101. [DOI] [PMC free article] [PubMed] [Google Scholar]
- 31.Bese NS, Hendry J, Jeremic B. Effects of prolongation of overall treatment time due to unplanned interruptions during radiotherapy of different tumor sites and practical methods for compensation. Int J Radiat Oncol Biol Phys. 2007;68(3):654–661. [DOI] [PubMed] [Google Scholar]
- 32.Patel UA, Thakkar KH, Holloway N. Patient compliance to radiation for advanced head and neck cancer at a tertiary care county hospital. Laryngoscope. 2008;118(3):428–432. [DOI] [PubMed] [Google Scholar]
- 33.Thomas K, Martin T, Gao A, Ahn C, Wilhelm H, Schwartz DL. Interruptions of head and neck radiotherapy across insured and indigent patient populations. J Oncol Pract. 2017;13(4): e319–e328. [DOI] [PubMed] [Google Scholar]
- 34.Lazarev S, Gupta V, Ghiassi-Nejad Z, et al. Premature discontinuation of curative radiation therapy: insights from head and neck irradiation. Adv Radiat Oncol. 2017;3(1):62–69. [DOI] [PMC free article] [PubMed] [Google Scholar]
- 35.Ohri N, Rapkin BD, Guha C, Kalnicki S, Garg M. Radiation therapy noncompliance and clinical outcomes in an urban academic cancer center. I J Radiat Oncol Biol Phys. 2016;95(2): 563–570. [DOI] [PubMed] [Google Scholar]
- 36.Salloum RG, Smith TJ, Jensen GA, Lafata JE. Factors associated with adherence to chemotherapy guidelines in patients with non-small cell lung cancer. Lung Cancer. 2012;75(2): 255–260. [DOI] [PMC free article] [PubMed] [Google Scholar]
- 37.Kroenke CH, Kubzansky LD, Schernhammer ES, Holmes MD, Kawachi I. Social networks, social support, and survival after breast cancer diagnosis. J Clin Oncol. 2006;24(7):1105–1111. [DOI] [PubMed] [Google Scholar]
- 38.Won HS, Sun DS, Choi JY, An HJ, Ko YH. Factors associated with treatment interruption in elderly patients with cancer. Korean J Intern Med. 2019;34(1):156–164. [DOI] [PMC free article] [PubMed] [Google Scholar]
- 39.DiMatteo MR, Lepper HS, Croghan TW. Depression is a risk factor for noncompliance with medical treatment: metaanalysis of the effects of anxiety and depression on patient adherence. JAMA Intern Med. 2000;160(14):2101–2107. [DOI] [PubMed] [Google Scholar]
- 40.Chargi N, Bril SI, Emmelot-Vonk MH, de Bree R. Sarcopenia is a prognostic factor for overall survival in elderly patients with head-and-neck cancer. Eur Arch Otorhinolaryngol. 2019;276(5):1475–1486. [DOI] [PMC free article] [PubMed] [Google Scholar]
- 41.Arcand M End-of-life issues in advanced dementia: part 2: management of poor nutritional intake, dehydration, and pneumonia. Can Fam Physician. 2015;61(4):337–341. [PMC free article] [PubMed] [Google Scholar]
- 42.Langerman A, Maccracken E, Kasza K, Haraf DJ, Vokes EE, Stenson KM. Aspiration in chemoradiated patients with head and neck cancer. Arch Otolaryngol Head Neck Surg. 2007;133 (12):1289–1295. [DOI] [PubMed] [Google Scholar]
- 43.Ilgili O, Arda B, Munir K. Ethics in geriatric medicine research. Turk J Geriatr Med. 2014;17(2):188–195. [PMC free article] [PubMed] [Google Scholar]
- 44.Shenoy P, Harugeri A. Elderly patients’ participation in clinical trials. Perspect Clin Res. 2015;6(4):184–189. [DOI] [PMC free article] [PubMed] [Google Scholar]
- 45.Bussu F, Tagliaferri L, Mattiucci G, et al. HDR interventional radiotherapy (brachytherapy) in the treatment of primary and recurrent head and neck malignancies. Head Neck. 2019;41(6):1667–1675. [DOI] [PubMed] [Google Scholar]
- 46.Bonomo P, Desideri I, Loi M, et al. Elderly patients affected by head and neck squamous cell carcinoma unfit for standard curative treatment: is de-intensified, hypofractionated radiotherapy a feasible strategy? Oral Oncol. 2017;74:142–147. [DOI] [PubMed] [Google Scholar]
Associated Data
This section collects any data citations, data availability statements, or supplementary materials included in this article.
Supplementary Materials
Data Availability Statement
The data that support the findings of this study are available from the corresponding author, RLB, upon reasonable request.