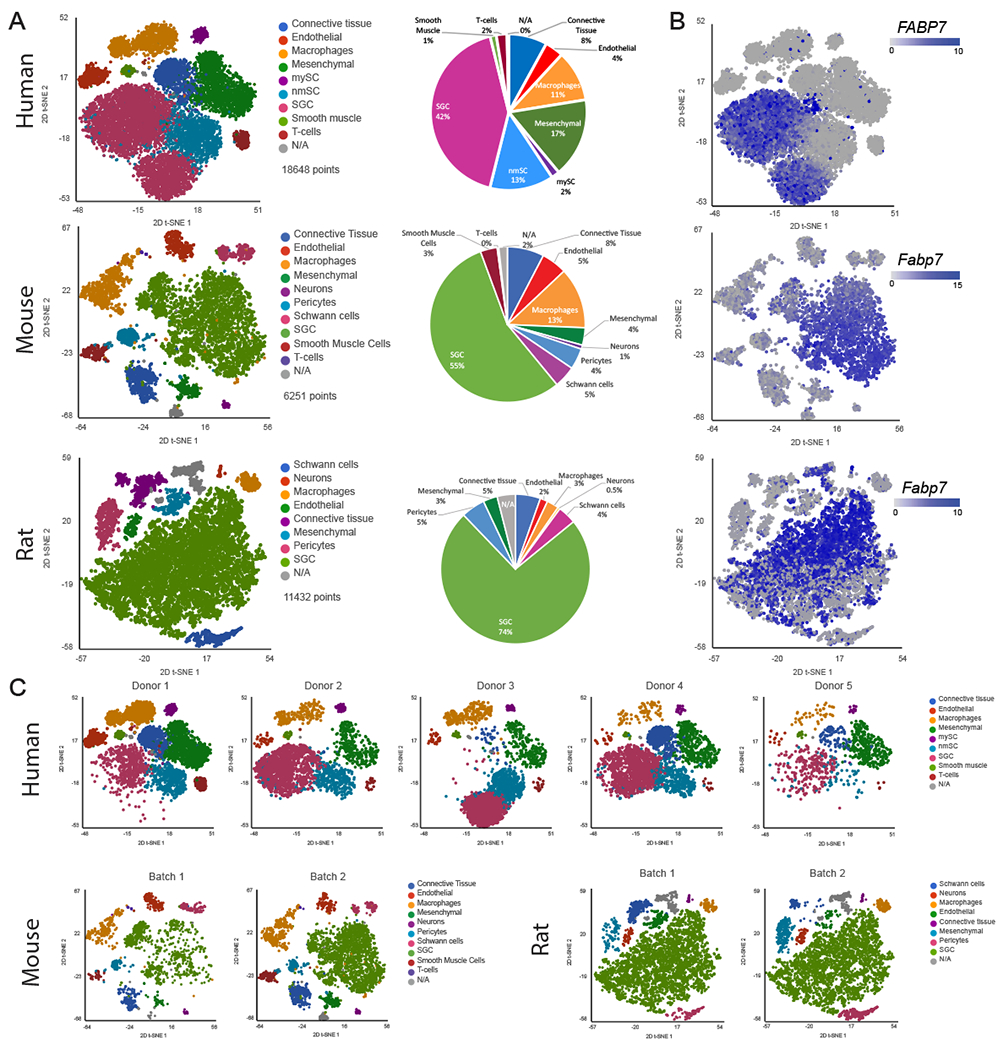
Figure 1: Profiling DRG cells from mouse, rat and human.

(A) t-SNE plot of human (18,648 cells), mouse (6,251 cells) and rat (11,432 cells) DRG cells colored by cell populations with fraction of distribution
(B) t-SNE plots separated by batch/donors of human (donor1 6,444 cells, donor2 3,498 cells, donor3 3,957 cells, donor4 3,871 cells and donor5 878 cells), mouse (batch1 1,929 cells batch2 4,322 cells) and rat (batch1 6,074 cells batch2 5,358 cells)
(C) t-SNE overlay for expression of the SGC marker gene Fabp7 in human, mouse and rat
