Abstract
Type 1 diabetes mellitus (T1DM) is a chronic metabolic disorder that mainly affects children and young adults. It is associated with debilitating and long-life complications. Therefore, understanding the factors that lead to the onset and development of these complications is crucial. To our knowledge this is the first study that attempts to identify the common differentially expressed genes (DEGs) in T1DM complications using whole transcriptomic profiling in United Arab Emirates (UAE) patients. The present multicenter study was conducted in different hospitals in UAE including University Hospital Sharjah, Dubai Hospital and Rashid Hospital. A total of fifty-eight Emirati participants aged above 18 years and with a BMI < 25 kg/m2 were recruited and forty-five of these participants had a confirmed diagnosis of T1DM. Five groups of complications associated with the latter were identified including hyperlipidemia, neuropathy, ketoacidosis, hypothyroidism and polycystic ovary syndrome (PCOS). A comprehensive whole transcriptomic analysis using NGS was conducted. The outcomes of the study revealed the common DEGs between T1DM without complications and T1DM with different complications. The results revealed seven common candidate DEGs, SPINK9, TRDN, PVRL4, MYO3A, PDLIM1, KIAA1614 and GRP were upregulated in T1DM complications with significant increase in expression of SPINK9 (Fold change: 5.28, 3.79, 5.20, 3.79, 5.20) and MYO3A (Fold change: 4.14, 6.11, 2.60, 4.33, 4.49) in hyperlipidemia, neuropathy, ketoacidosis, hypothyroidism and PCOS, respectively. In addition, functional pathways of ion transport, mineral absorption and cytosolic calcium concentration were involved in regulation of candidate upregulated genes related to neuropathy, ketoacidosis and PCOS, respectively. The findings of this study represent a novel reference warranting further studies to shed light on the causative genetic factors that are involved in the onset and development of T1DM complications.
Subject terms: Diseases, Endocrinology
Introduction
Globally, there is a dramatic increase in both the prevalence and incidence of type 1 diabetes mellitus (T1DM) with a current estimate of 1.1 million children and adolescents (< 20 years) living with T1DM around the world1. Given the age of the T1DM patients, these statistics will have a significant impact in shaping the future of public health and associated economic burden2.
Genetic heterogeneity of T1DM has received much attention recently as it provides new insights into the pathogenesis and development of various complications that are associated with T1DM3. Although the evidence of this heterogeneity is growing fast, the interpretation and the clinical implications are yet to be determined.
Earlier genomic studies have identified HLA and non-HLA loci on chromosome 6 that are involved in expression of T1DM complications4. In addition, large-scale studies of 8114 T1DM patients among 6707 families in an American cohort have strongly suggested genetic basis for susceptibility to T1DM microvascular complications (MVCs) including retinopathy, nephropathy, and neuropathy5. Moreover, studies in Finnish population have identified genes that predispose patients with T1DM to develop advanced diabetic nephropathy6.
A more recent study of 415 families investigated T1DM-related MVCs and tested the hypothesis that T1DM associated with MVCs is genetically distinct from T1DM without MVCs3. Interestingly, the findings showed that the latter exhibited distinct genetic signature compared to the T1DM patients with MVCs3. In agreement with these findings, the genome-wide association studies have identified more than 60 susceptibility regions within the human genome for T1DM which are evidenced by single nucleotide polymorphisms7.
Another serious complication of T1DM is diabetic ketoacidosis (DKA), which is one of the most common causes of morbidity and mortality in T1DM8. A Finnish study has investigated the risk of developing DKA in T1DM and whether it is related to HLA genotypes and the outcomes have shown that children with high to moderate risk of T1DM HLA-DQB1 genotypes had lower frequency of DKA than children with other genotypes9. On the other hand, an association has been reported between high chance of presenting DKA and HLA-associated high-risk genotypes using HLA DQA1-DQB1 haplotype combination genotypes10. Interestingly, it was also found that having at least one first-degree relative with history of T1DM decreased the risk of DKA regardless of HLA genotype10.
In addition, earlier studies which investigated the role of dietary fats in development of hyperlipidemia in T1DM have shown that abnormal lipid profile was common in T1DM children and adolescents who were well-adherent to healthy diet suggesting that other factors including genetics are involved in pathogenesis of hyperlipidemia as a complication that is associated with T1DM11. More recent reports have documented that heterozygous mutations in genes encoding lipoprotein lipase are associated with hypertriglyceridemia in newly diagnosed T1DM12.
Moreover, there are other prevalent endocrine complications associated with T1DM including polycystic ovary syndrome (PCOS) and thyroid dysfunction which produce negative consequences on the quality of life of T1DM patients13,14. Although genetic predisposition has been suggested as a prerequisite for development of these complications, more studies are required to elucidate the implication of the genetic factors.
In the present study a comprehensive transcriptomic analysis was conducted in the United Arab Emirates (UAE, Emirati) patients with T1DM and multiple complications to better our understanding of the candidate genes that are involved in the pathogenesis of these complications. To the best of our knowledge this is the first study to investigate the candidate genes that are associated with different complications of T1DM in Emirati patients.
The aim of the present study is to determine the differentially expressed genes (DEGs) that are common between T1DM complications including hyperlipidemia, diabetes neuropathy, PCOS, DKA and hypothyroidism using transcriptomic profiling.
Methods
Study population
The present study is a cross sectional study which included a total of fifty-eight participants of UAE nationality (Emirati) aged above 18 years and with a BMI < 25 kg/m2. Forty-five of these participants had a confirmed diagnosis of T1DM and were recruited from University Hospital Sharjah (UHS), Dubai Hospital (DH) and Rashid Hospital (RH). Exclusion criteria were (i) patients with type 2 DM, (ii) non-Emirati patients, (iii) BMI > 25 kg/m2, (iv) patients with chronic kidney disease and (v) severe liver disease. The study was approved by the ethics committee of University of Sharjah (UOS, REC-17-08-08-01), UHS (UHS-09042018), DH (DSREC-09/2018-13) and RH (DSREC-07/2019-05) and conducted in accordance with the Declaration of Helsinki. All participants were asked to sign an informed-consent form written in their native language. This form was approved by the ethics committees prior to the onset of the recruitment process. Different groups were established based on the absence or presence of T1DM complications as show in Table 1. The diagnosis of each complication has already been confirmed and documented by consultant diabetologists and endocrinologists in the medical records of the patients and this information was used to create different complication groups.
Table 1.
Groups of the studied population.
| Group | Subjects number |
|---|---|
| Control | 13 |
| T1DM without complications | 15 |
| T1DM with hyperlipidemia | 11 |
| T1DM with neuropathy | 7 |
| T1DM with ketoacidosis | 6 |
| T1DM with hypothyroidism | 6 |
| T1DM with PCOS | 5 |
Total number of subjects in each group has been presented including control group, T1DM without complications, T1DM with hyperlipidemia, neuropathy, ketoacidosis, hypothyroidism and PCOS.
T1DM Type I Diabetes Mellitus, PCOS Polycystic Ovary Syndrome.
Data collection
Demographic and baseline clinical data for the participants were collected from the electronic medical record systems of the three hospitals: UHS, DH, and RH. This data included age (years), gender, diabetes duration (years) and age at diagnosis (years). In addition, more data were collected about anthropometric measurements which included: height (cms), weight (kgs) and BMI (kg/m2). In addition, vital signs were also collected including systolic blood pressure (mmHg), diastolic blood pressure (mmHg) and heart rate (beats/min).
Blood sample collection
From each subject, about 8 ml of blood sample was collected once and the following tests were conducted for the laboratory parameters of kidney and liver function: haemoglobin A1c (HbA1c, %), fasting blood glucose, insulin levels (mU/L), total cholesterol (mmol/L), triglycerides (mmol/L), high-density lipoprotein (HDL, mmol/L), low-density lipoprotein (LDL, mmol/L), c-reactive protein (mg/L), creatinine (mmol/L) and C-peptide (nmol/L). For genetic and transcriptomic analysis, RNA was extracted from the same blood samples using the Qiazol® method (Qiagen, Hilden, Germany) as per the manufacturer’s instructions.
Whole transcriptome sequencing
RNA samples extracted from patients were used to carry out whole transcriptomic analysis using AmpliSeq whole Transcriptome kit on S5 XL System. In brief, ~ 30 ng of Turbo DNase treated RNA was used to synthesize cDNA using SuperScript VILO cDNA Synthesis kit (Invitrogen, Carlsbad, USA) followed by amplification with Ion Ampliseq gene expression core panel primers. Enzymatic shearing was performed using FuPa reagent to obtain amplicons of ~ 200 bp and the sheared amplicons were ligated with the adapter and unique barcodes. After that, the prepared library was purified using Agencourt AMPure XP beads (Beckman Coulter, Brea, USA) to get rid of any unamplified amplicons and adapter dimers and the purified library was quantified using Ion Taqman library quantitation kit (Applied Biosystems, Foster City, USA). The libraries were further diluted to 100 pM and pooled equally with four individual samples per pool. The pooled libraries were amplified using emulsion PCR on Ion One Touch2 instruments (OT2) and enrichment was done on Ion One Touch ES following manufacturer’s instruction. Prepared template libraries were then sequenced on Ion S5 XL Semiconductor sequencer using Ion 540 Chip. All reagents used for whole transcriptome sequencing and analysis were purchased from Thermo Fisher Scientific, Waltham, USA, unless mentioned otherwise.
Bioinformatics analysis
RNA-seq data were analyzed using Ion Torrent Software Suite version 5.4. Alignment was carried out using the Torrent Mapping Alignment Program (TMAP). TMAP is optimized for aligning the raw sequencing reads against reference sequence derived from hg19 (GRCh37) assembly and the specificity and sensitivity was maintained by implementing a two-stage mapping approach by employing BWA-short15, BWA-long16, SSAHA17, Super-maximal Exact Matching18 and Smith-Waterman algorithm19 for optimal mapping. Raw read counts of the targeted genes were performed using samtools (samtools view –c –F 4 –L bed_file bam_file) and the number of expressed transcripts was confirmed after Fragments Per Kilobase Million (FPKM) normalization. DEGs analysis was performed using R/Bioconductor package DESeq2 with raw read counts from RNASeq and AmpliSeq. Read count normalization was performed using DESeq2 (Ref: https://genomebiology.biomedcentral.com/articles/10.1186/s13059-014-0550-8). Genes with less than ten normalized read counts were excluded from further analysis.
Statistical analysis
All data is expressed as mean (± SD). Correlation of clinical data with genomics data was carried out using multivariate analysis. ANOVA was used with Bonferroni multiple testing correction to identify significant genetic and clinical variables. All statistical analyses were conducted using SPSS software (version 24). P < 0.05 is statistically significant.
Results
Baseline demographic and clinical characteristics of the studied groups
The present study included young, lean Emirati participants and seven groups were established including Group 1 (Control, healthy participants, n = 13), Group 2 (T1DM patients without complications, n = 15) and Group 3 to Group 7 which include patients with various T1DM complications (Table 1). The details of these groups are as follows: Group 3 (T1DM with hyperlipidemia, n = 11), Group 4 (T1DM with neuropathy, n = 7), Group 5 (T1DM with ketoacidosis, n = 6), Group 6 (T1DM with hypothyroidism, n = 6) and Group 7 (T1DM with PCOS, n = 5) (Table 1). The average age of the participants across Group 1 to Group 7 was 27.38 ± 10.67, 24.26 ± 6.02, 32.81 ± 8.48, 32.57 ± 8.10, 27.16 ± 6.49, 29.16 ± 7.13 and 22.8 ± 3.83, respectively (Table 2). As shown in Table 2, all the participants had normal weight with BMI ranges between 21.71 ± 5.41 kg/m2 and 24.11 ± 3.12 kg/m2. In addition, Group 1 had normal range of HbA1c (5.34 ± 0.49%) which is significantly lower than all T1DM groups and a similar pattern was observed in the lipid profile of Group 1 (Cholesterol, 66.82 ± 78.10 mg/dL; Triglyceride, 21.48 ± 26.33 mg/dL; HDL, 20.47 ± 28.41 mg/dL; LDL, 34.48 ± 42.12 mg/dL).
Table 2.
Baseline demographic and clinical characteristics of the studied population: control, T1DM without complications and T1DM with complications.
| Variables | Control | T1DM (without complications) | T1DM (hyperlipidemia) | T1DM (neuropathy) | T1DM (ketoacidosis) | T1DM (hypothyroidism) | T1DM (PCOS) |
|---|---|---|---|---|---|---|---|
| Subjects (n) | 13 | 15 | 11 | 7 | 6 | 6 | 5 |
| Age (years) | 27.38 ± 10.67 | 24.26 ± 6.02 | 32.81 ± 8.48 | 32.57 ± 8.10 | 27.16 ± 6.49 | 29.16 ± 7.13 | 22.8 ± 3.83 |
| Gender (female), n (%) | 12 (92.3%) | 8 (53.33%) | 5 (45.45%) | 5 (71.42%) | 5 (83.33%) | 4 (66.66%) | 5 (100%) |
| Gender (male), n (%) | 1 (7.69%) | 7 (46.66%) | 6 (54.54%) | 2 (28.51%) | 1 (16.66%) | 2 (33.33%) | 0 (0%) |
| Age at diagnosis (year) | 13.33 ± 5.75 | 14.72 ± 6.23 | 18 ± 12.78 | 16.33 ± 4.08 | 11.33 ± 5.24 | 13 ± 5.04 | |
| Diabetes duration (years) | 10.93 ± 7.93 | 18.09 ± 6.65 | 17 ± 7.09 | 10.83 ± 5.60 | 17.83 ± 7.11 | 9.8 ± 3.03 | |
| Height (cm) | 161.11 ± 5.95 | 163.7 ± 7.34 | 163.95 ± 8.60 | 166.14 ± 13.43 | 163.75 ± 4.83 | 162.33 ± 7.42 | 160.8 ± 3.75 |
| Weight (kg) | 56.78 ± 16.01 | 60 ± 7.63 | 64.14 ± 11.42 | 67.5 ± 16.58 | 59.81 ± 3.87 | 57.55 ± 9.87 | 56.38 ± 9.34 |
| BMI (kg/m2) | 21.71 ± 5.41 | 22.48 ± 3.19 | 23.70 ± 3.00 | 24.11 ± 3.12 | 22.31 ± 1.06 | 21.96 ± 4.22 | 21.79 ± 3.07 |
| HbA1c (%) | 5.34 ± 0.49 | 8.04 ± 1.14 | 8.21 ± 1.88 | 8.62 ± 2.05 | 8.35 ± 1.76 | 8.66 ± 2.05 | 8.52 ± 1.79 |
| Cholesterol (mg/dL) | 66.82 ± 78.10 | 125.87 ± 57.05 | 159.60 ± 96.80 | 141.63 ± 111.08 | 152.8 ± 32.29 | 141.81 ± 108.83 | 139 ± 23.51 |
| Triglyceride (mg/dL) | 21.48 ± 26.33 | 54.64 ± 31.48 | 106.64 ± 104.88 | 116.02 ± 130.67 | 59.8 ± 18.67 | 103.96 ± 117.66 | 63.2 ± 22.01 |
| HDL (mg/dL) | 20.47 ± 28.41 | 44.73 ± 22.56 | 42.11 ± 25.07 | 35.85 ± 26.65 | 60.4 ± 10.87 | 43.78 ± 33.25 | 53.4 ± 3.84 |
| LDL (mg/dL) | 34.48 ± 42.12 | 78.59 ± 37.89 | 101.34 ± 70.49 | 83.61 ± 63.07 | 91 ± 29.60 | 84.71 ± 63.29 | 85.2 ± 25.69 |
Control Group includes healthy subjects without diabetes; T1DM Group includes patients with T1DM without complications. Complication Groups include patients with T1DM complications (Hyperlipidemia, Neuropathy, Ketoacidosis, Hypothyroidism, PCOS).
T1DM Type 1 Diabetes Mellitus, PCOS Polycystic Ovarian Syndrome, BMI Body Mass Index, HDL High-Density Lipoprotein, LDL Low Density-Lipoprotein.
Comparison of gene expression profiles of different complications of T1DM
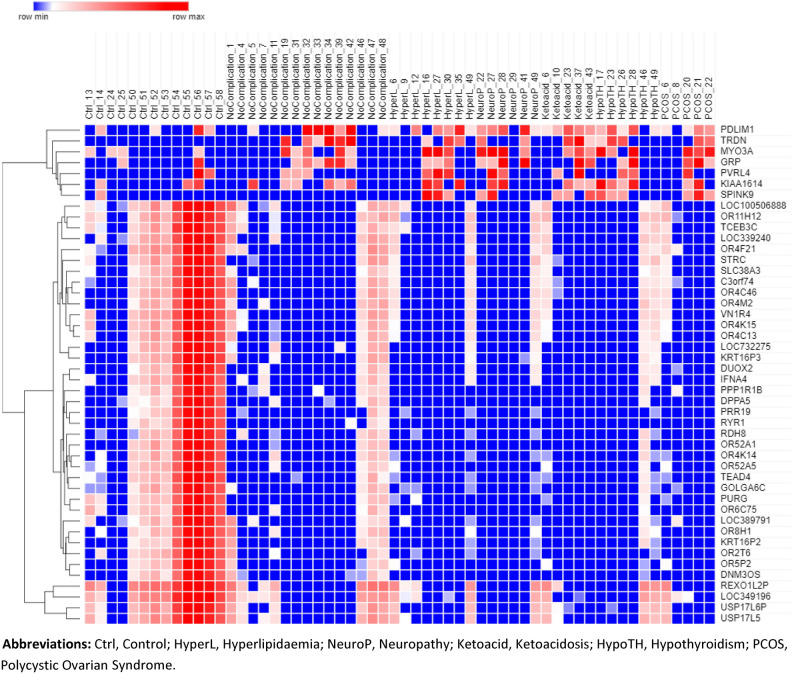
RNA-seq analysis of seven groups including control, T1DM without complication (DWC), hyperlipidemia, neuropathy, ketoacidosis, hypothyroidism and PCOS showed that T1DM complications share a common group of DEGs with DWC group. In addition, all the complications share seven common upregulated genes and thirty-nine downregulated gene. Clustering analysis of these upregulated and downregulated genes are shown in Heatmap in Fig. 1.
Figure 1.
Heat map of overlapping differentially expressed genes as identified by ANOVA and eBayes analysis of healthy controls, T1DM with no complications and T1DM with complication groups. Red color represents upregulated genes whereas blue color represents downregulated genes. Color scale is shown on the top left corner of the figure. Ctrl control, HyperL Hyperlipidemia, NeuroP Neuropathy, Ketoacid Ketoacidosis, HypoTH Hypothyroidism, PCOS Polycystic Ovarian Syndrome.
The transcriptomic analysis had shown that each T1DM complication exhibited a distinct group of DEGs with log2 fold change > 2. As shown in Table 3, the total number of upregulated genes was 914 (hyperlipidemia), 1571 (neuropathy), 746 (ketoacidosis), 1160 (hypothyroidism) and 359 (PCOS) and the total number of down regulated genes for the same T1DM complications was 2623, 2429, 2678, 2598, 2946, respectively (Table 3).
Table 3.
Total number of upregulated and downregulated genes per complication group with log2 fold change greater than 2.
| Complications | Upregulated Genes (log2 fold change > 2)a | Downregulated Genes (log2 fold change > 2)b |
|---|---|---|
| Hyperlipidemia | 914 | 2623 |
| Neuropathy | 1571 | 2429 |
| Ketoacidosis | 746 | 2678 |
| Hypothyroidism | 1160 | 2598 |
| PCOS | 359 | 2946 |
aIndicates the total number of differentially expressed genes (Upregulated) and bindicates total number of differentially expressed genes (Downregulated) across five diabetes complications (Hyperlipidemia, Neuropathy, Ketoacidosis, Hypothyroidism and PCOS).
PCOS Polycystic Ovarian Syndrome.
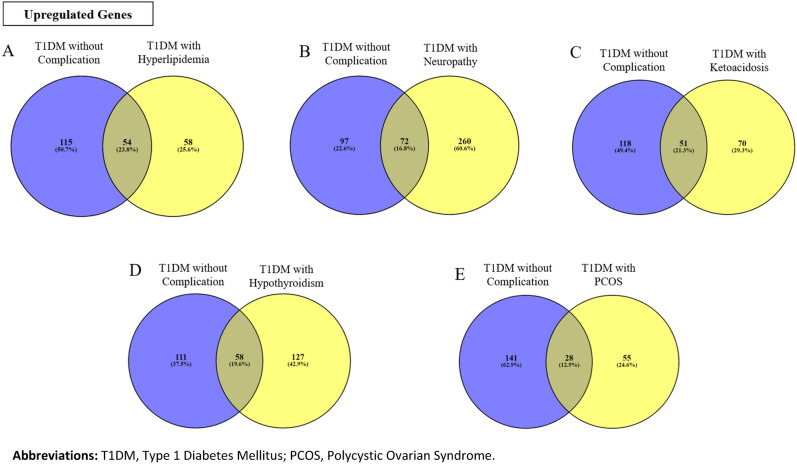
As shown in Fig. 2, common DEGs between DWC and T1DM with different complications have been identified and this includes 54, 72, 51, 58 and 28 common upregulated genes between DWC and hyperlipidemia, neuropathy, ketoacidosis, hypothyroidism and PCOS, respectively. The list of these DEGs is provided in Supplementary Tables 1 to 5.
Figure 2.
Upregulated and common DEGs between the T1DM without complications (blue circles) and T1DM with complication groups (yellow circles; (A) Hyperlipidemia, (B) Neuropathy, (C) Ketoacidosis, (D) Hypothyroidism and (E) Polycystic Ovarian Syndrome [PCOS]). Overlap between the two circles denotes the number and corresponding percentage of the common genes which was highest between T1DM without complications vs T1DM with hyperlipidemia (23.8%) and lowest for the PCOS group (12.5%).
Functional annotation and enrichment analysis of upregulated DEGs
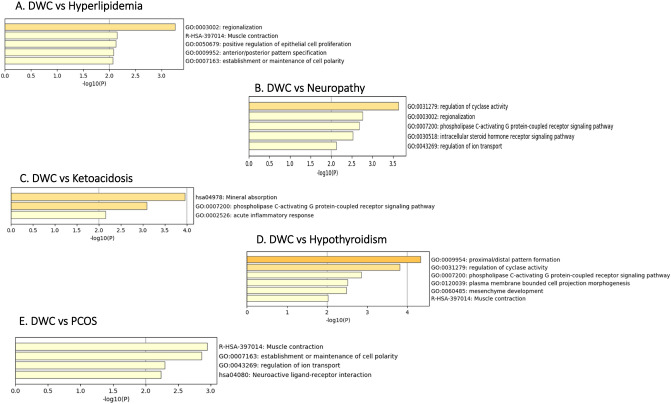
Top functional pathways were identified for the common upregulated genes (Fig. 3). The top five pathways for the common upregulated genes between DWC and hyperlipidemia were regionalization, muscle contraction, positive regulation of epithelial cell proliferation, anterior/posterior pattern specification and establishment or maintenance of cell polarity (Fig. 3A). In addition, the top five functional pathways that were associated with the common upregulated genes between DWC and neuropathy included regulation of cyclase activity, regionalization, phospholipase c-activating G protein-coupled receptor signaling, intercellular steroid hormones receptor signaling pathway and regulation of ion transport (Fig. 3B). The top three functional pathways for the common upregulated genes between DWC and ketoacidosis were mineral absorption, phospholipase c-activating G protein-coupled receptor signaling pathway and acute inflammatory response (Fig. 3C). Furthermore, there were six top functional pathways related to the common upregulated genes between DWC and hypothyroidism and this included proximal and distal pattern formation, regulation of cyclase activity, phospholipase c-activating G protein-coupled receptor signaling pathway, mesenchyme development and muscle contraction (Fig. 3D). For the common upregulated genes between DWC and PCOS, four top functional pathways were identified including muscle contraction, establishment and maintenance of cell polarity, regulation of ion transport and neuroactive ligand-receptor interaction (Fig. 3E).
Figure 3.
Enriched pathways and functional clusters of upregulated common genes between DWC vs T1DM with complication groups ((A) Hyperlipidemia, (B) Neuropathy, (C) Ketoacidosis, (D) Hypothyroidism and (E) Polycystic Ovarian Syndrome [PCOS]).
Functional annotation and enrichment analysis of downregulated DEGs
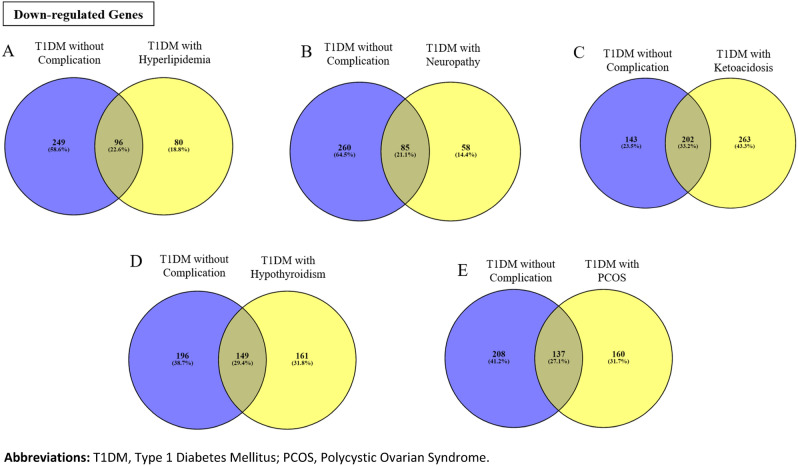
As shown in Fig. 4, common downregulated DEGs between DWC and T1DM with different complications have been identified and this includes 96, 85, 202, 149 and 137 common downregulated genes between DWC and hyperlipidemia, neuropathy, ketoacidosis, hypothyroidism and PCOS, respectively. The list of these is provided in Supplementary Tables 6 to 10.
Figure 4.
Downregulated and common DEGs between the T1DM without complications (blue circles) and T1DM with complication groups (yellow circles); (A) Hyperlipidemia, (B) Neuropathy, (C) Ketoacidosis, (D) Hypothyroidism and (E) Polycystic Ovarian Syndrome [PCOS]). Overlap between the two circles denotes the number and corresponding percentage of the common genes which was highest between T1DM without complications vs T1DM with ketoacidosis (33.2%) and lowest for the neuropathy group (21.1%).
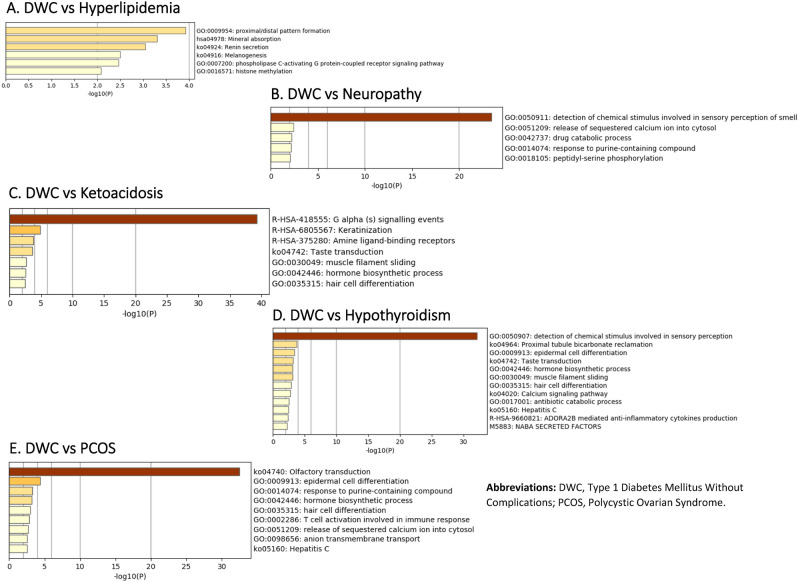
Top functional pathways were identified for these common downregulated genes (Fig. 5). The top six pathways for the common downregulated genes between DWC and hyperlipidemia were proximal/distal pattern formation, mineral absorption, renin secretion melanogenesis, phospholipase c-activating G protein-coupled receptor signaling pathway and histone methylation (Fig. 5A).
Figure 5.
Enriched pathways and functional clusters of downregulated common genes between DWC vs T1DM with complication groups ((A) Hyperlipidemia, (B) Neuropathy, (C) Ketoacidosis, (D) Hypothyroidism and (E) Polycystic Ovarian Syndrome [PCOS]).
Common downregulated genes between DWC and neuropathy were associated with top five pathways including detection of chemical stimulus involved in sensory perception of smell, release of sequestered calcium ion cytosol, drug catabolic process, response to purine-containing compound and peptide-serine phosphorylation (Fig. 5B). More functional pathways were associated with the common downregulated genes between DWC and ketoacidosis, and this includes G alpha signaling events, keratinization, amine ligand-binding, taste transduction, muscle filament sliding, hormone biosynthesis process and hair cell differentiation (Fig. 5C). Twelve functional pathways were identified in association with the common downregulated genes between DWC and hypothyroidism and the top six of the twelve included detection of chemical stimulus involved in sensory perception, proximal tubule bicarbonate reclamation, epidermal cell differentiation, taste transduction, hormone biosynthesis process and muscle filament sliding (Fig. 5D). In addition, another nine pathways were associated with the common downregulated genes between DWC and PCOS, the top six of these nine pathways were olfactory transduction, epidermal cell differentiation, response to purine-containing compound, hormone biosynthesis process, hair cell differentiation and T-cell activation involved in immune response (Fig. 5E).
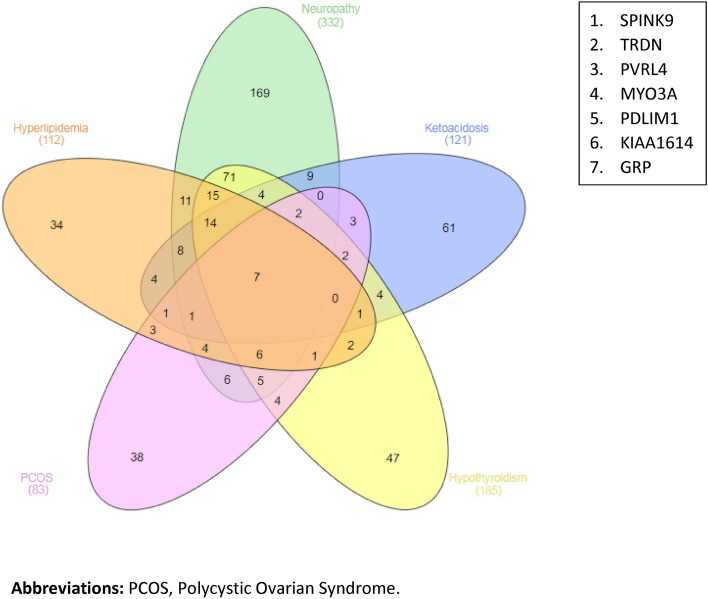
Analysis of upregulated DEGs has shown that the following seven genes were common between all complications of TIDM (hyperlipidemia, neuropathy, ketoacidosis, hypothyroidism and PCOS): SPINK9, TRDN, PVRL4, MYO3A, PDLIM1, KIAA1614 and GRP (Fig. 6).
Figure 6.
Differentially expressed genes common between all complications. A. Upregulated common genes; B. List of the seven upregulated common genes.
Analysis of fold change of upregulated DEGs
Assessment of the relative fold-change of the seven upregulated genes in different T1DM complications showed a significant increase in expression of SPINK9 in T1DM complications compared to DWC, hyperlipidemia (5.28), neuropathy (3.79), ketoacidosis (5.20), hypothyroidism (3.79) and PCOS (5.20) (Table 4). In addition, a significant increase in expression of MYO3A in hyperlipidemia (4.14), neuropathy (6.11), ketoacidosis (2.60), hypothyroidism (4.33) and PCOS (4.49) was observed.
Table 4.
Relative fold changes of upregulated genes in different patients’ groups with T1DM complications compared to healthy control group.
| Upregulated gene name | Patient group | |||||
|---|---|---|---|---|---|---|
| No complication | Hyperlipidaemia | Neuropathy | Ketoacidosis | Hypothyroidism | PCOS | |
| SPINK9a | 1.30 | 5.28 | 3.79 | 5.20 | 3.79 | 5.20 |
| TRDN | 8.15 | 4.23 | 3.47 | 10.92 | 6.07 | 5.72 |
| PVRL4 | 0.71 | 1.92 | 1.77 | 2.13 | 1.18 | 1.18 |
| MYO3Aa | 1.73 | 4.14 | 6.11 | 2.60 | 4.33 | 4.49 |
| PDLIM1 | 3.90 | 2.36 | 3.15 | 2.60 | 2.36 | 1.65 |
| KIAA1614 | 1.81 | 2.36 | 2.17 | 1.89 | 3.74 | 2.36 |
| GRP | 2.06 | 1.63 | 5.69 | 4.23 | 3.25 | 4.88 |
aIndicates significant increases in the expression of the upregulated genes in different T1DM complications compared to no complications.
PCOS Polycystic Ovarian Syndrome.
Prediction of onset of T1DM complications using ROC
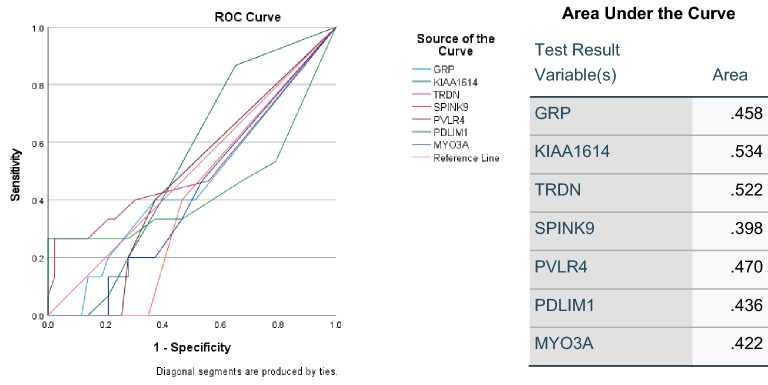
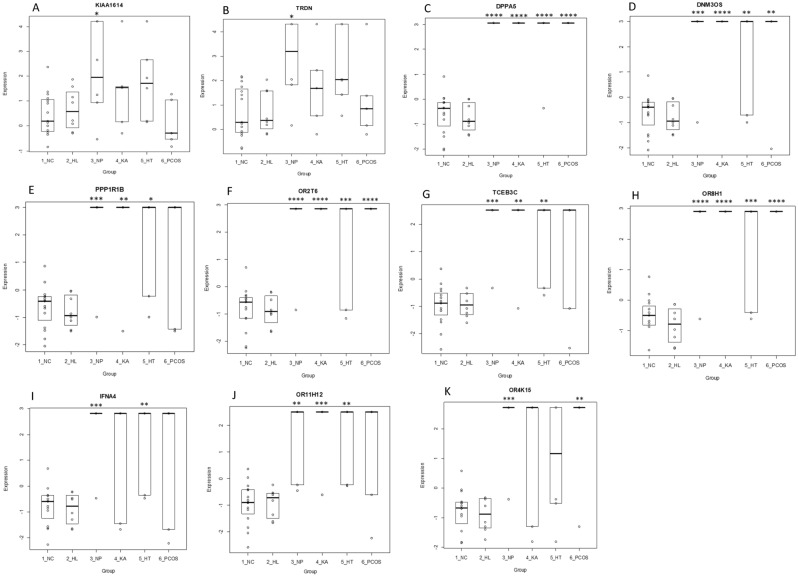
Receiver operating characteristic (ROC) analysis was used to identify predictive trend for the onset of T1DM complications. As shown in Fig. 7, among the common upregulated genes, KIAA1614 and TRDN exhibited higher predictive value of 53% and 52%, respectively. The expression of these DEGs was investigated across all complications of T1DM including in hyperlipidemia, neuropathy, ketoacidosis, hypothyroidism and PCOS (Fig. 8). As shown in Boxplots 8A and 8B, KIAA1614 and TRDN were significantly upregulated in neuropathy (p < 0.05). In addition, significant upregulation was observed in DPPA5, DNM3OS, OR2T6, OR8H1 in four complications including neuropathy, ketoacidosis, hyperlipidemia and PCOs (p < 0.01) (Boxplots 8C, 8D, 8F,8H, respectively). Moreover, neuropathy, ketoacidosis and hyperlipidemia were associated with significant upregulations in expression of PPP1R1B, TCEB3C and OR11H12 as shown in Boxplots 8E, 8G and 8J, respectively. On the other hand, upregulation of IFNA4 was only observed in neuropathy and hypothyroidism and expression of OR4k15 was increased significantly in neuropathy and PCOS as shown by Boxplots 8I and 8K, respectively (P < 0.01).
Figure 7.
ROC curves of common upregulated DEGs between all T1DM complications. (A) ROC curves of upregulated common genes. (B) Area under the ROC curve. ROC receiver operating characteristic.
Figure 8.
Boxplots of upregulated and downregulated genes differentially expressed between DWC and T1DM with complications. Fig. (A,B) show corresponding boxplots for the upregulated genes (KIAA1614, TRDN) whereas Fig. (C–K) show corresponding boxplots for the downregulated genes (DPPA5, DNM3OS, PPP1R1B, OR2T6, TCEB3C, OR8H1, IFNA4, OR11H12, OR4K15). Significance was calculated using one-way ANOVA between the DWC group versus the complication groups. P < 0.05 was considered significant (*P < 0.05; **P < 0.01, ***P < 0.001, ****P < 0.0001). DWC T1DM without complication, HL Hyperlipidemia, NP Neuropathy, HT Hypothyroidism, KA Ketoacidosis, PCOS Polycystic Ovarian Syndrome.
Discussion
The incidence of diabetes has increased dramatically, and the complications that are associated with this chronic disorder represent a major global health challenge and socioeconomic burden20. Therefore, it is crucial to elucidate the genetic susceptibility for development of T1DM complications and identify the DEGs that are involved in the complex pathways of these complications. One of the significant outcomes of the present study is the identification of functional pathways that are involved in regulation of candidate genes that are responsible for the onset and development of T1DM complications. Regulation of ion transport pathway was identified as one of the top five pathways in neuropathy and this was supported by other studies which revealed that cellular and mitochondrial ion transport play a determinant role in pathogenesis of metabolic disorders including diabetes21. Further studies provided evidence for the association between the disturbed ion transport and neuropathy and highlighted ion channels as potential therapeutic target for neuropathy22. Interestingly, mineral absorption pathway was reported as one of the top pathways for regulation of the DEGs in DKA. It is documented that intact mineral absorption is prerequisite for metabolic homeostasis and mineral imbalance affects glucose metabolism and insulin sensitivity, adversely23. It is noteworthy that calcium ion transport pathway was associated with regulation of DEGs in PCOS and this highlighted the importance of calcium imbalance in ovarian pathologies24. It is evident that 50% of PCOS females have severe metabolic disorders including diabetes and recent studies have revealed an association between DEGs and activation of calcium ion binding in obese females with PCOS25.
The present study has, for the first time, identified the common upregulated DEGs between T1DM without complications and T1DM with multiple complications in UAE patients highlighting the candidate genes that may contribute to onset or development of complications in T1DM.
It is noteworthy that out of the seven upregulated DEGs, expression of SPINK9 (Serine protease inhibitor Kazal type 9) and MYO3A (Myosin IIIA) were increased significantly in all T1DM complications compared to TIDM without complication and this highlights an important observation and introduces these two candidate genes as potential biomarkers for developing single or multiple complications in T1DM. Interestingly, previous investigations of Beta pancreatic cells using isolated PPARβ/δ-deficient islet, have demonstrated an association between dysfunctional insulin secretion and abnormal beta cell mass, and upregulation of MYO3A and SPINK926. The latter was originally identified in human skin, particularly in the palmar epidermis, however, more recent studies have shown that SPINK9 is also expressed in the pancreas27. Genetic mutations in other types of SPINK such as SPINK1, which is known as a pancreatic secretory trypsin inhibitor, are associated with chronic pancreatitis emphasizing that regulation of pancreatic proteases is an important factor for prevention of pancreatic autodigestion28. Altered expression of SPINK9 in TIDM complications suggests the involvement of serine protease inhibitors in the pathophysiology of T1DM29. It is noteworthy that SPINK9 was considered as predictor of type 2 diabetes mellitus (T2DM) features including insulin resistance and dyslipidemia29. In addition, interesting findings have suggested the involvement of SPINK9 in different types of motor neuropathy using clinical presentation and measurement of conduction velocities30. Furthermore, several case reports highlighted a correlation between proteose inhibitors therapy and development of diabetic acidosis HIV-infected patients. Although the mechanisms underlying this correlation is unknown, it is postulated that protease inhibitors participate in the peripheral insulin resistance and glucose intolerance31. More importantly, previous investigations have confirmed that uncontrolled serine protease activity leads to profound immune responses and release of proinflammatory mediators32. This was supported by the association between abnormal serine protease activities and manifestations such as hypothyroidism and high serum IgE levels32. These immunometabolism features have also been used to explain the interrelationship between the alterations in skeletal and connective tissues that are associated with some of the diabetic complications including PCOS33. This may also provide an explanation for the increased expression of SPINK9 in PCOS as shown in the present study.
On the other hand, MYO3A (Myosin IIIA) is one of the two genes encoding class III myosin which has isoforms A and B and is mainly expressed in the retina and cochlear hair cells34,35. Therefore, MYO3A mutations are strongly associated with altered photoresponse and survival, and with deafness, autosomal recessive and nonsyndromic hearing loss34. Given the significant involvement of the nervous system in the latter, it is plausible to suggest that MYO3A mutations may lead to neuropathy. This further supports our present finding that expression of MYO3A was significantly increased in T1DM patients with neuropathy. Interestingly, this increased expression of MYO3A was also observed in T1DM patients with hyperlipidemia and previous studies have demonstrated a correlation between abnormal lipid profile such as hypercholesterolemia and single nucleotide polymorphism in MYO3A which eventually affects the cardiac system, adversely36. It is noteworthy that an association was established between the dysfunction of the latter and DKA given the common pathophysiological mechanisms between the disorders which includes oxidative stress and systemic inflammation37.
On the other hand, increased expression of other five genes, TRDN, PVRL4, PDLIM1, KIAA1614 and GRP, has been reported however, this increased fold was not statistically significant. TRDN (Triadin) was first identified to encode an integral membrane protein as a member of the muscle calcium release complex38. Although no previous research has been conducted to investigate the role TRDN in diabetes or glucose homeostasis, a recent case-report has speculated a relationship between genetic aberrations in TRDN and glucose-6-phosphate dehydrogenase deficiency indicating its putative role in complications of T1DM39. PVRL4 (Poliovirus receptor-like 4) gene encodes Nectin-4, a transmembrane glycoprotein and immunoglobulin-like cell adhesion molecule, which is involved in vital cellular processes including polarity, proliferation and differentiation40. Compared to other nectins, Nectin-4 expression dominates during fetal development and early life and this is followed by reduction in Nectin-4 expression with an expectation of abnormalities related to the development of tumor in several tissues including the pancreas41. Upregulation of PVRL4 expression in T1DM patients with multiple complications as shown in the present study proposes an involvement of this gene in the pathophysiology of diabetes but further validation is warranted. PDLIM1 (Human PDZ and LIM domain protein 1), also known as CLP36, is a cytoplasmic LIM protein which is involved in negative regulation of NF-κB-mediated signaling in dendritic cells42. A distinctive expression profile of PDLIM1 which is critically involved in NF-κB-mediated inflammation has been observed in the blood of patients with several chronic diseases including cardiovascular disease, hypertension, dyslipidemia and T2DM43. The latter can be used to hypothesize that the increased expression of PDLIM1 in the present study is involved in development of T1DM complications including hyperlipidemia.
A genome-wide DNA methylation study which investigated newly hypermethylated genes in ulcerative colitis (UC) has demonstrated that KIAA1614 significantly increased promoter methylation levels in UC compared to healthy control44. In addition, genome-wide DNA methylation analysis was used to identify the differentially methylated regions as novel potential epigenetic targets of metformin which is the main antihyperglycemic medication. The analysis has shown that KIAA1614 was one of the main genes with the most consistent changes in the DNA methylation profile which suggests its involvement in energy homeostasis which is one of the main therapeutic targets of metformin45. Given that the main pathological feature underlying T1DM is autoimmune mechanisms, the increased expression of KIAA1614 can reflects the involvement of these mechanisms in development of multiple complications. GRP (Gastrin-releasing peptide) is strongly involved in gastrointestinal inflammatory and metabolic diseases including diabetes46. Emerging evidence in pre-clinical and clinical studies has demonstrated that GRP is a key factor in regulation of glucose homeostasis in diabetes46. This was further supported by the finding that elevated levels of GRP were significantly associated with abnormal glucose metabolism after pancreatitis and increased levels of pro-inflammatory cytokines46. In agreement with these findings, the present study has shown that GRP was one of the top upregulated genes in patients with T1DM complications. Correlations between the latter and GRP were also observed in animal studies which investigated GRP Immunoreactivity in gastrointestinal tract of alloxan induced diabetes47.
On the other hand, the present study suggested an association between downregulated DEGs such as DNM3OS in development of T1DM, skeletal dysplasia and abnormal fat development48. Interestingly, the role of DNM3OS has also been reported in the inflammation that is associated with diabetes wherein abnormal expression of DNM3OS modulates the inflammatory function of macrophages in diabetes49. In addition, involvement of TCEB3C in the pathophysiology of T1DM has been suggested, previously50. This was highlighted by investigating the potential causative genes that increase the risk of developing T1DM and differential expression of TCEB3 was noted in DNA microarray analysis in islet-specific CD4 + T cells of T1DM-susceptible NOD mice 50.
Limitations of the study
One of the main limitations of the study is the sample size, although it is a multicenter study and different sites have been included, the number of patients with T1DM was small and this affected the number of patients in each complication group, adversely. Larger sample size will allow more thorough investigation of the combined complications as the present study evaluated each complication separately.
Conclusion
The present study is the first to provide transcriptomic analysis for the common DEGs in Emirati patients with T1DM complications. Several functional pathways that regulate these DEGs were described including ion transport, mineral absorption and cytosolic calcium concentrations. In addition, upregulated DEGs that were common among all T1DM complications were identified. This included SPINK9, TRDN, PVRL4, MYO3A, PDLIM1, KIAA1614 and GRP. The findings of the present study support the potentiality of SPINK9 and MYO3A as candidate biomarkers for development of T1DM complications. The study provides a reference for further in-depth studies to validate the involvement of these DEGs in onset and development of T1DM complications.
Supplementary Information
Acknowledgements
The study was supported by grant from Sheikh Hamdan Bin Rashid Al Maktoum Award (MRG/32/2017) to Bashair M Mussa. The authors would like to thank all subjects who involved in the present study for their valuable participation.
Author contributions
B.M.M. designed and developed the study. T.V., A.S. performed the experiments and analyzed the data. B.M.M., R.H. interpreted the results of the experiments. T.V., A.S. prepared the figures. B.M.M. drafted the manuscript. A.A. recruited the participants and processed the samples. A.A., A.B., F.A., K.H., S.A. participate in the recruitment and provided the clinical analysis of the data. All authors have read, revised, and agreed to the published version of the manuscript.
Competing interests
The authors declare no competing interests.
Footnotes
Publisher's note
Springer Nature remains neutral with regard to jurisdictional claims in published maps and institutional affiliations.
Supplementary Information
The online version contains supplementary material available at 10.1038/s41598-022-18997-w.
References
- 1.Mobasseri M, et al. Prevalence and incidence of type 1 diabetes in the world: A systematic review and meta-analysis. Health Promot. Perspect. 2020;10:98–115. doi: 10.34172/hpp.2020.18. [DOI] [PMC free article] [PubMed] [Google Scholar]
- 2.Bommer C, Heesemann E, Sagalova V, Manne-Goehler J, Atun R, Bärnighausen T, Vollmer S. The global economic burden of diabetes in adults aged 20–79 years: a cost-of-illness study. Lancet Diabetes Endocrinol. 2017;5(6):423–430. doi: 10.1016/S2213-8587(17)30097-9. [DOI] [PubMed] [Google Scholar]
- 3.Mukhopadhyay N, Noble JA, Govil M, Marazita ML, Greenberg DA. Identifying genetic risk loci for diabetic complications and showing evidence for heterogeneity of type 1 diabetes based on complications risk. PLoS ONE. 2018;13:e0192696. doi: 10.1371/journal.pone.0192696. [DOI] [PMC free article] [PubMed] [Google Scholar]
- 4.Lipner EM, Tomer Y, Noble JA, Monti MC, Lonsdale JT, Corso B, Greenberg DA. Linkage analysis of genomic regions contributing to the expression of type 1 diabetes microvascular complications and interaction with HLA. J. Diabetes Res. 2015;2015:694107. doi: 10.1155/2015/694107. [DOI] [PMC free article] [PubMed] [Google Scholar]
- 5.Monti MC, Lonsdale JT, Montomoli C, Montross R, Schlag E, Greenberg DA. Familial risk factors for microvascular complications and differential male-female risk in a large cohort of American families with type 1 diabetes. J. Clin. Endocrinol. Metab. 2007;92:4650–4655. doi: 10.1210/jc.2007-1185. [DOI] [PubMed] [Google Scholar]
- 6.Nucci AM, Virtanen SM, Cuthbertson D, Ludvigsson J, Einberg U, Huot C, Castano L, Aschemeier B, Becker DJ, Knip M, Krischer JP, TRIGR Investigators Growth and development of islet autoimmunity and type 1 diabetes in children genetically at risk. Diabetologia. 2021;64(4):826–835. doi: 10.1007/s00125-020-05358-3. [DOI] [PMC free article] [PubMed] [Google Scholar]
- 7.Nyaga DM, Vickers MH, Jefferies C, Perry JK, O'Sullivan JM. The genetic architecture of type 1 diabetes mellitus. Mol. Cell Endocrinol. 2018;477:70–80. doi: 10.1016/j.mce.2018.06.002. [DOI] [PubMed] [Google Scholar]
- 8.Finn BP, Power C, McSweeney N, Breen D, Wyse G, O'Connell SM. Subarachnoid and parenchymal haemorrhages as a complication of severe diabetic ketoacidosis in a preadolescent with new onset type 1 diabetes. Pediatr. Diabetes. 2018;19:1487–1491. doi: 10.1111/pedi.12760. [DOI] [PubMed] [Google Scholar]
- 9.Hekkala A, Ilonen J, Knip M, Veijola R, The Finnish Paediatric Diabetes Register Family history of diabetes and distribution of class II HLA genotypes in children with newly diagnosed T1D: Effect on diabetic ketoacidosis. Eur. J. Endocrinol. 2011;165:813–817. doi: 10.1530/EJE-11-0376. [DOI] [PubMed] [Google Scholar]
- 10.Marigliano M, et al. Diabetic ketoacidosis at diagnosis: Role of family history and class II HLA genotypes. Eur. J. Endocrinol. 2012;168:107–111. doi: 10.1530/EJE-12-0541. [DOI] [PubMed] [Google Scholar]
- 11.Wiltshire EJ, Hirte C, Couper JJ. Dietary fats do not contribute to hyperlipidemia in children and adolescents with type 1 diabetes. Diabetes Care. 2003;26:1356–1361. doi: 10.2337/diacare.26.5.1356. [DOI] [PubMed] [Google Scholar]
- 12.Nocoń-Bohusz J, Wikiera B, Basiak A, Śmigiel R, Noczyńska A. LPL gene mutation as the cause of severe hypertriglyceridemia in the course of ketoacidosis in a patient with newly diagnosed type 1 diabetes mellitus. Pediatr. Endocrinol. Diabetes Metab. 2016;21:89–92. doi: 10.18544/PEDM-21.02.0029. [DOI] [PubMed] [Google Scholar]
- 13.Escobar-Morreale HF, Roldán-Martín MB. Type 1 diabetes and polycystic ovary syndrome: systematic review and meta-analysis. Diabetes Care. 2016;39:639–648. doi: 10.2337/dc15-2577. [DOI] [PubMed] [Google Scholar]
- 14.Biondi B, Kahaly GJ, Robertson RP. Thyroid dysfunction and diabetes mellitus: Two closely associated disorders. Endocr Rev. 2019;40:789–824. doi: 10.1210/er.2018-00163. [DOI] [PMC free article] [PubMed] [Google Scholar]
- 15.Li H, Durbin R. Fast and accurate short read alignment with Burrows–Wheeler transform. Bioinformatics. 2009;25:1754–1760. doi: 10.1093/bioinformatics/btp324. [DOI] [PMC free article] [PubMed] [Google Scholar]
- 16.Li H, Durbin R. Fast and accurate long-read alignment with Burrows–Wheeler transform. Bioinformatics. 2010;26:589–595. doi: 10.1093/bioinformatics/btp698. [DOI] [PMC free article] [PubMed] [Google Scholar]
- 17.Ning Z, Cox AJ, Mullikin JC. SSAHA: A fast search method for large DNA databases. Genome Res. 2001;11:1725–1729. doi: 10.1101/gr.194201. [DOI] [PMC free article] [PubMed] [Google Scholar]
- 18.Li H. Exploring single-sample SNP and INDEL calling with whole-genome de novo assembly. Bioinformatics. 2012;28:1838–1844. doi: 10.1093/bioinformatics/bts280. [DOI] [PMC free article] [PubMed] [Google Scholar]
- 19.Smith TF, Waterman MS. Identification of common molecular subsequences. J. Mol. Biol. 1981;147:195–197. doi: 10.1016/0022-2836(81)90087-5. [DOI] [PubMed] [Google Scholar]
- 20.Guo J, et al. Whole-genome sequencing of Finnish type 1 diabetic siblings discordant for kidney disease reveals DNA variants associated with diabetic nephropathy. J. Am. Soc. Nephrol. 2020;31:309–323. doi: 10.1681/ASN.2019030289. [DOI] [PMC free article] [PubMed] [Google Scholar]
- 21.Cardoso AR, Queliconi BB, Kowaltowski AJ. Mitochondrial ion transport pathways: Role in metabolic diseases. Biochim. Biophys. Acta. 2010;1797:832–838. doi: 10.1016/j.bbabio.2009.12.017. [DOI] [PubMed] [Google Scholar]
- 22.Schmidt AP, Schmidt SR. Behavior of ion channels controlled by electric potential difference and of Toll-type receptors in neuropathic pain pathophysiology. Rev. Dor. São Paulo. 2016;17(Suppl 1):S43–S45. [Google Scholar]
- 23.Dubey P, Thakur V, Chattopadhyay M. Role of minerals and trace elements in diabetes and insulin resistance. Nutrients. 2020;12:1864. doi: 10.3390/nu12061864. [DOI] [PMC free article] [PubMed] [Google Scholar]
- 24.Caravia L, Staicu CE, Radu BM. Altered organelle calcium transport in ovarian physiology and cancer. Cancers. 2020;12:2232. doi: 10.3390/cancers12082232. [DOI] [PMC free article] [PubMed] [Google Scholar]
- 25.Chehin MB, Fraietta R, Lorenzon AR, Bonetti TCS, Motta ELA. The insulin signaling pathway is dysregulated in cumulus cells from obese, infertile women with polycystic ovarian syndrome with an absence of clinical insulin resistance. Ther. Adv. Reprod. Health. 2020;14:2633494120906866. doi: 10.1177/2633494120906866. [DOI] [PMC free article] [PubMed] [Google Scholar]
- 26.Iglesias J, et al. PPARβ/δ affects pancreatic β cell mass and insulin secretion in mice. J. Clin. Invest. 2012;122:4105–4117. doi: 10.1172/JCI42127. [DOI] [PMC free article] [PubMed] [Google Scholar]
- 27.Brattsand M, Stefansson K, Hubiche T, Nilsson SK, Egelrud T. SPINK9: A selective, skin-specific Kazal-type serine protease inhibitor. J. Invest. Dermatol. 2009;129:1656–1665. doi: 10.1038/jid.2008.448. [DOI] [PubMed] [Google Scholar]
- 28.Witt H, et al. Mutations in the gene encoding the serine protease inhibitor Kazal type 1 are associated with chronic pancreatitis. Nat. Genet. 2000;25:213–216. doi: 10.1038/76088. [DOI] [PubMed] [Google Scholar]
- 29.Gudmundsdottir V, et al. Circulating protein signatures and causal candidates for type 2 diabetes. Diabetes. 2020;69:1843–1853. doi: 10.2337/db19-1070. [DOI] [PMC free article] [PubMed] [Google Scholar]
- 30.Strauss KA, et al. Genomic diagnostics within a medically underserved population: efficacy and implications. Genet. Med. 2018;20:31–41. doi: 10.1038/gim.2017.76. [DOI] [PubMed] [Google Scholar]
- 31.Hughes CA, Taylor GD. Metformin in an HIV-infected patient with protease inhibitor-induced diabetic ketoacidosis. Ann. Pharmacother. 2001;35:877–880. doi: 10.1345/aph.10179. [DOI] [PubMed] [Google Scholar]
- 32.Petrova E, Hovnanian A. Advances in understanding of Netherton syndrome and therapeutic implications. Expert. Opin. Orphan. Drugs. 2020;11:455–487. [Google Scholar]
- 33.Manti M, Stener-Victorin E, Benrick A. Skeletal muscle immunometabolism in women with polycystic ovary syndrome: A meta-analysis. Front. Physiol. 2020;11:573505. doi: 10.3389/fphys.2020.573505. [DOI] [PMC free article] [PubMed] [Google Scholar]
- 34.Dosé AC, Burnside B. Cloning and chromosomal localization of a human class III myosin. Genomics. 2000;67:333–342. doi: 10.1006/geno.2000.6256. [DOI] [PubMed] [Google Scholar]
- 35.Li P, Wen Z, Zhang G, Zhang A, Fu X, Gao J. Knock-in mice with Myo3a Y137C mutation displayed progressive hearing loss and hair cell degeneration in the inner ear. Neural Plast. 2018;2018:4372913. doi: 10.1155/2018/4372913. [DOI] [PMC free article] [PubMed] [Google Scholar]
- 36.Ma Y, Gong Y, Garg A, Zhou H. Compound heterozygous familial hypercholesterolemia in a Chinese boy with a de novo and transmitted low-density lipoprotein receptor mutation. J. Clin. Lipidol. 2018;12:230–235. doi: 10.1016/j.jacl.2017.10.005. [DOI] [PubMed] [Google Scholar]
- 37.Foster JR, Morrison G, Fraser DD. Diabetic ketoacidosis-associated stroke in children and youth. Stroke Res. Treat. 2011;2011:219706. doi: 10.4061/2011/219706. [DOI] [PMC free article] [PubMed] [Google Scholar]
- 38.Marty I. Triadin: a multi-protein family for which purpose? Cell. Mol. Life Sci. 2004;61(15):1850–1853. doi: 10.1007/s00018-004-4196-7. [DOI] [PMC free article] [PubMed] [Google Scholar]
- 39.O'Callaghan BM, et al. A unique triadin exon deletion causing a null phenotype. Heart Rhythm Case Rep. 2018;4:514–518. doi: 10.1016/j.hrcr.2018.07.014. [DOI] [PMC free article] [PubMed] [Google Scholar]
- 40.Tanaka Y, Murata M, Oda Y, Furue M, Ito T. Nectin cell adhesion molecule 4 (NECTIN4) expression in cutaneous squamous cell carcinoma: A new therapeutic target? Biomedicines. 2021;9:355. doi: 10.3390/biomedicines9040355. [DOI] [PMC free article] [PubMed] [Google Scholar]
- 41.Challita-Eid PM, Satpayev D, Yang P, et al. Enfortumab Vedotin antibody-drug conjugate targeting Nectin-4 is a highly potent therapeutic agent in multiple preclinical cancer models. Cancer Res. 2016;76:3003–3013. doi: 10.1158/0008-5472.CAN-15-1313. [DOI] [PubMed] [Google Scholar]
- 42.Ono R, Kaisho T, Tanaka T. PDLIM1 inhibits NF-κB-mediated inflammatory signaling by sequestering the p65 subunit of NF-κB in the cytoplasm. Sci. Rep. 2015;5:18327. doi: 10.1038/srep18327. [DOI] [PMC free article] [PubMed] [Google Scholar]
- 43.Ripoll G, Cuadrado A. Distinctive under-expression profile of inflammatory and redox genes in the blood of elderly patients with cardiovascular disease. J. Inflamm. Res. 2021;14:429–442. doi: 10.2147/JIR.S280328. [DOI] [PMC free article] [PubMed] [Google Scholar]
- 44.Kang K, Bae JH, Han K, Kim ES, Kim TO, Yi JM. A genome-wide methylation approach identifies a new hypermethylated gene panel in ulcerative colitis. Int. J. Mol. Sci. 2016;17:1291. doi: 10.3390/ijms17081291. [DOI] [PMC free article] [PubMed] [Google Scholar]
- 45.Elbere I, et al. Significantly altered peripheral blood cell DNA methylation profile as a result of immediate effect of metformin use in healthy individuals. Clin. Epigenet. 2018;10:156. doi: 10.1186/s13148-018-0593-x. [DOI] [PMC free article] [PubMed] [Google Scholar]
- 46.Pendharkar SA, et al. Gastrin-releasing peptide and glucose metabolism following pancreatitis. Gastroenterol. Res. 2017;10:224–234. doi: 10.14740/gr890w. [DOI] [PMC free article] [PubMed] [Google Scholar]
- 47.Uche-Nwachi E, Mitchell C. Effect of alloxan-diabetes on gastrin-releasing peptide (grp) immunoreactivity in the gastrointestinal tract, of sprague dawley rats and how this may affect some of the diabetic complications. OJBS. 2007;7:3–7. [Google Scholar]
- 48.Loebel DA, Tsoi B, Wong N, Tam PP. A conserved noncoding intronic transcript at the mouse Dnm3 locus. Genomics. 2005;85:782–789. doi: 10.1016/j.ygeno.2005.02.001. [DOI] [PubMed] [Google Scholar]
- 49.Das S. Diabetes mellitus-induced long noncoding RNA Dnm3os regulates macrophage functions and inflammation via nuclear mechanisms. Arterioscler. Thromb. Vasc. Biol. 2018;38:1806–1820. doi: 10.1161/ATVBAHA.117.310663. [DOI] [PMC free article] [PubMed] [Google Scholar]
- 50.Berry GJ, Frielle C, Brucklacher RM, Salzberg AC, Waldner H. Identifying type 1 diabetes candidate genes by DNA microarray analysis of islet-specific CD4 + T cells. Genom. Data. 2015;5:184–188. doi: 10.1016/j.gdata.2015.05.041. [DOI] [PMC free article] [PubMed] [Google Scholar]
Associated Data
This section collects any data citations, data availability statements, or supplementary materials included in this article.


