Abstract
Objective
To investigate the feasibility of using a deep learning-based analysis of auscultation data to predict significant stenosis of arteriovenous fistulas (AVF) in patients undergoing hemodialysis requiring percutaneous transluminal angioplasty (PTA).
Materials and Methods
Forty patients (24 male and 16 female; median age, 62.5 years) with dysfunctional native AVF were prospectively recruited. Digital sounds from the AVF shunt were recorded using a wireless electronic stethoscope before (pre-PTA) and after PTA (post-PTA), and the audio files were subsequently converted to mel spectrograms, which were used to construct various deep convolutional neural network (DCNN) models (DenseNet201, EfficientNetB5, and ResNet50). The performance of these models for diagnosing ≥ 50% AVF stenosis was assessed and compared. The ground truth for the presence of ≥ 50% AVF stenosis was obtained using digital subtraction angiography. Gradient-weighted class activation mapping (Grad-CAM) was used to produce visual explanations for DCNN model decisions.
Results
Eighty audio files were obtained from the 40 recruited patients and pooled for the study. Mel spectrograms of “pre-PTA” shunt sounds showed patterns corresponding to abnormal high-pitched bruits with systolic accentuation observed in patients with stenotic AVF. The ResNet50 and EfficientNetB5 models yielded an area under the receiver operating characteristic curve of 0.99 and 0.98, respectively, at optimized epochs for predicting ≥ 50% AVF stenosis. However, Grad-CAM heatmaps revealed that only ResNet50 highlighted areas relevant to AVF stenosis in the mel spectrogram.
Conclusion
Mel spectrogram-based DCNN models, particularly ResNet50, successfully predicted the presence of significant AVF stenosis requiring PTA in this feasibility study and may potentially be used in AVF surveillance.
Keywords: Angioplasty, Deep learning, Arteriovenous fistula, Auscultation, Renal dialysis
INTRODUCTION
Hemodialysis is a major renal replacement therapy for patients with end-stage renal disease (ESRD) that requires a functioning arteriovenous fistula (AVF) or arteriovenous graft [1]. However, over time, vascular thrombosis or stenosis occurs, and AVF tends to become dysfunctional. Hence, the accurate diagnosis of significant AVF stenosis and timely intervention are crucial for maintaining dialysis access.
The latest 2019 Kidney Disease Outcomes Quality Initiative guidelines [2] recommend screening for AVF stenosis through regular physical examinations, including palpation and auscultation, by a health practitioner with moderate quality of evidence. AVF stenosis can be screened via auscultation based on abnormal blood flow, which is referred to as a high-pitched bruit. Auscultation is non-invasive compared to digital subtraction angiography (DSA), which is the current gold standard for assessing vascular stenosis [3], and is simple and convenient compared to Doppler ultrasonography, which requires expensive equipment and skilled operators. However, diagnoses based on sound can be subjective and rely on the practitioner's clinical experience. Moreover, even a trained practitioner cannot quantify stenosis severity based on auscultation alone. Considering that the main indications for percutaneous transluminal angioplasty (PTA) are significant stenosis (≥ 50% of the lumen) or obstruction, it is difficult to accurately assess whether a patient needs PTA [4] based on bruit.
However, the quantification of auscultation and extraction of features to detect the presence of significant stenosis requiring PTA using deep learning can aid health practitioners in screening patients with ESRD who require angioplasty. Recent technical advances have enabled computer-based approaches, particularly artificial intelligence, to automatically interpret stethoscope-recorded sounds for telemedicine and self-screening [5,6].
This pilot study aimed to evaluate the feasibility of using deep convolutional neural network (DCNN) models that analyze auscultation-based mel spectrograms to predict hemodynamically significant (≥ 50%) AVF stenosis.
MATERIALS AND METHODS
Study Population
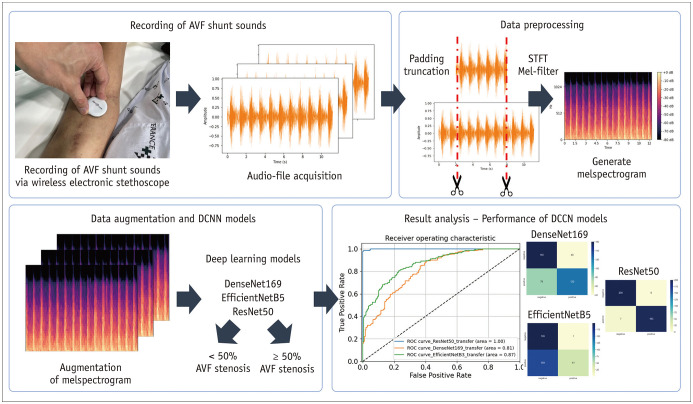
This single-center prospective study was approved by the Institutional Review Board of our hospital (IRB No. 2020-2715-009). Patients with autologous AVFs who were referred for PTA owing to clinical signs of significant stenosis (pulsation, prolonged hemostasis time, and increased circuit pressure) were assessed for eligibility. Informed consent was obtained from all patients. The inclusion and exclusion criteria are summarized in Table 1. Forty patients with ESRD were enrolled in this study from November 2020 to August 2021. Patients’ baseline characteristics were obtained from their electronic medical records. The framework of this study is shown in Figure 1.
Table 1. Inclusion and Exclusion Criteria of the Study Population.
| Inclusion criteria | |
| 1. Native AVF at least 60 days before tde procedure tdat had been used for dialysis for at least 8 of 12 sessions during a 4-week period, ensuring fistula maturity | |
| 2. ≥ 50% stenosis documented on fistulogram | |
| Exclusion criteria | |
| 1. Thrombosed AVF | |
| 2. Age < 18 years | |
AVF = arteriovenous fistula
Fig. 1. Framework of the proposed DCNN models.
AVF = arteriovenous fistula, DCNN = deep convolutional neural network
Digital Subtraction Angiography (DSA) and Percutaneous Transluminal Angioplasty (PTA)
One board-certified interventional radiologist with seven years of experience performed all DSA and PTA procedures. The fistula was accessed under ultrasound guidance, and a 7F vascular sheath was inserted at an appropriate puncture site along the AVF. The balloon was sized based on the diameter of the adjacent normal segment of the vein. Angioplasty was performed using the manufacturer’s stated burst pressure and was maintained for at least 30 seconds until the waist deformity of the balloon catheter was completely effaced. Procedural endpoint or technical success was defined as less than 30% residual stenosis or restoration of the thrill on palpation. Clinical success was defined as the restoration of blood flow to a level permitting at least one dialysis treatment after PTA. The degree of AVF stenosis was quantified using the open-source software ImageJ (US National Institute of Health) by measuring the vessel diameter at the most stenotic site and proximal non-stenotic site using DSA images before and after PTA. Each stenosis was independently measured three times, and the values were averaged. Complications were classified as major or minor according to the practice guidelines of the Society of Interventional Radiology [7].
Data: Recording of AVF Shunt Sounds
A wireless electronic stethoscope (Stemoscope, Hulu Devices) was used to record shunt sounds by placing it on top of the venous access 1–2 cm distal to the anastomosis site for 10–15 seconds. Shunt sounds were recorded before and after PTA and were labeled “pre-PTA” and “post-PTA,” respectively. A total of 80 AVF shunt sounds (40 pre-PTA and 40 post-PTA) were recorded and saved as .wav audio files. These 80 sounds were pooled for this study. According to DSA findings, all patients had significant (≥ 50%) stenosis before PTA, but none after. Therefore, all pre- and post-PTA sounds were categorized as positive and negative, respectively.
Data: Preprocessing and Feature Extraction
Because the length of each audio file varied due to manual recording, the audio files were trimmed or padded to a length of 6 seconds using the Python library Librosa [8]. In this study, we used a mel spectrogram for feature extraction because it is one of the most widely used methods for audio data representation [9,10]. To obtain a mel spectrogram, the audio file was first mapped from the time domain to the frequency domain using a short-time Fourier transform with a window length of 25 ms and stride length of 10 ms. The frequency was subsequently converted to a mel scale and amplitude-to-color dimensions using mel filters to generate a mel spectrogram, representing the short-term power spectrum of sound. Each mel spectrogram was again normalized and resized to a resolution of 128 × 128 with three channels with the x-axis, y-axis, and color representing the time, frequency (Hz), and magnitude of amplitude, respectively.
Data: Augmentation
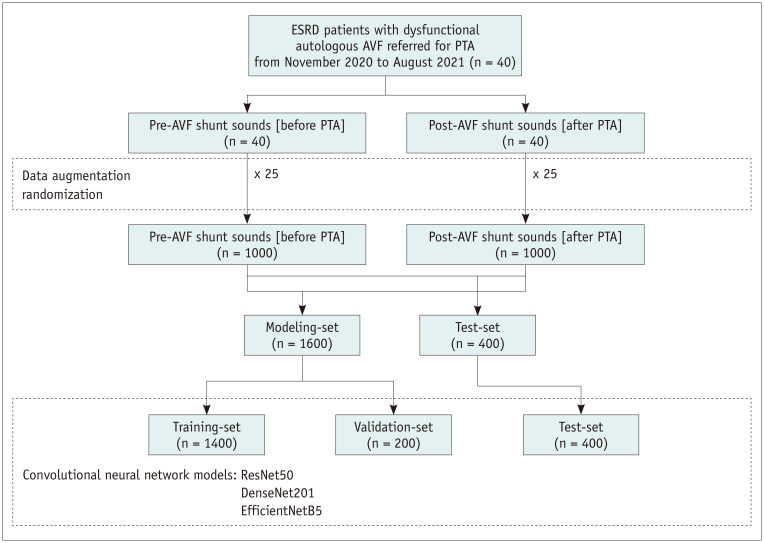
The synthetic minority over-sampling technique (SMOTE) algorithm was used to generate synthetic mel spectrograms from existing neighboring mel spectrograms to best represent real-world data that may be obtained in clinical settings [11]. Data augmentation was performed 25 times (Fig. 2).
Fig. 2. Study flowchart.
AVF = arteriovenous fistula, ESRD = end-stage renal disease, PTA = percutaneous transluminal angioplasty
Model: DCNN Structure
In this study, widely used convolutional neural network architectures, including DenseNet201 [12], EfficientNetB5 [13], and ResNet50 [14], were used to construct DCNN models for predicting hemodynamically significant AVF stenosis. Two fully connected layers using a rectified linear unit as the activation function were added after the Conv-pool layers with 2048 and 2048 neurons, and two dropout layers (rate = 0.5) were added after the first and second dense layers for regularization and to avoid model overfitting. Finally, for binary classification, a final layer with one neuron was added using the softmax activation function. DCNN models were initialized with ImageNet weights and compiled with categorical cross-entropy as a loss function and a root mean square propagation [15] optimizer with a learning rate of 0.0001. The models were trained with batch sizes of 10 and 50 epochs. Each dataset was randomly divided into training, validation, and test sets using split ratios of 70%, 10%, and 20%, respectively (Fig. 2). Gradient-weighted class activation mapping (Grad-CAM) [16] was used to produce visual explanations for DCNN model decisions.
Model: Implementation
All codes were written and executed on Google Colab (https://colab.research.google.com, n.d.), which provided 12 Gb of random access memory and an NVIDIA Tesla K80 graphics processing unit. Python version 3.10.4, along with the Python libraries NumPy, pandas, scikit-learn, TensorFlow, and Keras, was used.
Evaluation: Metrics and Statistical Analyses
The performance of the DCNN models for diagnosing ≥ 50% AVF stenosis was evaluated using the area under the receiver operating characteristics curve (AUROC) and using a confusion matrix, precision (i.e., positive predictive value), accuracy, recall (i.e., hit rate, sensitivity, or true positive rate), and F-1 score by applying a diagnostic cutoff of ≥ 0.5 for the final model output. The ground truth for the presence of ≥ 50% AVF stenosis was based on the results of DSA. Statistical analyses were performed using Google Colab or SAS software version 9.4 (SAS Institute).
RESULTS
Study Population Characteristics
The baseline characteristics of patients are summarized in Table 2. The median age of the 40 patients with ESRD was 62.5 years, and 24 male and 16 female comprised the cohort. The most common AVF types were brachial-cephalic (55%), radial-cephalic (40%), and brachial-basilic (5%). More than half (26/40, 65%) of all patients underwent PTA at least once prior to referral. All patients demonstrated technical and clinical success after PTA. There were no major complications, and one patient developed a hematoma after the procedure.
Table 2. Baseline Patient Characteristics.
| Age, years* | 62.5 (53.0–69.8) | |
| Sex | ||
| Male | 24 (60) | |
| Female | 16 (40) | |
| AVF type | ||
| Brachial-cephalic | 22 (55) | |
| Radial-cephalic | 16 (40) | |
| Brachial-basilic | 2 (5) | |
| Location of stenosis | ||
| Juxta-anastomotic vein | 21 (53) | |
| Cephalic arch | 12 (30) | |
| Cannulation zone | 7 (18) | |
| Previous PTA (+) | ||
| Number (x) of previous PTA | 26 (65) | |
| n ≤ 2 | 28 (70) | |
| 2 < n ≤ 5 | 8 (20) | |
| 5 < n ≤ 8 | 2 (5) | |
| 8 < n | 2 (5) | |
| ESRD etiology | ||
| Diabetic nephropathy | 26 (65) | |
| Hypertensive nephropathy | 3 (8) | |
| C1q nephropathy | 2 (5) | |
| RPGN | 1 (3) | |
| ADPKD | 1 (3) | |
| Unknown | 7 (18) | |
| Comorbidities | ||
| Type 2 diabetes mellitus | 26 (65) | |
| Hypertension | 26 (65) | |
| Heart failure | 4 (10) | |
| Hyperlipidemia | 9 (23) | |
| Coronary artery occlusive disease | 10 (25) | |
| Peripheral artery occlusive disease | 2 (5) | |
| Current smoker | 12 (30) | |
| Body mass index* | 22.7 (21.0–25.1) | |
| Median time between AVF formation date and PTA (days)* | 839.5 (529.0–1351.5) | |
| Median AVF stenosis (%) before PTA* | 59.1 (49.1–65.2) | |
| Median AVF stenosis (%) after PTA* | 23.4 (15.1–36.4) | |
| Median diameter (mm) of vessel* | 6.8 (5.2–11.2) | |
| Median flow (mL/min)* | 491.4 (246.2–772.9) | |
| Clinical success | 40 (100) | |
Data area number of patients with % in parentheses, unless specified otherwise. *Data are presented as median values with the 25th percentile and 75th percentile in parentheses. ADPKD = autosomal dominant polycystic kidney disease, AVF = arteriovenous fistula, ESRD = end-stage renal disease, PTA = percutaneous transluminal angioplasty, RPGN = rapidly progressive glomerulonephritis
Mel Spectrograms of Pre-PTA and Post-PTA Shunt Sounds
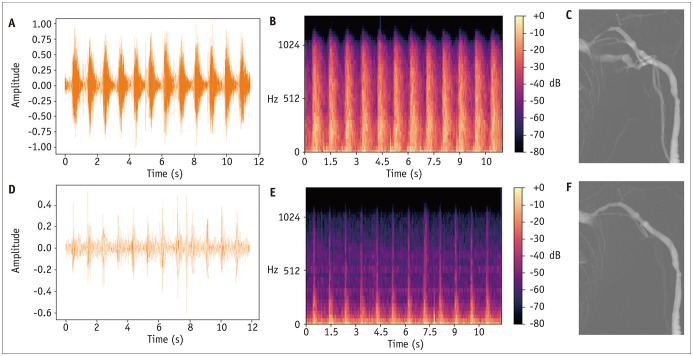
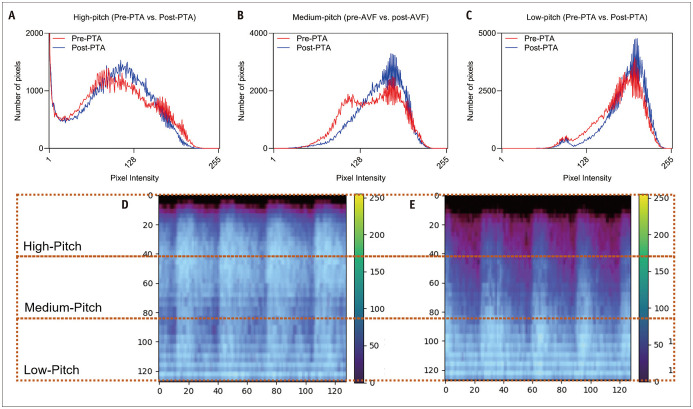
Mel spectrograms generated from AVF shunt sounds before (pre-PTA) and after PTA (post-PTA) qualitatively correlated with the degree of AVF stenosis. The pre-PTA mel spectrogram showed a greater magnitude of amplitude at high frequency, primarily during the systolic phase, corresponding to the known high-pitched bruit with systolic accentuation in patients with stenotic AVF (Fig. 3). To quantitatively confirm this finding, the mel spectrograms were equally subdivided into three categories of high-, medium-, and low-pitch frequencies, and histograms showing the number of pixels for each magnitude of amplitude (or pixel/sound intensity) for both pre-PTA and post-PTA shunt sounds were constructed (Fig. 4). At high-pitch frequencies, pre-PTA shunt sounds had a higher number of pixels with high-pixel intensities than that of post-PTA shunt sounds. At medium- to low-pitch frequencies, post-PTA shunt sounds showed a higher number of pixels with high-pixel intensities than that of pre-PTA shunt sounds.
Fig. 3. Audio signals (amplitude vs. time) (A, D), mel spectrograms (B, E), and digital subtraction angiography image (C, F) of 61-year-old males with brachiocephalic fistula and cephalic arch stenosis.
A-F. A, B, and C represent images before PTA (“pre-PTA”), and D, E, and F represent images after PTA (“post-PTA”). Compared to the post-PTA sound, the pre-PTA sound shows a stronger magnitude of the audio signal and higher pixel signal intensities at high-pitch frequencies with systolic accentuation in mel spectrograms. PTA = percutaneous transluminal angioplasty
Fig. 4. Histograms showing the number of pixels at various pixel intensities at (A) high-, (B) medium-, (C) low-pitch frequencies of AVF shunt sounds before and after PTA and mel spectrograms of (D) pre-PTA and (E) post-PTA shunt sounds.
AVF = arteriovenous fistula, PTA = percutaneous transluminal angioplasty
Performance of DCNN Models for Predicting Hemodynamically Significant Stenosis
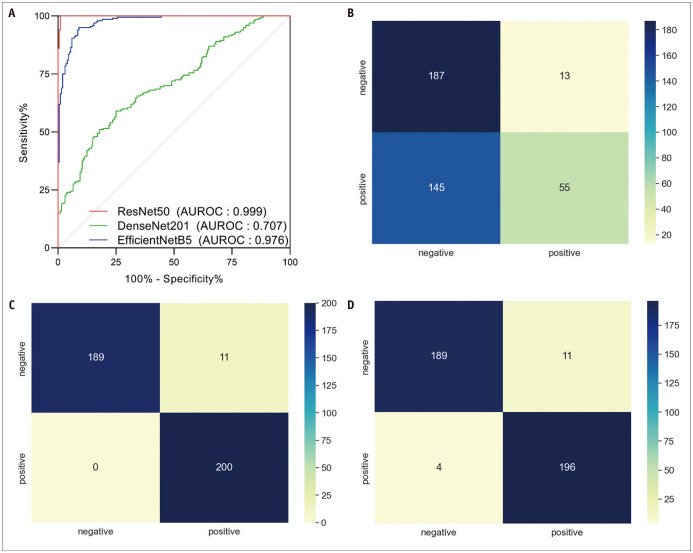
Three convolutional neural network architectures (DenseNet201, EfficientNetB5, and ResNet50) were used to construct the DCNN models, and their performance metrics are listed in Table 3. The training and validation sets showed similar accuracy and loss at epochs ≥ 40 for DenseNet201, ≥ 12 epochs for EfficientNetB5, and ≥ 19 epochs for ResNet50 (Supplementary Fig. 1). At these optimized epochs, the AUROCs of the DenseNet201, EfficientNetB5, and ResNet50 models were 0.70, 0.98, and 0.99, respectively (Fig. 5). However, Grad-CAM heatmaps of DenseNet201 and EfficientNetB5 indicated areas in the mel spectrogram that were irrelevant to AVF stenosis (Supplementary Fig. 2). In contrast, the Grad-CAM heatmaps of ResNet50 highlighted areas in the borders of high- and medium-pitch frequencies as well as medium- and low-pitch frequencies pertaining to the difference between pre-PTA and post-PTA shunt sounds.
Table 3. Precision, Recall, and F-1 Score of DenseNet201, EfficientNetB5, and ResNet50 DCNN Models for Predicting Hemodynamically Significant Arteriovenous Fistula Stenosis.
| Model | AUROC | Precision | Recall | F-1 Score |
|---|---|---|---|---|
| DenseNet201 | 0.70 | 0.81 | 0.28 | 0.42 |
| EfficientNetB5 | 0.98 | 0.95 | 1.0 | 0.97 |
| ResNet50 | 0.99 | 0.95 | 0.98 | 0.96 |
AUROC = area under the receiver operating characteristics curve, DCNN = deep convolutional neural network
Fig. 5. Receiver operating characteristic curves of the DenseNet201, EfficientNetB5, and ResNet50 models in predicting hemodynamically significant arteriovenous fistula stenosis in need of percutaneous transluminal angioplasty (A) and confusion matrixes of the DenseNet201 (B), EfficientNetB5 (C), and ResNet50 (D) models.
AUROC = area under the receiver operating characteristics curve
DISCUSSION
The proposed mel spectrogram-based DCNN models successfully predicted significant AVF stenosis requiring PTA. Mel spectrograms generated from auscultation showed patterns corresponding to abnormal high-pitched bruits with systolic accentuation observed in stenotic AVF. Histograms of the magnitude of amplitude for pre-PTA and post-PTA shunt sounds based on high-, medium-, and low-pitch frequencies also confirmed this finding. Except for DenseNet201, EfficientNetB5 and ResNet50 showed AUROCs > 0.95 at optimized epochs in predicting significant AVF stenosis, and Grad-CAM heatmaps showed that only ResNet50 reached decisions based on explainable differences in the mel spectrogram.
Mel spectrogram patterns of pre-PTA and post-PTA shunt sounds were consistent with those of the time-frequency domain obtained through the S-transform-based method by Wang et al. [17]. In Wang et al. [17] study, the spectra of blood flow sounds of non-stenotic AVFs were mainly distributed between 200 and 600 Hz, whereas those of stenotic AVFs were mainly distributed from 600–800 Hz. Moreover, stenotic AVF showed narrower features at higher frequencies, which is similar to our results. The narrower spectrum at higher frequencies can be thought to physiologically correspond to the seagull murmur generated by turbulence in the narrow vessels [18]. This murmur is most prominent in the systolic phase as a large amount of blood flow is transmitted rapidly through the arteriovenous anastomosis, allowing turbulence and murmur formation. Previous studies [19,20,21] have demonstrated that the frequency of this murmur correlates with the diameter of the fistula and confirmed that a higher pitch of murmur is produced with a narrower fistula. These findings are consistent with the fact that the blood flow sound intensities at higher frequencies tend to increase with stenosis, as demonstrated by our histograms. When the heart systole ends, the pumped blood flow is reduced, also reducing the spectral amplitude of the background blood flow sound, causing turbulence from the remaining blood flow to maintain spectral features at low pitch frequencies. This explains why pre-PTA shunt sounds showed a similar or slightly lower number of pixels at similar sound intensities at medium- to low-pitch frequencies than post-PTA shunt sounds.
Mel spectrogram-based DCNN models showed high diagnostic performance in predicting significant AVF stenosis, regardless of the type of DCNN architecture used to construct the model. Glangetas et al. [22] previously proposed the idea of an autonomous stethoscope developed by integrating an artificial intelligence algorithm into portal digital stethoscopes, which can be simply turned into a smartphone accessory [23]. While this idea was originally proposed to classify lung sounds, significant AVF stenosis requiring PTA may be monitored and screened using the above DCNN models to allow for timely interventions, which may lead to increased AVF patency and longevity [24,25].
This study has several limitations. First, this pilot study included a small number of patients, all of whom had venous outflow stenosis and underwent interventions by a single interventional radiologist, which may have contributed to selection bias. The primary focus of this study was to assess the feasibility of applying DCNN models to predict significant AVF stenosis requiring PTA. However, the post-PTA shunt sounds of the same patients from whom pre-PTA shunt sounds were obtained, instead of shunt sounds from completely different patients with AVF, were used as controls owing to ethical issues with performing DSA on patients with AVF without a clinical sign of stenosis. The inclusion of a more diverse group of patients without AVF stenosis should introduce more variation in the mel spectrogram, and the performance of the DCNN model may be lower than that presented herein. Further studies that include a more diverse group of patients without dysfunctional AVFs are warranted to validate whether these models can be used to screen for significant stenosis in general patients undergoing hemodialysis. Second, owing to the paucity of AVF shunt sounds, the SMOTE algorithm was used to generate synthetic mel spectrograms, and a separate external test set was not used. Third, mel spectrograms are the only type of visual representation of audio data, and for simplicity, the use of other representations, including harmonic-percussive spectrograms or scattergrams, has not been explored [26]. Fourth, recording of the shunt sound was performed collectively at venous access 1–2 cm from the anastomosis site before performing DSA, regardless of the stenosis site. Recording at this site may not have fully captured the degree of stenosis at proximal sites, including the cephalic arch, and the performance of DCCN models may have been improved if auscultation was performed at the site of stenosis. Finally, DSA was used as a reference instead of other imaging modalities, including Doppler ultrasonography, because DSA is the current gold standard for assessing vascular stenosis [3].
In conclusion, mel spectrogram-based DCNN models, particularly ResNet50, successfully predicted the presence of significant AVF stenosis requiring PTA in this feasibility study and may potentially be used in AVF surveillance.
Footnotes
Conflicts of Interest: The authors have no potential conflicts of interest to disclose.
- Conceptualization: Jae Hyon Park, Insun Park, Kichang Han.
- Data curation: Jae Hyon Park, Insun Park, Kichang Han.
- Formal analysis: Jae Hyon Park, Insun Park, Jongjin Yoon.
- Funding acquisition: Kichang Han.
- Investigation: Jae Hyon Park, Kichang Han.
- Methodology: Jae Hyon Park, Insun Park, Jongjin Yoon, Kichang Han.
- Project administration: Kichang Han.
- Resources: Kichang Han, Jong Yun Won.
- Software: Jae Hyon Park, Insun Park, Jongjin Yoon, Yongsik Sim.
- Supervision: Kichang Han.
- Validation: Kichang Han.
- Visualization: Jae Hyon Park, Insun Park.
- Writing—original draft: Jae Hyon Park, Insun Park, Jongjin Yoon, Kichang Han.
- Writing—review & editing: Jae Hyon Park, Insun Park, Jongjin Yoon, Yongsik Sim, Soo Jin Kim, Jong Yun Won, Shina Lee, Joon Ho Kwon, Sungmo Moon, Gyoung Min Kim, Man-deuk Kim.
Funding Statement: None
Availability of Data and Material
The datasets generated or analyzed during the study are available from the corresponding author on reasonable request.
Supplement
The Supplement is available with this article at https://doi.org/10.3348/kjr.2022.0364.
References
- 1.Brescia MJ, Cimino JE, Appel K, Hurwich BJ. Chronic hemodialysis using venipuncture and a surgically created arteriovenous fistula. N Engl J Med. 1966;275:1089–1092. doi: 10.1056/NEJM196611172752002. [DOI] [PubMed] [Google Scholar]
- 2.Lok CE, Huber TS, Lee T, Shenoy S, Yevzlin AS, Abreo K, et al. KDOQI clinical practice guideline for vascular access: 2019 update. Am J Kidney Dis. 2020;75(4 Suppl 2):S1–S164. doi: 10.1053/j.ajkd.2019.12.001. [DOI] [PubMed] [Google Scholar]
- 3.Lin YP, Wu MH, Ng YY, Lee RC, Liou JK, Yang WC, et al. Spiral computed tomographic angiography--a new technique for evaluation of vascular access in hemodialysis patients. Am J Nephrol. 1998;18:117–122. doi: 10.1159/000013319. [DOI] [PubMed] [Google Scholar]
- 4.Bountouris I, Kritikou G, Degermetzoglou N, Avgerinos KI. A review of percutaneous transluminal angioplasty in hemodialysis fistula. Int J Vasc Med. 2018;2018:1420136. doi: 10.1155/2018/1420136. [DOI] [PMC free article] [PubMed] [Google Scholar]
- 5.Bardou D, Zhang K, Ahmad SM. Lung sounds classification using convolutional neural networks. Artif Intell Med. 2018;88:58–69. doi: 10.1016/j.artmed.2018.04.008. [DOI] [PubMed] [Google Scholar]
- 6.Messner E, Fediuk M, Swatek P, Scheidl S, Smolle-Jüttner FM, Olschewski H, et al. Multi-channel lung sound classification with convolutional recurrent neural networks. Comput Biol Med. 2020;122:103831. doi: 10.1016/j.compbiomed.2020.103831. [DOI] [PubMed] [Google Scholar]
- 7.Sacks D, McClenny TE, Cardella JF, Lewis CA. Society of interventional radiology clinical practice guidelines. J Vasc Interv Radiol. 2003;14(9 Pt 2):S199–S202. doi: 10.1097/01.rvi.0000094584.83406.3e. [DOI] [PubMed] [Google Scholar]
- 8.McFee B, Raffel C, Liang D, Ellis DP, McVicar M, Battenberg E, et al. Librosa: audio and music signal analysis in python; Proceedings of the 14th Python in Science Conference; 2015 Jul 6-12; Austin, TX, USA: SciPy; 2015. pp. 18–25. [Google Scholar]
- 9.Palanisamy K, Singhania D, Yao A. Rethinking CNN models for audio classification. [cited 2020 Jul 1];arXiv [Preprint] 2020 doi: 10.48550/arXiv.2007.11154. Available at: [DOI] [Google Scholar]
- 10.Sehgal A, Kehtarnavaz N. A convolutional neural network smartphone app for real-time voice activity detection. IEEE Access. 2018;6:9017–9026. doi: 10.1109/ACCESS.2018.2800728. [DOI] [PMC free article] [PubMed] [Google Scholar]
- 11.Chawla NV, Bowyer KW, Hall LO, Kegelmeyer WP. SMOTE: synthetic minority over-sampling technique. J Artif Intell Res. 2002;16:321–357. [Google Scholar]
- 12.Huang G, Liu Z, Van Der Maaten L, Weinberger KQ. Densely connected convolutional networks; Proceedings of the IEEE Conference on Computer Vision and Pattern Recognition (CVPR); 2017 Jul 22-25; Honolulu, HI, USA: IEEE; 2017. pp. 4700–4708. [Google Scholar]
- 13.Tan M, Le Q. Efficientnet: rethinking model scaling for convolutional neural networks; Proceedings of the 36th International Conference on Machine Learning; 2019 Jun 9-15; Long Beach, CA, USA: PMLR; 2019. pp. 6105–6114. [Google Scholar]
- 14.He K, Zhang X, Ren S, Sun J. Deep residual learning for image recognition; Proceedings of the IEEE Conference on Computer Vision and Pattern Recognition (CVPR); 2016 Jun 27-30; Las Vegas, NV, USA: IEEE; 2016. pp. 770–778. [Google Scholar]
- 15.Kingma DP, Ba J. Adam: a method for stochastic optimization. [cited 2020 Jul 1];arXiv [Preprint] 2014 doi: 10.48550/arXiv.1412.6980. Available at: [DOI] [Google Scholar]
- 16.Selvaraju RR, Cogswell M, Das A, Vedantam R, Parikh D, Batra D. Grad-cam: visual explanations from deep networks via gradient-based localization; Proceedings of the IEEE International Conference on Computer Vision (ICCV); 2017 Jul 22-25; Venice, Italy: IEEE; 2017. pp. 618–626. [Google Scholar]
- 17.Wang HY, Wu CH, Chen CY, Lin BS. Novel noninvasive approach for detecting arteriovenous fistula stenosis. IEEE Trans Biomed Eng. 2014;61:1851–1857. doi: 10.1109/TBME.2014.2308906. [DOI] [PubMed] [Google Scholar]
- 18.Hayek CS, Thompson WR, Tuchinda C, Wojcik RA, Lombardo JS. Wavelet processing of systolic murmurs to assist with clinical diagnosis of heart disease. Biomed Instrum Technol. 2003;37:263–270. doi: 10.2345/0899-8205(2003)37[263:WPOSMT]2.0.CO;2. [DOI] [PubMed] [Google Scholar]
- 19.Akay M, Akay YM, Welkowitz W, Lewkowicz S. Investigating the effects of vasodilator drugs on the turbulent sound caused by femoral artery stenosis using short-term Fourier and wavelet transform methods. IEEE Trans Biomed Eng. 1994;41:921–928. doi: 10.1109/10.324523. [DOI] [PubMed] [Google Scholar]
- 20.Mansy HA, Hoxie SJ, Patel NH, Sandler RH. Computerised analysis of auscultatory sounds associated with vascular patency of haemodialysis access. Med Biol Eng Comput. 2005;43:56–62. doi: 10.1007/BF02345123. [DOI] [PubMed] [Google Scholar]
- 21.Sato T, Tsuji K, Kawashima N, Agishi T, Toma H. Evaluation of blood access dysfunction based on a wavelet transform analysis of shunt murmurs. J Artif Organs. 2006;9:97–104. doi: 10.1007/s10047-005-0327-7. [DOI] [PubMed] [Google Scholar]
- 22.Glangetas A, Hartley MA, Cantais A, Courvoisier DS, Rivollet D, Shama DM, et al. Deep learning diagnostic and risk-stratification pattern detection for COVID-19 in digital lung auscultations: clinical protocol for a case-control and prospective cohort study. BMC Pulm Med. 2021;21:103. doi: 10.1186/s12890-021-01467-w. [DOI] [PMC free article] [PubMed] [Google Scholar]
- 23.Vasudevan RS, Horiuchi Y, Torriani FJ, Cotter B, Maisel SM, Dadwal SS, et al. Persistent value of the stethoscope in the age of COVID-19. Am J Med. 2020;133:1143–1150. doi: 10.1016/j.amjmed.2020.05.018. [DOI] [PMC free article] [PubMed] [Google Scholar]
- 24.McCarley P, Wingard RL, Shyr Y, Pettus W, Hakim RM, Ikizler TA. Vascular access blood flow monitoring reduces access morbidity and costs. Kidney Int. 2001;60:1164–1172. doi: 10.1046/j.1523-1755.2001.0600031164.x. [DOI] [PubMed] [Google Scholar]
- 25.Tessitore N, Lipari G, Poli A, Bedogna V, Baggio E, Loschiavo C, et al. Can blood flow surveillance and pre-emptive repair of subclinical stenosis prolong the useful life of arteriovenous fistulae? A randomized controlled study. Nephrol Dial Transplant. 2004;19:2325–2333. doi: 10.1093/ndt/gfh316. [DOI] [PubMed] [Google Scholar]
- 26.Nanni L, Costa YM, Aguiar RL, Mangolin RB, Brahnam S, Silla CN. Ensemble of convolutional neural networks to improve animal audio classification. J Audio Speech Music Proc. 2020;2020:8 [Google Scholar]
Associated Data
This section collects any data citations, data availability statements, or supplementary materials included in this article.
Supplementary Materials
Data Availability Statement
The datasets generated or analyzed during the study are available from the corresponding author on reasonable request.


