Figure.

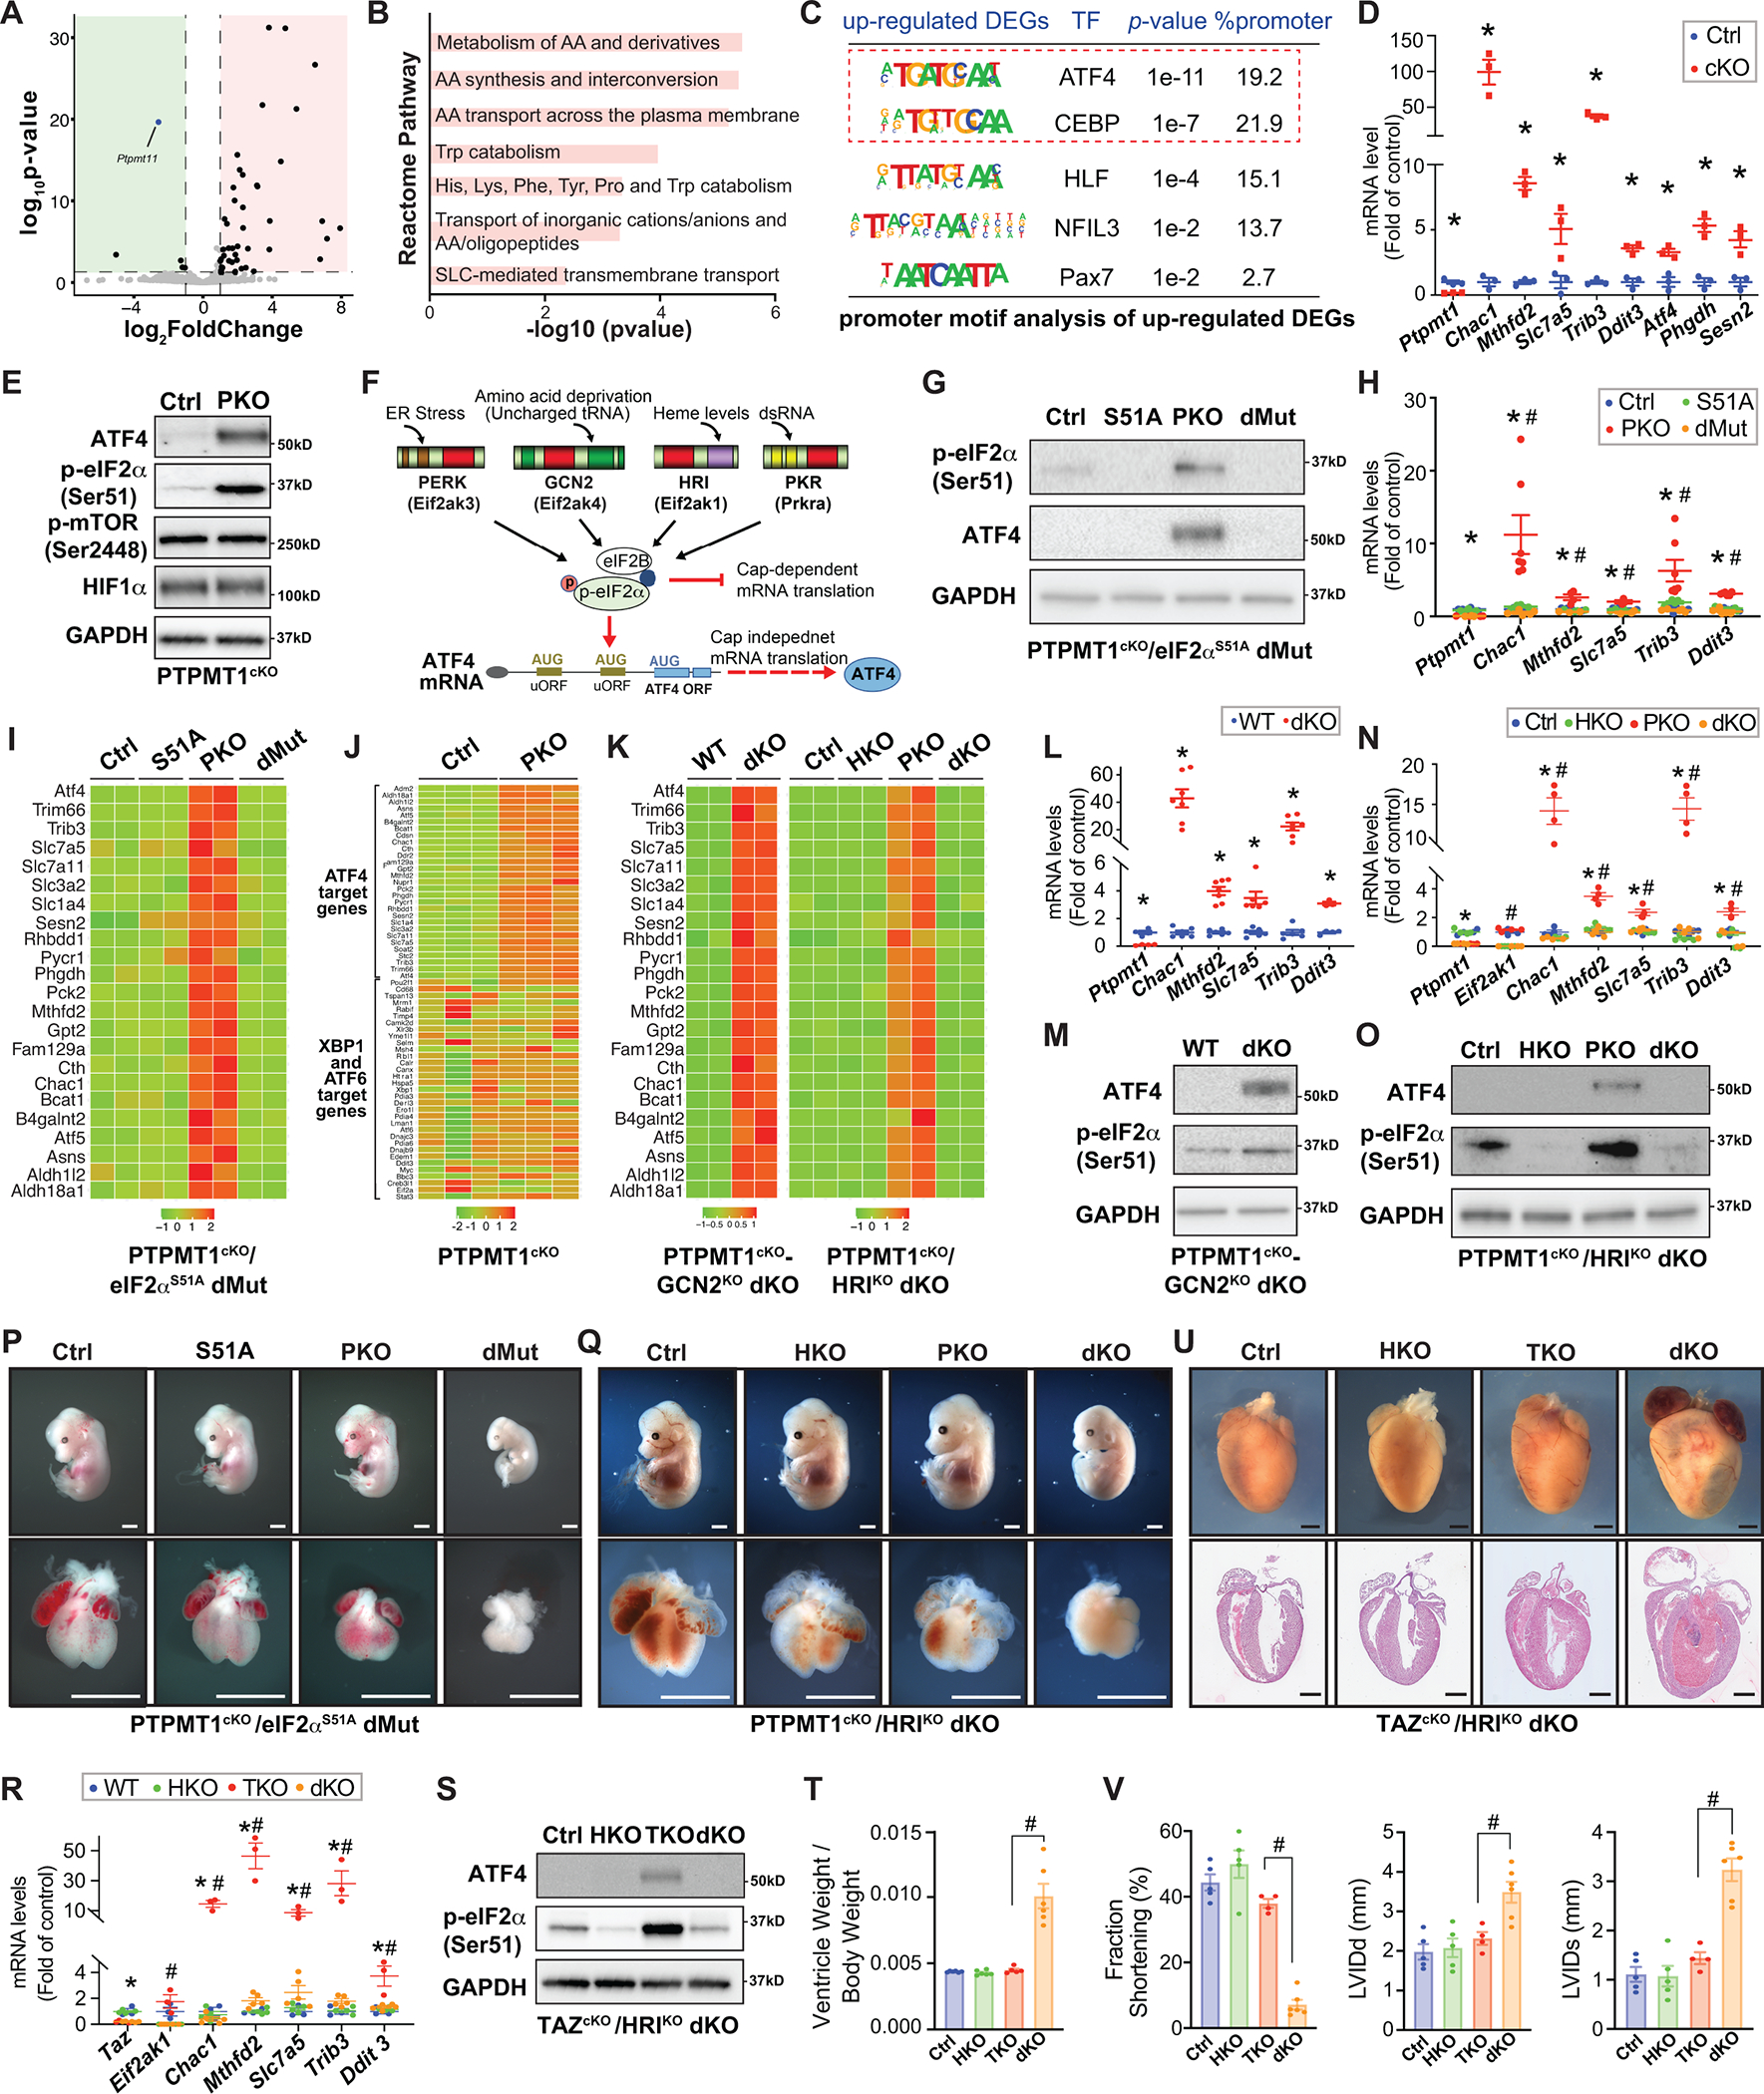
A. Volcano plot obtained from DESeq2 analysis of gene expression in Ptpmt1 cardiomyocyte-specific knockout (Ptpmt1f/f; Xml-Cre+; PKO) versus Cre negative control hearts at E11.5. Genes with adjusted P<0.05 and log2 (fold change) >1 are considered significantly upregulated or downregulated genes in PKO hearts. Green indicates downregulated genes; red indicates upregulated genes. n=3 per group. RNAseq data was deposited to the GEO database (Accession number: GSE201042). B. Functional clustering analysis utilizing the Reactome database revealed that deletion of PTPMT1 in cardiomyocytes significantly upregulates pathways involved in amino acid metabolism, which is classically found to be regulated by ATF4. AA: amino acid; Trp: tryptophan; His: histidine; Lys: lysine; Phe: phenylalanine; SLC: solute carrier superfamily. C. Motif enrichment analysis at promoter regions (±2 kb from transcription start sites) of the genes that were upregulated in PKO hearts revealed that the top enriched transcription factor binding motifs were the ATF4 and its cofactors C/EBP (CCAAT/enhancer-binding protein) or C/EBP homologous protein binding motifs. DEGs: differentially expressed genes. D. qRT-PCR validated the upregulation of classic ATF4 target genes in PKO (red) versus control (Ctrl, blue) hearts at E11.5. n=3–4 per group. E. Western blot analysis of ATF4, phosphorylated eIF2α at Serine 51 (Ser51), phosphorylated mTOR at Serine 2448 (Ser2448), and HIF1α, in PKO and Ctrl hearts at E11.5. n=4 per group. F. Model for eIF2α ‐mediated translational control of ATF4 in response to diverse cellular stress responses. G. Western blot analysis of ATF4 and phosphorylated eIF2α at Ser51 and ATF4 in eIF2αS51A mutant (Ptpmt1f/f; eIF2αm/m; Xml-Cre−) (S51A), PKO (Ptpmt1f/f; eIF2α+/+; Xml-Cre+), PKO/eIF2αS51A double mutant (dMut) (Ptpmt1f/f; eIF2αm/m; Xml-Cre+), and control (Ctrl) (Ptpmt1f/f; eIF2α+/+; Xml-Cre−) hearts at E11.5. n=4 per group. H. qRT-PCR analysis of ATF4 target genes in S51A, PKO, dMut, and Ctrl hearts at E11.5. n=3–4 per group. I. Heatmap representation of transcript levels of selected ATF4 target genes in S51A, PKO, dMut, and Ctrl hearts at E11.5. J. Heatmap representation of transcript levels of selected ER stress-induced genes, including the target genes of ATF4, and XBP1 and ATF6 in PKO and Ctrl hearts at E11.5. K. Heatmap representation of transcript levels of selected ATF4 target genes in PKO/GCN2 double knockout (dKO) (Ptpmt1 f/f-Eif2ak4−/−; Xml-Cre+) and wildtype control (WT) (Ptpmt1 +/+-Eif2ak4+/+; Xml-Cre−) hearts (left), and HRI null (HKO) (Ptpmt1f/f; Eif2ak4−/−; Xml-Cre−), PKO (Ptpmt1f/f; Eif2ak4+/+; Xml-Cre+), PKO/HRI dKO (Ptpmt1f/f; Eif2ak4−/−; Xml-Cre+), and Ctrl (Ptpmt1f/f; Eif2ak4+/+; Xml-Cre−) hearts (right). Note: the genes that encode GCN2 and PTPMT1 are at the same allele, so we could not obtain single knockout littermates. L. qRT-PCR analysis of ATF4 target genes in PKO/GCN2 dKO and WT hearts at E11.5, n=5–7 per group. M. Western blot analysis of ATF4 and phosphorylated eIF2a at Ser51 in PKO/GCN2 dKO and WT hearts. n=4 per group. N. qRT-PCR analysis of ATF4 target genes in HKO, PKO, PKO/HRI dKO, and Ctrl hearts at E11.5, n=3–4 per group. O. Western blot analysis of ATF4 and phosphorylated eIF2a at Serine 51 (Ser51) in HKO, PKO, PKO/HRI dKO, and Ctrl hearts. n=4 per group. P. Whole embryonic (top) and heart (bottom) morphology of S51A, PKO, dMut, and Ctrl hearts at E13.5. Scale bar: 1 mm. Q. Whole embryonic (top) and heart (bottom) morphology of HKO, PKO, PKO/HRI dKO, and Ctrl hearts at E14.5. Scale bar: 1 mm. R. qRT-PCR analysis of ATF4 target genes in HKO (Tazf/Y; Eif2ak4−/−; Xml-Cre−), Tafazzin cardiomyocyte-specific knockout (TKO) (Tazf/Y; Eif2ak4+/+; Xml-Cre+), TKO/HRI dKO (Tazf/Y; Eif2ak4−/−; Xml-Cre+), and Ctrl (Tazf/Y; Eif2ak4+/+; Xml-Cre−) hearts at postnatal day (P) 7. n=3–4 per group. S. Western blot analysis of ATF4 and phosphorylated eIF2α at Serine 51 (Ser51) in HKO, TKO, TKO/HRI dKO, and Ctrl hearts at P7. n=4 per group. T. Cardiac ventricular weight (VW) to body weight (BW) ratio for HKO, TKO, TKO/HRI dKO, and Ctrl hearts at P7. n= 5–7 per group. U. Whole-mount (top) and H&E stained sections (bottom) for HKO, TKO, TKO/HRI dKO, and Ctrl hearts at P8. Scale bar: 1 mm. V. Echocardiographic measurements of left ventricular percentage of fractional shortening (% FS) (left), end-diastolic LV internal diameter (LVIDd) (middle), and end-systolic LV internal diameter (LVIDs) (right) for HKO, TKO, TKO/HRI dKO, and Ctrl mice at P7. n = 4–6 mice per group. GAPDH was used as a loading control for western blots. qRT-PCR data were normalized to corresponding 18S levels, and levels in mutants are expressed as the fold-change versus Ctrl. Data are represented as the mean ± SEM. *P < 0.05 PKO, TKO, or dMut, or dKO vs. Ctrl, or as indicated; #P < 0.05 dMut or dKO vs. PKO or TKO, or as indicated, by 2-tailed Student’s t test (two group comparison) or two-way ANOVA (four group comparison).
