

Abstract
The growing need for new and reliable surface sensing methods is arousing interest in the electromagnetic excitations of ultrathin films, i.e., to generate electromagnetic field distributions that resonantly interact with the most significant quasi-particles of condensed matter. In such a context, Bloch surface waves turned out to be a valid alternative to surface plasmon polaritons to implement high-sensitivity sensors in the visible spectral range. Only in the last few years, however, has their use been extended to infrared wavelengths, which represent a powerful tool for detecting and recognizing molecular species and crystalline structures. In this work, we demonstrate, by means of high-resolution reflectivity measurements, that a one-dimensional photonic crystal can sustain Bloch surface waves in the infrared spectral range from room temperature down to 10 K. To the best of our knowledge, this is the first demonstration of infrared Bloch surface waves at cryogenic temperatures. Furthermore, by exploiting the enhancement of the surface state and the high brilliance of infrared synchrotron radiation, we demonstrate that the proposed BSW-based sensor has a sensitivity on the order of 2.9 cm–1 for each nanometer-thick ice layer grown on its surface below 150 K. In conclusion, we believe that Bloch surface wave-based sensors are a valid new class of surface mode-based sensors for applications in materials science.
Keywords: Bloch surface waves, mid-infrared, materials science, spectroscopy, sensing
Introduction
Infrared (IR) spectroscopy is a powerful tool to investigate the properties of most significant quasi-particles in condensed matter by detecting their spectral “fingerprints”, i.e., their vibrational absorption lines.1,2 As is well known, the relevant range of wavelengths is from 2.0 to 25 μm, i.e., the mid-IR region (MIR).
In the present work, we intend to demonstrate the potential of a novel surface-enhanced IR spectroscopy scheme for application in low-dimensionality condensed matter systems at cryogenic temperatures, down to 10 K. The proposed scheme exploits the strong field localization provided by Bloch surface waves (BSWs) sustained at the interface between a finite one-dimensional photonic crystal (1D-PC) and vacuum. From this perspective, many applications can be expected for BSWs, like the extension of our precedent work on low-dimensional topological insulators3 and the application to the study of other features of low-dimensional systems, such as phonon overtones and combination bands in hybrid perovskites,4 Dirac-like dispersion of electronic states in doped graphene5 and spectroscopy under extreme conditions as in planetary atmospheres.6
In the last few decades, several strategies to improve the MIR capability to sense at the micro/nanoscale were developed and applied to a large number of practical issues, ranging from medical diagnostics to the detection of environmental pollution.2,7,8 Several methods make use of the strong electromagnetic field confinement occurring at the interface between different materials9,10 to detect molecular species in the proximity of structural boundaries.11,12 A large number of MIR sensors were actually fabricated, based for example on surface phonon polariton annihilation/creation in semiconductors,13−15 non-neutral graphene,16,17 and metals.18−20
Among such classes of novel sensors, dielectric heterostructures housing a 1D-PC have been recently investigated.2,21 In a 1D-PC, the refractive index modulation along the stacking direction defines an optical lattice and, accordingly, the dispersion of light propagating inside the 1D-PC22 is strongly distorted, as demonstrated by the appearance of a photonic band (PB) structure. PC and their photonic band (PB) have been a very intensively investigated research field.23−25 Less attention was paid to the excitation of BSWs at the surface of a finite PC, particularly to the electromagnetic modes localized at the boundary between a truncated 1D-PC and an external homogeneous medium.22 Similar to surface plasmon polaritons, BSWs are characterized by an electric field envelope, which decays exponentially both inside the 1D-PC and the external medium.22,26,27 BSW-based sensors working in the visible range showed enhanced resolution for the detection of molecular species in a wide range of applications.28−30 Surprisingly, the interest toward BSWs in the MIR region has increased only recently,2,21 driven by the need for overcoming the sensitivity shortcomings of MIR spectroscopy, when applied to very thin films, and on the track of previously proposed methods, such as photoexpansion31 and grazing-angle spectroscopy with polarized IR beams.3,32−35 The 1D-PC geometry offers options to design and optimize for specific applications.36 The PB of a 1D-PC has been demonstrated to be robust and tolerant to a significant amount of deviation from the designed structure.37−39 A threshold level of disorder in 1D-PCs has been found in ref (40): σth ≈ (Δω/3ωc)1/2, where σth is the width of a Gaussian distribution of the optical lengths of the PC period and Δω and ωc are the photonic band gap width and photonic band gap central frequency, respectively. Below the threshold, the photonic band gap is stable in the presence of disorder.40 As far as we know, the robustness of surface-enhanced 1D-PC sensing schemes at extreme temperatures needed for the investigation of MIR excitations in low-dimensional systems has not been tested so far. This study is then the first mandatory step for the application of BSWs to such a field, an important test for the 1D-PC fabrication technology, and the possibility to integrate the scheme with the peculiar properties of the IR radiation emerging from the AILES beamline of the SOLEIL synchrotron.41
In addition to that, but not less important, this work demonstrates experimentally the BSW molecular sensing capability to detect molecular fingerprints at cryogenic temperatures, using water vapor as a molecular species, which condensates into a thin ice layer onto the 1D-PC surface even under moderately high vacuum conditions. We demonstrate that BSWs are sensitive to molecular layers of a few nanometers added on the top surface, with a phenomenological behavior that can be directly attributed to the water vapor–ice sublimation cycle.
Materials and Methods
1D-PC Materials and Design
The materials of choice to fabricate the 1D-PC are CaF2 and ZnS; both show high transparency and a convenient refractive index mismatch in the MIR spectral range. Based on the literature values of the respective refractive indices,42,43 the geometry of the 1D-PC was designed and tuned to the MIR wavelength range by means of several rounds of numerical simulations (see Section S1 of the Supporting Information (SI)). The designed layer structure was CaF2(substrate)/[ZnS(200 nm)/CaF2(2300 nm)]2/ZnS(50 nm)/vacuum, which can sustain BSWs with a suitable dispersion, which, in agreement with the literature,40 is stable toward the random inhomogeneities of the thicknesses of the layers arising from fabrication uncertainty (see Section S1 and Figure S.2 of the SI).
1D-PCs were fabricated by thermal evaporation in a high-vacuum chamber, with a limiting pressure of 5 × 10⁻⁷ Torr, equipped with two evaporation sources.44 CaF2 and ZnS layers could therefore be deposited without breaking the vacuum from granulated materials (UMICORE, purity 99.99%) using molybdenum boats. They were deposited on CaF2-truncated prisms, purchased from Korth Kristalle, with a 55° base angle and designed to operate in a Kretschmann–Raether (KR) configuration under total internal reflection (TIR) conditions45 (see Figure 1a). We preliminarily deposited a 20 nm thick CaF2 layer on the CaF2 substrates to improve adhesion and avoid delamination of the first ZnS layer. The main issue in the deposition of multilayers is strain accumulation that increases with the layer thickness and may cause undesirable buckling and bending.46,47
Figure 1.

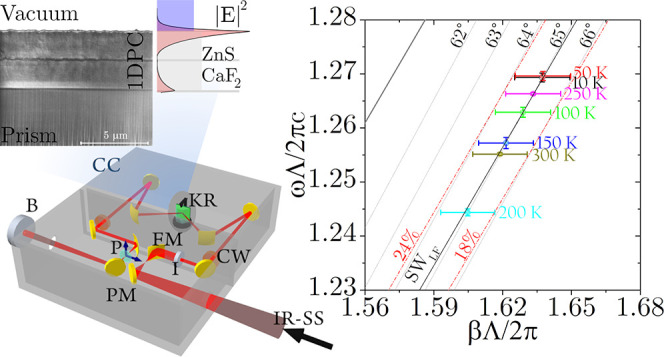
(a) Sketch of the Kretschmann–Raether configuration. The prism is quoted and the radiation wavevector k has been decomposed in its parallel, β, and perpendicular, kx, components. (b) Scanning electron microscopy (SEM) image of the focused ion beam (FIB) milled cross-section of the deposited 1D-PC and a sketch of the transverse geometry with measured layer thicknesses. (c) R(θ,λ) reflectance map according to the transfer-matrix method (TMM) calculation for σ polarization. The black and red lines are the photonic band edges (BEs), calculated for the infinitely extended 1D-PC. The surface waves (SWs) and the band-edge (BE) modes appear as dark reflectance lines. In the insets, we plot the square modulus of the electric fields of the modes, superimposed on the 1D-PC refractive index distribution. The external medium is vacuum.
Preliminary test samples and the final 1D-PC were characterized by dual-beam focused ion beam (FIB) milling cross-sectional analysis, scanning electron microscopy (SEM), and near-normal incidence reflectance. SEM inspection of CaF2/ZnS/CaF2 test structures deposited on CaF2 substrates appeared undamaged even after immersion in liquids and after strong ultrasound treatments.21
The SEM image of the FIB cross-section of a 1D-PC deposited on the prism is shown in Figure 1b (for details see Section S2 in the SI). The first CaF2 (∼20 nm) adhesion layer is not visible in the image, while one can clearly distinguish the 1D-PC structure composed of the two ZnS/CaF2 binary units (dark yellow and green in the lateral sketch, respectively) and the final 35 nm thick ZnS defect layer (dark yellow). From the image, we retrieved the effective 1D-PC geometry Prism/ZnS(1)/CaF2(1)/ZnS(2)/CaF2(2)/ZnS/vacuum with measured thicknesses of 0.200(±0.015)/2.50(±0.07)/0.205(±0.025)/2.45(±0.10)/0.035(±0.020) μm, respectively. The 1D-PC surface profile, according to atomic force microscopy, had a root mean square (rms) roughness Rq of ∼ 32 nm (see Section S3 of the SI). The periodic 1D-PC defines the photonic band structure of the multilayer, whereas the additional top defect layer is used to fine-tune the BSW dispersion. Moreover, the temperature-dependency of the material refractive indices is considered through the temperature-dependent Sellmeier model reported in refs (42) and (43) for CaF2 and ZnS, respectively. In particular, we evaluated that the refractive indices at a wavelength of 2.1 μm (ν = 4.76 × 103 cm–1) and at room temperature (298 K) are 2.26 for ZnS43 and 1.42 for CaF2.42 However, we found (see Section S4 of the SI) that the refractive indices of the ZnS and CaF2 layers of the 1D-PC are reduced due to the materials’ porosity. The effect of the porosity was studied by fitting the stack reflectance measured at near-normal incidence (about 8°) with unpolarized light. Making use of a Maxwell Garnett model,48 we evaluated the void/full ratio of the materials, which was approximately 1–2% for ZnS and 18 ± 2 and 21 ± 3% for CaF2(1) and CaF2(2) layers, respectively. Such porosity values correspond to a refractive index of 2.25 for the ZnS layers and 1.348 and 1.335, respectively, for the CaF2(1) and CaF2(2) layers.
Based on the real 1D-PC geometry and materials’ optical properties, the room temperature numerical simulation of the reflectance R(θ,λ) was carried out by a proprietary transfer-matrix method (TMM) MATLAB code.26 The numerical simulations refer to the Kretschmann–Raether configuration shown in Figure 1a, which was used experimentally to excite the BSW. As is known,45 BSWs can be excited only under TIR conditions for the prism/vacuum interface.22 In the following, β and kx are the parallel and perpendicular components of the incidence wavevector k, with respect to the 1D-PC interfaces, and σ and π refer to the transverse electric and transverse magnetic polarizations, respectively.
The proposed 1D-PC sustains both σ and π BSW modes;21 however, in the π-polarized BSW case, the field enhancement is small due to its weak localization. We will therefore focus on the σ-polarized BSWs, both experimentally and theoretically (details of the π case are given in Section S6 of the SI). In Figure 1c, we show the calculated 1D-PC reflectance R(θ,λ), in the MIR wavelengths range (1 μm < λ < 8 μm) and in a wide range of incidence angles θ inside the prism, including the TIR edge (40° < θ < 80°). Moreover, in the same (θ,λ) plane, we plot, with red and black solid lines, the PB edges for σ-polarization, as calculated by means of an iterative plane wave eigensolver method.23,49 In such a calculation, an infinite 1D-PC was assumed, with CaF2 and ZnS layers’ thickness corresponding to the mean of the values found by SEM for the fabricated layers. The lines plotted with the same color are the band edges of the same nth order band, where the propagation inside the 1D-PC is permitted.
Beyond the TIR angle, the dispersion curves (Figure 1c) relate to different σ-polarized modes propagating along the 1D-PC structure, whose nature is identified by the insets showing the plots of the square modulus of the electric field together with the refractive-index profile n(x). From the simulation, we can see that the 1D-PC can sustain BSWs in both the first (low frequencies surface waves, SWLF) and in the second (high frequencies surface waves, SWHF) photonic band gap. In particular, the SWLF modes can be excited at wavelengths lower than 6 μm and in the angular range of 47° < θ < 69°, with an intensity profile that decays exponentially from the interface with vacuum. Further, we estimate the field intensity enhancement, fσ, for the BSW, through the ratio
| 1 |
where |EBSW|σ2 and |E0|σ are the maximum field intensities under TIR excitation at resonant angle θBSW, for either the 1D-PC-coated prism or the bare prism, respectively. The maximum enhancement fσ ∼ 27 is obtained at λ = 3.0 μm for θBSW = 60.4°. Moreover, the 1D-PC also admits band-edge modes which are labeled with acronyms BE1, and BE2; for such modes, the field is localized inside the 1D-PC; indeed, BE1, in the 1D-PC first permitted PB show their maximum intensity inside the ZnS(2) layer, whereas the BE2 is pinned at the CaF2(1) layer.
Experimental Method
In Figure 2, we sketch the apparatus used to experimentally characterize the deposited 1D-PC. We perform high-resolution reflectivity measurements using the SOLEIL synchrotron source, on the AILES beamline. A schematic sketch is shown in Figure 2a.41
Figure 2.
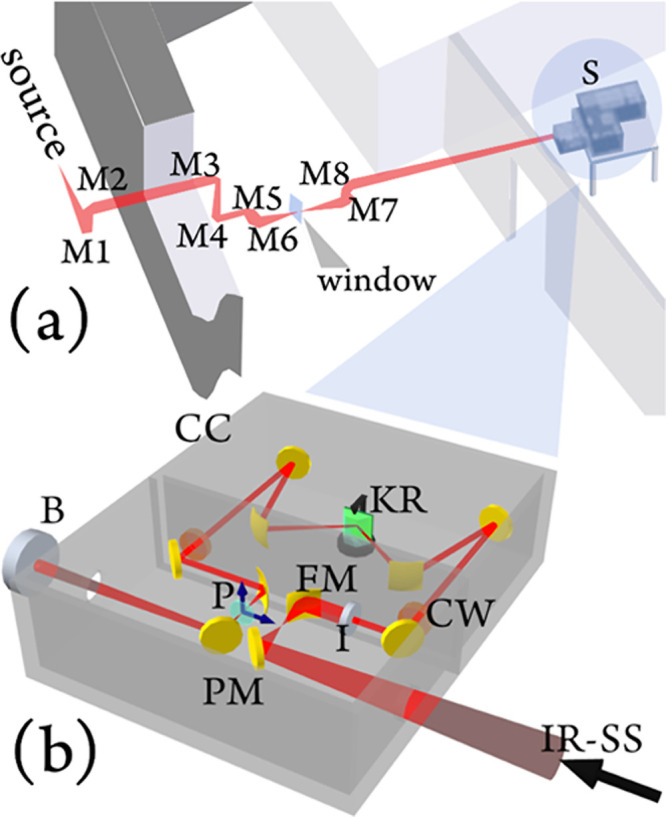
(a) Sketch of the AILES beamline at SOLEIL synchrotron which exploits a series of mirrors (M) to handle the radiation. With permission from ref (41), we reproduced a portion of Figure 4. Copyright 2006 Elsevier B.V. (b) Sketch of the experimental apparatus. Infrared synchrotron source (IR-SS), plane mirror (PM), focusing mirror (FM), iris (I), compartments window (CW), Kretschmann–Raether (KR) configuration, polarizer (P), cryoscopic compartment (CC), and bolometer (B).
The measurements have been performed using a Bruker IFS 125 HR interferometer equipped with a KBr beamsplitter and liquid He-cooled detectors (Figure 2a, S). In the present experiments, we used a cryoscopic chamber (CC) allowing measurements of reflectivity at variable angles, θ (grazing-angle reflectivity setup50), and temperatures, T. The prism, with or without the 1D-PC, was mounted on the closed cycle cryogenerator whose cold finger is thermally connected to the custom-made sample holder. The temperature cycles are created and controlled by a custom LabView code. Moreover, the position of the sample holder can be finely adjusted to compensate for any contraction at low temperatures.
The sample compartment of the interferometer is used here to host the optics, which redirects the radiation to the cryoscopic chamber. In Figure 2b, we sketch the grazing-incidence optical setup assembled to excite the BSW.50 The synchrotron IR radiation was collimated and focused by means of a series of planar (PM) and focusing (FM) gold mirrors. The spot size was reduced by means of an iris (∼1 mm, I), and the IR radiation was collected and collimated by means of a mirror system specularly mounted with respect to the input mirrors. On the path, a σ-polarizer (P) was inserted. The interferometer and the cryoscopic compartments are connected by an input and an output chamber window (CW) transparent to IR and visible radiations. The probe laser beam can therefore tunnel through the 1D-PC and efficiently excite the BSWs at the free 1D-PC/vacuum interface, as sketched in Figure 1a. The temperature in the cryostat compartment was measured by means of a thermocouple located about 2 cm above the sample, by ensuring a temperature measurement uncertainty of ±2 K.
Finally, although the ultimate vacuum in the interferometer can be reduced to 10–4 mbar, the sample compartment, of dimensions 262 mm × 184 mm × 162 mm, can be improved to 10–6 mbar, to reduce absorption due to residual gases. This pumping has been carried out by means of a set of mechanical and turbo-molecular pumps.50
Results and Discussion
The spectral intensity I(ν,T) of the σ-polarized radiation reflected by a sample was collected at the incidence angle θ0 = 65.0 ± 0.9° and at temperature T, with a spectral resolution of 0.25 cm–1. It is noteworthy that the incidence angle could be affected by a systematic error too, due to the difficulty in aligning the sample inside the chamber, which was estimated to be less than 1°. In Figure 3a, we show the I(ν,T) spectra for either a 1D-PC-coated CaF2 prism (solid lines) or a reference bare CaF2 prism (dashed lines), obtained at three different temperatures. For both types of samples, the following thermal cycle procedure was adopted: starting from 300 K, the temperature was gradually reduced to 100 K and suddenly increased up to 250 K, to ensure maximum evacuation of the chamber and, eventually, to forewarn for any alignment issue induced by uncompensated thermal contraction/expansion. Once completed this preliminary procedure, the temperature was lowered to 10 K and the reflectance was measured, in the order, at 10, 50, 100, 150, 200, 250, and 300 K. The experimental session has a duration of 3 h for each polarization.
Figure 3.

(a) Reflected intensity spectra I(ν,T) obtained at three different temperatures: (dash) bare CaF2 prism (reference), (solid) 1D-PC-coated CaF2 prism. (b) R(ν,T) reflectance spectra in the BSW excitation region: (dot) experiment, (solid) fit with the TMM simulation. Except for the case at T = 300 K, the curves are vertically shifted for convenience. Absorbance spectra in the OH-stretch region, for bare CaF2 prism (c) and of the 1D-PC-coated CaF2 prism (d).
In Figure 3a, we show with light gray bands two spectral regions of our interest, on which we shall focus the data analysis. In the first region, around 4.7 × 103 cm–1, the excitation of BSWs is witnessed by the appearance of dips in the reflectance measured for the 1D-PC-coated prism. In the second region, around 3.25 × 103 cm–1, we observed absorption dips related to the OH-stretching band.
Figure 3b shows details of the region around 4.7 × 103 cm–1, in which the experimental reflectance curves R(ν,T) (dots) obtained at different temperatures are plotted with an arbitrary offset with respect to the 300 K measurement for the sake of clarity. The R(ν,T) curves were obtained by normalizing the experimental data to the reference curves obtained with the bare prism. The solid lines are the fits obtained with the TMM simulations. The results show that the 1D-PC continues sustaining BSWs down to 10 K without any damage to the dielectric stack, such as delamination, demonstrating their appeal for applications in extreme environmental conditions, such as space optics and spectroscopy, for example, absorption spectroscopy in planetary atmospheres.6 The observed frequency shift of the resonant dip with temperature indicates a perturbation of the refractive index of either the external medium or the 1D-PC itself, giving rise to a change in the BSW dispersion. We ascribe the shift primarily to the condensation of residual water vapor in the vacuum chamber to a thin ice layer at the surface of the 1D-PC at low temperatures and secondarily to the presence of residual condensed water inside the 1D-PC pores at higher temperatures. During the thermal cycle, the resonant frequency (νBSW) gradually shifts as T increases from 10 K. However, an abrupt discontinuity is observed above 200 K since ice sublimation takes place and retrieves the real part of the refractive index on the top of the 1D-PC to that of vacuum.
The continuous growth of the thin ice film all along
the experiments
is confirmed by the analysis of the reflectance in the OH-stretching
spectral region around 3.25 × 103 cm–1. The increasing thickness of the water ice should not be surprising.
As often happens in cryogenic measurements, albeit under high vacuum
conditions, the presence of water is unavoidable. In this particular
case, the main parameter which affects the ice sedimentation is the
time (about 2 h) in which the sample stands below the ice sublimation
temperature. In Figure 3c,d, we plot the absorbance  of either the bare or the 1D-PC-coated
prism using the respective spectra acquired at 300 K as a reference
assuming that the samples’ surfaces are dry at 300 K. The presence
of an OH-stretching absorption peak is evident below the ice sublimation
temperature at the chamber operation pressure Ts ∼ 160 K;51 above Ts, the A curves are flat as
confirmed by the curve at 200 K. The absorbance A is larger for the bare prism than the 1D-PC-coated one, approximately
by a factor 7, due to the interference of the multiple reflections
of the incidence wave at the multilayered structure interfaces (Bragg
condition), which gives rise to a lower value of the field intensity
at the 1D-PC top surface at 3.25 × 103 cm–1 (λ = 3.08 μm), as confirmed by the TMM calculations
reported in Section S5 of the SI.
of either the bare or the 1D-PC-coated
prism using the respective spectra acquired at 300 K as a reference
assuming that the samples’ surfaces are dry at 300 K. The presence
of an OH-stretching absorption peak is evident below the ice sublimation
temperature at the chamber operation pressure Ts ∼ 160 K;51 above Ts, the A curves are flat as
confirmed by the curve at 200 K. The absorbance A is larger for the bare prism than the 1D-PC-coated one, approximately
by a factor 7, due to the interference of the multiple reflections
of the incidence wave at the multilayered structure interfaces (Bragg
condition), which gives rise to a lower value of the field intensity
at the 1D-PC top surface at 3.25 × 103 cm–1 (λ = 3.08 μm), as confirmed by the TMM calculations
reported in Section S5 of the SI.
From the data shown in Figure 3d, we could evaluate the thickness of the ice film. Assuming that all facets of the prism are coated with an ice film of the same thickness, using the literature values for the temperature-dependent absorption coefficient of amorphous ice at the most intense OH band,52 and simulating by the TMM the reflectance of the 1D-PC-coated prism, we evaluated that the thickness of the ice layer was about 5.1, 8.3, 15.5, and 21.6 nm, for the consecutive measurements taken at 10, 50, 100, and 150 K, respectively.
The values of
the ice layer thickness were used to calculate the
fitting curves by the TMM, as shown in Figure 3b. As for the CaF2 and ZnS, the
ice layer has been modeled through its refractive index dispersion
between 1.1 and 2.6 μm at each temperature.52 For completeness, we considered the possibility that the
material thicknesses could change due to the thermal dilatation/contraction,
but the coefficient of thermal expansion of the materials is very
low for temperatures lower than the ice sublimation temperature; therefore,
we considered it to be negligible. Moreover, to best fit the amplitude
of the experimental curves with the simulated ones, we tuned the imaginary
part of the CaF2 refractive index by retrieving a value
almost constant in temperature in the order of 5 × 10⁻⁵. The agreement between the simulated curves and the experimental
data until 150 K is very good and shows that the perturbation of the
surface refractive index due to the thin ice layer can be efficiently
detected by measuring the shift of the BSW resonance at νBSW. Such a result assesses the sensing performances of the
BSW mode sustained by the 1D-PC. In Figure 4a, we plot the experimental
νBSW values with their uncertainty (δνBSW) as a function of the estimated ice film thickness tice. Data are aligned along a straight line,
whose slope is the experimental sensitivity of the BSWs toward the
ice film thickness  . Data are in good agreement with
the TMM
simulation shown as a solid line in Figure 3b, which predicts a linear dependency with
a slope of −2.60 ± 0.05 cm–1/nm, as
shown in Figure 4a.
Finally, we evaluated the sensor limit of detection as the water thickness
variation (Δtmin) for which the
observed BSW resonance frequency variation (ΔνBSW) is 3 times δνBSW, i.e., Δtmin = 3δνBSW/Sexp = 1.9 ± 0.3 nm. For the sake of completeness,
at νBSW = 4.76 × 103 cm–1 (λBSW = 2.1 μm) and θBSW = θ0, we calculated that the field enhancement
is equal to fσ ∼ 9 and the
penetration length of the electric field in a vacuum is about lλ0σ = (2kx)−1 = 230 nm.
. Data are in good agreement with
the TMM
simulation shown as a solid line in Figure 3b, which predicts a linear dependency with
a slope of −2.60 ± 0.05 cm–1/nm, as
shown in Figure 4a.
Finally, we evaluated the sensor limit of detection as the water thickness
variation (Δtmin) for which the
observed BSW resonance frequency variation (ΔνBSW) is 3 times δνBSW, i.e., Δtmin = 3δνBSW/Sexp = 1.9 ± 0.3 nm. For the sake of completeness,
at νBSW = 4.76 × 103 cm–1 (λBSW = 2.1 μm) and θBSW = θ0, we calculated that the field enhancement
is equal to fσ ∼ 9 and the
penetration length of the electric field in a vacuum is about lλ0σ = (2kx)−1 = 230 nm.
Figure 4.

(a) Plot of the BSW peak frequency, νBSW, versus the ice layer thickness for the experimental (black dots) and the simulated (red dots) cases. (b) Region of the (β̃,ω̃) plane where the experimental BSW modes are localized: (dark gray) calculated BSW dispersion (SWLF), (light gray) dispersion of the propagating electromagnetic waves in the prism at the fixed incidence angle θ, (dot) BSW experimental dispersion data with error bars, (red dashed) dispersion when the CaF2(2) porosity is changed in its interval of confidence.
The I(ν, T) curves recorded at temperatures larger than 150 K still show a BSW resonance that, upon complete sublimation of the ice layer, shifted back to larger frequencies (measurement at T = 250 K). We observe extra shifts at 200 and 300 K, in opposite directions, that we cannot explain in the framework of the same model. Above the sublimation temperature, the irregular displacement of the Bloch surface wave spectral position can be due to the possible presence of water or other impurities in the voids that characterize the 1D-PC. Although at low temperatures the behavior of the water ice can be easily predicted, it is not the same for water confined into micro-nanoporosity.53 Therefore, we cannot formulate a hypothesis for describing what happens at temperatures higher than the ice sublimation temperature.
Finally, a detail of the 1D-PC PB structure of the nominal multilayer stack introduced above is mapped in the (β̃,ω̃) plane for σ-polarization in Figure 4b, where β̃ = βΛ/2π is the normalized parallel component of the wavevector, ω̃ = ωΛ/2πc is the normalized angular frequency, and Λ = 2.54 μm is the 1D-PC periodic unit thickness. A portion of a permitted band for light propagation is filled in gray, while the white filled area corresponds to the first photonic band gap for the electromagnetic radiation. The calculated dispersion of the BSW modes (SWLF) is plotted in dark gray solid line and, for the sake of clarity, we plot a grid of dotted line where each of them corresponds to a fixed incidence angle θ, i.e., the dispersion of the propagating electromagnetic waves in the prism. In the same plane, we plotted the BSW dispersion retrieved from the experiments (colored point labeled with the measurement temperature), with its experimental error bar due to the incidence angle uncertainty. The 1D-PC optical properties are very sensitive to the material porosity variation and, in particular, to the CaF2(2) layer porosity, which is evaluated in the order of 21%, as reported above. To take into account the uncertainty of the material porosity, in the same graph, we plot the BSW mode dispersion calculated when the CaF2(2) porosity is ranging between 18 and 24% (red dashed-dotted lines). Despite the uncertainty of the material porosity, BSWs are robust, and their observation is well reproduced by our model.
Conclusions
In this work, we have successfully demonstrated the use of sensors based on BSWs in the mid-IR with a scheme based on the detection of both the real and the imaginary part variations of the materials’ refractive index placed on the top surface of the 1D-PC.
For the first time to our knowledge, it has been demonstrated the possibility to sustain BSWs on a 1D-PC made of CaF2 and ZnS layers, in the mid-IR spectral range, down to low temperatures. Although the measurements have been performed at pressures on the order of 10–6 mbar, we observed the formation of a water ice layer, whose thickness does not exceed 30 nm. We have exploited this effect to demonstrate that the spectral dip associated with the BSWs is able to detect the deposition of a nanometric layer on top of the 1D-PC, through variations of both the real and imaginary parts of the refractive index, which gives rise, respectively, to a shift of the spectral position and to variations of the depth/width of the dip. Ultimately, we estimated that the proposed BSW-based sensor has a sensitivity on the order of 2.9 cm–1 for each nanometer of icy water added to its top surface for a temperature lower than 150 K.
Glossary
Abbreviations
- 1D-PC
one-dimensional photonic crystal
- BSWs
Bloch surface waves
- PB
photonic band
- MIR
mid-infrared
- σ
transverse electric polarization
- π
transverse magnetic polarization
- FIB
focused ion beam
- SEM
scanning electron microscopy
- TIR
total internal reflection
- TMM
transfer-matrix method
- SWLF
low-frequency surface waves
- SWHF
high-frequency surface waves
- BE
band-edge modes
- PM
planar mirror
- FM
focusing mirror
- I
iris
- P
polarizer
- CW
chamber window
Supporting Information Available
The Supporting Information is available free of charge at https://pubs.acs.org/doi/10.1021/acsami.2c07894.
Numerical simulations, dielectric stack characterization, calculated field intensity at λ = 3.08 μm, and experimental results and numerical simulations related to the π-polarized BSWs (PDF)
Author Contributions
Conceptualization, A.O., A.Nu., F.Mi., L.B., A.S., and M.O.; writing—original draft preparation, A.O., R.P., F.Mi., P.C., and A.Nu.; figure preparation, data analysis, and investigation, A.O., F.Mi., P.R., J.-B.B., and A.Nu.; 1D-PC design, A.O., A.S., and F.Mi.; 1D-PC fabrication M.P., A.No., S.C., and F.Ma.; and supervision and funding acquisition, M.O., L.B., A.Nu., and F.Mi. All authors have read and agreed to the published version of the manuscript.
The research leading to these results has received funding from the Italian Ministry of Education, University, and Research (MIUR), PRIN project “Plasmon-enhanced vibrational circular dichroism,” ID 2015FSHNCB. F.Mi., M.O., A.O., A.S., R.P., and L.B. acknowledge funding from Sapienza University through the H2020Project program. A.O., F.Mi., and A.S. acknowledge funding from Regione Lazio through the three projects with grant number B86J20001690002 (Biolight), A0375-2020-36528 (Nano-Covid-Test), and A0375-2020-36630 (ErbB-2D) and from the Italian MIUR Ministry (ID ARS01_00769, “NeoN”). A.O. and A.Nu. acknowledge funding from the EU Calipso-plus program.
The authors declare no competing financial interest.
Supplementary Material
References
- Bellamy L. J.The Infrared Spectra of Complex Molecules, 3rd ed.; Chapman and Hall: London, 1975. [Google Scholar]
- Smolik G. M.; Descharmes N.; Herzig H. P. Toward Bloch Surface Wave-Assisted Spectroscopy in the Mid-Infrared Region. ACS Photonics 2018, 5, 1164–1170. 10.1021/acsphotonics.7b01315. [DOI] [Google Scholar]
- Nucara A.; Corasaniti M.; Kalaboukhov A.; Ortolani M.; Falsetti E.; Sambri A.; Miletto Granozio F.; Capitani F.; Brubach J. B.; Roy P.; Schade U.; Calvani P. Infrared Study of the Quasi-two-dimensional Electron System at the Interface between SrTiO3 and Crystalline or Amorphous LaAlO3. Phys. Rev. B 2018, 97, 155126 10.1103/PhysRevB.97.155126. [DOI] [Google Scholar]
- Araujo P. T. Anharmonicities in Phonon Combinations and Overtones in Bilayered Graphene: A Temperature-Dependent Approach. Phys. Rev. B 2018, 97, 205441 10.1103/PhysRevB.97.205441. [DOI] [Google Scholar]
- Kamal C. Massless Dirac Fermions in Stable Two-Dimensional Carbon-Arsenic Monolayer. Phys. Rev. B 2019, 100, 205404 10.1103/PhysRevB.100.205404. [DOI] [Google Scholar]
- Snels M.; Stefani S.; Boccaccini A.; Biondi D.; Piccioni G. A Simulation Chamber for Absorption Spectroscopy in Planetary Atmospheres. Atmos. Meas. Tech. 2021, 14, 7187–7197. 10.5194/amt-14-7187-2021. [DOI] [Google Scholar]
- Balan V.; Mihai C. T.; Cojocaru F. D.; Uritu C. M.; Dodi G.; Botezat D.; Gardikiotis I. Vibrational Spectroscopy Fingerprinting in Medicine: from Molecular to Clinical Practice. Materials 2019, 12, 2884 10.3390/ma12182884. [DOI] [PMC free article] [PubMed] [Google Scholar]
- Grube M.; Muter O.; Strikauska S.; Gavare M.; Limane B. Application of FT-IR Spectroscopy for Control of the Medium Composition during the Biodegradation of Nitro Aromatic Compounds. J. Ind. Microbiol. Biotechnol. 2008, 35, 1545–1549. 10.1007/s10295-008-0456-0. [DOI] [PubMed] [Google Scholar]
- De Angelis F.; Gentile F.; Mecarini F.; Das G.; Moretti M.; Candeloro P.; Coluccio M. L.; Cojoc G.; Accardo A.; Liberale C.; Zaccaria R. P.; Perozziello G.; Tirinato L.; Toma A.; Cuda G.; Cingolani R.; Di Fabrizio E. Breaking the Diffusion Limit with Super-Hydrophobic Delivery of Molecules to Plasmonic Nanofocusing SERS Structures. Nat. Photonics 2011, 5, 682–687. 10.1038/nphoton.2011.222. [DOI] [Google Scholar]
- Adato R.; Altug H. In-situ Ultra-Sensitive Infrared Absorption Spectroscopy of Biomolecule Interactions in Real Time with Plasmonic Nanoantennas. Nat. Commun. 2013, 4, 2154 10.1038/ncomms3154. [DOI] [PMC free article] [PubMed] [Google Scholar]
- Occhicone A.; Sinibaldi A.; Sonntag F.; Munzert P.; Danz N.; Michelotti F. Study of Fluid Dynamics at the Boundary Wall of a Microchannel by Bloch Surface Waves. Opt. Lett. 2019, 44, 1932–1935. 10.1364/OL.44.001932. [DOI] [PubMed] [Google Scholar]
- Sinibaldi A.; Sampaoli C.; Danz N.; Munzert P.; Sibilio L.; Sonntag F.; Occhicone A.; Falvo E.; Tremante E.; Giacomini P.; Michelotti F. Detection of Soluble ERBB2 in Breast Cancer Cell Lysates using a Combined Label-Free/Fluorescence Platform based on Bloch Surface Waves. Biosens. Bioelectron. 2017, 92, 125–130. 10.1016/j.bios.2017.02.012. [DOI] [PubMed] [Google Scholar]
- Boltasseva A.; Atwater H. A. Low-Loss Plasmonic Metamaterials. Science 2011, 331, 290–291. 10.1126/science.1198258. [DOI] [PubMed] [Google Scholar]
- Taliercio T.; Biagioni P. Semiconductor Infrared Plasmonics. Nanophotonics 2019, 8, 949–990. 10.1515/nanoph-2019-0077. [DOI] [Google Scholar]
- Law S.; Adams D. C.; Taylor A. M.; Wasserman D. Mid-Infrared Designer Metals. Opt. Express 2012, 20, 12155–12165. 10.1364/OE.20.012155. [DOI] [PubMed] [Google Scholar]
- Rodrigo D.; Tittl A.; Limaj O.; García de Abajo F. J.; Pruneri V.; Altug H. Double-Layer Graphene for Enhanced Tunable Infrared Plasmonics. Light Sci. Appl. 2017, 6, e16277 10.1038/lsa.2016.277. [DOI] [PMC free article] [PubMed] [Google Scholar]
- Rodrigo D.; Limaj O.; Janner D.; Etezadi D.; García de Abajo F. J.; Pruneri V.; Altug H. Mid-Infrared Plasmonic Biosensing with Graphene. Science 2015, 349, 165–168. 10.1126/science.aab2051. [DOI] [PubMed] [Google Scholar]
- Ciano C.; Giliberti V.; Ortolani M.; Baldassarre L. Observation of Phonon-Polaritons in Thin Flakes of Hexagonal Boron Nitride on Gold. Appl. Phys. Lett. 2018, 112, 153101 10.1063/1.5024518. [DOI] [Google Scholar]
- Autore M.; Li P.; Dolado I.; Alfaro-Mozaz F. J.; Esteban R.; Atxabal A.; Casanova F.; Hueso L. E.; Alonso-González P.; Aizpurua J.; Nikitin A. Y.; Vélez S.; Hillenbrand R. Boron Nitride Nanoresonators for Phonon-Enhanced Molecular Vibrational Spectroscopy at the Strong Coupling Limit. Light Sci. Appl. 2018, 7, 17172 10.1038/lsa.2017.172. [DOI] [PMC free article] [PubMed] [Google Scholar]
- Chen Y.; Francescato Y.; Caldwell J. D.; Giannini V.; Maß T. W. W.; Glembocki O. J.; Bezares F. J.; Taubner T.; Kasica R.; Hong M.; Maier S. A. Spectral Tuning of Localized Surface Phonon Polariton Resonators for Low-Loss Mid-IR Applications. ACS Photonics 2014, 1, 718–724. 10.1021/ph500143u. [DOI] [Google Scholar]
- Occhicone A.; Pea M.; Polito R.; Giliberti V.; Sinibaldi A.; Mattioli F.; Cibella S.; Notargiacomo A.; Nucara A.; Biagioni P.; Michelotti F.; Ortolani M.; Baldassarre L. Spectral Characterization of Mid-Infrared Bloch Surface Waves Excited on a Truncated 1D Photonic Crystal. ACS Photonics 2021, 8, 350–359. 10.1021/acsphotonics.0c01657. [DOI] [PMC free article] [PubMed] [Google Scholar]
- Yeh P.; Yariv A.; Hong C. S. Electromagnetic Propagation in Periodic Stratified Media. I. General theory. J. Opt. Soc. Am. 1977, 67, 423–438. 10.1364/JOSA.67.000423. [DOI] [Google Scholar]
- Johnson S. G.; Joannopoulos J. D. Block-Iterative Frequency-Domain Methods for Maxwell’s Equations in a Plane Wave Basis. Opt. Express 2001, 8, 173–190. 10.1364/OE.8.000173. [DOI] [PubMed] [Google Scholar]
- Joannopoulos J. D.; Johnson S. G.; Winn J. N.; Meade R. D.. Photonic Crystals: Molding the Flow of Light; Princeton University Press, 2008. [Google Scholar]
- Shen H.; Wang Z.; Wu Y.; Yang B. One-Dimensional Photonic Crystals: Fabrication, Responsiveness and Emerging Applications in 3D Construction. RSC Adv. 2016, 6, 4505. 10.1039/C5RA21373H. [DOI] [Google Scholar]
- Sinibaldi A.; Rizzo R.; Figliozzi G.; Descrovi E.; Danz N.; Munzert P.; Anopchenko A.; Michelotti F. A Full Ellipsometric Approach to Optical Sensing with Bloch Surface Waves on Photonic Crystals. Opt. Exp. 2013, 21, 23331–23344. 10.1364/OE.21.023331. [DOI] [PubMed] [Google Scholar]
- Raether H.Surface Plasmons on Smooth Surfaces. In Surface Plasmons on Smooth and Rough Surfaces and on Gratings; Springer: Berlin, Heidelberg, 1988; Vol. 111. [Google Scholar]
- Konopsky V. N.; Alieva E. V. Photonic Crystal Surface Waves for Optical Biosensors. Anal. Chem. 2007, 79, 4729–4735. 10.1021/ac070275y. [DOI] [PubMed] [Google Scholar]
- Konopsky V. N.; Karakouz T.; Alieva E. V.; Vicario C.; Sekatskii S. K.; Dietler G. Photonic Crystal Biosensor Based on Optical Surface Waves. Sensors 2013, 13, 2566–2578. 10.3390/s130202566. [DOI] [PMC free article] [PubMed] [Google Scholar]
- Toma K.; Descrovi E.; Toma M.; Ballarini M.; Mandracci P.; Giorgis F.; Mateescu A.; Jonas U.; Knolla W.; Dostálek J. Bloch Surface Wave-Enhanced Fluorescence Biosensor. Biosens. Bioelectron. 2013, 43, 108–114. 10.1016/j.bios.2012.12.001. [DOI] [PubMed] [Google Scholar]
- Lu F.; Jin M.; Belkin M. A. Tip-Enhanced Infrared Nanospectroscopy via Molecular Expansion Force Detection. Nat. Photonics 2014, 8, 307–312. 10.1038/nphoton.2013.373. [DOI] [Google Scholar]
- Dubroka A.; Rössle M.; Kim K. W.; Malik V. K.; Schultz L.; Thiel S.; Schneider C. W.; Mannhart J.; Herranz G.; Copie O.; Bibes M.; Barthélémy A.; Bernhard C. Dynamical Response and Confinement of the Electrons at the LaAlO3/SrTiO3 Interface. Phys. Rev. Lett. 2010, 104, 156807 10.1103/PhysRevLett.104.156807. [DOI] [PubMed] [Google Scholar]
- Yazdi-Rizi M.; Marsik P.; Mallett B. P. P.; Sen K.; Cerreta A.; Dubroka A.; Scigaj M.; Sánchez F.; Herranz G.; Bernhard C. Infrared Ellipsometry Study of Photogenerated Charge Carriers at the (001) and (110) Surfaces of SrTiO3 Crystals and at the Interface of the corresponding LaAlO3/SrTiO3 Heterostructure. Phys. Rev. B 2017, 95, 195107 10.1103/PhysRevB.95.195107. [DOI] [Google Scholar]
- Falsetti E.; Nucara A.; Shibayev P. P.; Salehi M.; Moon J.; Oh S.; Brubach J. B.; Roy P.; Ortolani M.; Calvani P. Infrared Spectroscopy of the Topological Surface States of Bi2Se3 by use of the Berreman Effect. Phys. Rev. Lett. 2018, 121, 176803 10.1103/PhysRevLett.121.176803. [DOI] [PubMed] [Google Scholar]
- Berreman D. W. Infrared Absorption at Longitudinal Optic Frequency in Cubic Crystal Films. Phys. Rev. 1963, 130, 2193. 10.1103/PhysRev.130.2193. [DOI] [Google Scholar]
- Rizzo R.; Danz N.; Michelotti F.; Maillart E.; Anopchenko A.; Wächter C. Optimization of Angularly Resolved Bloch Surface Wave Biosensors. Opt. Express 2014, 22, 23202–23214. 10.1364/OE.22.023202. [DOI] [PubMed] [Google Scholar]
- Anopchenko A.; Occhicone A.; Rizzo R.; Sinibaldi A.; Figliozzi G.; Danz N.; Munzert P.; Michelotti F. Effect of Thickness Disorder on the Performance of Photonic Crystal Surface Wave Sensors. Opt. Express 2016, 24, 7728–7742. 10.1364/OE.24.007728. [DOI] [PubMed] [Google Scholar]
- Fan S. H.; Villeneuve P. R.; Joannopoulos J. D. Theoretical Investigation of Fabrication-Related Disorder on the Properties of Photonic Crystals. J. Appl. Phys. 1995, 78, 1415–1418. 10.1063/1.360298. [DOI] [Google Scholar]
- Bragheri F.; Faccio D.; Romagnoli M.; Krauss T.; Roberts J. Effects of Random and Systematic Perturbations in a One-Dimensional Photonic Crystal Wavelength Converter. Phys. Rev. E 2004, 70, 017601 10.1103/PhysRevE.70.017601. [DOI] [PubMed] [Google Scholar]
- Kaliteevski M. A.; Beggs D. M.; Brand S.; Abram R. A.; Nikolaev V. V. Statistics of the Eigenmodes and Optical Properties of One-Dimensional Disordered Photonic Crystals. Phys. Rev. E 2006, 73, 056616 10.1103/PhysRevE.73.056616. [DOI] [PubMed] [Google Scholar]
- Roy P.; Rouzieres M.; Qi Z.; Chubar O. The AILES Infrared Beamline on the Third Generation Synchrotron Radiation Facility SOLEIL. Infrared Phys. Technol. 2006, 49, 139–146. 10.1016/j.infrared.2006.01.015. [DOI] [Google Scholar]
- Leviton D. B.; Frey B. J.; Madison T. J. In Temperature-Dependent Refractive Index of CaF2 and Infrasil 301, Proceedings Cryogenic Optical Systems and Instruments XII, 2007, p 669204.
- Li H. H. Refractive Index of ZnS, ZnSe, and ZnTe and Its Wavelength and Temperature Derivatives. J. Phys. Chem. Ref. Data 1984, 13, 103. 10.1063/1.555705. [DOI] [Google Scholar]
- Mahan J. E.Physical Vapor Deposition of Thin Films; Wiley: New York, 2000. [Google Scholar]
- Kretschmann E.; Raether H. Radiative Decay of Non Radiative Surface Plasmons Excited by Light. Z. Naturforschung. A 1968, 23, 2135–2136. 10.1515/zna-1968-1247. [DOI] [Google Scholar]
- Tarraf A.; Daleiden J.; Irmer S.; Prasai D.; Hillmer H. Stress Investigation of PECVD Dielectric Layers for Advanced Optical MEMS. J. Micromech. Microeng. 2004, 14, 317–323. 10.1088/0960-1317/14/3/001. [DOI] [Google Scholar]
- Capellini G.; De Seta M.; Busby Y.; Pea M.; Evangelisti F.; Nicotra G.; Spinella C.; Nardone M.; Ferrari C. Strain Relaxation in High Ge Content SiGe Layers Deposited on Si. J. Appl. Phys. 2010, 107, 063504 10.1063/1.3327435. [DOI] [Google Scholar]
- Markel V. A. Introduction to the Maxwell Garnett Approximation: Tutorial. J. Opt. Soc. Am. A 2016, 33, 1244–1256. 10.1364/JOSAA.33.001244. [DOI] [PubMed] [Google Scholar]
- MIT Photonic-Bands; Massachusetts Institute of Technology, 1999. https://mpb.readthedocs.io/en/latest/. [Google Scholar]
- Verseils M.; Voute A.; Langerome B.; Deutsch M.; Brubach J. B.; Kalaboukhov A.; Nucara A.; Calvani P.; Roy P. Grazing-Angle Reflectivity Setup for the Low-Temperature Infrared Spectroscopy of Two-Dimensional Systems. J. Synchrotron Rad. 2019, 26, 1945–1950. 10.1107/S1600577519010920. [DOI] [PubMed] [Google Scholar]
- Wagner W.; Riethmann T.; et al. New Equations for the Sublimation Pressure and Melting Pressure of H2O Ice Ih. J. Phys. Chem. Ref. Data 2011, 40, 043103 10.1063/1.3657937. [DOI] [Google Scholar]
- Mastrapa R. M.; Bernstein M. P.; Sandford S. A.; Roush T. L.; Cruikshank D. P.; Dalle Ore C. M. Optical Constants of Amorphous and Crystalline H2O-ice in the Near Infrared from 1.1 to 2.6 μm. Icarus 2008, 197, 307–320. 10.1016/j.icarus.2008.04.008. [DOI] [Google Scholar]
- Coudert F. X.; Boutin A.; Fuchs A. H. Open Questions on Water Confined in Nanoporous Materials. Commun. Chem. 2021, 4, 106. 10.1038/s42004-021-00544-9. [DOI] [PMC free article] [PubMed] [Google Scholar]
Associated Data
This section collects any data citations, data availability statements, or supplementary materials included in this article.