Abstract
Background:
Accurate grading of neuroendocrine neoplasms (NENs) is crucial for proper assessment of prognosis. Estimation of the proliferative indices, if not performed properly, is largely erroneous due to significant intratumoral heterogeneity. We sought to establish the degree of error in the grading in a cohort of curatively resected pancreatic NENs (PanNENs) and the theoretical impact of that in a larger cohort of SEER patients.
Methods:
A retrospective query of an institutional surgical database was performed from 2000–2018 to identify optimally resected PanNENs, which were reviewed by two gastrointestinal pathologists and regraded according to WHO 2017 classification. Overall survival (OS) and recurrence free survival (RFS) were estimated by the Kaplan-Meier method for original and new grading system, respectively and Cox proportional-hazards models were used to evaluate the effect of the interested variables including new grading system.
Results:
A total of 176 cases were identified. After regrading, 17/64 (26.6%) of G1 neoplasms were classified as G2 and 12/95 (12.6%) of G2 were classified as G1 while 1/11 (9.1%) of G3s were classified as G2. Our expert gastrointestinal pathologists agreed on 97% of reclassified cases by blind review. Application of the G1/G2 misclassification errors on various groups, including PanNENs in a SEER database of 1385 patients rendered the reported survival differences nonsignificant (1000 repetitions, p=0.063, 95% CI: 0.056–0.070).
Conclusions:
Mischaracterization of grade is common in optimally resected PanNENs but is eliminated with proper training and adherence to guidelines. The discrepancy rates can cast doubt on the generally accepted survival differences between G1 and G2 patients, as surmised by large database analyses.
Keywords: Neuroendocrine tumors, proliferation markers, Ki-67, grading, differentiation
Introduction
Pancreatic neuroendocrine neoplasms (PanNENs) account for 2–5% of all cases of pancreatic cancer with an incidence rate of approximately 2.5 per 100,000 people[1]. Like most neuroendocrine neoplasms (NENs) their treatment is challenging due to their unpredictable behavior. They can be slow growing, relatively indolent tumors (which can be monitored by clinical observation) or have aggressive histologies and/or hormonal hypersecretion syndromes which need urgent interventions. This heterogeneity puts the treating oncologist in a dilemma over when to monitor by clinical observation or to begin occasionally aggressive therapy.
One of the early attempts at prognostic classification was based on histological appearance and immunohistochemical staining results[2], mainly tumor differentiation status[3] and Ki-67 (MIB-1) proliferation index[4]. Differentiation status and proliferative index have indeed formed the basis of the most recent WHO grading system which puts PanNENs in three distinct categories[5]: Grade 1 (G1), or well differentiated, G2 or moderately differentiated and G3 (which includes both a well and poorly differentiated component). Grade 3 patients tend to have worse survivals and are offered immediate cytotoxic chemotherapy while G1 patients are offered somatostatin analogues and/or observation based on good general outcomes[6]. G2 patients have varied survivals, distinct on SEER publications from G1[7] and can behave remarkably similar to G1s (if Ki-67 is close to 5%) or much more aggressively, similar to G3s (for those with a Ki-67 of >15%). They therefore represent a rather heterogeneous group where the recommendations are not distinct from G1s but allow for individualized approaches based on subjective estimate of aggressiveness, such as growth rate, size and tumor burden, as well as hormonal hypersecretion syndromes.
Since a lot of prognosis and treatment discussions are based on grading, it is very important that it is done accurately and reproducibly. Differentiation is generally established by visual assessment of H&E sections. Well differentiated PanNENs have an organoid architecture while poorly differentiated PanNENs have obvious cytologic atypia. For assessment of the Ki-67 index, there are a variety of options, ranging from visual estimation to using sophisticated computer imaging software but discrepancies are common and are both operator and technique dependent[8]. The College of American Pathologists (CAP), in their current published protocol for examination of endocrine tumors of the pancreas (version 4.0.0.1, June 2017) recommends manual counting of at least 500 cells (up to 2000 cells) on the print of a camera-captured image from an area of highest density of staining (hot-spot).
Our institution has an established NEN program wherein all NEN pathological reviews are done in accordance with the 2017 WHO/CAP guidelines. We thus sought to understand the implications of interobserver errors and new grading criteria in an ideal setting: among optimally resected PanNENs in a tertiary center. We assumed that the amount of tissue available from a surgical specimen would be ideal for correct grading. We then applied the error rates in a Surveillance, Epidemiology, and End Results (SEER) cohort of NEN patients and calculated the effect of misgrading on reported survival differences for various patient cohorts.
Methods
Data Source
We performed a retrospective review of an institutional database of all adult patients who underwent a pancreatic resection with curative intent for PanNENs at a single high-volume tertiary-care center from January 2000 to December 2018. Approval for the study was obtained from the Washington University Institutional Review Board. Clinical and follow-up information was retrospectively obtained from medical charts and no patients or family members were contacted. We retrieved all archival pathology slides from the original curative resections for review by an experienced gastrointestinal pathologist. Discrepancies were reviewed by a second pathologist in a blinded fashion. We extracted the following data from the medical chart: date of diagnosis, recurrence status, date of recurrence, survival status, and date of death. The tumor size, number of tumors, total number of lymph nodes examined, total number of lymph nodes involved, as well as the originally reported Ki-67 index and tumor differentiation status were retrieved from the pathology reports. Only cases with unifocal tumors were considered in this cohort, since pathologic parameters could be variable in different tumors of the same patient.
Histologic examination
All archival H&E stained slides as well as relevant immunohistochemical stains (neuroendocrine markers, Ki-67) were reviewed. The tumors were reclassified based on WHO 2017 grading scheme for PanNEN, based on morphology and Ki-67 proliferative index. For this purpose, the recommended protocol by the College of American Pathologists (CAP) version 4.0.0.1 (June 2017) was strictly adhered to. Ki-67 index was determined as the percentage assessment of Ki-67 stained cells based on manual counting of at least 500 cells on the print of a camera-captured image, of the hot spot region of the tumor. The WHO grade assignment was based on the Ki-67 index for those cases that had the stain available (the majority), and the remaining samples were stained for Ki-67, when available. The mitotic index was used to grade the tumor in all other cases. Mitotic index was reported as number of mitoses per 2 mm2 (translated to 8 high power fields for the user microscope’s field diameter of 0.55 mm), after at least 10 mm2 area (similarly translated to examining at least 42 high power fields) and was evaluated in the most mitotically active part of the tumor. Likewise, the H&E slide with the highest proliferation was selected for Ki-67 staining. Only clearly identifiable mitotic figures were counted; hyperchromatic, karyorrhectic, or apoptotic nuclei were excluded.
The neuroendocrine tumor classification and grade based on the current (WHO 2017) criteria was extrapolated from the original pathology reports as well, based on tumor description (to fit into well-differentiated versus poorly differentiated categories) and reported Ki-67 indices. This was needed because the terminologies and grading of PanNEN have changed several times, and pathologists have not strictly adhered to the standardization suggested by the classification system. The discrepancies after adjusted tumor grading, compared to currently reviewed grading, were recorded.
SEER database query
We queried the SEER database on the November 2017 submission. We specified the time frame from 2010 to 2014 to include cases treated with the latest options with enough follow-up. We examined the metastatic cases subgroup to place emphasis on survival according to tumor biology and eliminate optimally resected Stage I-III patients. We identified NENs by ICD-O3 histology codes based on the following diagnoses: Carcinoid tumor (8240), enterochromaffin cell carcinoid (8241), neuroendocrine carcinoma (8246), atypical carcinoid tumor (8249), malignant enterochromaffin-like cell tumor (8242), large cell neuroendocrine carcinoma (8013), mixed adenoneuroendocrine carcinoma (8244), mixed pancreatic malignant endocrine and exocrine tumor (8154), goblet cell carcinoid (8243), insulinoma (8151), glucagonoma (8152), malignant pancreatic endocrine tumor (8150), gastrinoma (8153), somatostatinoma (8156), vipoma (8155). These codes were adjusted from prior relevant publications[3 7]. We extracted the following variables: Grading and overall survival. We relied on SEER histologic grade information to classify cases as Grade 1 (G1) or well differentiated; G2 or moderately differentiated.
Statistical Analysis
The clinical characteristics were summarized using descriptive statistics. Overall survival (OS) was defined as the time from the date of surgery to death from any cause. Alive patients were censored at the last follow-up. Recurrence-free survival (RFS) was defined as the time from the date of surgery to recurrence or death, which occurs first. Alive patients without recurrence were censored at the last follow-up. Kaplan-Meier (KM) curves for OS and RFS were generated to provide unadjusted survival estimates for the patients and across strata. Differences between strata were determined by log-rank tests. For OS and RFS, Cox proportional-hazards models were used to evaluate the effect of the interested variables. The proportionality assumption was tested by adding a time-dependent covariate for each variable. The variables with p<0.20 from univariate models were considered in the multivariate model. The final multivariate model was built using the backward stepwise selection approach to identify all significant risk factors. Factors significant at a 10% level were kept in the final model. The inapplicable or unknown values were excluded from both univariate and multivariate analysis.
Kappa statistics was used to estimate the agreement between old and new grading system in our dataset. An independent SEER database sample including grade=1 and 2 was utilized to estimate the effect of grade change on OS. Based on the calculated error rate in our dataset, we randomly selected subjects within one grade in the SEER database and re-assigned them to the other grade. Then the log-rank test was calculated between two grades and the histogram of p-value from log-rank test through s, repeating the steps 1000 times was provided. All statistical tests were two-sided using an α = 0.05 level of significance. SAS Version 9.4 (Cary, NC) was used to perform all statistical analyses.
Results
Patient characteristics and reclassification
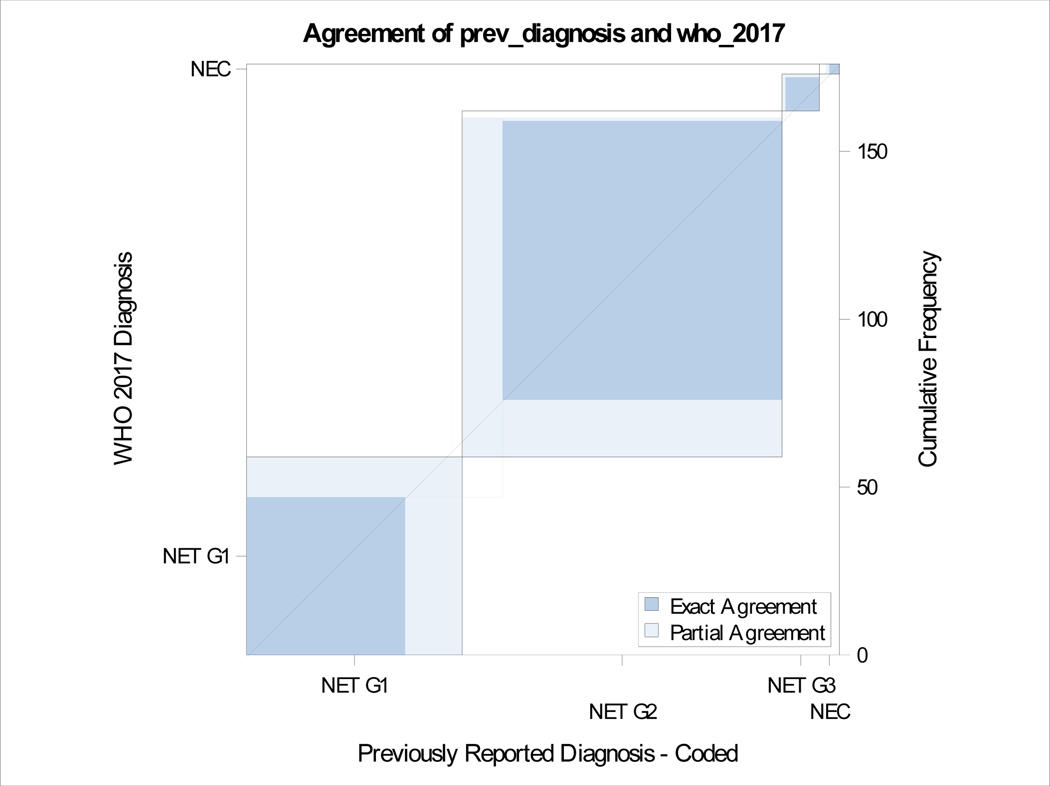
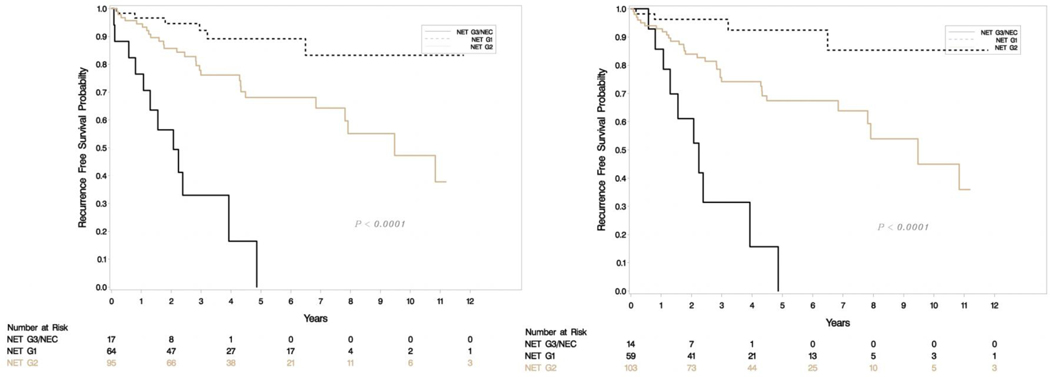
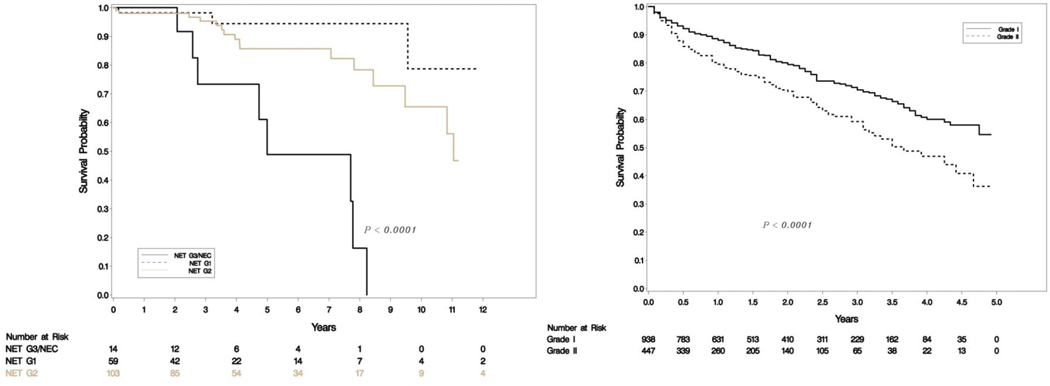
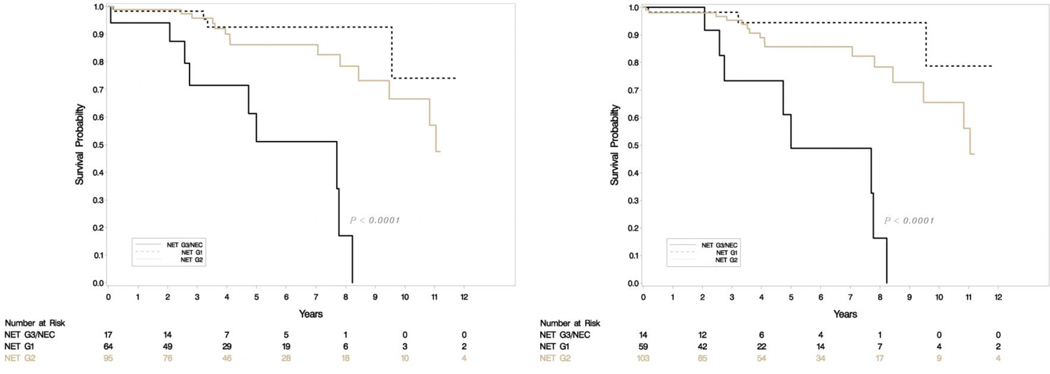
A total of 176 patients had retrievable data (Table 1). All resections were undertaken with a curative intent, and tumors had grossly complete resections. Microscopically positive margins were present in a subset (R1 resections, but none were R2). Tumor slides examined per case ranged from 1–8. Most smaller tumors (< 3 cm) had been sampled entirely for histologic examination, and representative sections were sampled for larger tumors. Sixty-four (36%) were classified as G1 and 95 (54%) were G2 with the rest being high grade on original grading. This was consistent with the experience that most resectable tumors were of low malignant potential. Tumor sizes ranged from 0.6 to 15.4 cm (mean 3.33, SD 2.83) and positive lymph nodes ranged from 0–14 (mean 1.35, SD 2.6). The updated grade was assigned based on the WHO 2017 criteria, and the current recommendations of the College of American Pathologists on following a systematic and meticulous way of grading. After regrading, 17/64 (26.6%) of G1 were reclassified as G2 and 12/95 (12.6%) of G2 were reclassified as G1. A second pathologist agreed on 97% of regrading cases (blind review) and this was resolved by consensus. There was one case where histology switched from a G3 component to NET-G2 (WHO 2017). Final grading included 59 NET-G1, 103 NET-G2, 11 NET-G3 and 3 NEC. Figure 1e shows the agreement between old and new classification. There was no change in relapse free survival (RFS) or overall survival (OS) when the amended classification was used in our cohort (Figure 1a–d).
Table 1.
Sample descriptives (N=176).
| Variable | N | Percent |
|---|---|---|
| Previous Grade | ||
| G1 | 64 | 36.36 |
| G2 | 95 | 53.98 |
| G3 | 11 | 6.25 |
| NEC | 6 | 3.41 |
| WHO 2017 grade | ||
| G1 | 59 | 33.52 |
| G2 | 103 | 58.52 |
| G3 | 11 | 6.25 |
| NEC | 3 | 1.7 |
| Grade change | ||
| NET G1 to NET G2 | 17 | 53.13 |
| NET G2 to NET G1 | 12 | 37.50 |
| NEC to NET G2 | 2 | 6.25 |
| NEC to NET G3 | 1 | 3.13 |
| Missing | 144 | |
| Grade change as error of Ki-67 interpretation | ||
| No | 144 | 81.82 |
| Yes | 32 | 18.18 |
| Upgrade | 17 | 9.71 |
| Downgrade | 15 | 8.57 |
| NA | 143 | 81.71 |
| Missing | 1 | |
| LVI | ||
| No | 103 | 58.52 |
| Yes | 73 | 41.48 |
| PNI | ||
| No | 118 | 67.05 |
| Yes | 58 | 32.95 |
Figure 1e.
Agreement between old and new grading.
Figure 1a-b.
Relapse free survival (RFS) in uncorrected (left) and corrected (right) grading.
Univariate and multivariate OS analysis
Univariate analysis (Table 2) showed that patients with higher grade tumors (p<.0001), lymphovascular (p=0.0009) and perineural invasion (p=0.0128) had a decreased chance of overall survival. The effect of grade (p=0.0064) and lymphovascular (p=0.0135) persisted in multivariate analysis. The error in estimation of Ki-67 was not statistically significant in any of the analyses.
Table 2.
Univariate and multivariate analysis for Overall Survival (OS).
| Univariate | Multivariate | |||||||
|---|---|---|---|---|---|---|---|---|
| Parameter | P value | HR | 95% CI | P value | HR | 95% CI | ||
| Ki-67 error | 0.4692 | 0.584 | 0.136 | 2.508 | ||||
| Grade 1 vs 3 |
<.0001 | 0.068 | 0.017 | 0.265 | 0.0064 | 0.132 | 0.032 | 0.548 |
| 2 vs. 3 | 0.170 | 0.069 | 0.415 | 0.278 | 0.110 | 0.699 | ||
| Tumor size | 0.5491 | 0.954 | 0.817 | 1.114 | ||||
| Lymph nodes involved | 0.1586 | 1.083 | 0.969 | 1.211 | ||||
| LVI | 0.0009 | 6.051 | 2.088 | 17.536 | 0.0135 | 4.055 | 1.335 | 12.313 |
| PNI | 0.0128 | 2.703 | 1.235 | 5.917 | ||||
Univariate and multivariate RFS analysis
Univariate analysis (Table 3) showed that grade (p<.0001), lymphovascular (p<.0001) and perineural invasion (p=0.0002), as well as number of LN involvement (p<.0001) but not Ki-67 assessment error was associated with relapse free survival. The effect of grade (p=0.0085) and lymphovascular (p<0.0001) persisted in multivariate analysis for RFS.
Table 3.
Univariate and multivariate analysis for Recurrence Free Survival (RFS)
| Univariate | Multivariate | |||||||
|---|---|---|---|---|---|---|---|---|
| Parameter | P value | HR | 95% CI | P value | HR | 95% CI | ||
| Ki-67 error | 0.2483 | 0.545 | 0.195 | 1.527 | ||||
| Grade 1 vs 3 |
<.0001 | 0.053 | 0.016 | 0.172 | 0.0085 | 0.152 | 0.045 | 0.514 |
| 2 vs. 3 | 0.224 | 0.106 | 0.472 | 0.448 | 0.210 | 0.955 | ||
| Tumor size | 0.0954 | 1.075 | 0.987 | 1.171 | ||||
| Lymph nodes involved | <.0001 | 1.190 | 1.091 | 1.299 | ||||
| LVI | <.0001 | 9.391 | 4.189 | 21.052 | <0.0001 | 6.871 | 2.978 | 15.850 |
| PNI | 0.0002 | 3.162 | 1.736 | 5.760 | ||||
SEER data analyses
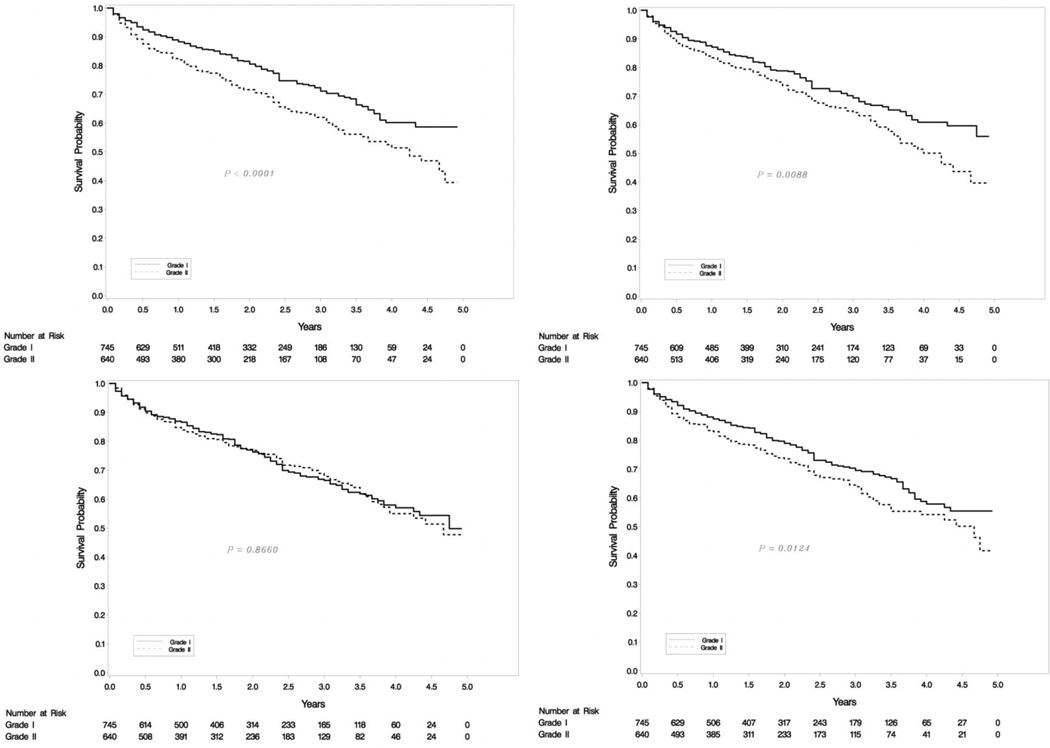
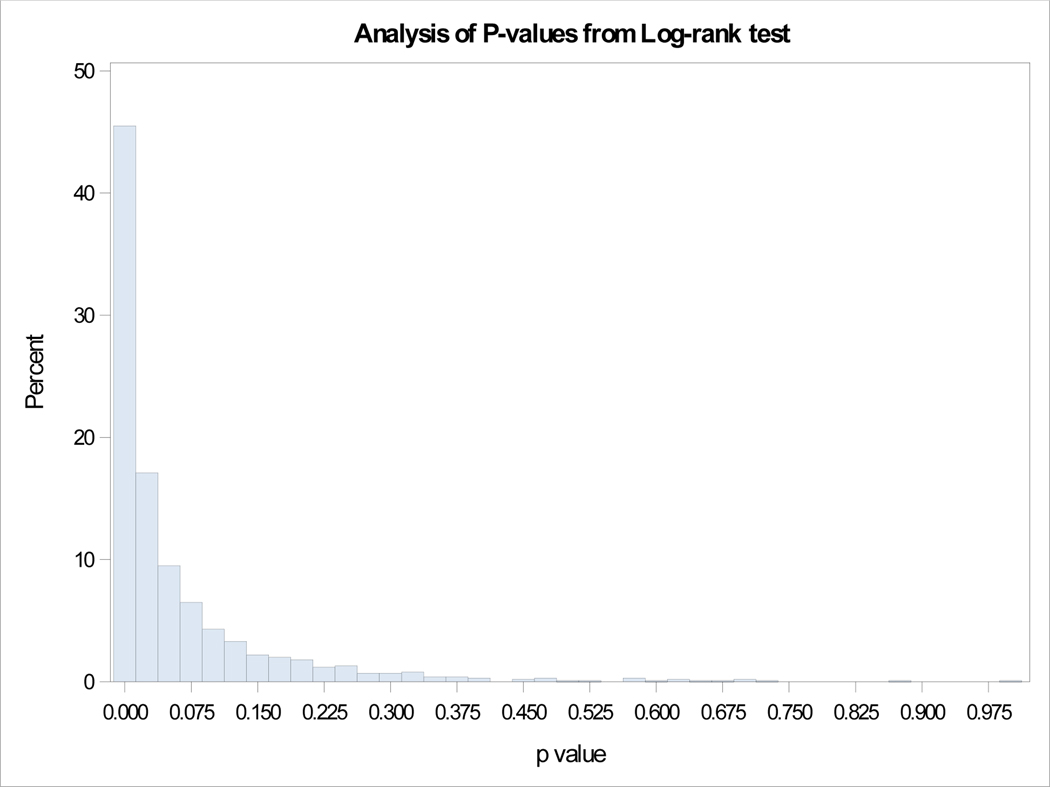
Our SEER database included 2829 metastatic patients with 938 G1, 447 G2 and 1444 high grade (G3/G4) tumors. Survival differences were significant between G1, G2 and G3 categories as seen in Figure 2a. Out of the 938 NET-G1 patients, 250 (26.65%) were randomly assigned a G2 status and out of 447 NET-G2 patients 57 (12.75%) were assigned a G1 status. The survival differences between G1 and G2 tumors were compared with log rank tests and the experiment was repeated 1000 times. Kaplan-Meier curves for four examples from 1000 repetitions are shown in Figure 2b and a histogram of p-values is shown in Figure 3. The mean p-value was 0.063 (95% CI: 0.056 – 0.070), essentially eliminating any meaningful differences between G1 and G2 survivals. We ran the analyses for a subset of 363 metastatic PanNENs with similar results (mean p=0.549, 95% CI:0.532 to 0.565).
Figure 2a.
SEER OS for metastatic patients of all grades (left) and G1/G2 (right).
Figure 2b.
SEER OS KM for various p-values of metastatic G1/G2 patients.
Figure 3.
Analysis of p-values from log-rank tests
Discussion
Neuroendocrine neoplasms can behave in various ways and a lot of survival estimates are dependent on accurate staging and grading. The literature has pointed to some prognostic factors in PanNEN patients; these include age, performance status, tumor grade and stage. Grade 3 tumors have arguably the worst prognosis, but there are also significant survival differences between G1 and G2 categories in aggregate retrospective data[3 7]. While some of these parameters are easier to calculate, pathological evaluation can be daunting. In this paper we have examined the accuracy of grading in adequately resected PanNENs and found a discrepancy between 12–26% in characterization of G1 and G2 disease but no major mischaracterization of G3 disease. Our approach to regrading consisted entirely of strict adherence to the WHO 2017 criteria and current grading guidelines. We also found that proper training and careful attention to guidelines eliminated discrepancies in grade characterization between two blinded hematopathologists. Regrading of the samples did not affect the survival estimates in our database. We then further applied this error rate to SEER data and found that the reported survival differences between G1 and G2 NEN and PanNEN patients are eliminated most of the time, something raises serious concerns about what is generally known about these patients.
Our study highlights the challenges of pathological NEN evaluation. Differentiation is established by visual assessment of H&E sections and is generally agreed upon. Well differentiated PanNENs have an organoid architecture with a variety of growth patterns (gyriform, nested, glandular, or solid), and cytologically usually monomorphic, with granular chromatin pattern, and clear to eosinophilic cytoplasm. Poorly differentiated PanNENs on the other hand, have obvious cytologic atypia with pleomorphism, irregular chromatin pattern, frequent apoptosis and necrosis; this and the low number of cases from our cohort of resected tumors might explain the 0% error rate. Estimation of Ki-67 index can be difficult, especially at the low levels of <3% needed to call a specimen G1. There are many reasons behind that. Pathologists are faced with heavy workload and can have limited experience, including lack of awareness of the standardized protocol for grading NENs. Errors can happen due to well described tumor heterogeneity, including proliferation rates in different areas of the tumor [9], and it is recommended to determine the Ki-67 index from a hot-spot area[10]. Automated counting is not available widely and the commonly used visual estimation is the most erroneous method[8]. In breast cancer, visual assessment has been supplemented with automated computerized systems but discordances are common[10] and require pathology verification[11]. A quality assurance study[12] by the Danish breast cancer cooperative group (DBCG) showed moderate to good interobserver agreement between two different assessment methods but an international study[13] showed good intra-laboratory but poor inter-laboratory reproducibility. In PanNENs, a study that compared four different counting methodologies in multiple institutions[8] found that manual counting from a printed image was the least error prone (compared to visual estimation or computerized image analysis). While it still works to broadly place the tumors into the corresponding grades by crude methods, in tumors whose Ki-67 indices approach the grade cut-offs, a more objective way of assessing Ki-67 should be employed. This includes determining the most mitotically active areas within the tumor and selecting the right block to perform Ki-67 staining; then, if automated programs are not available, one should count at least 500 cells in the hot-spot areas and determine the percentage. We proved that adherence to guidelines eliminated grading discordance between two blinded gastrointestinal pathologists, so there is definitely potential for improvement.
Our original SEER database showed significant differences in OS between G1/G2 patients, but we were unable to find differences in survivals between regraded institutional or metastatic G1/G2 SEER patients, where survival differences should be more obvious. Our error estimates were in an ideal sample (fully excised single origin NENs in a tertiary center, reviewed by expert pathologists), so it is possible that the error rates are higher in the community, where experience in NENs is limited and adherence to the guidelines is less, or between different institutions and tissues of origin. Our findings reflect either assessment error or actual lack of differences in survival between G1/G2. This is hardly surprising and actually consistent with practice patterns in the US. For example, current NCCN guidelines[5] do not suggest different approaches between well (G1) and moderately (G2) differentiated tumors. Most oncologists will treat aggressive / G3 tumors with a chemotherapy combination and G1 tumors with hormonal manipulation. For G2 cases, a good percentage of the time oncologists will try to infer the aggressiveness based on growth rate, tumor burden and whether the proliferation markers are closer to the lower (G1) or higher (G3) category, but it is safe to say that most will adopt an initial conservative strategy similar to G1s. We believe that mischaracterization might have rendered G1 and G2 categories indistinguishable from each other survival wise and potentially has deprived some patients of more (or less) aggressive therapy. It also raises questions as to whether the Ki-67 threshold should be higher than 3% to accurately distinguish tumors with different biological behaviors.
Our analysis has quite a few limitations. It is a retrospective study of PanNEN patients who underwent surgery in a tertiary center. The use of only PanNEN histology and the subjectivity of Ki-67 measurement (even by two hematopathologists) might have introduced bias in the estimation of the G1/G2 error rate. The error rate could be vastly different in the SEER database, which included metastatic patients with various histologies from many institutions, as well as from the community. We still believe that Ki-67 staining and manual counting techniques should be standard regardless of background histology. We did not have access to genetic data and patients received various treatments that could have impacted prognosis. We view our analyses as more hypothesis generating than actually proving that G1 and G2 histologies are biologically equivalent. We believe that examination of the rare NEN tumor specimens should be confirmed by a specialized pathologist with experience and updated training. We furthermore would like to verify the usefulness of the 3% Ki-67 cutoff and the G1/G2 categorization in a prospective clinical trial.
Figure 1c-d.
Overall survival (OS) in uncorrected (left) and corrected (right) grading.
Acknowledgments:
Preliminary data for this paper was presented in abstract form at the 2018 NANETS conference in Seattle, Washington.
Funding/Support:
G.A.W. and J.L. supported by the SPORE grant 5P50CA196510-02. REDCap Supported by Clinical and Translational Science Award (CTSA) Grant [UL1 TR000448] and Siteman Comprehensive Cancer Center and NCI Cancer Center Support Grant P30 CA091842.
Footnotes
Statement of ethics: This research was conducted ethically and in accordance with the World Medical Association Declaration of Helsinki. Approval for the study was obtained from the Washington University Institutional Review Board.
Prior presentation: Early data from this study was presented in abstract form in NANETs 2018 (abstract 105).
Disclosures:
Authors declare no conflict of interest.
References:
- 1.Merath K, Bagante F, Beal EW, et al. Nomogram predicting the risk of recurrence after curative-intent resection of primary non-metastatic gastrointestinal neuroendocrine tumors: An analysis of the U.S. Neuroendocrine Tumor Study Group. Journal of surgical oncology 2018;117(5):868–78 doi: 10.1002/jso.24985[published Online First: Epub Date]|. [DOI] [PMC free article] [PubMed] [Google Scholar]
- 2.Singhi AD, Klimstra DS. Well-differentiated pancreatic neuroendocrine tumours (PanNETs) and poorly differentiated pancreatic neuroendocrine carcinomas (PanNECs): concepts, issues and a practical diagnostic approach to high-grade (G3) cases. Histopathology 2018;72(1):168–77 doi: 10.1111/his.13408[published Online First: Epub Date]|. [DOI] [PubMed] [Google Scholar]
- 3.Yao JC, Hassan M, Phan A, et al. One hundred years after “carcinoid”: epidemiology of and prognostic factors for neuroendocrine tumors in 35,825 cases in the United States. J Clin Oncol 2008;26(18):3063–72 doi: 10.1200/JCO.2007.15.4377[published Online First: Epub Date]|. [DOI] [PubMed] [Google Scholar]
- 4.Lauffer JM, Zhang T, Modlin IM. Review article: current status of gastrointestinal carcinoids. Aliment Pharmacol Ther 1999;13(3):271–87 [DOI] [PubMed] [Google Scholar]
- 5.Shah MH, Goldner WS, Halfdanarson TR, et al. NCCN Guidelines Insights: Neuroendocrine and Adrenal Tumors, Version 2.2018. J Natl Compr Canc Netw 2018;16(6):693–702 doi: 10.6004/jnccn.2018.0056[published Online First: Epub Date]|. [DOI] [PubMed] [Google Scholar]
- 6.Manisha HS, Whitney SG, Thorvardur RH, et al. NCCN Guidelines Insights: Neuroendocrine and Adrenal Tumors, Version 2.2018. Journal of the National Comprehensive Cancer Network J Natl Compr Canc Netw 2018;16(6):693–702 doi: 10.6004/jnccn.2018.0056[published Online First: Epub Date]|. [DOI] [PubMed] [Google Scholar]
- 7.Dasari A, Shen C, Halperin D, et al. Trends in the Incidence, Prevalence, and Survival Outcomes in Patients With Neuroendocrine Tumors in the United States. JAMA Oncol 2017;3(10):1335–42 doi: 10.1001/jamaoncol.2017.0589[published Online First: Epub Date]|. [DOI] [PMC free article] [PubMed] [Google Scholar]
- 8.Reid MD, Bagci P, Ohike N, et al. Calculation of the Ki67 index in pancreatic neuroendocrine tumors: a comparative analysis of four counting methodologies. Modern pathology : an official journal of the United States and Canadian Academy of Pathology, Inc 2015;28(5):686–94 doi: 10.1038/modpathol.2014.156[published Online First: Epub Date]|. [DOI] [PMC free article] [PubMed] [Google Scholar]
- 9.Nunez-Valdovinos B, Carmona-Bayonas A, Jimenez-Fonseca P, et al. Neuroendocrine Tumor Heterogeneity Adds Uncertainty to the World Health Organization 2010 Classification: Real-World Data from the Spanish Tumor Registry (R-GETNE). Oncologist 2018. doi: 10.1634/theoncologist.2017-0364[published Online First: Epub Date]|. [DOI] [PMC free article] [PubMed] [Google Scholar]
- 10.Laurinavicius A, Plancoulaine B, Laurinaviciene A, et al. A methodology to ensure and improve accuracy of Ki67 labelling index estimation by automated digital image analysis in breast cancer tissue. Breast cancer research : BCR 2014;16(2):R35–R35 doi: 10.1186/bcr3639[published Online First: Epub Date]|. [DOI] [PMC free article] [PubMed] [Google Scholar]
- 11.Kwon A-Y, Park HY, Hyeon J, et al. Practical approaches to automated digital image analysis of Ki-67 labeling index in 997 breast carcinomas and causes of discordance with visual assessment. PLOS ONE 2019;14(2):e0212309 doi: 10.1371/journal.pone.0212309[published Online First: Epub Date]|. [DOI] [PMC free article] [PubMed] [Google Scholar]
- 12.Laenkholm A-V, Grabau D, Møller Talman M-L, et al. An inter-observer Ki67 reproducibility study applying two different assessment methods: on behalf of the Danish Scientific Committee of Pathology, Danish breast cancer cooperative group (DBCG). Acta Oncologica 2018;57(1):83–89 doi: 10.1080/0284186X.2017.1404127[published Online First: Epub Date]|. [DOI] [PubMed] [Google Scholar]
- 13.Polley M-YC, Leung SCY, McShane LM, et al. An international Ki67 reproducibility study. Journal of the National Cancer Institute 2013;105(24):1897–906 doi: 10.1093/jnci/djt306[published Online First: Epub Date]|. [DOI] [PMC free article] [PubMed] [Google Scholar]


