Abstract
The deep eutectic solvent choline and geranate (CAGE) has shown promise in many therapeutic applications. CAGE facilitates drug delivery through unique modes of action making it an exciting therapeutic option. We examine the behavior of aqueous CAGE solutions at a liquid-vapor interface. We find that the liquid-vapor interface induces large oscillations in the density, which corresponds to spontaneous segregation into regions enriched with geranate and geranic acid and other regions enriched with water and choline. These heterogeneities are observed to extend nanometers into the liquid. Additionally, we find that the geranate and geranic acid orient so that their polar carboxyl or carboxylate groups are on average pointed toward the layer containing water and choline. Finally, we report surface tension and thermal expansion coefficients for various concentrations of aqueous CAGE. We find a non-monotonic trend in the surface tension with concentration. The structural and thermodynamic properties we report provide a new perspective on CAGE behavior, which helps deduce the action of CAGE in more sophisticated systems and inspire other studies and applications of CAGE and related materials.
1. Introduction
Ionic liquids are a class of materials that are composed of ions that are liquid at some temperature of interest. Such materials have attracted a significant amount of interest as solvents or additives to affect many processes.1 Salts that are liquid below 100°C are sometimes what is implied by ionic liquids, and they have presented many alternative options to traditional solvents. Exact quantification of the number of ionic liquids is not realistically possible, but Plechkova and Seddon estimate there are millions of possible room temperature ionic liquids.2 This immense number of materials presents a great opportunity to design a solvent environment that can have a specific effect. Furthermore, ionic liquids can be mixed to form binary or ternary solvent environments that manifest even greater versatility. Yet another path to increase tunability is to introduce a neutral species to an ionic liquid, forming a so-called ‘deep eutectic solvent’. A significant portion of the promise of these materials is their immense diversity.1,3 As new material development strategies are employed, even more materials become available, which makes their development and characterization a monumental challenge. This idea of ‘tunability’ of ionic liquids and deep eutectic solvents encompasses properties of the material itself, its solvent properties, sourcing of the materials, and even secondary effects like toxicity. Many studies searching for and characterizing these materials have approached the application of ionic liquids and deep eutectic solvents as a search for the appropriate material with the desired properties for a particular purpose,1,4,5 which means searching for a suitable material for some process is a protracted process of characterization and evaluation from many different perspectives. These wide-ranging considerations mean that the full characterization of these materials is an incremental process of evaluation in various environments and situations. In this work, we examine fundamental behavior of a deep eutectic solvent, choline and geranate, that has shown promising behavior in multiple important biological applications.
The deep eutectic solvent choline and geranate, or CAGE, has emerged as a material with remarkable apparent selectivity in some biomedical applications.4 The three components of CAGE are shown in Fig. 1. CAGE has been shown to selectively affect mammalian and bacterial cells differently and it has been shown to facilitate transdermal and oral delivery of important biologically active compounds.4,6,7 This suggests that CAGE could be the basis for novel treatment strategies, particularly for drugs that are otherwise difficult to deliver to their site of action with current methods.
Fig. 1:
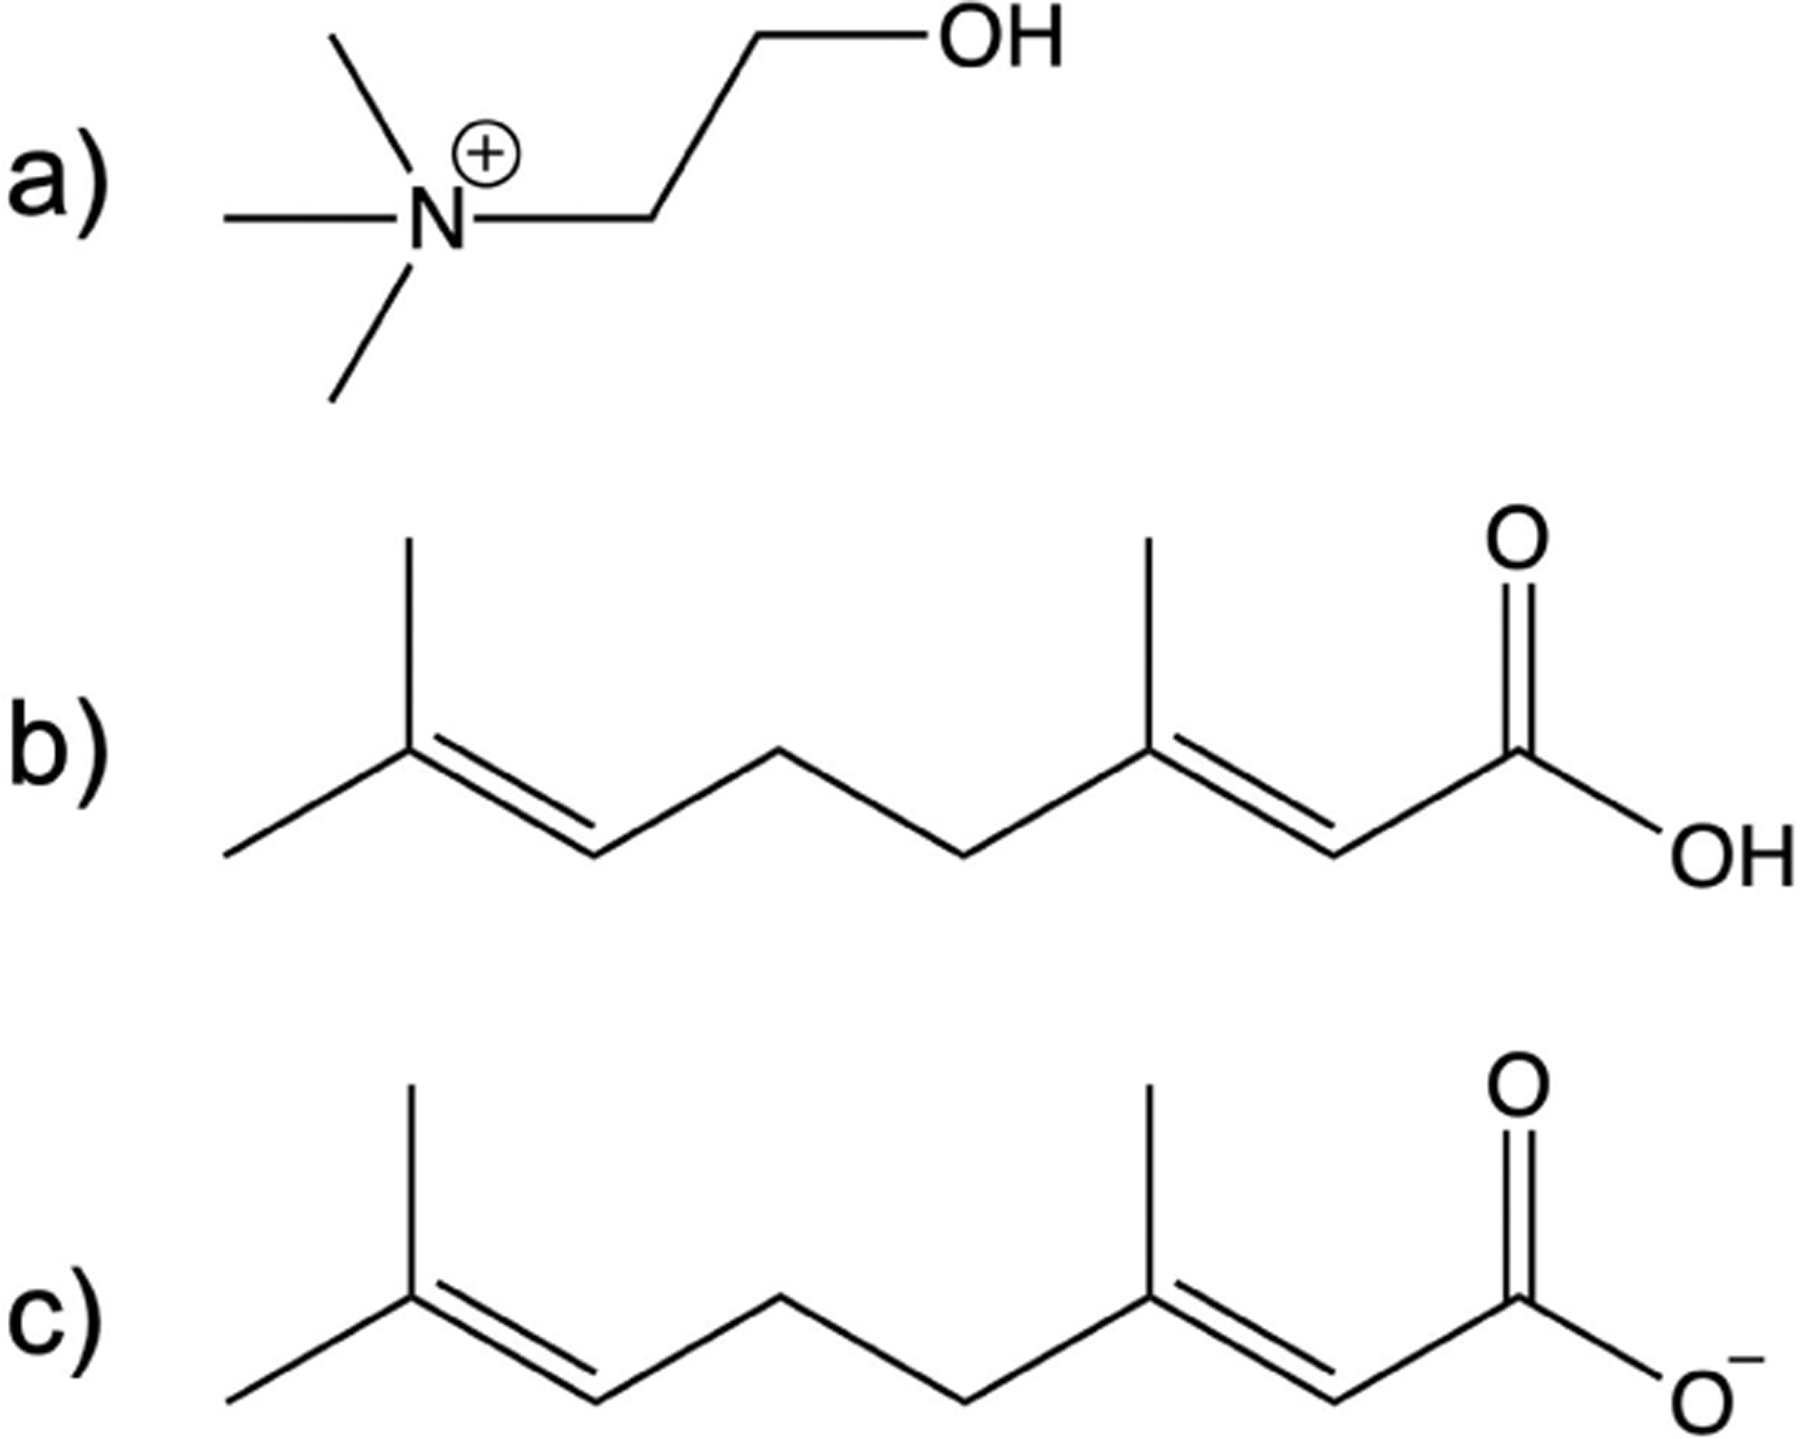
The deep eutectic solvent choline and geranate, which is often collectively called CAGE, is composed of a) choline, b) geranic acid, and c) geranate. These components can be mixed at different ratios, but in this work we only consider 1:1:1 mixtures.
Despite sophisticated studies involving CAGE in increasingly complex biological systems with profound medicinal implications,4,6–8 there remain unanswered questions about the fundamental behavior of CAGE. Studies of relatively simple systems provide a baseline for CAGE properties for reference when more sophisticated, heterogeneous environments are studied. In 2019, Tanner et al. used simulation and experiment to characterize the effect of water on the bulk properties of CAGE.9 At low concentrations, they didn’t identify notable effects on CAGE properties, but above a 0.65 mole fraction of CAGE in water the system is seen to segregate into polar and nonpolar regions. This segregation results in shifts in some properties, most notably a large increase in the viscosity. Di Lecce and coworkers developed interaction potentials for a SAFT-γ Mie-based model of CAGE and related systems and were able to predict phase equilibria and osmotic pressures with good agreement between models and experiment. Despite the very good agreement, there was evidence of possible large-scale structural rearrangements in aqueous CAGE, which would possibly not be captured by the SAFT-γ Mie model.10 Takeda et al. used small-angle X-ray scattering and NMR to examine structure in aqueous CAGE solutions.11 They found that at 0.83 mole fraction CAGE concentrations result in nanoscale aggregates. From 0.04 to 0.11 mole fraction, a transition to a lamellar phase is observed. Finally, at a mole fraction of 0.02, CAGE transitioned to a micellar phase. These studies found evidence for rich, complex structures in bulk mixtures of CAGE and water. They do not explicitly consider the introduction of heterogeneities, which admittedly are beyond the scope of the studies mentioned. However, simple heterogeneities can help understand observations made in more complex systems.
The use of CAGE in real world processes often involves its incorporation into complex environments. This is reflected in the previous paragraphs describing the use of CAGE to modify various biological processes. Complete characterization of large-scale heterogeneous and dynamic systems can be difficult. For example, as previously mentioned, studies have shown that certain bacteria can be targeted by CAGE, while mammalian cells are less affected.4 The role of CAGE in modifying the aqueous environment around the cells, extracellular environment, cell membrane, proteins in the systems, and so on (where each of these categories are ensembles of environments) is important for describing the effect of CAGE, but are difficult to tease apart. There are therefore a multitude of effects of CAGE when it is introduced into such a system. For this reason, consideration of model systems that can isolate specific features of CAGE behavior can provide important insight into its effects. Therefore, we have studied CAGE at a simple interface as a means to understand its interfacial behavior and serve as a baseline for more complex systems. Specifically, in this work, we use computational molecular dynamics simulations to study the structure and dynamics of aqueous CAGE solutions at a liquid-vapor interface. Such an approach provides a simple proxy for behavior at hydrophobic surfaces, which can be useful for deciphering the effect of CAGE solutions on lipid bilayers, on hydrophobic solutes with more complex geometries, or other heterogeneous systems containing CAGE. Similar approaches have been employed to study many other molecular systems12,13 and on ionic liquid systems,14,15 but, the tremendous diversity of ionic liquid-based solvents motivates this work, since different materials have subtle differences that affect their properties. These interfacial simulations permit evaluation of the effect of the liquid-vapor interface on the structure and orientation of each species as well as thermodynamic properties under idealized conditions.
2. Methods
System setup and force fields
Molecular dynamics simulations were used to study aqueous CAGE at various concentrations at the liquid-vapor interface. In this work, all simulations included a 1:1:1 ratio of choline:geranate:geranic acid. Table 1 shows the composition of each system studied, including the mole fraction of CAGE and the number of each species in the simulation. The mole fraction is calculated as
| (1) |
where is the species for which the mole fraction is being calculated, is the number of moles of species , and is the number of . Finally, the mole fraction of CAGE is defined as
| (2) |
Table 1:
Number of each CAGE component used in each interfacial simulation.
| choline | geranate | geranic acid | water | |
|---|---|---|---|---|
| 0.55 | 400 | 400 | 400 | 1,000 |
| 0.64 | 600 | 600 | 600 | 1,000 |
| 0.71 | 800 | 800 | 800 | 1,000 |
| 1.00 | 600 | 600 | 600 | - |
Initial random configurations were prepared using Packmol.16 For the most part, file preparation, simulation, and analysis were performed with the Amber suite of programs.17 CAGE force field parameters were described using the second generation general Amber force field GAFF2 and charges were determined using AM1-BCC.18 Water interactions were described with the TIP3P model.19 In this work, out to 8 Å electrostatic interactions are calculated with a real space summation and beyond 8 Å they are calculated with the particle mesh Ewald algorithm. Following the convention in the Amber force field, the Lorentz-Berthelot mixing rules were used to determine Lennard-Jones interactions for different atom types.
Bulk liquid simulations
Simulations of the bulk liquid were used for initial preparation of each system as well as a reference point for subsequent interfacial simulations. These consisted of three main steps: minimization, equilibration, and production. The energy minimization consisted of 100,000 total steps where the first 500 steps used the steepest descent algorithm and then the remaining steps used the conjugate gradient algorithm. Minimization is used to remove very high energy configurations, and not for the identification of local minima or for obtaining energy convergence. The equilibration entailed 1 ns in the NPT (constant pressure, constant temperature) ensemble with a pressure of 1 bar and temperature of 298 K. All simulations used the GPU implementation of pmemd, a 1 fs time step, and maintained a constant temperature with the Langevin thermostat using a collision frequency of 5 ps-1. The pressure was controlled with the Berendsen barostat with a pressure relaxation time of 1 ps. A cutoff of 8 Å was used for van der Waals non-bonded interactions. Finally, the production simulation was 10 ns in the NPT ensemble. The bulk liquid properties reported are obtained from these 10 ns simulations. Fig. 2a shows a representative configuration of the bulk liquid from a pure CAGE simulation.
Fig. 2:

Snapshots of the a) bulk and b) interfacial systems. The choline ion is depicted in blue, geranate ion in green, and geranic acid in purple and the simulation cell boundaries are shown in black. Both systems employ three-dimensional periodic boundary conditions.
Liquid-vapor interface simulations
These configurations were prepared from the end of the bulk liquid production simulation. The liquid-vapor interface was introduced for each system by extending the box along the z-axis by 160 Å. Fig. 2 shows representative snapshots of the bulk (Fig. 2a) and interfacial (Fig. 2b) configurations. In both system setups, three-dimensional periodic boundary conditions are used. The interfacial configuration contains two interfaces that are on average parallel to each other. These were simulated for a total of 200 ns in the isochoric, isothermal (NVT) ensemble. More information about the surface tension simulations and calculations is provided later in the surface tension section.
Bulk liquid simulations with RESP charges
We also carried out an additional pure DES simulation of CAGE using modified sets of molecular parameters and simulation options as detailed below to investigate how robust the CAGE density is with respect to variations in the simulation protocol. This simulation is only used to compare bulk CAGE densities across multiple force fields and protocols with experiment. Packmol was used to create a system consisting of 200 each of choline, geranate, and geranic acid. In this case, the charges for the molecules were determined using the RESP procedure.20 This involved a geometry optimization and molecular energy calculation using HF 6–31G(d)/HF 6–31G(d) in Gaussian09, and then utilization of the program antechamber to perform the RESP charge fitting.21 A scaling factor of 0.8 was applied to all charges, which is commonly done to reduce the viscosity of ILs and DESs.22,23 For all other interaction parameters, the GAFF2 force field was used.18 The simulation protocol used AMBER16.17 First, the system was energy minimized. The minimization was for 5000 total steps, including 2500 steps of steepest descent followed by 2500 steps of conjugate gradient. Following minimization, dynamics were carried out. The system temperature was set to 310 K and controlled with the Langevin thermostat using a collision frequency of 1 ps-1. The SHAKE algorithm was used to restrain covalent bonds containing hydrogen atoms to allow for a larger time step of 2 fs. The simulation was carried out at a constant pressure of 1 bar. The interaction cutoff was set to 10 Å for all phases of the simulation. In total, 296 ns of simulation were performed for this system. The final reported average density was calculated over the last 5 ns of simulation is 1.012±0.002 g mL-1. While we did not perform an exhaustive search across possible parameters, the results obtained from this test suggest that there are not dramatic differences in the observed CAGE density with respect to reasonably selected simulation parameters and protocols.
Number density profiles
In the dimension perpendicular to the interface (z-axis in this work), we calculated profiles of the number density to characterize the effect of the interface on the distribution of molecules. These were determined by calculating histograms of species center of mass for entire production simulations with 0.75 Å bins. These histograms were then normalized by dividing by the number of frames in the trajectory and the volume of each bin used (0.75×80×80 Å3). The total density profile includes all species, while the component density profiles include the indicated species.
Gibbs dividing surface
When studying two phases in contact, it is common to define the boundary between them using the Gibbs dividing surface.24 The Gibbs dividing surface is the plane perpendicular to the total number density profile with a density halfway between the densities of the vapor and liquid regions. In the density profiles presented in this work, the systems are shifted to position the left Gibbs dividing surface at the origin.
Spatial ordering of each species
Spatial ordering of each component of CAGE within each system was analyzed by assigning vectors to each molecule and calculating the angle with respect to a vector normal to the Gibbs dividing surface (the z-axis in this work). Figure 3 shows how the vector was defined for each component of CAGE as well as the vector normal to the interface. We then used the distance from the interface and the angle from the interface norm to construct two-dimensional histograms.
Fig. 3:
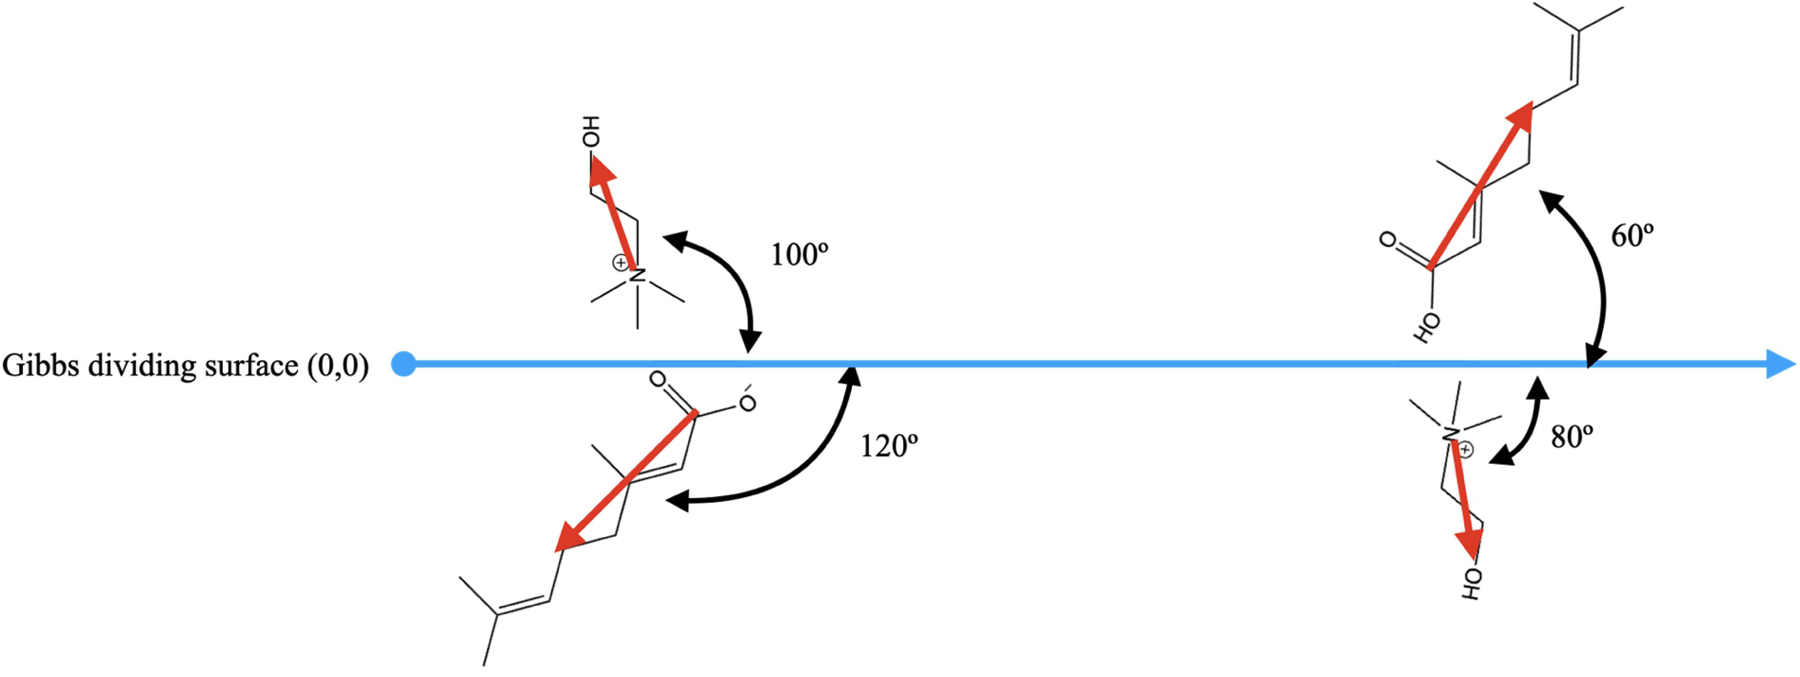
Diagram of species orientation vectors (red) in relation to the z-dimension vector (blue). For consistency, the angles are always measured on the right side of the intersection of the orientation and z-axis vectors. The geranic acid molecule and geranate ion vectors are defined from the carbonyl carbon to the alkyl chain carbon before the double bond. The choline ion vector begins at the nitrogen and ends at the oxygen atom. This analysis method gives rise to a diagonal symmetry observed in the probability distribution plots.
Surface tension
The surface tension of each system was calculated according to
| (3) |
where is the length of the simulation perpendicular to the interfaces and , , and are the diagonal components of the pressure tensors along each axis. This is like the work of Konieczny and Szefczyk.25
The GPU implementation of pmemd does not print the pressure tensor for constant volume simulations and furthermore the pressure tensor is not readily available. We therefore estimated , , and by performing a simulation in the NPT ensemble with a very large barostat relaxation time. The pressure relaxation time in the barostat was increased to 1500 ps to enable calculation of the pressure tensor while limiting changes in the simulation cell dimensions. These simulations also used a 16 Å cutoff for Lennard-Jones potential interactions and a tail correction.26 The pressure tensor data was obtained at 1 ps intervals during the simulation. The standard deviation in the mean was calculated by splitting our simulations into 20 segments of equal length. Following this protocol, we calculated the surface tension of TIP3P at 300 K to be 50.14 ± 0.4 mN m−1 which is in agreement with 52.3 ± 1.5 mN m−1 as previously reported by Vega and de Miguel.27 To reiterate, these simulations were only used to estimate γ, while all other properties and results reported were obtained from the simulations previously described that used a more standard protocol.
Thermal Expansion Coefficient
The thermal expansion coefficients for each system were calculated using the approximate expression
| (4) |
where ⍴ is the system density. The densities are obtained from 10 ns simulations at 298 and 330 K. This follows the protocol of Konieczny and Szefczyk used to calculate the thermal expansion coefficient of alkylimidazolium-based ionic liquids.25 Similar to the surface tension, the standard deviation was then calculated by splitting the simulations into 20 equal segments.
3. Results and Discussion
Comparison of charge parameterization schemes with experiment
There is limited physical characterization of pure CAGE in the literature, but we use the available experimental density values at 25°C to first evaluate our models. Fig. 4 shows the bulk density of pure CAGE obtained with GAFF2 and two different charge fitting schemes compared with experimental values. The small vertical axis range highlights differences between the datasets, but the observed agreement is good. The simulations employing GAFF2 with BCC charges are 1.4% larger than the average of the experimental values at 25°C. It is typically accepted that RESP-derived partial atomic charges are better than charges obtained from BCC, but we find that BCC performs slightly better. The performance of ionic liquid force fields is known to be sensitive to the charges, and this underscores the need for further study.22,28 The BCC- and RESP-derived densities differ by 1.8% of each other. The lack of CAGE thermodynamic, dynamic, and kinetic properties reported in the literature highlights the need for more basic physical characterization of this material.
Fig. 4:
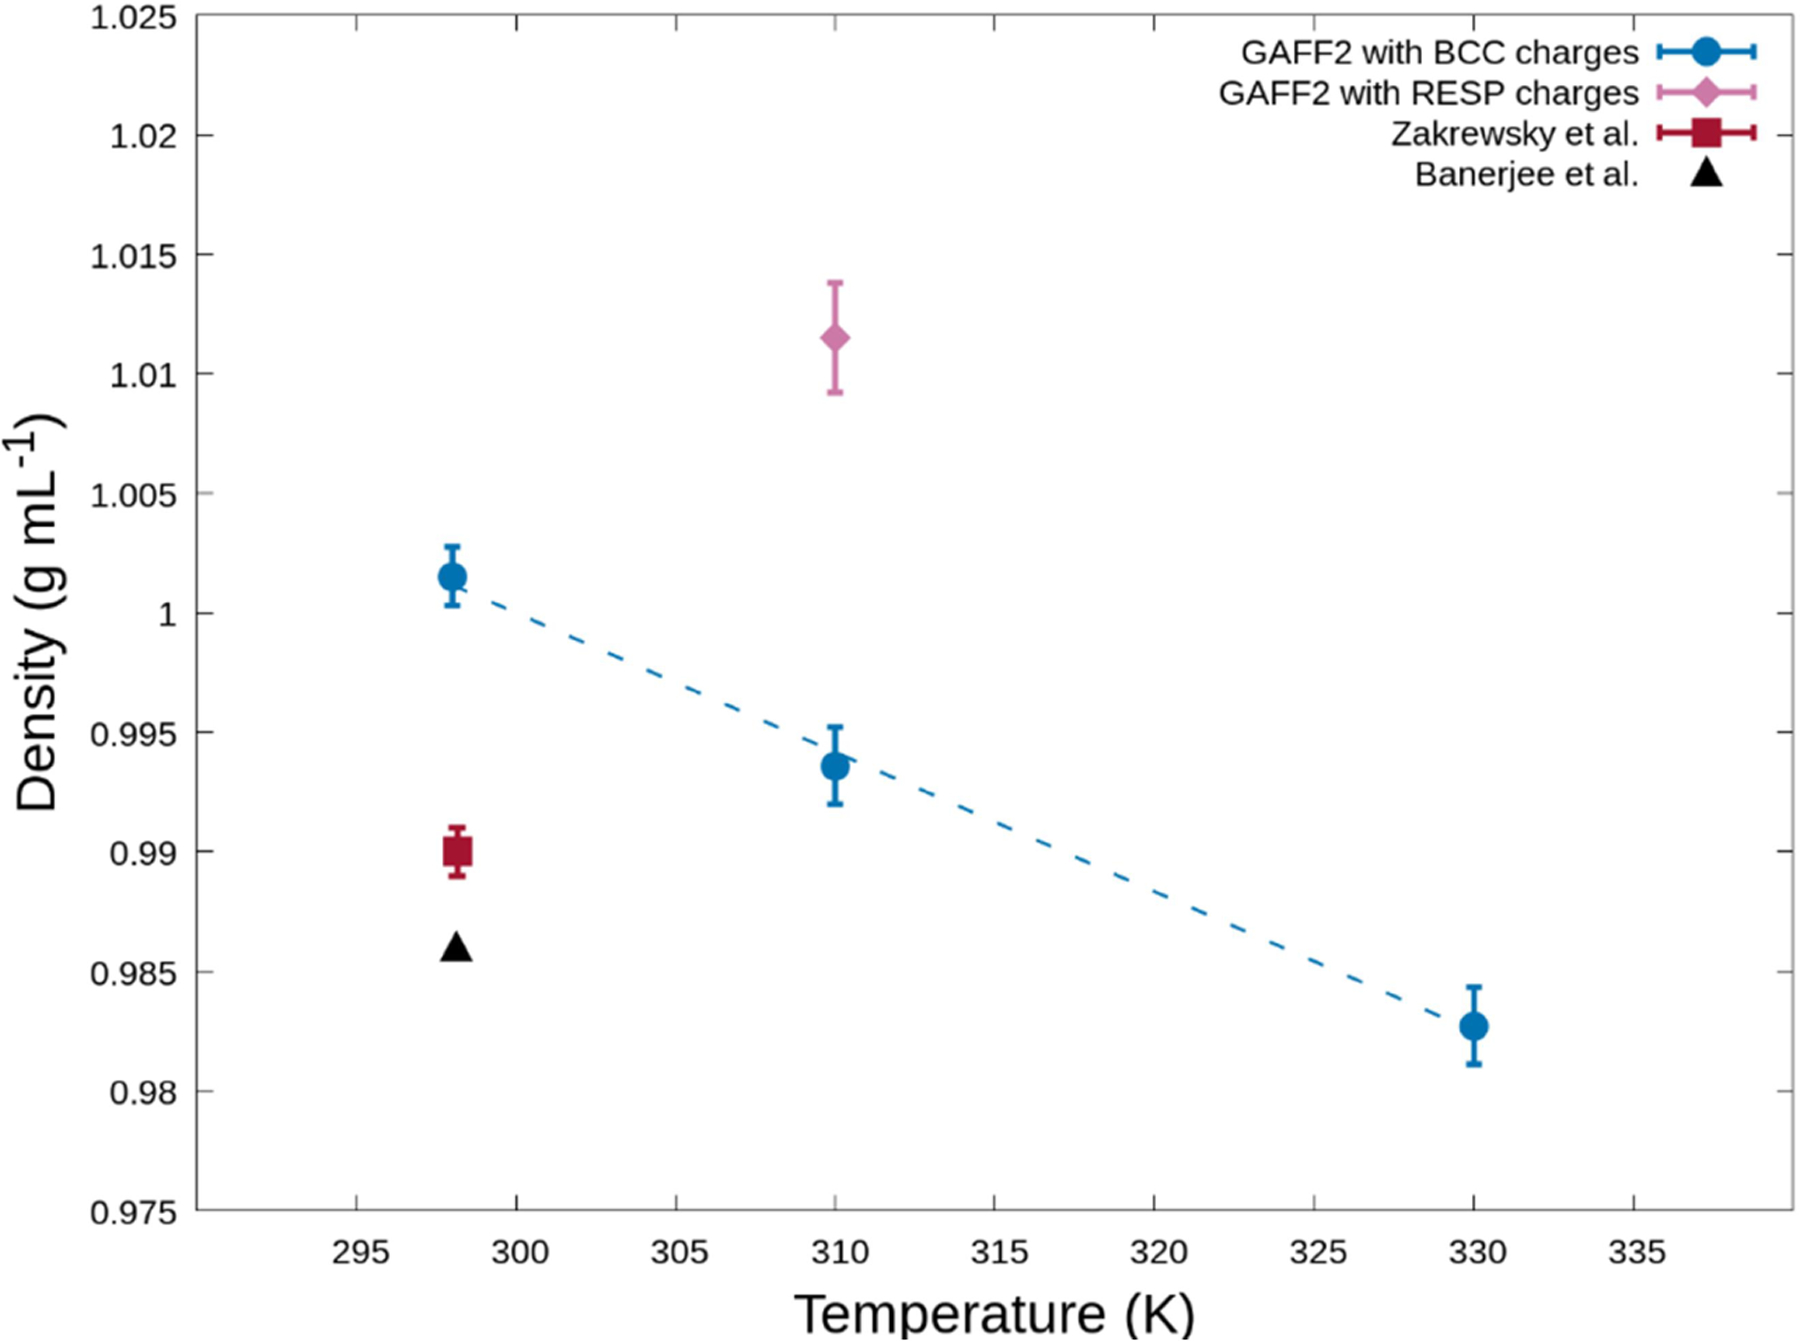
Temperature-dependence of density for pure bulk CAGE from our simulations compared with experimental values obtained from Zakrewsky et al.4 and Banerjee et al.29 The error in Zakrewsky et al.4 is estimated to be 0.001 g mL−1 based upon the authors’ estimation that the standard deviation is smaller than the significant figures reported. The dashed line for the GAFF2 with BCC charges dataset is included to guide the eye.
Density profiles show localization at the interface
The total density profile is shown in Fig. 5. The depicted profile is for a pure CAGE solution, but the other systems we studied yield similar profiles. The profiles reveal a high-density region near the interface. In Fig. 5, the density profile is positioned so that the left Gibbs dividing surface is at zero which results in the right interface occurring at about 80 Å. About 10 Å on the liquid side from each interface maxima in the density profiles are observed approximately 10% above the middle of the liquid region. Similar density oscillations induced by the interface have been observed in other systems.13,15,30–32 Furthermore, there are weak suggestions of density oscillations deeper in the liquid region, near 30 and 50 Å, but these are difficult to distinguish definitively from the noise in the curve. The signal and noise can be roughly distinguished by comparing the left and right sides of the density curve. As such, the large scale oscillations emphasized here are observed to be conserved and symmetric on both sides of the density profile, but smaller scale oscillations and discrepancies between the right and left sides of the curves are indicative of error in the density profiles.
Fig. 5:
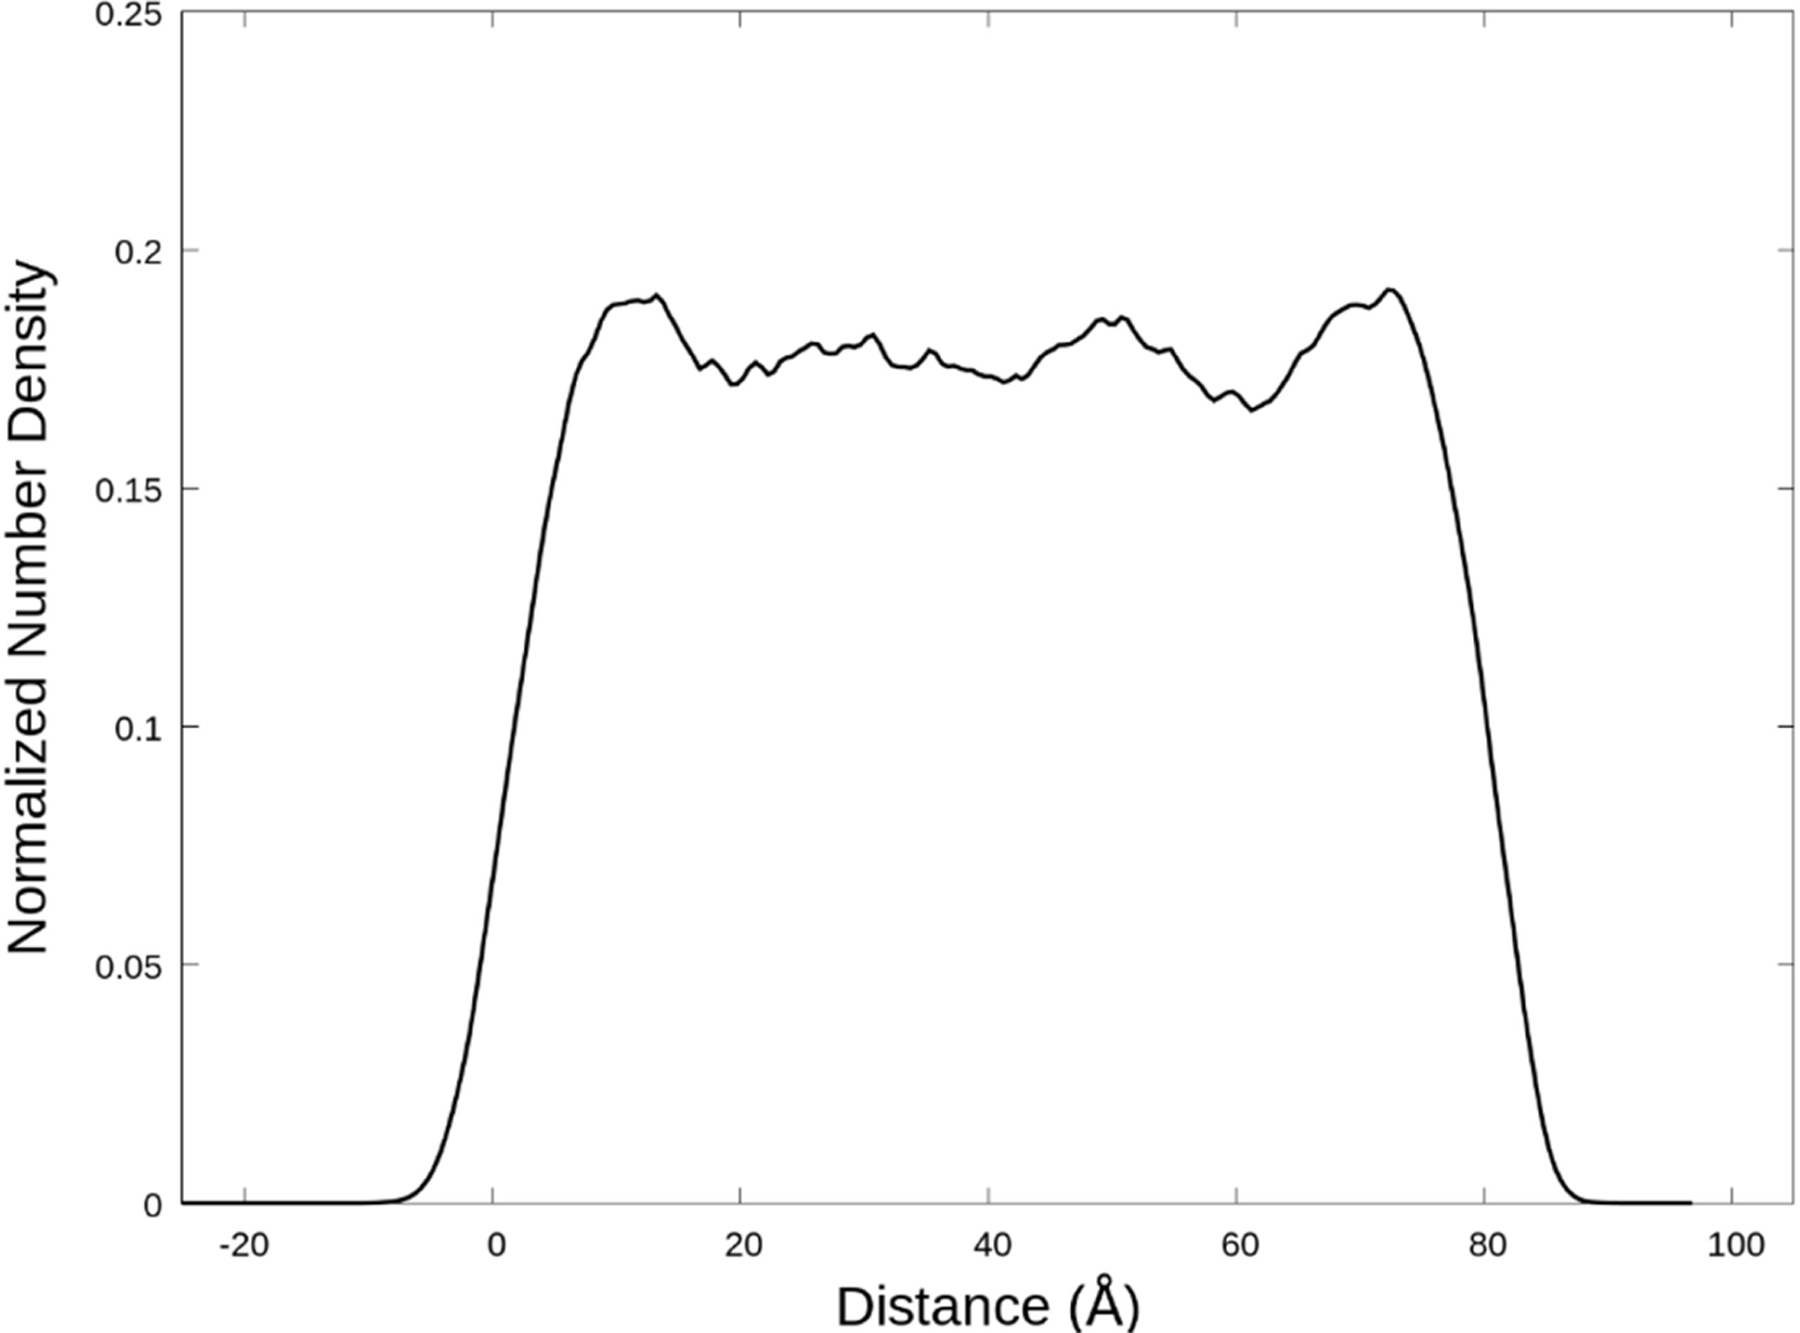
The total normalized number density profile perpendicular to the interface of a pure CAGE solution. The zero distance is selected to be the left Gibbs dividing surface of the slab. The vapor region isn’t entirely shown, so that the features of the liquid and interfacial regions are clearer. The shown data is from the simulation at 298 K, but other simulations were qualitatively similar.
We next examined the density profile of each species in the system relative to the interface (Fig. 6). In Fig. 6a, the density profile of each component of CAGE is shown relative to the distance from the Gibbs dividing surface. Geranate and geranic acid are found to be prevalent at the surface with a significant accumulation of choline buried about 5 Å from the surface. The geranate and geranic acid become noisy beyond the initial surface peak, but the choline cation is observed to have distinct density oscillations throughout the system for these simulations. The choline density oscillations are observed to align with the maxima observed in the total density profiles presented in Fig. 5. In Fig. 6b, we examine the component density profiles in a system including water. The qualitative behavior of the aqueous CAGE solution is similar to that of pure CAGE in Fig. 6a. The water is found to have distinct maxima buried below the interface reminiscent of choline. The more deeply buried oscillations seen for all choline profiles are not observed for water. The addition of water dampens the magnitude of the density oscillations but does not change the overall behavior.
Fig. 6:
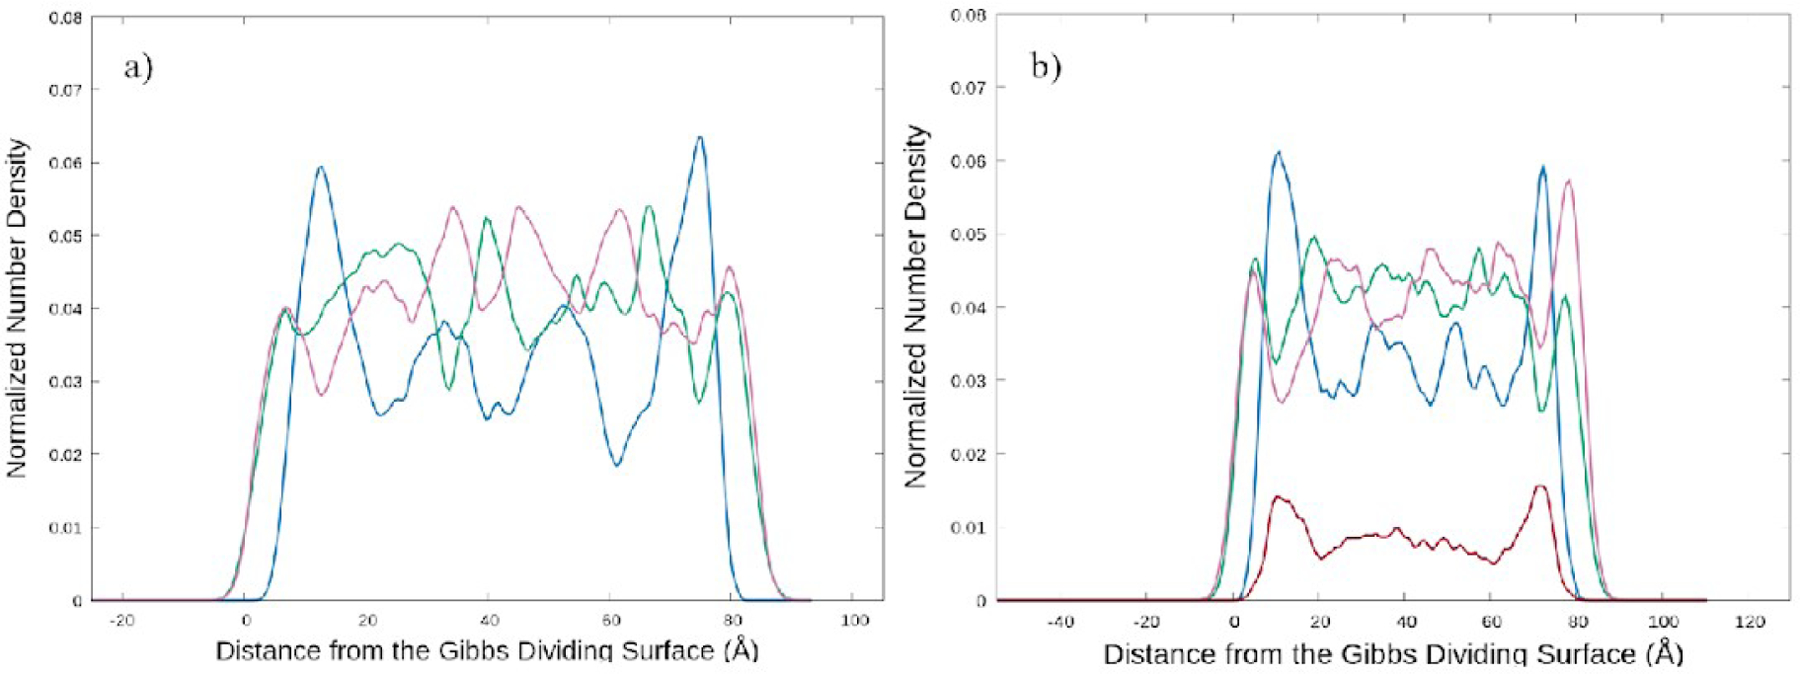
Normalized linear number density profile of each component of the system perpendicular to the Gibbs dividing surface for a system a) without water and b) with water (0.64 ). Geranate (green) and geranic acid (purple) are found to aggregate at the interface followed by a high density of choline (blue) in both systems.
It is interesting to compare the localization of each species at the liquid-vapor interface with CAGE behavior in a lipid bilayer.7 In model bacterial membranes composed of the lipid POPE, geranate and geranic acid are found to embed in the lipid bilayer aligning with the hydrophilic head group near the lipid head groups and the nonpolar tails alongside the lipid tails. The choline is then observed to generally remain in the aqueous region with the water. While these systems are dramatically different in composition and behavior, the pairing of geranate with geranic acid and choline with water is similar. Additionally, the CAGE interface is expected to be hydrophobic with geranate and geranic acid hydrocarbon tails occupying the surface. We further examine this with species orientation probability functions relative to the surface.
Orientation probabilities reveal preferred structure at the interface
Fig. 7 shows the two-dimensional probability distribution for the angle of each species to the Gibbs dividing surface normal vector and its distance from the Gibbs dividing surface. Corroboration of the linear density profiles shown in Fig. 5, choline ions are observed to aggregate below the Gibbs dividing surface, while the geranic acid and geranate are at the surface. We find that the geranate and geranic acid are likely to take on angles indicative of an orientation normal to the surface (see description in Fig. 3).
Fig. 7:
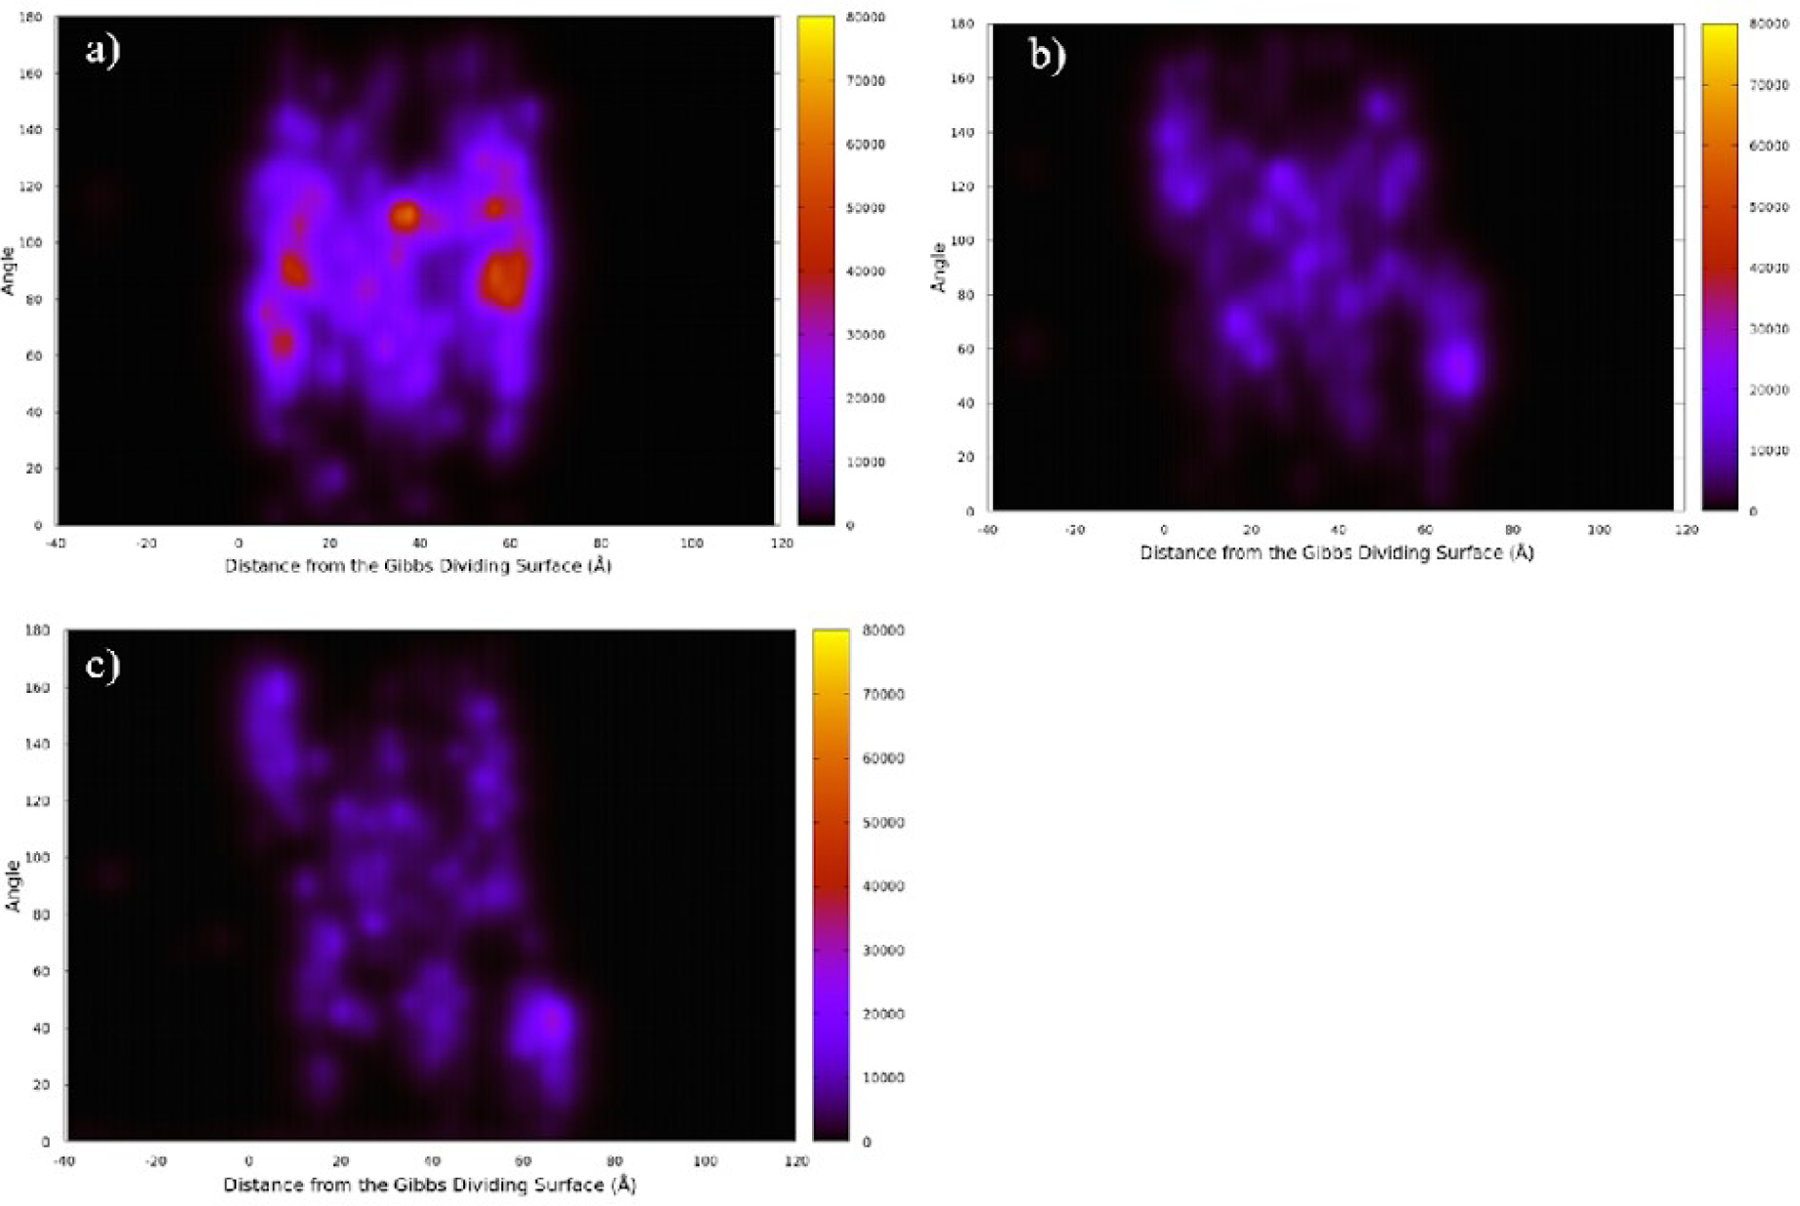
Probability distribution for the angles of a) choline b) geranate and c) geranic acid. Angles are relative to the Gibbs dividing surface normal vector and distance from the Gibbs dividing surface.
This method of data visualization indicates localization both occurring over the course of a 10 ns simulation as well as the spatial orientation of each component. Choline molecules can be observed to be spatially oriented parallel to the interface occurring in regions located in proximity to the liquid-vapor interface. For the remaining choline molecules in the system, choline can be observed to not orient towards the interface, but rather randomly arrange themselves resembling bulk behavior. Geranate and geranic acid are both observed to orient with the alkyl chain perpendicular to the interface at less localized regions near the liquid-vapor interface. For geranate and geranic acid molecules spatial ordering at the interface propagates further into the solution away from the interface. Indicating ordering at the interface can be expected to influence spatial orientation of molecules located further from the surface.
Surface tension and thermal expansion of CAGE solutions
The surface tension for each solution considered is shown in Fig. 8, including the surface tension obtained for pure TIP3P water. Initially we studied TIP3P only to check our protocol, but we found this result revealed a non-monotonic trend with concentration. Our calculations show that pure CAGE (48.4±0.4 mN m−1) has a slightly lower surface tension than water. The addition of water results in an increase in surface tension for intermediate concentrations, which then must drop to the surface tension of pure water. To our knowledge, this is the first report of the surface tension of aqueous CAGE solutions, but these values are similar to other choline-containing deep eutectic solvents reported in the literature.33
Fig. 8:
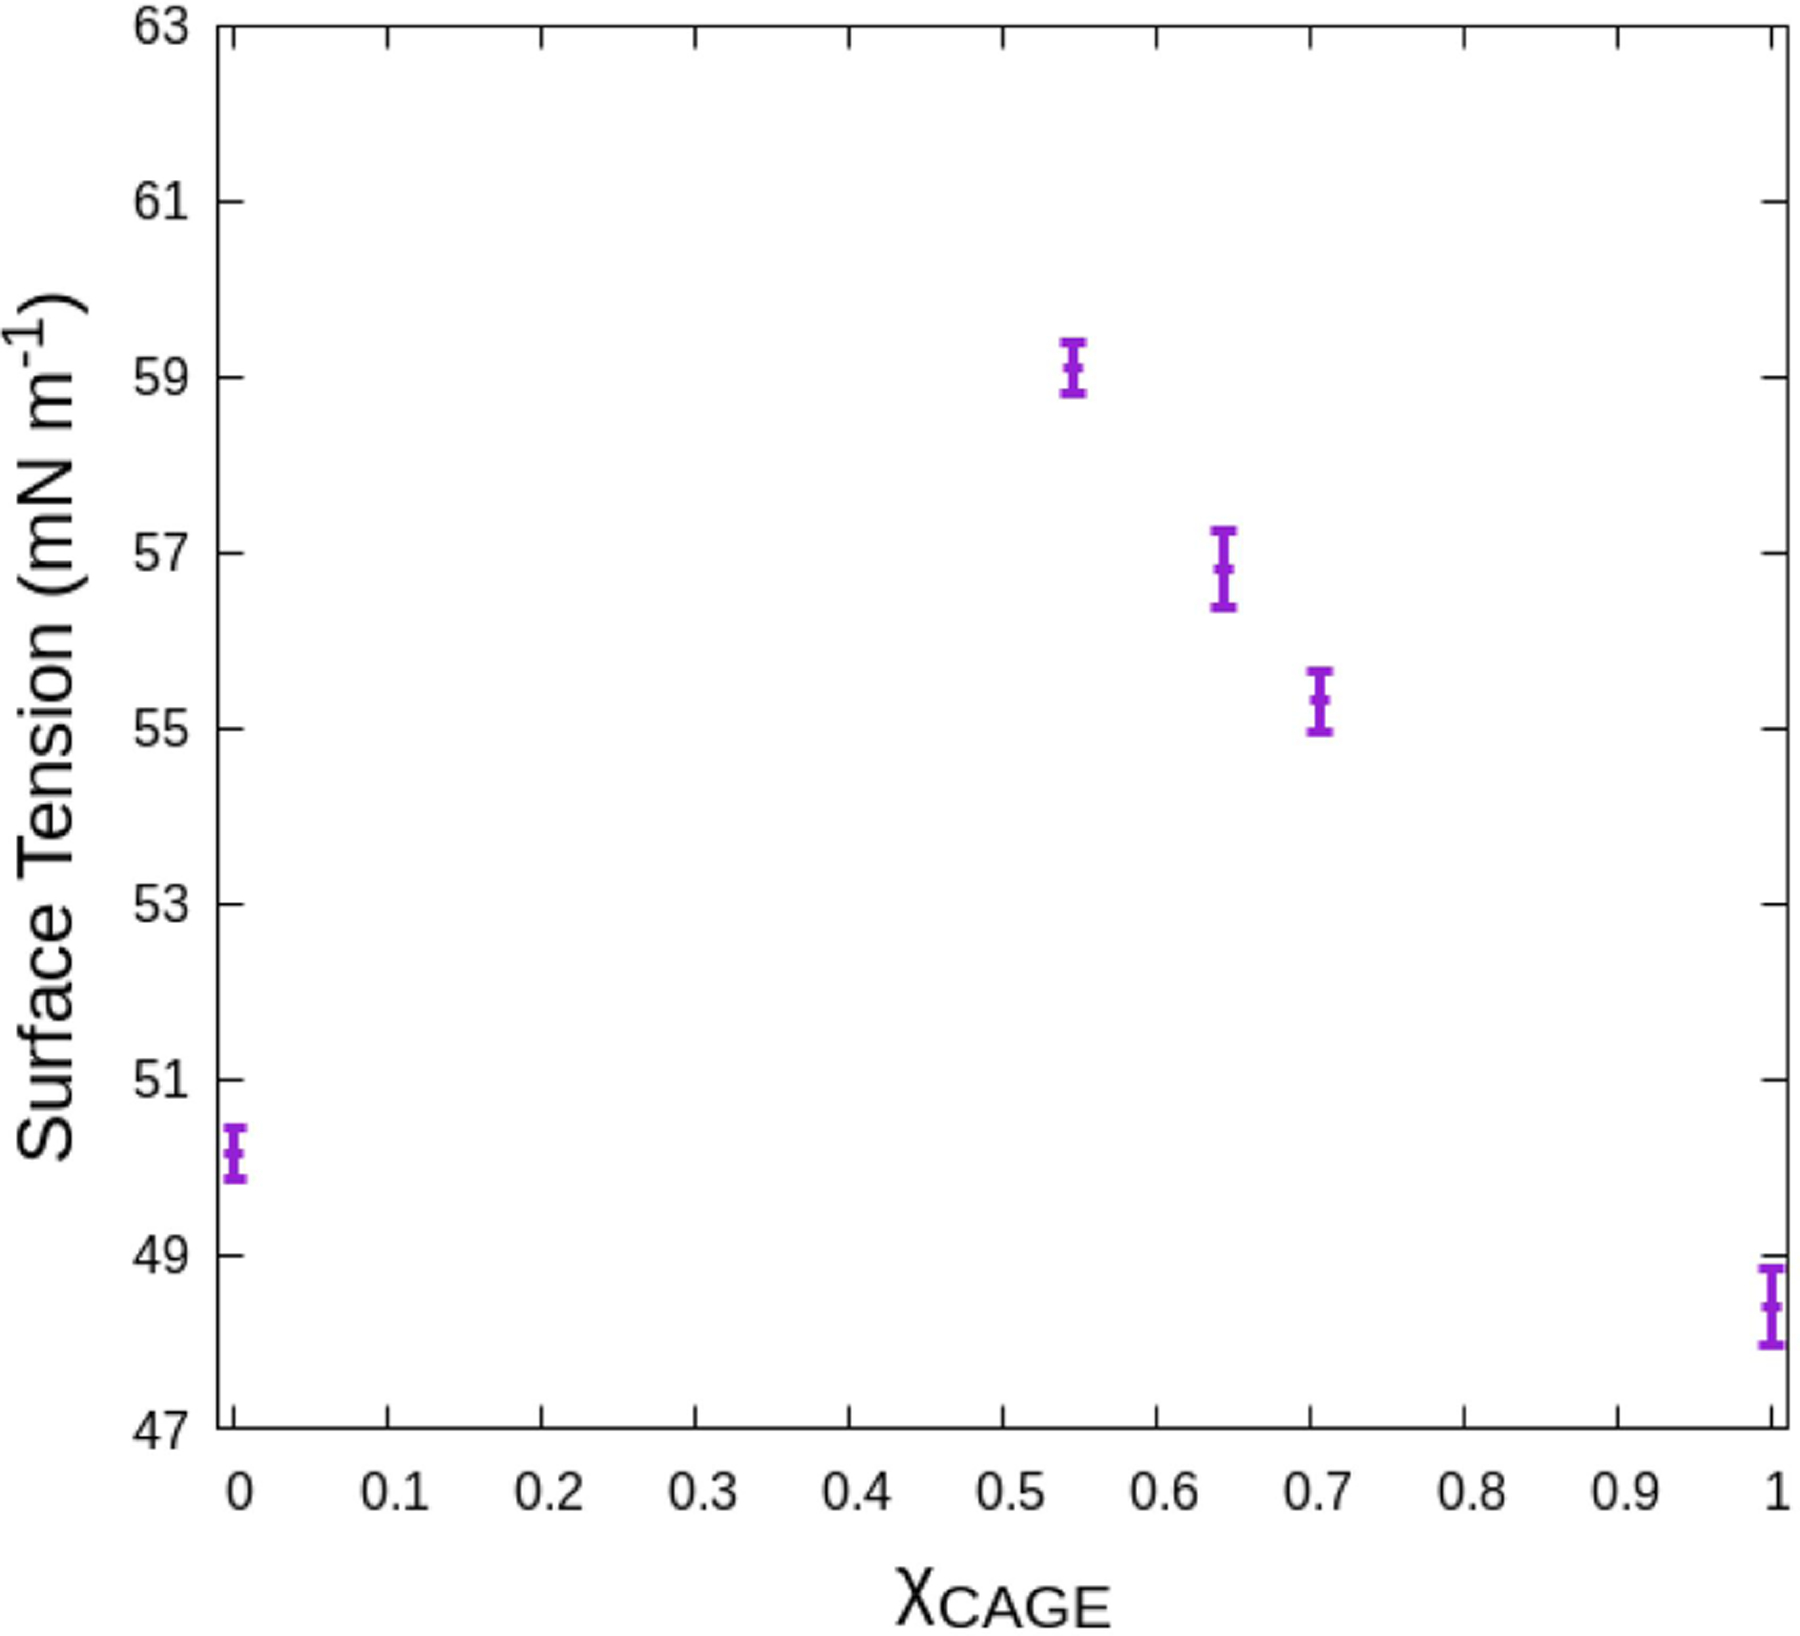
Surface tension of CAGE as a function of the mole fraction of CAGE. The dependence of surface tension on the mole fraction of CAGE indicates the presence of water leads to increased surface tension of CAGE solutions.
Surface tension is intricately related to surface properties of a liquid, indirectly revealing information about the distribution of species within the system and their interactions. In common monotonic cases, the surface tension is observed to increase or decrease.34 An increase in surface tension is often related to a solute dissolving into the bulk of a solution, away from the interface, while a decrease is related to increased solute concentration at the interface.35 This behavior has generally been understood with straightforward application of thermodynamic theory.36–38 However, some mixtures are observed to display more complex behavior.39–41 Non-monotonic behavior of the equilibrium surface tension with concentration, as is seen in Fig. 8, has been associated with heterogeneous assemblies, like in surfactant systems,40 and, indeed, CAGE has been observed to self-assemble and form micelles under the right conditions.8,9 Aqueous salts have long been known to exhibit a non-monotonic trend with concentration, called the Jones-Ray effect.42 Briefly described, in the 1930s, Jones and Ray reported that the surface tension of salt solutions demonstrated a minimum at small concentrations before a rise.39 Interestingly, this is somewhat independent of the solute itself. This observation has been controversial, going against prevailing thermodynamic models. It has been contested as merely the result of unavoidable trace amounts of highly surface active contaminants.43 More recent revaluation of the Jones-Ray effect continues to reaffirm the observation, but the explanation remains unclear.43–47 CAGE is a 1:1:1 mixture of a cation, anion, and neutral species (choline, geranate, and geranic acid, respectively). Each species behaves differently, with different affinities for the interface and different interactions with water. It seems likely that compounding effects arise from each species in solution. The components of CAGE effectively compete to increase and decrease the surface tension, giving rise to the observed behavior. Fully parsing the competing effects of each component on the surface tension of the solution is beyond the scope of this work, but opens an interesting future avenue of study for work with CAGE. Finally, admittedly, we have specifically focused on high concentration CAGE solutions, but consideration in a future study of more concentrations and the individual CAGE components could help further clarify this behavior.
In Fig. 9, we report the thermal expansion coefficient of pure CAGE to be 5.92 ± 0.6 × 10⁻⁴ K−1. For reference, the thermal expansion coefficient of TIP3P has been reported to be 9.04 × 10⁻⁴ K−1.48 The thermal expansion coefficient quantifies the effect of temperature on density. Our results indicate that the thermal expansion coefficient increases with increasing water content. This indicates that the addition of CAGE could provide modest protection for solutes stored in aqueous CAGE against possible deleterious effects that could result from temperature changes.6
Fig. 9:
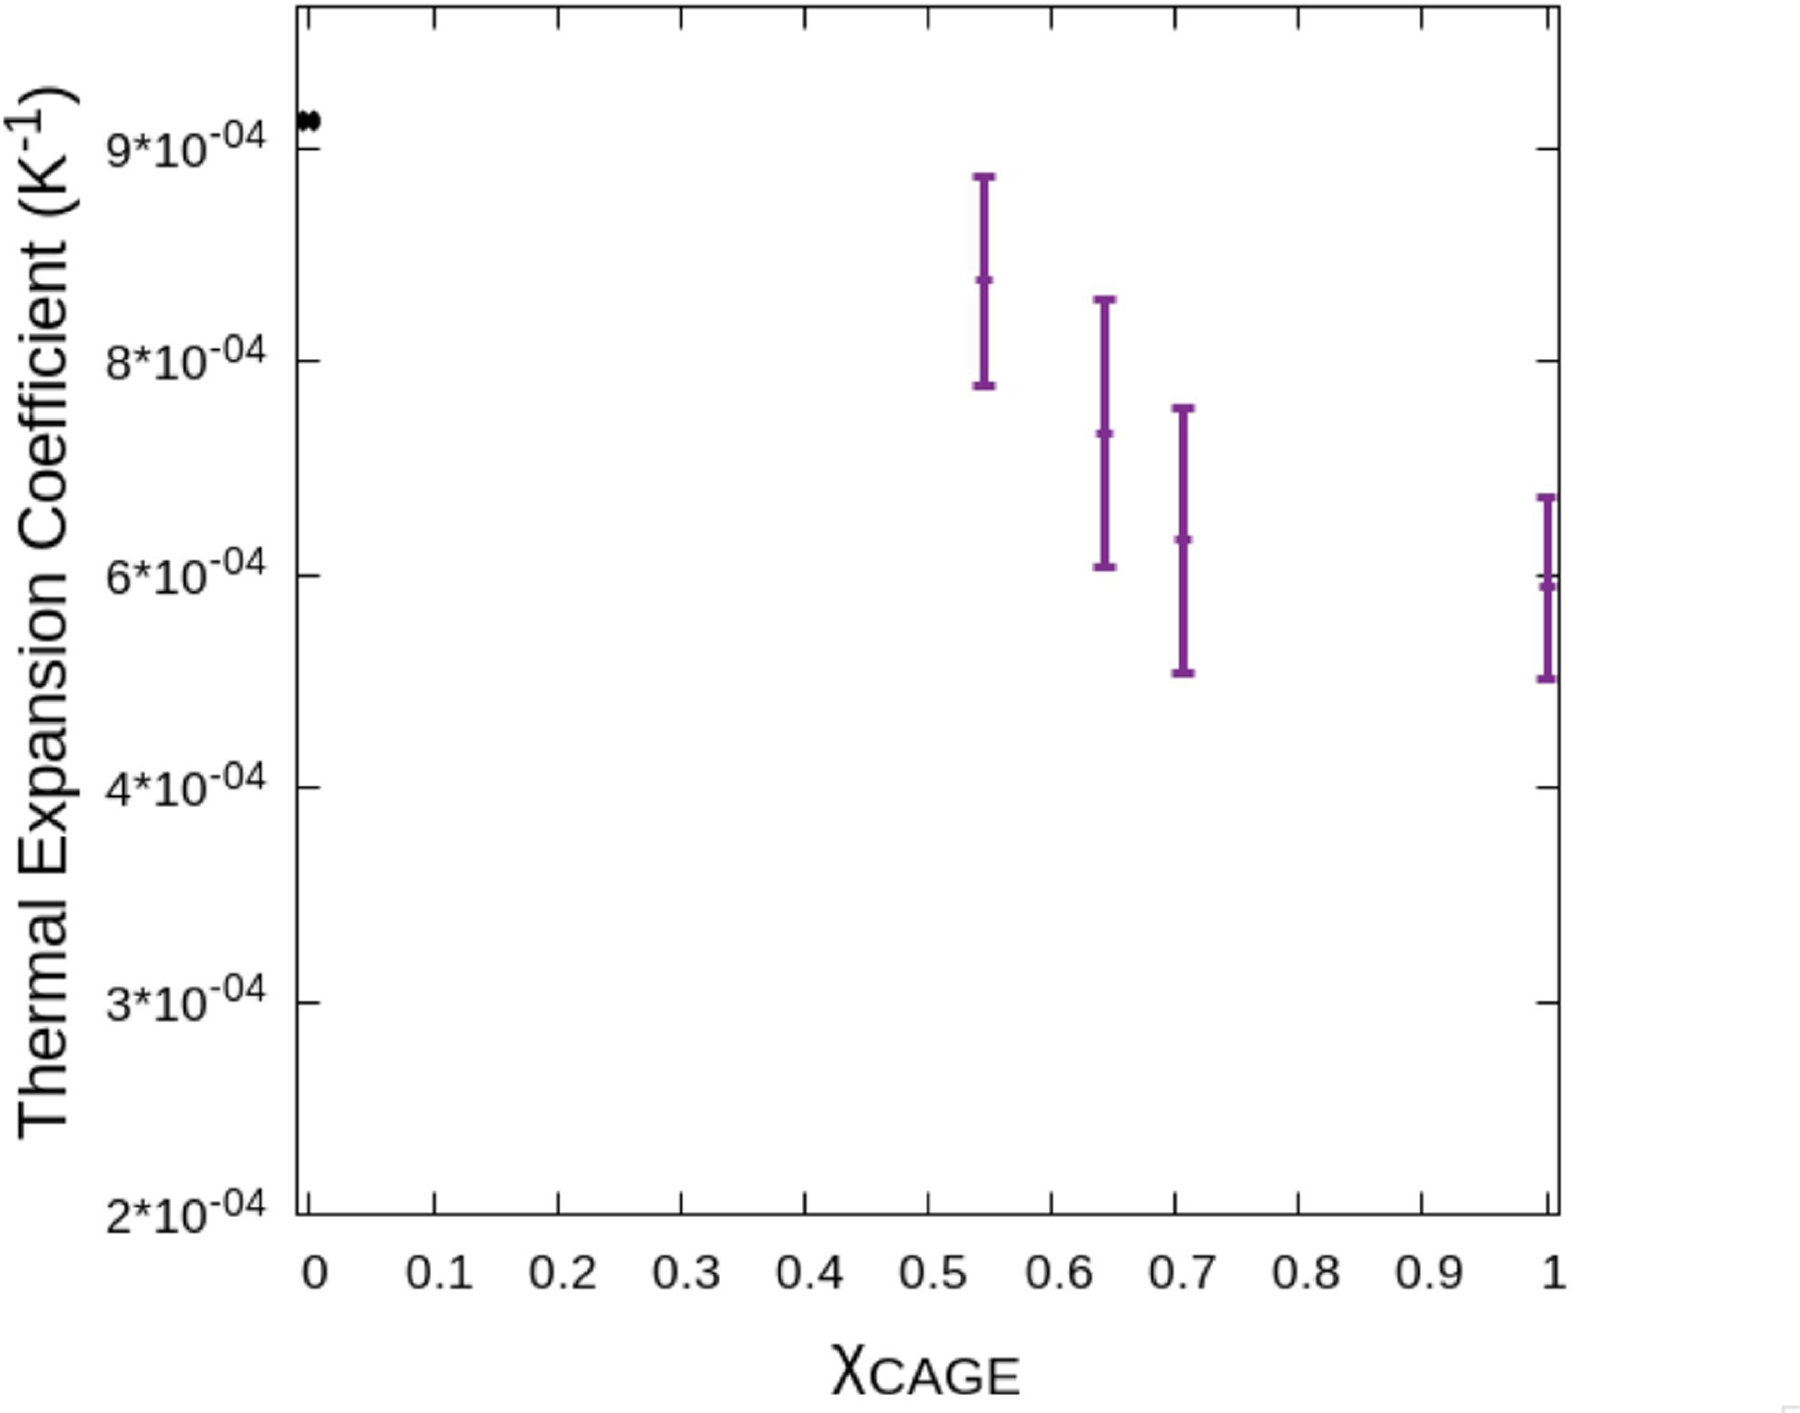
Thermal expansion coefficient vs. molar ratio of CAGE. As the molar ratio of CAGE increases in water the thermal expansion coefficient is observed to decrease.
4. Conclusions
We describe using molecular dynamics simulations to model aqueous CAGE at various concentrations at a liquid-vapor interface. In all solutions, we observe spatial heterogeneities that extend nanometers into the liquid region. These heterogeneities are characterized by distinct features in density profiles and orientation angles relative to the Gibbs dividing surface. The surface tension is observed to behave non-monotonically, indicative of a complex interplay of molecular interactions between the various species. Our simulations identify key features of aggregate formation, even if our simulations possibly span smaller length scales than would be observed in macroscopic experiments. The thermal expansion coefficient decreases with increasing CAGE concentration, which indicates CAGE solutions could be a useful additive to make more temperature resilient mixtures than water alone. This characterization provides an important reference point for understanding the solvent properties of aqueous CAGE solutions.
Finally, this work motivates further investigation of aqueous CAGE and other similar systems to understand their basic physical properties. Perhaps most simply, examination of similar systems on a larger scale could be an important next step to contextualize our observations. More interesting, perhaps, the density oscillation, aggregation, and structural observations could be examined with sum frequency generation, second harmonic generation, and other surface specific spectroscopies.49,50 Furthermore, electron holography could be used to examine molecular structure, electrostatic potential, and other properties at sub-ångström resolution with respect to the interface.51,52 Such experimental studies of aqueous CAGE and other similar ionic liquids and deep eutectic solvents in concert with the computational protocols presented here promises important insight into the physical underpinnings of the interfacial behavior of these materials and serves as a simple model for their solvent properties.
7. Acknowledgements
This research received funding from the Southwest Health Equity Research Collaborative at Northern Arizona University (U54MD012388), which is sponsored by the National Institute on Minority Health and Health Disparities (NIMHD). Most of the simulations and analysis reported here were performed on Northern Arizona University’s Monsoon computing cluster, funded by Arizona’s Technology and Research Initiative Fund. Some of the scripts used here were developed with support from NSF award OAC-1550562 to G.E.L. Some calculations were performed on The College of New Jersey’s ELSA high performance computing cluster. This cluster is funded by the National Science Foundation under grant numbers OAC-1828163 and OAC-1826915. J.L.B and C.L. also acknowledge funding under grant OAC-1550528.
Footnotes
Conflicts of interest
There are no conflicts of interest to declare.
8. References
- 1.Welton T, Ionic liquids: a brief history, Biophys. Rev, 2018, 10, 691–706. [DOI] [PMC free article] [PubMed] [Google Scholar]
- 2.Plechkova NV and Seddon KR, Applications of ionic liquids in the chemical industry, Chem. Soc. Rev, 2008, 37, 123–150. [DOI] [PubMed] [Google Scholar]
- 3.Santos MM and Branco LC, Ionic Liquids and Deep Eutectic Solvents for Application in Pharmaceutics, Pharmaceutics, 2020, 12, 909. [DOI] [PMC free article] [PubMed] [Google Scholar]
- 4.Zakrewsky M, Lovejoy KS, Kern TL, Miller TE, Le V, Nagy A, Goumas AM, Iyer RS, Del Sesto RE, Koppisch AT and Others, Ionic liquids as a class of materials for transdermal delivery and pathogen neutralization, Proceedings of the National Academy of Sciences, 2014, 111, 13313–13318. [DOI] [PMC free article] [PubMed] [Google Scholar]
- 5.Mota FAR, Pereira SAP, Araujo ARTS and Saraiva MLMFS, Evaluation of Ionic Liquids and Ionic Liquids Active Pharmaceutical Ingredients Inhibition in Elastase Enzyme Activity, Molecules, 2021, 26, 200. [DOI] [PMC free article] [PubMed] [Google Scholar]
- 6.Banerjee A, Ibsen K, Brown T, Chen R, Agatemor C and Mitragotri S, Ionic liquids for oral insulin delivery, Proc. Natl. Acad. Sci. U. S. A, 2018, 115, 7296–7301. [DOI] [PMC free article] [PubMed] [Google Scholar]
- 7.Greene JR, Merrett KL, Heyert AJ, Simmons LF, Migliori CM, Vogt KC, Castro RS, Phillips PD, Baker JL, Lindberg GE, Fox DT, Del Sesto RE and Koppisch AT, Scope and efficacy of the broad-spectrum topical antiseptic choline geranate, PLoS One, 2019, 14, e0222211. [DOI] [PMC free article] [PubMed] [Google Scholar]
- 8.Nurunnabi M, Ibsen KN, Tanner EEL and Mitragotri S, Oral ionic liquid for the treatment of diet-induced obesity, Proc. Natl. Acad. Sci. U. S. A, , DOI: 10.1073/pnas.1914426116. [DOI] [PMC free article] [PubMed] [Google Scholar]
- 9.Tanner EEL, Piston KM, Ma H, Ibsen KN, Nangia S and Mitragotri S, The Influence of Water on Choline-Based Ionic Liquids, ACS Biomater. Sci. Eng, , DOI: 10.1021/acsbiomaterials.9b00243. [DOI] [PubMed] [Google Scholar]
- 10.Di Lecce S, Lazarou G, Khalit SH, Adjiman CS, Jackson G, Galindo A and McQueen L, Modelling and prediction of the thermophysical properties of aqueous mixtures of choline geranate and geranic acid (CAGE) using SAFT-γ Mie, RSC Adv, 2019, 9, 38017–38031. [DOI] [PMC free article] [PubMed] [Google Scholar]
- 11.Takeda J, Iwao Y, Karashima M, Yamamoto K and Ikeda Y, Structural Evaluation of the Choline and Geranic Acid/Water Complex by SAXS and NMR Analyses, ACS Biomater Sci Eng, 2021, 7, 595–604. [DOI] [PubMed] [Google Scholar]
- 12.Tse Y-LS, Chen C, Lindberg GE, Kumar R and Voth GA, Propensity of Hydrated Excess Protons and Hydroxide Anions for the Air-Water Interface, J. Am. Chem. Soc, 2015, 137, 12610–12616. [DOI] [PubMed] [Google Scholar]
- 13.Gochenour K, Heyert AJ and Lindberg GE, in Physical Chemistry of Gas-Liquid Interfaces, eds. Faust JA and House JE, Elsevier, 2018, pp. 41–58. [Google Scholar]
- 14.Yan T, Li S, Jiang W, Gao X, Xiang B and Voth GA, Structure of the liquid-vacuum interface of room-temperature ionic liquids: a molecular dynamics study, J. Phys. Chem. B, 2006, 110, 1800–1806. [DOI] [PubMed] [Google Scholar]
- 15.Lindberg GE, Structure and diffusion of molten alkali carbonate salts at the liquid-vacuum interface, PeerJ Phy. Chem, 2019, 1, e3. [Google Scholar]
- 16.Martínez L, Andrade R, Birgin EG and Martínez JM, PACKMOL: a package for building initial configurations for molecular dynamics simulations, J. Comput. Chem, 2009, 30, 2157–2164. [DOI] [PubMed] [Google Scholar]
- 17.Case DA, Cheatham TE 3rd, Darden T, Gohlke H, Luo R, Merz KM Jr, Onufriev A, Simmerling C, Wang B and Woods RJ, The Amber biomolecular simulation programs, J. Comput. Chem, 2005, 26, 1668–1688. [DOI] [PMC free article] [PubMed] [Google Scholar]
- 18.Case DA, Belfon K, Ben-Shalom IY, Brozell SR, Cerutti DS, Cheatham IIITE, Cruzeiro VWD, Darden TA, Duke RE, Giambasu G, Gilson MK, Gohlke H, Goetz AW, Harris R, Izadi S, Izmailov SA, Kasavajhala K, Kovalenko A, Krasny R, Kurtzman T, Lee TS, LeGrand S, Li P, Lin C, Liu J, Luchko T, Luo R, Man V, Merz KM, Miao Y, Mikhailovskii O, Monard G, Nguyen H, Onufriev A, Pan F, Pantano S, Qi R, Roe DR, Roitberg A, Sagui C, Schott-Verdugo S, Shen J, Simmerling C, Skrynnikov NR, Smith J, Swails J, Walker RC, Wang J, Wilson L, Wolf RM, Wu X, Xiong Y, Xue Y, York DM and Kollman PA, Amber 2020, University of California, San Francisco, 2020. [Google Scholar]
- 19.Jorgensen WL, Chandrasekhar J, Madura JD, Impey RW and Klein ML, Comparison of simple potential functions for simulating liquid water, J. Chem. Phys, 1983, 79, 926–935. [Google Scholar]
- 20.Bayly CI, Cieplak P, Cornell W and Kollman PA, A well-behaved electrostatic potential based method using charge restraints for deriving atomic charges: the RESP model, J. Phys. Chem, 1993, 97, 10269–10280. [Google Scholar]
- 21.Frisch M, Trucks GW, Schlegel HB, Scuseria GE, Robb MA, Cheeseman JR, Scalmani G, Barone V, Mennucci B, Petersson G and Others, Gaussian 09, revision a. 02, gaussian, Inc., Wallingford, CT. [Google Scholar]
- 22.Sprenger KG, Jaeger VW and Pfaendtner J, The general AMBER force field (GAFF) can accurately predict thermodynamic and transport properties of many ionic liquids, J. Phys. Chem. B, 2015, 119, 5882–5895. [DOI] [PubMed] [Google Scholar]
- 23.Carter EE, Heyert AJ, De Souza M, Baker JL and Lindberg GE, The ionic liquid [C4mpy][Tf2N] induces bound-like structure in the intrinsically disordered protein FlgM, Phys. Chem. Chem. Phys, 2019, 21, 17950–17958. [DOI] [PubMed] [Google Scholar]
- 24.Gochenour K, Heyert AJ and Lindberg GE, in Physical Chemistry of Gas-Liquid Interfaces, eds. Faust JA and House JE, Elsevier, 2018, pp. 41–58. [Google Scholar]
- 25.Konieczny JK and Szefczyk B, The Journal of Physical Chemistry B, 2015, 119, 3795–3807. [DOI] [PubMed] [Google Scholar]
- 26.Ghoufi A and Malfreyt P, Importance of the tail corrections on surface tension of curved liquid-vapor interfaces, J. Chem. Phys, 2017, 146, 084703. [DOI] [PubMed] [Google Scholar]
- 27.Vega C and de Miguel E, Surface tension of the most popular models of water by using the test-area simulation method, J. Chem. Phys, 2007, 126, 154707. [DOI] [PubMed] [Google Scholar]
- 28.Zhang Y and Maginn EJ, A simple AIMD approach to derive atomic charges for condensed phase simulation of ionic liquids, J. Phys. Chem. B, 2012, 116, 10036–10048. [DOI] [PubMed] [Google Scholar]
- 29.Banerjee A, Ibsen K, Iwao Y, Zakrewsky M and Mitragotri S, Transdermal Protein Delivery Using Choline and Geranate (CAGE) Deep Eutectic Solvent, Adv. Healthc. Mater, , DOI: 10.1002/adhm.201601411. [DOI] [PubMed] [Google Scholar]
- 30.Jiang W, Wang Y, Yan T and Voth GA, A Multiscale Coarse-Graining Study of the Liquid/Vacuum Interface of Room-Temperature Ionic Liquids with Alkyl Substituents of Different Lengths, J. Phys. Chem. C, 2008, 112, 1132–1139. [Google Scholar]
- 31.Sarangi SS, Raju SG and Balasubramanian S, Molecular dynamics simulations of ionic liquid-vapour interfaces: effect of cation symmetry on structure at the interface, Phys. Chem. Chem. Phys, 2011, 13, 2714–2722. [DOI] [PubMed] [Google Scholar]
- 32.Kumar P and Chevrier VF, Solubility of Nitrogen in Methane, Ethane, and Mixtures of Methane and Ethane at Titan-Like Conditions: A Molecular Dynamics Study, ACS Earth Space Chem, 2020, 4, 241–248. [Google Scholar]
- 33.Chen Y, Chen W, Fu L, Yang Y, Wang Y, Hu X, Wang F and Mu T, Surface Tension of 50 Deep Eutectic Solvents: Effect of Hydrogen-Bonding Donors, Hydrogen-Bonding Acceptors, Other Solvents, and Temperature, Ind. Eng. Chem. Res, 2019, 58, 12741–12750. [Google Scholar]
- 34.Adamson AW, Physical chemistry of surfaces, John Wiley & Sons, Inc, 1990. [Google Scholar]
- 35.Docoslis A, Giese RF and van Oss CJ, Influence of the water–air interface on the apparent surface tension of aqueous solutions of hydrophilic solutes, Colloids Surf. B Biointerfaces, 2000, 19, 147–162. [Google Scholar]
- 36.Onsager L and Samaras NNT, The Surface Tension of Debye‐Hückel Electrolytes, J. Chem. Phys, 1934, 2, 528–536. [Google Scholar]
- 37.dos Santos AP, Diehl A and Levin Y, Surface tensions, surface potentials, and the Hofmeister series of electrolyte solutions, Langmuir, 2010, 26, 10778–10783. [DOI] [PubMed] [Google Scholar]
- 38.Martínez-Balbuena L, Arteaga-Jiménez A, Hernández-Zapata E and Márquez-Beltrán C, Applicability of the Gibbs Adsorption Isotherm to the analysis of experimental surface-tension data for ionic and nonionic surfactants, Adv. Colloid Interface Sci, 2017, 247, 178–184. [DOI] [PubMed] [Google Scholar]
- 39.Jones G and Ray WA, The Surface Tension of Solutions of Electrolytes as a Function of the Concentration. I. A Differential Method for Measuring Relative Surface Tension, J. Am. Chem. Soc, 1937, 59, 187–198. [Google Scholar]
- 40.Lin S-Y, Lin Y-Y, Chen E-M, Hsu C-T and Kwan C-C, A Study of the Equilibrium Surface Tension and the Critical Micelle Concentration of Mixed Surfactant Solutions, Langmuir, 1999, 15, 4370–4376. [Google Scholar]
- 41.March NH and Alonso JA, Non-monotonic behaviour with concentration of the surface tension of certain binary liquid alloys, Phys. Chem. Liq, 2008, 46, 522–526. [Google Scholar]
- 42.Langmuir I, REPULSIVE FORCES BETWEEN CHARGED SURFACES IN WATER, AND THE CAUSE OF THE JONES-RAY EFFECT, Science, 1938, 88, 430–432. [DOI] [PubMed] [Google Scholar]
- 43.Duignan TT, Peng M, Nguyen AV, Zhao XS, Baer MD and Mundy CJ, Detecting the undetectable: The role of trace surfactant in the Jones-Ray effect, J. Chem. Phys, 2018, 149, 194702. [DOI] [PubMed] [Google Scholar]
- 44.Petersen PB, Johnson JC, Knutsen KP and Saykally RJ, Direct experimental validation of the Jones–Ray effect, Chem. Phys. Lett, 2004, 397, 46–50. [Google Scholar]
- 45.Nguyen KT, Nguyen AV and Evans GM, Interactions between halide anions and interfacial water molecules in relation to the Jones-Ray effect, Phys. Chem. Chem. Phys, 2014, 16, 24661–24665. [DOI] [PubMed] [Google Scholar]
- 46.Uematsu Y, Bonthuis DJ and Netz RR, Charged Surface-Active Impurities at Nanomolar Concentration Induce Jones-Ray Effect, J. Phys. Chem. Lett, 2018, 9, 189–193. [DOI] [PubMed] [Google Scholar]
- 47.Okur HI, Drexler CI, Tyrode E, Cremer PS and Roke S, The Jones-Ray Effect Is Not Caused by Surface-Active Impurities, J. Phys. Chem. Lett, 2018, 9, 6739–6743. [DOI] [PMC free article] [PubMed] [Google Scholar]
- 48.Shvab I and Sadus RJ, Atomistic water models: Aqueous thermodynamic properties from ambient to supercritical conditions, Fluid Phase Equilib, 2016, 407, 7–30. [Google Scholar]
- 49.Franz J, van Zadel M-J and Weidner T, A trough for improved SFG spectroscopy of lipid monolayers, Rev. Sci. Instrum, 2017, 88, 053106. [DOI] [PubMed] [Google Scholar]
- 50.Mizuguchi T and Nuriya M, Applications of second harmonic generation (SHG)/sum-frequency generation (SFG) imaging for biophysical characterization of the plasma membrane, Biophys. Rev, , DOI: 10.1007/s12551-020-00768-4. [DOI] [PMC free article] [PubMed] [Google Scholar]
- 51.Bartell LS and Johnson RD, Molecular images by electron-wave holography, Nature, 1977, 268, 707–708. [Google Scholar]
- 52.Shirai M, Tanigaki T, Aizawa S, Park HS, Matsuda T and Shindo D, In situ electron holographic study of Ionic liquid, Ultramicroscopy, 2014, 146, 125–129. [DOI] [PubMed] [Google Scholar]


