

Abstract
Objectives
Growth differentiation factor (GDF)-15 is attracting interest as a biomarker in several areas of medicine. We aimed to evaluate the reference range for GDF-15 in a general population, and to explore demographics, classical cardiovascular disease risk factors, and other cardiac biomarkers associated with GDF-15.
Methods
GDF-15 was measured in serum from 19,462 individuals in the Generation Scotland Scottish Family Health Study. Associations of cardiometabolic risk factors with GDF-15 were tested using adjusted linear regression. Among 18,507 participants with no heart disease, heart failure, or stroke, and not pregnant, reference ranges (median and 97.5th centiles) were derived by decade age bands and sex.
Results
Among males in the reference range population, median (97.5th centile) GDF-15 concentration at age <30 years was 537 (1,135) pg/mL, rising to 931 (2,492) pg/mL at 50–59 years, and 2,152 (5,972) pg/mL at ≥80 years. In females, median GDF-15 at age <30 years was 628 (2,195) pg/mL, 881 (2,323) pg/mL at 50–59 years, and 1847 (6,830) pg/mL at ≥80 years. Among those known to be pregnant, median GDF-15 was 19,311 pg/mL. After adjustment, GDF-15 was higher in participants with adverse cardiovascular risk factors, including current smoking (+26.1%), those with previous heart disease (+12.7%), stroke (+17.1%), heart failure (+25.3%), and particularly diabetes (+60.2%). GDF-15 had positive associations with cardiac biomarkers cardiac troponin I, cardiac troponin T, and N-terminal pro B-type natriuretic peptide (NT-proBNP).
Conclusions
These data define reference ranges for GDF-15 for comparison in future studies, and identify potentially confounding risk factors and mediators to be considered in interpreting GDF-15 concentrations.
Keywords: biochemical markers, guidelines, reference ranges
Introduction
Growth differentiation factor (GDF)-15, also named macrophage inhibitory cytokine-1, placental transforming growth factor-beta, and placental bone morphogenetic protein is a member of the transforming growth factor (TGF)-β superfamily, and is expressed in low concentrations in many organs [1]. As a stress-induced cytokine, its expression is upregulated because of injury to many organs including in the heart [2, 3], lung [4], colon [5], kidney [6], liver [7], pancreas [8], and is expressed in adipose tissue [9]. As such elevated circulating levels of GDF-15 are associated with more advanced disease and poor prognosis in many acute and chronic conditions including heart disease, malignancies, and critical care settings [10], [11], [12], [13].
GDF-15 signals via the brainstem restricted GFRAL (GDNF-family receptor α-like) receptor and is thought to supress food uptake and induce cachexia in some conditions [14], as well as mediating at least some of the effects of drugs like metformin and colchicine [15, 16]. As a biomarker, higher circulating concentrations of GDF-15 are associated with elevated risk of a range of adverse outcomes in patients with cardiovascular disease, and with cardiovascular disease risk in the general population [17], [18], [19], [20]. A clinical assay suitable for in vitro diagnostic use is available for GDF-15, and although its measurement is not currently formally recommended in clinical guidelines for cardiovascular disease, it has recently been granted FDA approval as a companion diagnostic for exploratory cachexia treatment (using Ponsegromab, an anti GDF-15 monoclonal antibody) in some cancer patients [21].
There are currently sparse data from large general population studies exploring the age and sex-stratified reference ranges for GDF-15. Given an evolving role for the GDF-15 biomarker in many areas of clinical medicine including future trials, we sought to establish reference ranges for GDF-15 in a large general population cohort study, and to determine socio-demographics and risk factors associated with GDF-15 concentration.
Materials and methods
Generation Scotland Scottish Family Health Study (GS:SFHS)
The recruitment and design of the GS:SFHS has been reported in detail previously [22], [23], [24]. During 2006–2010 potential participants (aged 35–65 years) were identified at random from collaborating general medical practices in Scotland, and invited to participate. Participants were also asked to identify ≥one first-degree relative aged ≥18 years who would be able to participate. A total of 21,476 participants aged between 18 and 98 years attended a research clinic in different urban areas of Scotland. At the clinic, participants had physical and clinical characteristics (including systolic blood pressure (SBP) and body mass index (BMI)) measured according to a standardised protocol and had a questionnaire administered (https://www.ed.ac.uk/generation-scotland/for-researchers/generation-scotland). Scottish Index of Multiple Deprivation (SIMD) scores are national composite measures of socioeconomic deprivation and were derived from participant postcodes, with higher scores indicating greater socioeconomic deprivation [25]. Past medical history, including a diagnosis of diabetes mellitus (type 1 or type 2) and prior heart disease, stroke, and cancer was recorded using a self-reported questionnaire. Classification of heart failure status at recruitment was ascertained by linked data from the Scottish Morbidity Record (SMR01) to identify patients who had been hospitalised for heart failure at any time before their baseline assessment (using International Classification of Disease (ICD)-10 codes I50, I42.0, I42.6, I42.7, I42.9, I11.0). Pregnancy at baseline was identified through linkage to the Scottish Maternity Record (SMR02).
Fasting blood samples were taken, according to a standard operating procedure, and serum samples were separated. Biochemistry measures including total cholesterol, high-density lipoprotein (HDL) cholesterol, and creatinine was measured at the time of collection and additional serum aliquots were stored at −80 °C for future biochemical analyses. Estimated glomerular filtration rate (eGFR) was calculated according to the CKD-EPI equation [26].
Measurement of biomarkers
GDF-15 measurements were undertaken during a single (second) thaw of stored serum aliquots. GDF-15 was measured on a cobas e411 analyser (Roche Diagnostics, Basel, Switzerland) using the manufacturer’s reagents and quality control material. Coefficient of variation for GDF-15 was 3.8% for the low control (at 1,556 pg/mL) and 3.4% for the high control (at 7,804 pg/mL). The limit of detection (LoD) of the GDF-15 assay is set to 400 pg/mL by the manufacturer, and the upper limit of the measuring range was 20,000 pg/mL. Samples below the limit of detection were reported as 200 pg/mL for continuous analysis and samples above the measuring range as 25,000 pg/mL for continuous analysis.
Statistical analysis
Participants with missing data for GDF-15, NT-proBNP, or either cardiac troponin I (cTnI) or cardiac troponin T (cTnT), were excluded from all analyses. By clustered family group, the intra-class correlation coefficient for GDF-15 was 0.06 (95% CI 0.05, 0.08), indicating minimal family clustering; this was therefore not considered a factor in further analyses.
This study was of cross-sectional design. Sex-stratified GDF-15 reference ranges comprising medians, 95th, 97.5th and 99th centiles along with associated bias-corrected 90% confidence intervals (or percentile 90% confidence intervals when no estimate was generated for bias-corrected confidence intervals due to small sample size) were determined by bootstrapping 5,000 samples in each age and sex-specific strata. Reference ranges were specifically modelled in participants with no heart disease, heart failure, or stroke, and who were not known to be pregnant (model 1). In a sensitivity analysis, reference ranges were derived after additional exclusions for participants with diabetes, cancer, eGFR<60 mL/min/1.73 m2, NT-proBNP≥400 pg/mL (a rule in threshold for heart failure), or cTnI ≥26.2 pg/mL, or cTnT ≥14 pg/mL (thresholds for rule in of myocardial infarction) (model 2). Quantile regression using fractional polynomials was used to further model the relationship between age and the median and 97.5th centile of GDF-15 using model 1.
Associations of GDF-15 (by tertiles of the distribution) with socio-demographics and classical cardiovascular disease risk factors were investigated in the whole cohort. Risk factors were expressed as frequencies and percentages for categorical variables, and for continuous variables were expressed as medians (interquartile interval) when skewed, or as mean (standard deviation) when normally distributed. The association of GDF-15 with other cardiac biomarkers was illustrated using simple Pearson correlation on z-scores from log-transformed biomarker concentrations. Associations of classical cardiometabolic risk factors with log-transformed GDF-15 were modelled using linear regression with robust standard errors. For these linear regression models, missing data for classical risk factors (1,134 missing observations for SIMD score was most frequently missing, no missing observations for age or sex) were imputed by multiple chained imputations over 10 datasets. Effect estimates were exponentiated to give the percentage effect on the geometric mean biomarker level. The first model adjusted for age, sex, heart disease, heart failure, stroke, diabetes, cancer, and pregnancy. The second model allowed for an interaction of each cardiometabolic risk factor of interest with sex, and included an age-sex interaction in every model. The third model allowed for a categorical age-interaction (ages grouped as ≤50 years, 50–59 years, 60–69 years and ≥70 plus years to avoid unstable estimates in categories with small numbers) and allowed for an age-sex interaction in every model. A final model tested specifically for a BMI-smoking interaction on the basis that these risk factors have a complex relationship. All statistics were performed using STATA version 17.0.
Ethical approval
The research related to human use has been complied with all the relevant national regulations, institutional policies and in accordance with the tenets of the Helsinki Declaration, and ethical approval was obtained from the National Health Service Tayside Committee on Medical Research Ethics (REC Reference Number: 05/S1401/89).
Results
Population characteristics
Of the 21,476 GS:SFHS participants 19,462 (90.6%) provided a serum sample with sufficient volume for measurement of GDF-15, cTnI, cTnT and NT-proBNP. Mean age was 47.1 years (standard deviation [sd] 15.0 years), and 8,108 participants (41.7%) were male. In the whole cohort, median GDF-15 was 822 pg/mL (inter-quartile interval [IQI] 616, 1,141 pg/mL) and GDF-15 was below the limit of detection in 672 participants (3.5%). Among 876 participants with previous heart disease or stroke, median GDF-15 was 1,306 pg/mL (IQI 958, 1,987 pg/mL). Among 91 participants with baseline heart failure, median GDF-15 was 1,776 pg/mL (IQI 1,122, 2,920 pg/mL). Among 58 participants known to be pregnant, median GDF-15 was 19,311 pg/mL (IQI 1,033, 25,000 pg/mL).
Reference ranges for GDF-15
Among 18,507 participants with no heart disease, stroke, previous heart failure hospitalisation, and not known to be pregnant (model 1), the median overall GDF-15 was 808 pg/mL (IQI 608, 1,103 pg/mL), median GDF-15 in females was 816 (IQI 623–1,103 pg/mL), and median GDF-15 in males was 793 (IQI 588–1,108 pg/mL) (Figure 1). In males, median (97.5th centile) GDF-15 concentration at age <30 years was 537 (1,135) pg/mL, rising to 931 (2,492) pg/mL at 50–59 years, and 2,152 (5,972) pg/mL at ≥80 years (Table 1). In females, median GDF-15 at age <30 years was 628 (2,195) pg/mL, 881 (2,323) pg/mL at 50–59 years, and 1,847 (6,830) pg/mL at ≥80 years (Model 1, Table 1). In females in the <30 years and 30–39 year age group there were some outliers that drove up the 99th centile (12,745 pg/mL) much higher than the 99th centile in males (1,820 pg/mL) (Model 1, Table 1). Further exclusions of participants with diabetes, cancer, or elevated cardiac biomarkers (including elevated GDF-15) reduced medians and 97.5th centiles of GDF-15 without ameliorating the overall trend of older age being associated with higher GDF-15 (Model 2, Table 1).
Figure 1:
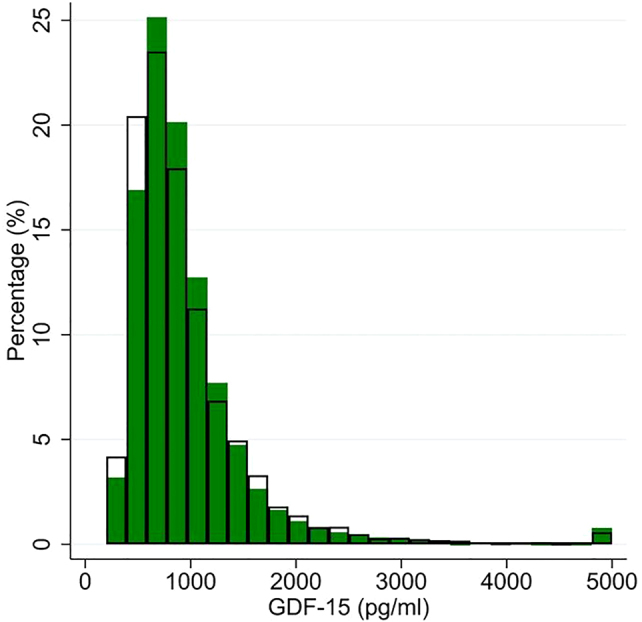
Histogram of GDF-15 distribution, separately in males (clear bars) and females (green bars), in 18,507 participants without heart disease, heart failure, or stroke, and not known to be pregnant.
Table 1:
GS:SFHS reference ranges for GDF-15 by age categories and sex.
| GDF-15, pg/mL | ||||||||||
|---|---|---|---|---|---|---|---|---|---|---|
| Model 1 | Model 2 | |||||||||
| n | 50th centile | 95th centile | 97.5th centile | 99th centile | n | 50th centile | 95th centile | 97.5th centile | 99th centile | |
| Male | ||||||||||
| <30 years | 1,412 | 537 (528, 547) | 968 (926, 1,030) | 1,135 (1,058, 1,195) | 1,820 (1,410, 3,334) | 1,349 | 534 (526, 544) | 942 (895, 992) | 1,094 (1,052, 1,172) | 1,492 (1,248, 1,866) |
| 30–39 years | 1,220 | 644 (628, 655) | 1,193 (1,111, 1,285) | 1,442 (1,352, 1,543) | 1,995 (1,714, 2,458) | 1,174 | 641 (626, 652) | 1,163 (1,096, 1,245) | 1,400 (1,308, 1,483) | 1,820 (1,555, 2,437) |
| 40–49 years | 1,498 | 747 (731, 764) | 1,528 (1,441, 1,614) | 1,892 (1,734, 2,042) | 2,578 (2,193, 2,964) | 1,378 | 739 (723, 755) | 1,448 (1,379, 1,535) | 1,740 (1,613, 1,920) | 2,346 (2,051, 2,907) |
| 50–59 years | 1,958 | 931 (915, 948) | 2,023 (1,951, 2,132) | 2,492 (2,367, 2,639) | 3,655 (3,262, 4,256) | 1,613 | 911 (894, 927) | 1,862 (1,790, 1,946) | 2,194 (2,065, 2,339) | 2,773 (2,475, 3,249) |
| 60–69 years | 1,240 | 1,171 (1,152, 1,200) | 2,867 (2,670, 3,124) | 3,837 (3,453, 4,585) | 5,872 (4,722, 7,224) | 842 | 1,107 (1,087, 1,137) | 2,229 (2,118, 2,485) | 2,704 (2,514, 2,834) | 3,486 (2,860, 4,226) |
| 70–79 years | 216 | 1,549 (1,482, 1,635) | 3,441 (2,997, 4,132) | 4,602 (3,506, 6,470) | 7,633 (4,156, 10,353) | 81 | 1,363 (1,299, 1,450) | 2,651 (2,297, 3,060) | 3,065 (2,614, 3,726) | 3,428 (2,766, 3,726) |
| ≥80 years | 48 | 2,152 (1,946, 2,456) | 5,624 (4,649, 6,123) | 5,972 (5,546, 6,123) | – | 8 | 1,944 (1,641, 2,174) | – | – | – |
|
| ||||||||||
| Female | ||||||||||
|
| ||||||||||
| <30 years | 1,673 | 628 (616, 641) | 1,474 (1,397, 1,571) | 2,195 (1,812, 2,643) | 12,745 (4,471, 25,000) | 1,625 | 625 (614, 637) | 1,401 (1,347, 1,462) | 1,738 (1,580, 1,911) | 2,679 (2,193, 3,258) |
| 30–39 years | 1,753 | 656 (646, 666) | 1,412 (1,332, 1,493) | 1,950 (1,710, 2,332) | 10,561 (3,692, 19,876) | 1,661 | 649 (640, 660) | 1,306 (1,264, 1,344) | 1,541 (1,457, 1,682) | 2,009 (1,830, 2,361) |
| 40–49 years | 2,436 | 755 (743, 766) | 1,505 (1,447, 1,543) | 1,804 (1,666, 1,996) | 2,608 (2,323, 3,031) | 2,229 | 748 (738, 760) | 1,419 (1,379, 1,461) | 1,595 (1,543, 1,669) | 2,057 (1,792, 2,252) |
| 50–59 years | 2,821 | 881 (869, 892) | 1,835 (1,749, 1,916) | 2,323 (2,195, 2,508) | 3,387 (2,979, 3,951) | 2,417 | 861 (850, 874) | 1,621 (1,564, 1,680) | 1,920 (1,850, 2,018) | 2,525 (2,205, 2,910) |
| 60–69 years | 1,738 | 1,063 (1,046, 1,086) | 2,307 (2,185, 2,441) | 2,832 (2,607, 3,210) | 4,517 (3,571, 5,668) | 1,342 | 1,027 (1,004, 1,048) | 1,981 (1,884, 2,096) | 2,326 (2,193, 2,456) | 2,745 (2,482, 3,396) |
| 70–79 years | 385 | 1,445 (1,392, 1,505) | 3,097 (2,848, 3,641) | 3,805 (3,316, 4,418) | 5,368 (4,225, 9,173) | 201 | 1,349 (1,290, 1,415) | 2,540 (2,259, 2,997) | 3,066 (2,561, 3,744) | 3,738 (3,209, 4,225) |
| ≥80 years | 109 | 1,847 (1,653, 2,112) | 4,396 (3,695, 6,119) | 6,830 (4,537, 16,357) | 12,340 (7,327, 16,357) | 28 | 1,407 (1,235, 1,545) | 2,986 (2,658, 3,111) | – | – |
Model 1: Estimates from 18,507 participants with no heart disease, heart failure, or stroke, and not known to be pregnant. Model 2: Estimates from 15,948 participants with no heart disease, heart failure, or stroke, not known to be pregnant, with no diabetes, or previous cancer, eGFR≥60 mL/min/1.73 m2, NT-proBNP <400 pg/mL, cTnI<26.2 pg/mL, cTnT<14 pg/mL, and GDF15<10,000 pg/mL. Estimates are for 50th, 95th, 97.5th and 99th centiles (90% confidence intervals for each estimate). “–“ indicates estimates omitted due to low n. GS:SFHS, Generation Scotland Scottish Family Health Study; GDF, growth differentiation factor; eGFR, estimated glomerular filtration rate.
Continuous models of the median and 97.5th centile of GDF-15 (using model 1) showed similar trends, with similar median levels in the sexes, and a slow rise in observed GDF-15 levels up to age 50 years, and then a more rapid rise in both sexes beyond the age of 50 (Figure 2). There were generally more high outlying results among younger females and older males, as reflected in the higher 97.5th centile estimates (Figure 2).
Figure 2:

Association between age and the 50th centile (males light blue, females orange) and the 97.5th centile (males dark blue, females red) of GDF-15 in a continuous model.
Coloured areas are 95% CI. Modelled in 18,507 participants without heart disease, heart failure, or stroke, and not known to be pregnant.
Associations of GDF-15 with cardiovascular risk factors
In the whole cohort of n=19,462 participants, the participants in the upper third of the distribution for GDF-15 were older, had higher BMI, were more likely a current smoker, lower eGFR, had a higher SIMD score indicating greater socioeconomic deprivation, and were more likely to have heart disease or stroke, heart failure, diabetes, or to be pregnant (Table 2). Participants in the upper third of the distribution for GDF-15 were also more likely to use blood pressure or cholesterol medications, and still had generally higher total cholesterol (Table 2) and systolic blood pressure. There was also a strong positive association between GDF-15 with cTnI, cTnT, and NT-proBNP (Table 2). The correlation between GDF-15 and cTnI, cTnT, and NT-proBNP was r=0.24, 0.23, and r=0.31, respectively.
Table 2:
Population characteristics in 19,462 GS:SFHS participants, stratified by tertiles of GDF-15.
| Overall | Tertile 1 (≤679.5 pg/mL) | Tertile 2 (679.6–1,008 pg/mL) | Tertile 3 (≥1,009 pg/mL) | |
|---|---|---|---|---|
| n=19,462 | n=6,488 | n=6,487 | n=6,487 | |
| Age, years | 47.06 (14.96) | 37.07 (12.32) | 47.78 (12.38) | 56.34 (13.43) |
| Male sex | 8,108 (41.7%) | 2,838 (43.7%) | 2,531 (39.0%) | 2,739 (42.2%) |
| Body mass index, kg/m2 (n missing=179) | 26.66 (5.16) | 25.68 (4.81) | 26.64 (4.87) | 27.65 (5.59) |
| Systolic blood pressure, mmHg (n missing=77) | 131.34 (17.79) | 126.12 (15.17) | 131.13 (17.09) | 136.78 (19.25) |
| Total cholesterol, mmol/L (n missing=104) | 5.10 (1.08) | 4.85 (1.01) | 5.26 (1.05) | 5.19 (1.13) |
| HDL-cholesterol, mmol/L (n missing=142) | 1.46 (0.41) | 1.46 (0.38) | 1.48 (0.41) | 1.44 (0.43) |
| SIMD score, units divided by 10 (n missing=1,133) | 1.70 (1.45) | 1.64 (1.37) | 1.61 (1.41) | 1.85 (1.57) |
| eGFR, mL/min/1.73 m2mL/min/1.73 m2 (n missing=68) | 95.11 (17.38) | 103.86 (15.19) | 94.62 (14.71) | 86.84 (17.71) |
| Current smoker (n missing=625) | 3,054 (16.2%) | 809 (12.9%) | 883 (14.0%) | 1,362 (21.8%) |
| Heart disease | 693 (3.6%) | 54 (0.8%) | 141 (2.2%) | 498 (7.7%) |
| Stroke | 250 (1.3%) | 22 (0.3%) | 47 (0.7%) | 181 (2.8%) |
| Heart failure | 91 (0.5%) | 6 (0.1%) | 6 (0.1%) | 79 (1.2%) |
| Diabetes | 562 (2.9%) | 41 (0.6%) | 86 (1.3%) | 435 (6.7%) |
| Known pregnancy | 58 (0.3%) | 9 (0.1%) | 5 (0.1%) | 44 (0.7%) |
| Previous cancer | 1,521 (7.8%) | 206 (3.2%) | 454 (7.0%) | 861 (13.3%) |
| Use of cholesterol lowering medications | 1,282 (6.6%) | 106 (1.6%) | 275 (4.2%) | 901 (13.9%) |
| Use of blood pressure lowering medications | 1,574 (8.1%) | 136 (2.1%) | 380 (5.9%) | 1,058 (16.3%) |
| cTnI, pg/mL | 1.90 (0.60, 3.10) | 1.50 (0.60, 2.30) | 1.90 (1.20, 2.90) | 2.50 (1.50, 4.00) |
| cTnT, pg/mL | 3.30 (1.50, 6.03) | 1.50 (1.50, 4.78) | 3.01 (1.50, 5.38) | 4.57 (1.50, 8.14) |
| NT-proBNP, pg/mL | 52 (27, 96) | 39 (20, 68) | 50 (27, 90) | 73 (39, 138) |
Values are n (%), mean (sd), or median (IQI). Data represent data from n=19,462 except where number missing (n miss) is indicated in the row. GS:SFHS, Generation Scotland Scottish Family Health Study; GDF, growth differentiation factor; HDL, high-density lipoprotein; SIMD, Scottish Index of Multiple Deprivation; eGFR, estimated glomerular filtration rate; cTnI, cardiac troponin I; cTnT, cardiac troponin T; NT-proBNP, N-terminal pro B-type natriuretic peptide.
In an adjusted model, age was positively associated with GDF-15 in both sexes (compared to 40–49 year olds, GDF-15 levels approximately doubled in 70–79 year olds), although the association of age with GDF-15 was stronger in males (Table 3). There were strong positive associations with heart disease, stroke, heart failure, cancer, and particularly a strong positive association with diabetes (+60.5%) that was consistent in both sexes (Table 3). Generally these associations with existing disease were strongest in participants aged 50–59 years. GDF-15 was associated with other adverse cardiovascular risk factors, being higher in current smokers and in people with more socioeconomically deprived scores and was inversely associated with eGFR. The association of GDF-15 with eGFR was generally stronger in older age groups (Table 3). BMI was positively associated with GDF-15 in both sexes, although the association was slightly stronger in males (p for sex-interaction 0.003) and weaker in participants age ≥70 years. Total cholesterol was weakly positively associated with GDF-15 in females (p for sex-interaction 0.001), and in younger age groups. GDF-15 was positively associated with cardiac biomarkers in both sexes, particularly NT-proBNP, although the association with troponin I was slightly stronger in females (p<0.001). The association of GDF-15 with cardiac biomarkers was stronger in participants age ≥70 years.
Table 3:
Adjusted association of cardiovascular risk factors with GDF-15 (n=19,462).
| Overall | Sex interaction | Age interaction | |||||||
|---|---|---|---|---|---|---|---|---|---|
| Adjusted association | Adjusted association in feamles | Adjusted association in males | p for sex interaction | Adjusted association in age <50 | Adjusted association in age 50–59 | Adjusted association in age 60–69 | Adjusted association in age ≥70 | p for age interaction | |
| Age category | <0.001 | ||||||||
| 18–29 years | −23.4% (−25.3, −21.5) | −15.6% (−18.5, −12.5) | −32.0% (−34.2, −29.7) | – | – | – | – | – | |
| 30–39 years | −14.1% (−16.1, −12.1) | −11.3% (−14.2, −8.4) | −18.0% (−20.7, −15.3) | – | – | – | – | – | |
| 40–49 years | Ref | Ref | Ref | – | – | – | – | – | |
| 50–59 years | 21.2% (19.0, 23.3) | 18.0% (15.4, 20.6) | 25.9% (22.4, 29.4) | – | – | – | – | – | |
| 60–69 years | 47.6% (44.7, 50.6) | 41.9% (38.3, 45.6) | 55.9% (51.1, 60.9) | – | – | – | – | – | |
| 70–79 years | 89.8 (83.3, 96.5) | 82.6% (74.9, 90.7) | 103.6% (92.5, 115.3) | – | – | – | – | – | |
| 80+ years | 158.9% (141.1, 178.0) | 145.7% (124.1, 169.2) | 188.8% (159.8, 221.1) | – | – | – | – | – | |
| Male sex | −1.5% (−2.9, −0.2) | – | −20.0% (−23.1, −16.7) | −26.6% (−30.2, −22.8) | −13.1% (−16.8, −9.2) | −10.5% (−12.3, −8.7) | −9.1% (−15.4, −2.4) | <0.001 | |
| BMI, kg/m2 | 0.6% (0.4, 0.7) | 0.4% (0.3, 0.6) | 0.9% (0.6, 1.1) | 0.008 | 0.8% (0.6, 1.0) | 0.7% (0.5, 1.0) | 1.3% (1.0, 1.6) | −0.4% (−1.1, 0.3) | <0.001 |
| SBP, per 5 mmHg | 0.1% (−0.1, 0.3) | 0.4% (0.1, 0.7) | 0.2% (−0.1, 0.5) | 0.439 | 1.4% (1.0, 1.8) | 0.2% (−0.1, 0.6) | 0.2% (−0.2, 0.6) | −0.2% (−0.9, 0.6) | <0.001 |
| Total cholesterol, mmol/L | 0.4% (−0.4, 1.2) | 2.0% (0.9, 3.1) | −0.7% (−1.8, 0.4) | 0.001 | 9.4% (8.1, 10.6) | −2.4% (−3.6, −1.2) | −3.7% (−5.1, −2.2) | −3.0% (−5.6, −0.4) | <0.001 |
| HDL cholesterol, 0.1 mmol/L | −1.1% (−1.3, −0.9) | −0.9% (−1.2, −0.7) | −1.2% (−1.5, −0.9) | 0.208 | −0.5% (−0.8, −0.2) | −1.4% (−1.8, −1.1) | −1.3% (−1.7, −0.9) | −1.6% (−2.3, −1.0) | <0.001 |
| SIMD score, per 10 units | 3.7% (3.2, 4.2) | 3.6% (2.9, 4.3) | 4.0% (3.2, 4.8) | 0.443 | 2.9% (2.1, 3.7) | 5.0% (4.0, 6.1) | 4.4% (3.2, 5.6) | 3.9% (1.8, 6.0) | 0.011 |
| eGFR, per 5 mL/min/1.72m2 | −2.1% (−2.4, −1.8) | −1.9% (−2.3, −1.5) | −2.2% (−2.7, −1.8) | 0.284 | −2.4% (−2.8, −2.0) | −2.4% (−3.0, −1.7) | −3.9% (−4.6, −3.3) | −6.6% (−7.5, −5.8) | <0.001 |
| Current smoker | 26.1% (23.7, 28.6) | 25.4% (22.1, 28.7) | 26.8% (23.3, 30.4) | 0.566 | 22.1% (18.9, 25.4) | 36.2% (31.5, 41.1) | 26.9% (20.4, 33.8) | 19.7% (6.6, 34.3) | <0.001 |
| Heart disease | 12.7% (8.5, 17.1) | 9.4% (3.3, 15.8) | 11.8% (6.3, 17.7) | 0.571 | 5.3% (−8.4, 21.0) | 19.3% (11.8, 27.2) | 6.9% (0.5, 13.7) | 14.9% (5.9, 24.8) | 0.074 |
| Stroke | 17.1% (9.6, 25.0) | 15.2% (6.3, 24.8) | 18.1% (6.5, 30.9) | 0.711 | 10.4% (−7.3, 31.4) | 39.8% (21.7, 60.5) | 8.0% (−3.7, 21.3) | 17.7% (5.4, 31.4) | 0.035 |
| Heart failure | 25.3% (9.3, 43.8) | 41.6% (11.4, 80.1) | 14.3% (−2.4, 33.9) | 0.140 | 30.6% (−39.9, 183.8) | 28.6% (−4.7, 73.4) | 5.1% (−11.3, 24.6) | 53.4% (24.3, 89.3) | 0.052 |
| Diabetes | 60.2% (52.0, 68.8) | 65.3% (52.7, 78.9) | 53.1% (42.7, 64.1) | 0.153 | 56.8% (39.8, 75.9) | 76.9% (61.6, 93.7) | 58.0% (43.8, 73.5) | 41.3% (22.8, 62.7) | 0.051 |
| Use of cholesterol medications | 10.4% (7.0, 13.9) | 14.5% (9.7, 19.5) | 5.3% (0.8, 10.0) | 0.006 | 34.5% (20.7, 50.0) | 17.4% (11.3, 23.8) | 7.0% (2.0, 12.2) | 1.5% (−5.4, 8.9) | <0.001 |
| Use of BP medications | 12.8% (9.9, 15.8) | 14.8% (10.9, 18.8) | 9.9% (5.7, 14.2) | 0.096 | 28.5% (18.8, 39.0) | 16.3% (11.3, 21.5) | 10.6% (6.1, 15.1) | 7.7% (0.5, 15.3) | 0.002 |
| cTnI, per log pg/mL | 5.0% (4.0, 5.9) | 6.8% (5.4, 8.2) | 3.6% (2.3, 5.0) | 0.001 | 6.6% (5.2, 8.0) | 4.8% (3.1, 6.5) | 7.1% (4.6, 9.6) | 20.5% (15.5, 25.8) | <0.001 |
| cTnT, per log pg/mL | 3.4% (2.3, 4.5) | 4.2% (2.6, 5.7) | 2.3% (0.9, 3.8) | 0.095 | −0.1% (−1.7, 1.5) | 4.9% (2.8, 6.9) | 8.0% (5.8, 10.2) | 27.9% (22.6, 33.5) | <0.001 |
| NT-proBNP, per log pg/mL | 7.7% (6.8, 8.6) | 7.4% (6.1, 8.8) | 6.8% (5.6, 8.0) | 0.488 | 7.3% (5.9, 8.6) | 6.4% (4.6, 8.3) | 8.9% (7.0, 10.9) | 21.5% (18.1, 25.1) | <0.001 |
A positive percentage indicates a relative increase in GDF-15 for a corresponding change in the risk factor, while a negative percentage indicates a relative reduction in GDF-15. Overall model is adjusted for age, sex, heart disease, heart failure, stroke, diabetes, cancer, and pregnancy. Model separately by sex additionally allow for an interaction of the variable of interest with sex, with an age-sex interaction also included in every model. Model separately by age category additionally includes an age-sex interaction, with an age-sex interaction also included in every model. GDF, growth differentiation factor; BMI, body mass index; SBP, systolic blood pressure; HDL, high-density lipoprotein; SIMD, Scottish Index of Multiple Deprivation; eGFR, estimated glomerular filtration rate; BP, blood pressure; cTnI, cardiac troponin I; cTnT, cardiac troponin T; NT-proBNP, N-terminal pro B-type natriuretic peptide.
Considering potential interactions between BMI and smoking, every 1 kg/m2 increase in BMI was associated with a 1.0% (95%CI 0.9, 1.2%) higher GDF-15 in non-smokers, although there was no association among smokers (a 0.1% increase (95%CI -0.3, 0.5%) (p-for interaction <0.001).
Discussion
These data highlight the plethora of physiological and pathophysiological processes that increase circulating GDF-15. Diseases associated with increased GDF-15 include heart disease, heart failure, stroke, cancer, and particularly diabetes, as well as biomarkers of cardiovascular disease such as high sensitivity troponin and NT-proBNP. Once these factors are accounted for, some of the elevation in GDF-15 observed in older people is partially ameliorated. In addition, the highest GDF-15 levels are seen in pregnant females, including some with presumed unidentified early pregnancy. The reference ranges for GDF-15 in this large general population study, stratified by age and sex, will help to contextualise absolute concentrations reported in many future studies which measure this biomarker.
Aside from cardiovascular disease risk prediction, there has been an explosion of interest in GDF-15 in several different clinical conditions. GDF-15 has been recently included in the ABC-bleeding risk score for patients with atrial fibrillation [27]. Recent observations that GDF-15 may be involved in energy balance [28] and may be the key molecule driving weight loss by the drug metformin [15], and the anti-inflammatory effect of colchicine [16], have also hiked interest in the biomarker. The reference ranges we report here for GDF-15 are broadly consistent with other data. One previous study of 533 healthy adults reported an upper reference limit for GDF-15 of 866 pg/mL, reporting no sex differences [29], and another small study a reference interval of 399–1,335 pg/mL [30]. An earlier study of GDF-15, using an in-house GDF-15 immunoassay in 429 apparently healthy individuals, reported a median GD-15 concentration of 762 ng/L (25th-75th percentiles, 600–959 ng/L) [31]. Our present data from GS:SFHS expand on published data considerably to provide reference intervals by age and sex, illustrating much higher expected levels in older people. Importantly, our observation that GDF-15 is sometimes very elevated (above the limit of detection) in healthy young females under the age of 40 is consistent with an association of GDF-15 with pregnancy, as seen by the median GDF-15 (>19,000 pg/mL) in females known to be pregnant. GDF-15 has been known by the name placental transforming growth factor-beta (pTGFB) and placental bone morphogenetic protein (PLAB). High levels of GDF-15 gene and protein expression have been observed in the human placenta, follicular fluid, and oocytes [32, 33], serum levels increase rapidly in early pregnancy [34]. There is no reason to believe elevated GDF-15 expression is a result of, or cause of, pathophysiological processes in the mother or the embryo although it has been observed GDF-15 is also associated with hyperemesis gravidarum [35]. The present study has insufficient data to investigate this issue further.
GDF-15 is strongly positively associated with smoking, BMI (among non-smokers), and diabetes in this study, consistent with other work [36, 37]. For instance, in the Malmö Diet and Cancer-Cardiovascular Cohort there was a positive association of GDF-15 with incident diabetes over 19 years [38] and directionally similar results were reported in the Whitehall II study [39]. In this sense, an analogy can be made between GDF-15 and the heart failure biomarker NT-proBNP, which we show is moderately strongly correlated with GDF-15. Elevated natriuretic peptides are biomarkers of adverse pathophysiology (volume overload leading to heart failure) but themselves exert beneficial natriuretic diuretic and metabolic effects that partially mitigate the processes that give rise to their expression. Similarly, GDF-15 concentrations are elevated by a wide range of pathophysiological processes and tissue damage, and may similarly exert a range of effects in metabolic and inflammatory pathways as part of a systemic response to diverse diseases as well as to ageing in general.
Strengths of this study include the use of a general population, as well as the large size and the wide age range, which allows stratified analysis of the reference ranges. Data were available to allow estimation of important correlations of GDF-15 with other emerging cardiac biomarkers high sensitivity troponin and NT-proBNP. GDF-15 was measured using automated assays available to clinical biochemistry departments. Weaknesses include the cross-sectional design of the study; causal inferences should be made with caution. GDF-15 was measured in frozen serum samples on a second thaw, and we were not able to directly investigate the impact of this storage on GDF-15 concentrations, although previous data indicates that GDF-15 is robust to several freeze-thaw cycles [31, 40]. Data on use of specific drugs, such as metformin, were not available from participant questionnaires. Data were available to identify pregnancy in some females, but there is also likely to be misclassification of pregnancy leading to some pregnant participants being included in the reference range estimates. The 97.5th centile and other thresholds we report are observations taken from a specific general population and cannot be taken in isolation to be indicative of underlying pathology. These are intended to be used as reference normal ranges for comparison in general population studies; further work would be required to validate their use in clinical practice.
In conclusion, these data are consistent with multiorgan expression of GDF-15 as a stress hormone. Due to an emerging body of research and clinical interest in GDF-15 across the life-course, absolute levels of GDF-15 require contextualisation. These data reliably define expected levels GDF-15 for reference in clinical and epidemiological studies, and identify potentially confounding risk factors that should be considered in interpreting GDF-15 concentrations.
Acknowledgments
We thank: Philip Stewart, Elaine Butler, Emma Dunning and Josephine Cooney (University of Glasgow) for excellent technical support; all the families who took part; the GPs and Scottish School of Primary Care for their help in recruitment; and the Generation Scotland team, which includes interviewers, computer and laboratory technicians, clerical workers, research scientists, volunteers, managers, receptionists, healthcare assistants and nurses. The authors thank Liz Coyle, University of Glasgow, for her assistance in the preparation of this article.
Footnotes
Research funding: Roche Diagnostics supported this study through provision of free reagents and a grant. Generation Scotland received support from the Chief Scientist Office of the Scottish Government Health Directorates [CZD/16/6] and the Scottish Funding Council [HR03006]. CH is supported by a Medical Research Council Programme Grant (U. MC_UU_00007/10). NLM is supported by a Chair Award (CH/F/21/90010), a Programme Grant (RG/20/10/34966) and a Research Excellence Award (RE/18/5/34216) from the British Heart Foundation. NS is supported by British Heart Foundation Centre of Research Excellence Grant (RE/18/6/34217). DMK is supported by Health Data Research UK which receives its funding from HDR UK Ltd (HDR-5012) funded by the UK Medical Research Council, Engineering and Physical Sciences Research Council, Economic and Social Research Council, Department of Health and Social Care (England), Chief Scientist Office of the Scottish Government Health and Social Care Directorates, Health and Social Care Research and Development Division (Welsh Government), Public Health Agency (Northern Ireland), British Heart Foundation and the Wellcome Trust.
Author contributions: PW and NS conceived and designed the study. AC conducted data acquisition. PW carried out the statistical analysis. PW and NS wrote the original manuscript. All authors contributed to the interpretation of the data and critical revision of the manuscript for important intellectual content and approved the final draft. All authors have accepted responsibility for the entire content of this manuscript and approved its submission.
Competing interests: PW reports grant income from Roche Diagnostics, AstraZeneca, Boehringer Ingelheim, and Novartis, outside the submitted work. REM has received speaker fees from Illumina and is an advisor to the Epigenetic Clock Development Foundation. NLM has received research grants to the University of Edinburgh from Abbott Diagnostics and Siemens Healthineers that are not related to the current work and has acted as a consultant for Abbott Diagnostics, Siemens Healthineers, Roche, and LumiraDx. SO has provided remunerated consultancy services to Pfizer, AstraZeneca, Novo Nordisk and ERX Pharmaceuticals. NS has consulted for Abbott Laboratories, Afimmune, Amgen, AstraZeneca, Boehringer Ingelheim, Eli Lilly, Hanmi Pharmaceuticals, Merck Sharp & Dohme, Novartis, Novo Nordisk, Pfizer, and Sanofi; and received grant support paid to his University from AstraZeneca, Boehringer Ingelheim, Novartis, and Roche Diagnostics outside the submitted work. All other authors declare no conflicts.
Informed consent: Informed consent was obtained from all individuals included in this study.
Ethical approval: The research related to human use has been complied with all the relevant national regulations, institutional policies and in accordance with the tenets of the Helsinki Declaration, and ethical approval was obtained from Research Ethics Committees in Scotland along with the necessary NHS R&D approval.
Data availability: The datasets generated during and/or analysed during the current study are available from the GS access committee https://www.ed.ac.uk/generation-scotland/for-researchers/access on reasonable request.
References
- 1.Zimmers TA, Jin X, Hsiao EC, McGrath SA, Esquela AF, Koniaris LG. Growth differentiation factor-15/macrophage inhibitory cytokine-1 induction after kidney and lung injury. Shock. 2005;23:543–8. [PubMed] [Google Scholar]
- 2.Kempf T, Eden M, Strelau J, Naguib M, Willenbockel C, Tongers J, et al. The transforming growth factor-β superfamily member growth-differentiation factor-15 protects the heart from ischemia/reperfusion injury. Circ Res. 2006;98:351–60. doi: 10.1161/01.res.0000202805.73038.48. [DOI] [PubMed] [Google Scholar]
- 3.Wang T, Liu J, McDonald C, Lupino K, Zhai X, Wilkins BJ, et al. GDF15 is a heart-derived hormone that regulates body growth. EMBO Mol Med. 2017;9:1150–64. doi: 10.15252/emmm.201707604. [DOI] [PMC free article] [PubMed] [Google Scholar]
- 4.Verhamme FM, Seys LJM, De Smet EG, Provoost S, Janssens W, Elewaut D, et al. Elevated GDF-15 contributes to pulmonary inflammation upon cigarette smoke exposure. Mucosal Immunol. 2017;10:1400–11. doi: 10.1038/mi.2017.3. [DOI] [PubMed] [Google Scholar]
- 5.Brown DA, Ward RL, Buckhaults P, Liu T, Romans KE, Hawkins NJ, et al. MIC-1 serum level and genotype: associations with progress and prognosis of colorectal carcinoma. Clin Cancer Res. 2003;9:2642–50. [PubMed] [Google Scholar]
- 6.Liu J, Kumar S, Heinzel A, Gao M, Guo J, Alvarado GF, et al. Renoprotective and immunomodulatory effects of GDF15 following AKI invoked by ischemia-reperfusion injury. J Am Soc Nephrol. 2020;31:701–15. doi: 10.1681/asn.2019090876. [DOI] [PMC free article] [PubMed] [Google Scholar]
- 7.Liu X, Chi X, Gong Q, Gao L, Niu Y, Chi X, et al. Association of serum level of growth differentiation factor 15 with liver cirrhosis and hepatocellular carcinoma. PLoS One. 2015;10:e0127518. doi: 10.1371/journal.pone.0127518. [DOI] [PMC free article] [PubMed] [Google Scholar]
- 8.Koopmann J, Buckhaults P, Brown DA, Zahurak ML, Sato N, Fukushima N, et al. Serum macrophage inhibitory cytokine 1 as a marker of pancreatic and other periampullary cancers. Clin Cancer Res. 2004;10:2386–92. doi: 10.1158/1078-0432.ccr-03-0165. [DOI] [PubMed] [Google Scholar]
- 9.Ding Q, Mracek T, Gonzalez-Muniesa P, Kos K, Wilding J, Trayhurn P, et al. Identification of macrophage inhibitory cytokine-1 in adipose tissue and its secretion as an adipokine by human adipocytes. Endocrinology. 2009;150:1688–96. doi: 10.1210/en.2008-0952. [DOI] [PubMed] [Google Scholar]
- 10.Wollert KC, Kempf T, Wallentin L. Growth differentiation factor 15 as a biomarker in cardiovascular disease. Clin Chem. 2017;63:140–51. doi: 10.1373/clinchem.2016.255174. [DOI] [PubMed] [Google Scholar]
- 11.Verhamme FM, Freeman CM, Brusselle GG, Bracke KR, Curtis JL. GDF-15 in pulmonary and critical care medicine. Am J Respir Cell Mol Biol. 2019;60:621–8. doi: 10.1165/rcmb.2018-0379tr. [DOI] [PMC free article] [PubMed] [Google Scholar]
- 12.Anand IS, Kempf T, Rector TS, Tapken H, Allhoff T, Jantzen F, et al. Serial measurement of growth-differentiation factor-15 in heart failure. Circulation. 2010;122:1387–95. doi: 10.1161/CIRCULATIONAHA.109.928846. [DOI] [PubMed] [Google Scholar]
- 13.Dallmeier D, Brenner H, Mons U, Rottbauer W, Koenig W, Rothenbacher D. Growth differentiation factor 15, its 12-month relative change, and risk of cardiovascular events and total mortality in patients with stable coronary heart disease: 10-year follow-up of the KAROLA study. Clin Chem. 2016;62:982–92. doi: 10.1373/clinchem.2016.254755. [DOI] [PubMed] [Google Scholar]
- 14.Suriben R, Chen M, Higbee J, Oeffinger J, Ventura R, Li B, et al. Antibody-mediated inhibition of GDF15–GFRAL activity reverses cancer cachexia in mice. Nat Med. 2020;26:1264–70. doi: 10.1038/s41591-020-0945-x. [DOI] [PubMed] [Google Scholar]
- 15.Coll APAP, Chen M, Taskar P, Rimmington D, Patel S, Tadross JAJA, et al. GDF15 mediates the effects of metformin on body weight and energy balance. Nature. 2020;578:444–8. doi: 10.1038/s41586-019-1911-y. [DOI] [PMC free article] [PubMed] [Google Scholar]
- 16.Weng J-H, Koch PD, Luan HH, Tu H-C, Shimada K, Ngan I, et al. Colchicine acts selectively in the liver to induce hepatokines that inhibit myeloid cell activation. Nat Metab. 2021;3:513–22. doi: 10.1038/s42255-021-00366-y. [DOI] [PMC free article] [PubMed] [Google Scholar]
- 17.Walter J, Nestelberger T, Boeddinghaus J, Twerenbold R, Croton L, Badertscher P, et al. Growth differentiation factor-15 and all-cause mortality in patients with suspected myocardial infarction. Int J Cardiol. 2019;292:241–5. doi: 10.1016/j.ijcard.2019.04.088. [DOI] [PubMed] [Google Scholar]
- 18.Hagström E, Held C, Stewart RAH, Aylward PE, Budaj A, Cannon CP, et al. Growth differentiation factor 15 predicts all-cause morbidity and mortality in stable coronary heart disease. Clin Chem. 2017;63:325–33. doi: 10.1373/clinchem.2016.260570. [DOI] [PubMed] [Google Scholar]
- 19.Hagström E, James SK, Bertilsson M, Becker RC, Himmelmann A, Husted S, et al. Growth differentiation factor-15 level predicts major bleeding and cardiovascular events in patients with acute coronary syndromes: results from the PLATO study. Eur Heart J. 2016;37:1325–33. doi: 10.1093/eurheartj/ehv491. [DOI] [PubMed] [Google Scholar]
- 20.Bouabdallaoui N, Claggett B, Zile MR, McMurray JJV, O’Meara E, Packer M, et al. Growth differentiation factor-15 is not modified by sacubitril/valsartan and is an independent marker of risk in patients with heart failure and reduced ejection fraction: the PARADIGM-HF trial. Eur J Heart Fail. 2018;20:1701–9. doi: 10.1002/ejhf.1301. [DOI] [PubMed] [Google Scholar]
- 21.Wang TJ, Wollert KC, Larson MG, Coglianese E, McCabe EL, Cheng S, et al. Prognostic utility of novel biomarkers of cardiovascular stress: the Framingham Heart Study. Circulation. 2012;126:1596–604. doi: 10.1161/CIRCULATIONAHA. [DOI] [PMC free article] [PubMed] [Google Scholar]
- 22.Welsh P, Preiss D, Shah ASVV, McAllister D, Briggs A, Boachie C, et al. Comparison between high-sensitivity cardiac troponin T and cardiac troponin I in a large general population cohort. Clin Chem. 2018;64:1607–16. doi: 10.1373/clinchem.2018.292086. [DOI] [PMC free article] [PubMed] [Google Scholar]
- 23.Smith BH, Campbell H, Blackwood D, Connell J, Connor M, Deary IJ, et al. Generation scotland: the Scottish family health study; a new resource for researching genes and heritability. BMC Med Genet. 2006;7:74. doi: 10.1186/1471-2350-7-74. [DOI] [PMC free article] [PubMed] [Google Scholar]
- 24.Smith BH, Campbell A, Linksted P, Fitzpatrick B, Jackson C, Kerr SM, et al. Cohort profile: Generation scotland: Scottish Family Health Study (GS: SFHS). The study, its participants and their potential for genetic research on health and illness. Int J Epidemiol. 2013;42:689–700. doi: 10.1093/ije/dys084. [DOI] [PubMed] [Google Scholar]
- 25.Scottish Government. The Scottish Index of Multiple Deprivation [Internet] 2020. http://www.gov.scot/Topics/Statistics/SIMD Available from: [Google Scholar]
- 26.Levey AS, Stevens LA, Schmid CH, Zhang YL, Castro AF, Feldman HI, et al. A new equation to estimate glomerular filtration rate. Ann Intern Med. 2009;150:604. doi: 10.7326/0003-4819-150-9-200905050-00006. [DOI] [PMC free article] [PubMed] [Google Scholar]
- 27.Hijazi Z, Oldgren J, Lindbäck J, Alexander JH, Connolly SJ, Eikelboom JW, et al. A biomarker-based risk score to predict death in patients with atrial fibrillation: the ABC (age, biomarkers, clinical history) death risk score. Eur Heart J. 2018;39:477–85. doi: 10.1093/eurheartj/ehx584. [DOI] [PMC free article] [PubMed] [Google Scholar]
- 28.Hsu JY, Crawley S, Chen M, Ayupova DA, Lindhout DA, Higbee J, et al. Non-homeostatic body weight regulation through a brainstem-restricted receptor for GDF15. Nature. 2017;550:255–9. doi: 10.1038/nature24042. [DOI] [PubMed] [Google Scholar]
- 29.Krintus M, Braga F, Kozinski M, Borille S, Kubica J, Sypniewska G, et al. A study of biological and lifestyle factors, including within-subject variation, affecting concentrations of growth differentiation factor 15 in serum. Clin Chem Lab Med. 2019;57:1035–43. doi: 10.1515/cclm-2018-0908/html. [DOI] [PubMed] [Google Scholar]
- 30.Hamon SM, Griffin TP, Islam MN, Wall D, Griffin MD, O’Shea PM. Defining reference intervals for a serum growth differentiation factor-15 (GDF-15) assay in a Caucasian population and its potential utility in diabetic kidney disease (DKD) Clin Chem Lab Med. 2019;57:510–20. doi: 10.1515/cclm-2018-0534. [DOI] [PubMed] [Google Scholar]
- 31.Kempf T, Horn-Wichmann R, Brabant G, Peter T, Allhoff T, Klein G, et al. Circulating concentrations of growth-differentiation factor 15 in apparently healthy elderly individuals and patients with chronic heart failure as assessed by a new immunoradiometric Sandwich assay. Clin Chem. 2007;53:284–91. doi: 10.1373/clinchem.2006.076828. [DOI] [PubMed] [Google Scholar]
- 32.Souček K, Malenovská A, Kahounová Z, Remšík J, Holubcová Z, Soukup T, et al. Presence of growth/differentiation factor-15 cytokine in human follicular fluid, granulosa cells, and oocytes. J Assist Reprod Genet. 2018;35:1407–17. doi: 10.1007/s10815-018-1230-5. [DOI] [PMC free article] [PubMed] [Google Scholar]
- 33.Lawton LN, Bonaldo MDF, Jelenc PC, Qiu L, Baumes SA, Marcelino RA, et al. Identification of a novel member of the TGF-beta superfamily highly expressed in human placenta. Gene. 1997;203:17–26. doi: 10.1016/s0378-1119(97)00485-x. [DOI] [PubMed] [Google Scholar]
- 34.Moore AG, Brown DA, Fairlie WD, Bauskin AR, Brown PK, Munier MLC, et al. The transforming growth factor-β superfamily cytokine macrophage inhibitory cytokine-1 is present in high concentrations in the serum of pregnant Women1. J Clin Endocrinol Metab. 2000;85:4781–8. doi: 10.1210/jc.85.12.4781. [DOI] [PubMed] [Google Scholar]
- 35.Fejzo MS, Sazonova OV, Sathirapongsasuti JF, Hallgrímsdóttir IB, Vacic V, MacGibbon KW, et al. Placenta and appetite genes GDF15 and IGFBP7 are associated with hyperemesis gravidarum. Nat Commun. 2018;9:1178. doi: 10.1038/s41467-018-03258-0. [DOI] [PMC free article] [PubMed] [Google Scholar]
- 36.Wu Q, Jiang D, Chu HW. Cigarette smoke induces growth differentiation factor 15 production in human lung epithelial cells: implication in mucin over-expression. Innate Immun. 2012;18:617–26. doi: 10.1177/1753425911429837. [DOI] [PubMed] [Google Scholar]
- 37.Berezin AE. Diabetes and Metabolic Syndrome: Clinical Research and Reviews. Vol. 10. Elsevier Ltd; 2016. [8 Jun 2021]. Diabetes mellitus related biomarker: the predictive role of growth-differentiation factor-15 [Internet] pp. S154–7.https://pubmed.ncbi.nlm.nih.gov/26482961/ Available from. Accessed. [DOI] [PubMed] [Google Scholar]
- 38.Bao X, Borné Y, Muhammad IF, Nilsson J, Lind L, Melander O, et al. Growth differentiation factor 15 is positively associated with incidence of diabetes mellitus: the Malmö Diet and Cancer-Cardiovascular Cohort. Diabetologia. 2019;62:78–86. doi: 10.1007/s00125-018-4751-7. [DOI] [PMC free article] [PubMed] [Google Scholar]
- 39.Carstensen M, Herder C, Brunner EJ, Strassburger K, Tabak AG, Roden M, et al. Macrophage inhibitory cytokine-1 is increased in individuals before type 2 diabetes diagnosis but is not an independent predictor of type 2 diabetes: the Whitehall II study. Eur J Endocrinol. 2010;162:913–7. doi: 10.1530/eje-09-1066. [DOI] [PubMed] [Google Scholar]
- 40.Amstad A, Coray M, Frick C, Barro C, Oechtering J, Amann M, et al. Growth differentiation factor 15 is increased in stable MS. Neurol - Neuroimmunol Neuroinflammation. 2020;7:e675. doi: 10.1212/NXI.0000000000000675. [DOI] [PMC free article] [PubMed] [Google Scholar]