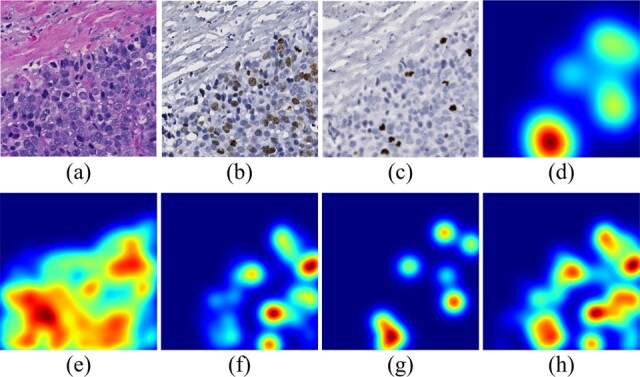
Fig. 2.

Spatial attention maps of different attention modes for a representative tissue region. (a)–(c) The same small tissue area from co-registered H&E, Ki67 and PHH3 pathology image, respectively; (d) the attention map generated by the ratio of number of tumor cells in Ki67 to that in PHH3 enriched regions; (e)–(g) KDE density estimation results by all tumor cells, tumor cells in Ki67 and in PHH3 enriched regions, respectively; (h) KDE density estimation results by the union of regions enriched with tumor cells by Ki67 and PHH3
