Abstract
Background
The aim of this study is to elucidate the difference in absorbed dose (Dabs) patterns in radiopharmaceutical therapies between alpha emitters (225Ac) and beta emitters (177Lu) when targeting cancer-associated fibroblasts (CAF) or tumor cells. Five spherical models with 3 mm diameter were created, representing spherical tumor masses that contain tumor clusters, interspersed with CAFs. The mean distance from a tumor cell to the nearest CAF (Lmean) varied throughout these models from 92 to 1030 µm. Dabs calculations were performed while selecting either CAFs or tumor cells as sources, with Convolution/Superposition with 177Lu and Monte Carlo simulations (GATE) with 225Ac. Analyses were conducted with Dose Volume Histograms and efficacy ratios (ER), which represents the ratio of mean Dabs that is deposited in the target volume.
Results
225Ac is the most optimal radionuclide when CAFs are both targeted and irradiating themselves, as ERs increase from 1.5 to 3.7 when Lmean increases from 92 to 1030 µm. With 177Lu, these numbers vary from 1.2 to 2.7. Conversely, when CAFs are sources and tumors are targets with 225Ac, ERs decreased from 0.8 to 0.1 when Lmean increases from 92 to 1030 µm. With 177Lu, these numbers vary from 0.9 to 0.3
Conclusion
When targeting CAFs to irradiate tumors, the efficacy of using 225Ac decreases as the average size of the tumor clusters (or Lmean) increases. In such situations, 177Lu will be more effective than 225Ac when targeting CAFs due to the longer beta particle range.
Supplementary Information
The online version contains supplementary material available at 10.1186/s40658-022-00497-5.
Keywords: Cancer-associated fibroblasts, Dose voxel kernel, Radiopharmaceutical therapy, Monte Carlo simulation
Background
Tumors include vascular structures, inflammatory cells, fibroblasts and collagen that together make up the tumor microenvironment or stroma. This stromal support sustains continuous tumor growth as cancer cells reprogram normal fibroblasts into pro-tumorigenic cancer-associated fibroblasts (CAFs), which is a major stroma constituent. CAFs create a niche where tumors are protected from conventional therapies. Consequently, CAFs are becoming a target of interest for diagnosis and prognosis, as depleting them from stroma structure can inhibit cancer growth by disrupting cancer-supportive functions [1].
Fibroblasts activation protein (FAP) is overexpressed on CAFs in many cancers types, such as breast, esophagus, lung, pancreatic, head-neck, colorectal cancers [2]. FAP expression in normal tissues is absent or low, which makes it an appealing target for radiopharmaceutical therapies (RPTs) with antibodies [3], small molecule inhibitors (FAPI) [4] or peptides [5]. As tumor lesions exceeding 1–2 mm in size require the formation of a supporting stroma [6], targeting the stroma can lead to tumor growth suppression as depicted with 225Ac-FAPI-04 on xenograft mouse models [4].
Several clinical studies have yielded promising results when targeting FAP. Clinical studies with FAPI-04 [7] and FAPI-46 [8] with 90Y demonstrated a significant reduction in patient use of pain medication and a low rate of attributable adverse events on critical organs. In addition, a first clinical feasibility showed encouraging results on advanced adenocarcinomas with 177Lu-FAP-2286 peptide [5]. Additionally, studies aiming to improve FAPI time retention can allow a larger flexibility with regard to the choice of the radionuclide [9, 10].
In radiopharmaceutical therapies (RPTs), beta emitters are the most commonly used radionuclides and are employed for the irradiation of large tumors [11]. Targeting of FAP with therapeutic radionuclides is primarily intended to kill neighboring tumor cells, however destruction of CAFs may provide additional benefit. The variability of the spatial distribution of CAFs may play a critical role in the efficacy of CAF-targeted RPT [12]. Although alpha emitters have a higher LET (greater by a factor 500) and shorter ranges (50–100 µm), which may reduce toxicity burden and improve tumor cell killing, the role of 225Ac in FAP-targeted RPT remains unknown [4, 13].
To investigate situations when the use of beta or alpha emitters might be optimal when targeting CAFs, we compare their absorbed dose estimates in 3D cellular models with CAFs and tumors intermingling. Modeling was performed with two radioisotopes currently under clinical investigation (177Lu and 225Ac) representing beta and alpha emitters. To represent the variability of the spatial distribution between CAFs and tumors, several degrees of clustering were modeled.
Methods
Analysis of CAFs immunochemistry images
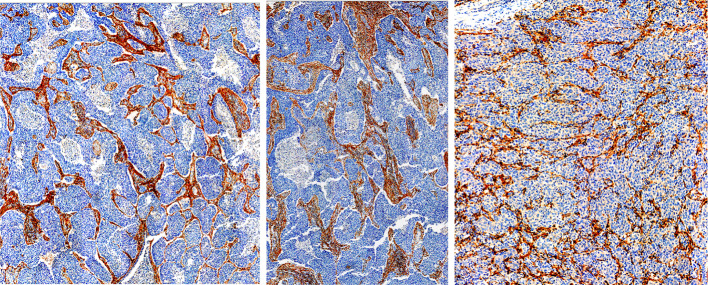
Figure 1 represents non-small cell lung cancer (NSCLC) and gastric adenocarcinoma. Cell nuclei are stained with the hematoxylin counterstain (blue) and FAP using SP325 FAP antibody (red). To extract information on the spatial distribution of CAF, the pixels of the three CAFs immunochemistry images were first downsampled to 20 µm × 20 µm using 3D Slicer (http://www.slicer.org, 14). Second, CAF and tumors were segmented, considering the non-red areas as tumors, and the distance was calculated between each tumor cell and the nearest CAF (L) along the four cartesian directions using Python 3.7.7. Finally, L distance histograms were plotted and, tumor-to-CAF ratios and Lmean were calculated.
Fig. 1.
CAFs immunochemistry images of NSCLC (left and middle) and gastric adenocarcinoma (right). Cell nuclei are visible in blue and FAP in red
Spherical mass (SM) model and variation of tumor clustering
A 3-mm-diameter spherical model was created as a cellular mass. A voxel sampling of 20 × 20 × 20 μm3 was used, corresponding to the approximated dimensions of a cell. Therefore, a continuous distribution was assumed within the SM with a total of 1,767,063 individual voxels. The reference tissue for this model was the liver as it is a common location for metastases [15]. The mass density of 1.05 g.cm−3 and the elemental compositions were extracted from the International Commission on Radiological Protection (ICRP 110) adult male computational phantom [16]. Inspired by CAFs immunochemistry images, two types of cells were considered: tumors and the cancer-associated fibroblasts (CAF), with a constant allocation of 75% tumor cells and 25% CAFs within the SM.
Additionally, tumor cells were gathered into clusters. Five models in total were created where the clusters were adjusted for their size and shape, depicting varying sizes of tumor clusters with interspersed CAFs (Fig. 2). This clustering was quantified by the Lmean, calculated using the same process as described in the Analysis of CAF immunochemistry images but in six cartesian directions as the models are in 3D.
Fig. 2.
Transversal slice of the five clustering levels of the SM model with tumor cells (gray) surrounded with by CAFs (white) with respective Lmean
Note that a constant allocation of 75% of tumor cells and 25% of CAFs was maintained within the SM, regardless of the clustering level.
Dosimetry
Two radioisotopes of interest were selected for the dosimetry part: 177Lu for the beta emitters and 225Ac for the alpha emitters. 225Ac decays with four short-lived alphas emitters (with 221Fr, 217At and 213Bi/213Po according to the decay branch), among other minor emissions [17] (Table 1). The energy deposition in the voxels was evaluated for the five SM models with two methods applied to each radioisotope: Convolution/Superposition method with a Dose Voxel Kernel (DVK) for 177Lu and a full Monte Carlo modeling of radiation transport (MC) for 225Ac.
Table 1.
Radionuclide properties [11]
| Radionuclide | Therapeutic emission | Approximate emission range in tissue (mm) | Radionuclide half-life |
|---|---|---|---|
| 177Lu | β | 0.62 | 6.6 |
| 225Ac | α | 0.05–0.08 | 10.0 |
Tumor cells and CAFs were subsequently designated as sources with equal uptakes, leading to specific analyses on their absorbed dose (Dabs). As we focused on differences of resulting Dabs between tumor geometries, the radioisotopes were modeled to be within the source cells (i.e., the tumors or CAF voxels) and did not redistribute with time (i.e., biological clearance was not considered). In the majority of cancers, FAP is not expressed on tumor cells and therefore CAF and tumors were not considered sources at the same time; although FAP is expressed on sarcoma and mesothelioma tumor cells [8].
To provide approximately realistic activity residence in the tumor, a consistent number of decays were selected for 177Lu (109 decays) and 225Ac (106 decays). These decays were distributed uniformly among source cells—i.e., 109 decays means that decays per source vary from ~ 755 (when tumor cells are sources) to ~ 2264 (when CAFs are sources). For 106 decays, decays per source vary from ~ 0.8 to 2.3. For 225Ac, these variations of decays per source allows some stochastic variability with the spatial uptake distribution when using MC. In the context of alpha-RPT, due to the lower number of decays, the variability of activity per cell is higher with alpha particles compared to beta particles, which cannot be modeled with the Convolution/Superposition method with DVK. With all combinations of source and target, four analyses of Dabs were performed. Consistent with the MIRD formalism [18], these combinations of sources and targets can be expressed with the following notation: S(vTarget ← vSource), leading to the Dabs analysis of S(vTumors ← vTumors), S(vCAF ← vTumors), S(vTumors ← vCAF) and S(vCAF ← vCAF). Additional analyses were conducted for the entire SM including CAFs and tumors: S(vSM ← vCAF) and S(vSM ← vTumors).
Convolution/superposition with dose voxel kernels (DVK) for 177Lu
For 177Lu, the absorbed dose of the radioisotopes was calculated using Convolution/Superposition with a Dose Voxel Kernel (DVK) in Python 3.7.7. The number of primaries used for each SM model was 109 decays. According to the MIRD formalism [18], the total Dabs within a voxel is the sum of energy deposition (divided by mass) from all source voxels (1):
| 1 |
is the time-integrated activity of the source voxel , directly related with the uptake value, and is the absorbed dose in the target voxel per decay in the source voxel, which represent the DVK part with a sampling of 203 µm3.
DVK methods requires a non-stochastic distribution around the source [19] and therefore was used only for 177Lu. As a prerequisite for Convolution/Superposition, 177Lu DVK was pre-generated using GATE (Geant4 Application for Tomographic Emission) version 9.0 [20], in the same density and composition as the model, namely the liver (1.05 g.cm−3), extracted from the ICRP 110 [16]. The maximal beta emission range of 177Lu is 1.8 mm, thus, a specific filter size of 2013 voxels (2 mm range) was selected according to the radionuclide physical properties, so that the filter size encompasses more than 99% of the respective total energy deposition. The numbers of decays used for DVK generation for 177Lu were 107 which resulted in a relative standard deviation for the absorbed dose at the DVK source voxel of less than 0.04% (5% at 0.4 mm from the source). More detailed parameters for the DVK generation are common with the direct MC simulation, available in Monte Carlo simulation (MC) for 225Ac.
Monte Carlo simulation (MC) for 225Ac
MC simulations were performed for 225Ac using GATE [20] version 9.0 (release date: 03–2020) using 106 particles for each SM model. The Livermore physics model was selected which considers all atomic shells and has the best agreement with validation studies performed to low energies down to 10 eV [21]. In the simulations, the step size limit or range cut-off parameter was arbitrary chosen to 1/20th of the voxel size, i.e., 1 μm. The GATE Radioactive Decay Module was enabled to ensure the full decay chain and its associated emissions were simulated [21], and the Mersenne-Twister engine was selected. The entire energy spectra from parents and all daughters were considered in the Monte Carlo models of the deposited energy resulting from the radiation emitted from these radioisotopes. The model was embedded in a world size of 103 cm3.
Analysis of the SM models
Absorbed dose (Dabs) maps and statistics
Dabs maps were created using 3D Slicer in 3D. Second, the percentage of target cells that received ≥ 10% of the maximum Dabs were calculated for both sources across the five tumor models. Third, the mean Dabs within the SM, including both CAFs and tumor cells, was calculated, e.g., S(vSM ← vCAF) and S(vSM ← vTumors).
Dose volume histograms (DVH)
DVHs were calculated for S(vTumors ← vTumors), S(VCAF ← VCAF), S(vTumors ← vCAF) and S(vCAF ← vTumors) using Python 3.7.7. for both 177Lu and 225Ac using CAFs and tumor as targets and sources.
Efficacy ratios (ER)
Ratios of mean Dabs were calculated for S(vTumors ← vCAF) and S(VCAF ← VCAF) relative to S(vSM ← vCAF), and for S(vTumors ← vTumors) and S(vCAF ← vTumors) relative to S(vSM ← vTumors) termed as efficacy ratios (ERs). The ER represents the fraction of mean Dabs measured on SPECT or PET imaging (when appropriate quantification is feasible) that is deposited in the target volume. The main difference with the MIRD 21 absorbed fraction [22] is that ER do not consider the energy escaped out of the SM. An ER of 1 means that the target volume received an Dabs equal to the total of the Dabs of the SM.
Results
Analysis of CAFs immunochemistry images
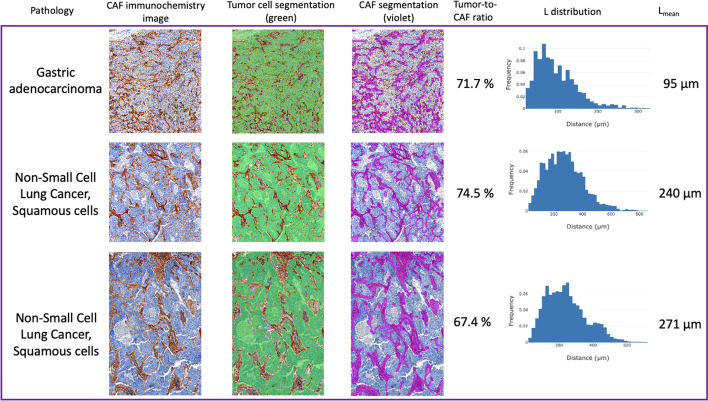
Figure 3 displays the three CAFs immunochemistry images with their respective CAFs and tumors segmentations, tumor ratios, L distributions and Lmean. Note that the segmentations and subsequent calculations were performed with a 20 µm × 20 µm undersampling.
Fig. 3.
Three images of CAF immunochemistry with associated CAF and tumor segmentation, tumor ratio, nearest CAF for each tumor distance (L) distribution and Lmean
The three CAFs immunochemistry images depict similar tumor-to-CAF ratios, with an average of 71.2% tumor cells, and an Lmean ranging from 95 to 271 µm (Fig. 3). Note that the Lmean of the five SM models covers the Lmean of the CAFs immunochemistry images (92 to 1030 µm, see Additional file 1: Fig. S1).
Analysis of the SM model
Absorbed dose (Dabs) maps and statistics
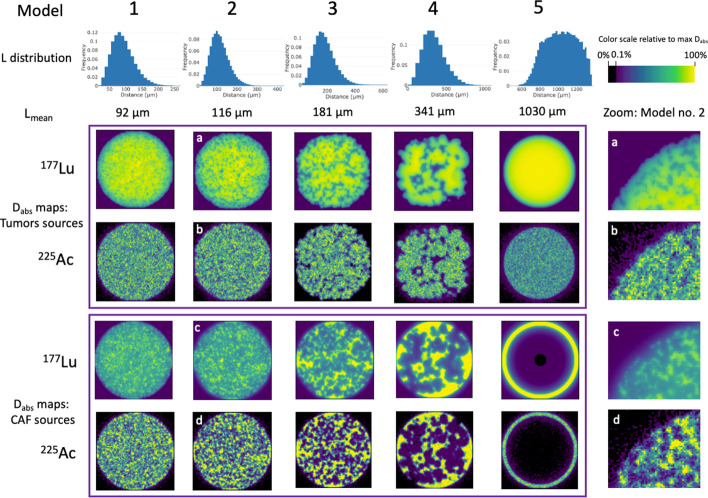
Dabs maps were analyzed for both radioisotopes in two cases: with either CAFs or tumors as sources (Fig. 4).
Fig. 4.
Representative slices of the five models with their associated Lmean (left column: grey are tumor cells, white are CAFs) and associated Dabs maps with tumor cells and CAFs as sources for 177Lu and 225Ac. Magnifications of the upper left corner of model 2 are provided to show the differences in stochastic noise between the radionuclides (right column)
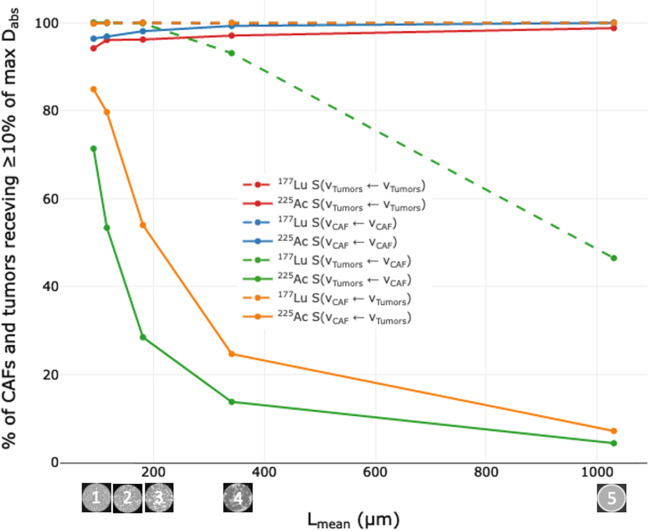
The Dabs maps demonstrate that 177Lu is associated with a more homogeneous appearing Dabs than 225Ac. This is confirmed by the high percentages of CAFs and tumors cells receiving Dabs ≥ 10% of the maximum Dabs (Fig. 5, Additional file 1: Table S1). Conversely, the use of 225Ac shows a more heterogeneous Dabs, as demonstrated by the low percentage of CAFs and tumors cells receiving ≥ 10% of the maximum Dabs.
Fig. 5.
Percentage of CAFs and tumors receiving ≥ 10% of the maximum Dabs within the SM across the five models using either tumor cells or CAFs as sources or targets for 177Lu and 225Ac. Values for 177Lu S(vTumors ← vTumors), S(VCAF ← VCAF) and S(VCAF ← VTumors) are superposed
The lowest percentage of CAFs and tumor cells receiving ≥ 10% of the maximum Dabs is seen with 225Ac for the model 5. In this model, when CAFs are sources and tumors are targets (i.e., S(VTumors ← VCAF) in solid green), 4.4% of the tumor cells receive ≥ 10% of the maximum Dabs. Additionally, the mean Dabs within the SM is minimally impacted by clustering for both 177Lu and 225Ac (Additional file 1: Fig. S2).
Dose volume histograms (DVH)
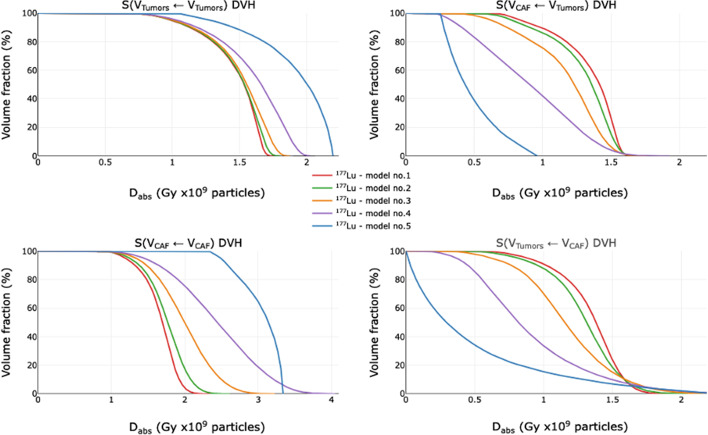
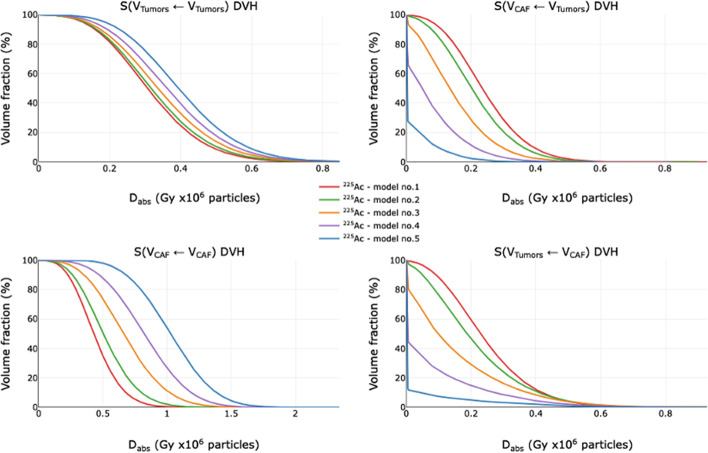
DVHs were plotted in Fig. 6 for 177Lu and in Fig. 7 for 225Ac for the four combinations of targets and sources: S(vTumors ← vTumors), S(vCAF ← vTumors), S(vTumors ← vCAF) and S(vCAF ← vCAF).
Fig. 6.
177Lu Dose Volume Histograms of the five models for S(vTumors ← vTumors), S(vCAF ← vTumors), S(vTumors ← vCAF) and S(vCAF ← vCAF)
Fig. 7.
225Ac Dose Volume Histograms of the five models for S(vTumors ← vTumors), S(vCAF ← vTumors), S(vTumors ← vCAF) and S(vCAF ← vCAF)
For all the models, 177Lu and 225Ac are the most effective when targets and sources are identical (S(vTumors ← vTumors) and S(vCAF ← vCAF) in left columns). This trend is most critical for the model 5, where Lmean is the highest. In addition, the DVH slopes of 177Lu are steeper than those of 225Ac, due to a more homogeneous Dabs, as observed in 3.2.1. In the setting where sources and targets are different (S(vCAF ← vTumors) and S(vTumors ← vCAF) in right columns), the opposite is true. The shoulders of the DVH slopes for 225Ac become sharper when going from model 1 to 5. With 225Ac, when the targets and sources are different, a large percentage of the targets receive negligible doses as shown by extrapolated shoulder y-intercepts of less than 100%. For example, with model 5, 73% of CAFs for S(vCAF ← vTumors) and 88% of tumors for S(vTumors ← vCAF) receive nominally negligible dose. With model 1, this effect is minimized with only 2% of CAFs for S(vCAF ← vTumors) and 0% of tumors for S(vTumors ← vCAF) receiving negligible dose. Additionally, the mean Dabs within the SM is minimally impacted by clustering for both 177Lu and 225Ac (Additional file 1: Fig. S2).
Efficacy ratios (ER)
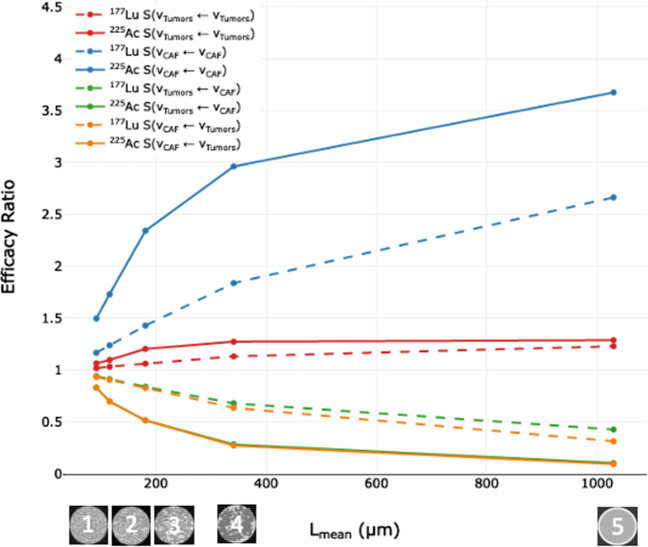
ERs are plotted in Fig. 8 for 177Lu and 225Ac for S(vCAF ← vTumors), S(vTumors ← vCAF) and S(vCAF ← vCAF) and S(vTumors ← vTumors).
Fig. 8.
Efficacy ratios (ERs) of the five models using either tumors and CAFs as sources or targets for 177Lu and 225Ac. Values for 225Ac S(vTumors ← vCAF) and (vCAF ← vTumors) are superposed
When Lmean increases (from 92 µm to 1030 µm), the most optimal combination is obtained with 225Ac and S(vCAF ← vCAF), with the ER reaching 3.7 in model 5. Conversely, the ER of 225Ac with S(vCAF ← vTumors) is the lowest at 0.1. Overall, 225Ac is the most impacted by changes in Lmean, with the ER increasing 2.2 (+ 147%) for S(vCAF ← vCAF), and decreasing 0.73 (−87%) for S(vTumors ← vCAF) and 0.74 (−88%) for S(vCAF ← vTumors) when going from model 1 to 5. The impact of Lmean is more muted for 177Lu, with the ER increasing 1.5 (+ 125%) with S(vCAF ← vCAF) and decreasing 0.6 (−66%) with S(vCAF ← vTumors) when going from model 1 to 5.
Discussion
In this work, we have modeled a tumor comprised of a fixed ratio of tumor cells and CAFs, varying the cluster size of the tumor cells. We have shown that the use of alpha emitters results in a significant fraction of the target mass that receives negligible absorbed dose, which becomes more pronounced as clustering increases. Impact of clustering on target absorbed dose with beta particles is more muted than with alpha particles when the targets and sources are not the same, such as what would be the case with FAP-targeted RPT.
The reason for this effect on cluster size for alpha particles is due its short range (~ 60 µm). Therefore, the effect of crossfire decreases when the mean distance between tumors and CAF (Lmean) increases. In contrast, due to their larger range (~ 0.6 mm for 177Lu [11]), beta emitters benefit from crossfire irradiation as the clustering size increases, making beta particles more effective in larger clusters compared to alpha particles. The benefit of 177Lu is limited when the cluster size is larger than ~ 600–700 µm, which correspond to its maximal range in tissues.
It is interesting to note that 225Ac ERs do not demonstrate a significant advantage over 177Lu ERs when tumors are both sources and target or S(vTumors ← vTumors). This is due to the high tumor cellular ratio (75% of the volume) which increases the probability of crossfire effect for 177Lu. An inverted ratio would favor the use of 225Ac over 177Lu.
Understanding CAFs spatial distributions across types may help to personalize RPTs in regards to the choice of appropriate radionuclide [1]. As an example, sarcoma and mesothelioma express FAPs on tumor cells [8], and therefore the impact of clustering may be muted. In most tumors, FAP is not expressed on tumor cells [23], and in these cases, consideration of clustering impacts the choice of radionuclide used.
The overall deposited dose (mean Dabs) in the SM models was relatively consistent independent of clustering. This indicates that Dabs discrepancies due to the selection of CAF or tumors as sources, and various Lmean are not discernable when measuring the mean Dabs at the macroscopic scale, as performed in nuclear medicine with SPECT or PET [24]. This is consistent with prior work, which has shown that measuring to the mean Dabs at the organ level may be inaccurate for quantifying biological effects, especially for alpha emitters [25, 26]. For this reason, one must be careful when applying the promising imaging results of FAPI PET to predict subsequent efficacy to FAP-targeted RPT [2].
Our dosimetry results are consistent with the pancreas mouse model (PANC-1), using 177Lu and 225Ac with FAPI-46 [13]. The authors observed that 177Lu effects were marginally superior to 225Ac. It was assumed that these effects were due to a better Dabs homogeneity throughout the tumor mass, whereas 225Ac irradiation were locally limited. These observations are consistent with a Lmean greater than 100 µm although these measures were not reported [13].
Limitations of this study are primarily the lack of in vitro correlates to our modeling. Additionally, further studies on the spatial distribution of CAFs and tumor cells are required to better elucidate clustering in vivo, and to better understand the relative benefit of alpha or beta emitters. This work could also be extended to comparison of 90Y against 177Lu (particularly when Lmean might exceed 500 µm), motivated by the interesting results of a 90Y-FAPI-46 feasibility study [8]. Additionally, tumor mass radius greater than 3 mm, various tumor-to-CAF ratios or heterogeneous uptake distributions could be considered in our model, as CAFs and associated fibrosis can hamper the accessibility of RPTs within the tumoral mass [1].
In order to focus on the radiation properties of the isotopes, the complex biological reality was simplified. For example, CAFs and tumor cells were modeled as cubes and the entire SM volume was considered as sensitive and used for calculation of absorbed dose. Re-distribution of the parent or the 225Ac daughters were not simulated. Various developments for retaining 225Ac and its daughter radioisotopes are ongoing and might strength this approximation in the future. These techniques include for example the use of containing polymersomes containing nanoparticles, which revealed a 213Bi retention of at least 69% and a much-decreased renal uptake of free 213Bi compared to no retention strategies at all [27, 28].
Also, clearance was not considered, although several authors reported that the tumor retention time were particularly short for FAPI-02 and FAPI-04 [4, 9], which can mitigate the selection of 225Ac and 177Lu, beyond the criterion of Lmean. If biological half-life were modeled, shorter half-life radionuclides would have potential benefit such as 211At. The alternative to shorter half-life radionuclides is to improve the retention of the radioligand as shown in recent promising results for FAPI-21, FAPI-46 [9], and FAP-2286, even if their performance remain lower than 177Lu-PSMA, 177Lu-DOTATOC, or 177Lu-DOTATATE [5].
Another limitation is that this work did not model the difference in labelling rates between 177Lu and 225Ac. Labelling rates for 177Lu are around 20 FAP-ligand molecules per 177Lu atom [29], versus one 225Ac atom per million molecules [4]. This much lower labelling efficiency may result in target saturation, limiting CAF uptake of alpha labeled FAP-radioligands. Additionally, we based our efficacy criterion on the irradiation of the target cells in the spherical mass, ignoring bystander effects. However, DNA damage, cell death, apoptosis and cell transformation occurs even in non-irradiated cells [30].
Finally, this work is based on a spherical model which cannot represent the large heterogeneity of the CAF and tumor existing structures. The 75%/25% tumor-to-CAF ratio is not representative of all tumors but was selected as an example case, supported by the data of the three CAFs immunochemistry. Future work can explore more various tumor-to-CAF ratio, and heterogeneous uptakes which are specific of other pathologies. Furthermore, the blood vessels, immune cells or acellular components were not modeled, for simplification. However, we believe that our results are still informative as the lack of other components does not impact the specific expression of FAP either by CAF or tumor cells.
Conclusion
Our work demonstrated that changes in tumor cell clustering may impact the efficacy of FAP-targeted RPTs, particularly with 225Ac due to the short radiation range. Measured absorbed dose using SPECT or PET will overestimate the relative benefit of alpha particles compared to beta particles when targeting CAFs. The longer radiation range of 177Lu helps mitigate the effect of cluster size. An improved understanding of tumor microenvironment distribution (CAFs and tumor cells) may help to optimize RPTs with respect to the choice of radionuclide (alpha or beta emitting agents) and the source/target combination (tumors and/or CAFs).
Supplementary Information
Additional file 1: Fig. S1. Lmean rank of the five SM models and CAFs immunochemistry. Table S1. Percentage of CAFs and tumors receiving ≥10 % of the maximum Dabs within the SM model of the five models using either tumors and CAFs as sources for 177Lu and 225Ac. Fig. S2. Mean Dabs within the SM model of the five models using either tumors (brown) and CAFs (violet) as sources for 177Lu (dashed) and 225Ac (solid).
Acknowledgements
The authors are grateful to Clovis Oncology for providing images of Cancer-Associated Fibroblasts immunochemistry.
Abbreviations
- Dabs
Absorbed dose
- RPT
Radiopharmaceutical therapy
- CAF
Cancer-associated fibroblast
- DVH
Dose volume histogram
- ER
Efficacy ratio
- FAP
Fibroblast activation protein
- FAPI
Fibroblast activation protein inhibitor
- NSCLC
Non-small cell lung cancer
- L
Distance between each tumor cell and the nearest CAF
- Lmean
Mean distance between each tumor cell and the nearest CAF
- SM
Spherical mass
- ICRP
International Commission on Radiological Protection
- MC
Monte Carlo
- MIRD
Medical Internal Radiation Committee
- GATE
Geant4 Application for Tomographic Emission
- SPECT
Single photon emission computed tomography
- PET
Positron emission tomography
- PSMA
Prostate-specific metastasis antigen
- DOTATOC
DOTA0-D-Phe1-Tyr3-octreotide
Author contributions
JT and TH contributed to the design of the study. JT performed the data analysis, calculations and wrote the manuscript draft. TH, SP and SG were major contributors to the manuscript. The authors read, critically reviewed, and approved the final manuscript. TH and FY supervised the project. All authors read and approved the final manuscript.
Funding
This work was performed under the NIH R01 CA235741 grant, PIs: T.A. Hope/F.Y. Feng.
Availability of data and materials
The datasets used and/or analyzed during the current study are available from the corresponding author on reasonable request.
Declarations
Ethics approval and consent to participate
Not applicable.
Consent for publication
Not applicable.
Competing interests
TH has received an investigator-initiated trial grant from Clovis Oncology. SG is a consultant to RayzeBio and CDE Dosimetry Services.
Footnotes
Publisher's Note
Springer Nature remains neutral with regard to jurisdictional claims in published maps and institutional affiliations.
References
- 1.Chen X, Song E. Turning foes to friends: targeting cancer-associated fibroblasts. Nat Rev Drug Discov. 2019;18:99–115. doi: 10.1038/s41573-018-0004-1. [DOI] [PubMed] [Google Scholar]
- 2.Kratochwil C, Flechsig P, Lindner T, Abderrahim L, Altmann A, Mier W, et al. 68Ga-FAPI PET/CT: tracer uptake in 28 different kinds of cancer. J Nucl Med. 2019;60:801–5. doi: 10.2967/jnumed.119.227967. [DOI] [PMC free article] [PubMed] [Google Scholar]
- 3.Hofheinz RD, Al-Batran SE, Hartmann F, Hartung G, Jäger D, Renner C, et al. Stromal antigen targeting by a humanised monoclonal antibody: an early phase II trial of sibrotuzumab in patients with metastatic colorectal cancer. Onkologie. 2003;26:44–48. doi: 10.1159/000069863. [DOI] [PubMed] [Google Scholar]
- 4.Watabe T, Liu Y, Kaneda-Nakashima K, Shirakami Y, Lindner T, Ooe K, et al. Theranostics targeting fibroblast activation protein in the tumor stroma: 64Cu- and 225Ac-labeled FAPI-04 in pancreatic cancer xenograft mouse models. J Nucl Med. 2020;61:563–9. doi: 10.2967/jnumed.119.233122. [DOI] [PMC free article] [PubMed] [Google Scholar]
- 5.Baum RP, Schuchardt C, Singh A, Chantadisai M, Robiller FC, Zhang J, et al. Feasibility, biodistribution, and preliminary dosimetry in peptide-targeted radionuclide therapy of diverse adenocarcinomas using 177Lu-FAP-2286: first-in-humans results. J Nucl Med. 2022;63(3):415–23. doi: 10.2967/jnumed.120.259192. [DOI] [PMC free article] [PubMed] [Google Scholar]
- 6.Liu R, Li H, Liu L, Yu J, Ren X. Fibroblast activation protein: a potential therapeutic target in cancer. Cancer Biol Ther. 2012;13:123–9. doi: 10.4161/cbt.13.3.18696. [DOI] [PubMed] [Google Scholar]
- 7.Lindner T, Loktev A, Altmann A, Giesel F, Kratochwil C, Debus J, et al. Development of quinoline-based theranostic ligands for the targeting of fibroblast activation protein. J Nucl Med. 2018;59:1415–22. doi: 10.2967/jnumed.118.210443. [DOI] [PubMed] [Google Scholar]
- 8.Ferdinandus J, Costa PF, Kessler L, Weber M, Hirmas N, Kostbade K, et al. Initial clinical experience with 90y-FAPI-46 radioligand therapy for advanced-stage solid tumors: a case series of 9 patients. J Nucl Med. 2022;63(5):727–34. doi: 10.2967/jnumed.121.262468. [DOI] [PMC free article] [PubMed] [Google Scholar]
- 9.Loktev A, Lindner T, Burger EM, Altmann A, Giesel F, Kratochwil C, et al. Development of fibroblast activation protein-targeted radiotracers with improved tumor retention. J Nucl Med. 2019;60:1421–29. doi: 10.2967/jnumed.118.224469. [DOI] [PMC free article] [PubMed] [Google Scholar]
- 10.Loktev A, Lindner T, Mier W, Debus J, Altmann A, Jäger D, et al. A tumor-imaging method targeting cancer-associated fibroblasts. J Nucl Med. 2018;59:1423–29. doi: 10.2967/jnumed.118.210435. [DOI] [PMC free article] [PubMed] [Google Scholar]
- 11.Sgouros G, Bodei L, McDevitt MR, Nedrow JR. Radiopharmaceutical therapy in cancer: clinical advances and challenges. Nat Rev Drug Discov. 2020;19:589–608. doi: 10.1038/s41573-020-0073-9. [DOI] [PMC free article] [PubMed] [Google Scholar]
- 12.Chakiryan NH, Kimmel GJ, Kim Y, Johnson JO, Clark N, Hajiran A, et al. Geospatial cellular distribution of cancer-associated fibroblasts significantly impacts clinical outcomes in metastatic clear cell renal cell carcinoma. Cancers. 2021;13:3743. doi: 10.3390/cancers13153743. [DOI] [PMC free article] [PubMed] [Google Scholar]
- 13.Liu Y, Watabe T, Kaneda-Nakashima K, Shirakami Y, Naka S, Ooe K, et al. Fibroblast activation protein targeted therapy using [177Lu]FAPI-46 compared with [225Ac]FAPI-46 in a pancreatic cancer model. Eur J Nucl Med Mol Imag. 2021 doi: 10.1007/s00259-021-05554-2. [DOI] [PMC free article] [PubMed] [Google Scholar]
- 14.Kikinis R, Pieper SD, Vosburgh KG. 3D slicer: a platform for subject-specific image analysis, visualization, and clinical support. In: Jolesz FA, editor. Intraoperative Imaging Image-Guided Therapy. New York: Springer, New York; 2014. pp. 277–89. [Google Scholar]
- 15.Obenauf AC, Massagué J. Surviving at a distance: organ-specific metastasis. Trends Cancer. 2015;1:76–91. doi: 10.1016/j.trecan.2015.07.009. [DOI] [PMC free article] [PubMed] [Google Scholar]
- 16.ICRP 110. Adult Reference Computational Phantoms. ICRP Publication 110. Ann. ICRP 39 (2). [Internet]. 2009. Available from: https://www.icrp.org/publication.asp?id=icrp publication 110. [DOI] [PubMed]
- 17.Nelson BJ, Andersson JD, Wuest F. Targeted alpha therapy: progress in radionuclide production, radiochemistry, and applications. Pharmaceutics. 2020;13:1–26. doi: 10.3390/pharmaceutics13010049. [DOI] [PMC free article] [PubMed] [Google Scholar]
- 18.Bolch WE, Bouchet LG, Robertson JS, Wessels BW, Siegel JA, Howell RW, et al. MIRD pamphlet no 17: the dosimetry of nonuniform activity distributions—radionuclide S values at the voxel level. J Nucl Med. 1999;40:11S–36S. [PubMed] [Google Scholar]
- 19.Bardiès M, Pihet P. Dosimetry and microdosimetry of targeted radiotherapy. Curr Pharm Des. 2005;6:1469–1502. doi: 10.2174/1381612003399176. [DOI] [PubMed] [Google Scholar]
- 20.Sarrut D, Bardiès M, Boussion N, Freud N, Jan S, Létang JM, et al. A review of the use and potential of the GATE Monte Carlo simulation code for radiation therapy and dosimetry applications. Med Phys. 2014;41:064301. doi: 10.1118/1.4871617. [DOI] [PubMed] [Google Scholar]
- 21.Allison J, Amako K, Apostolakis J, Arce P, Asai M, Aso T, et al. Recent developments in GEANT4. Nucl Instrum Methods Phys Res Sect A Accel Spectrom Detect Assoc Equip. 2016;835:186–225. doi: 10.1016/j.nima.2016.06.125. [DOI] [Google Scholar]
- 22.Bolch WE, Eckerman KF, Sgouros G, Thomas SR. MIRD Pamphlet No. 21: A generalized schema for radiopharmaceutical dosimetry-standardization of nomenclature. J Nucl Med. 2009;50:477–84. doi: 10.2967/jnumed.108.056036. [DOI] [PubMed] [Google Scholar]
- 23.Khreish F, Rosar F, Kratochwil C, Giesel FL, Haberkorn U, Ezziddin S. Positive FAPI-PET/CT in a metastatic castration-resistant prostate cancer patient with PSMA-negative/FDG-positive disease. Eur J Nucl Med Mol Imag. 2020;47:2040–1. doi: 10.1007/s00259-019-04623-x. [DOI] [PubMed] [Google Scholar]
- 24.Dewaraja YK, Frey EC, Sgouros G, Brill AB, Roberson P, Zanzonico PB, et al. MIRD pamphlet No. 23: quantitative SPECT for patient-specific 3-dimensional dosimetry in internal radionuclide therapy. J Nucl Med. 2012;53:1310–25. doi: 10.2967/jnumed.111.100123. [DOI] [PMC free article] [PubMed] [Google Scholar]
- 25.Sgouros G, Roeske JC, McDevitt MR, Palm S, Allen BJ, Fisher DR, et al. MIRD pamphlet No. 22 (Abridged) Radiobiology and dosimetry of α-particle emitters for targeted radionuclide therapy. J Nucl Med. 2010;51:311–28. doi: 10.2967/jnumed.108.058651. [DOI] [PMC free article] [PubMed] [Google Scholar]
- 26.Tranel J, Feng FY, St James S, Hope TA. Effect of microdistribution of alpha and beta-emitters in targeted radionuclide therapies on delivered absorbed dose in a GATE model of bone marrow. Phys Med Biol. 2021;66(3):035016. doi: 10.1088/1361-6560/abd3ef. [DOI] [PMC free article] [PubMed] [Google Scholar]
- 27.de Kruijff RM, Wolterbeek HT, Denkova AG. A critical review of alpha radionuclide therapy-how to deal with recoiling daughters? Pharmaceuticals. 2015;8:321–36. doi: 10.3390/ph8020321. [DOI] [PMC free article] [PubMed] [Google Scholar]
- 28.De Kruijff RM, Raavé R, Kip A, Molkenboer-Kuenen J, Morgenstern A, Bruchertseifer F, et al. The in vivo fate of 225Ac daughter nuclides using polymersomes as a model carrier. Sci Rep. 2019;9:1–13. doi: 10.1038/s41598-019-48298-8. [DOI] [PMC free article] [PubMed] [Google Scholar]
- 29.Baum RP, Schuchardt C, Singh A, Chantadisai M, Robiller FC, Zhang J, et al. Feasibility, biodistribution, and preliminary dosimetry in peptide-targeted radionuclide therapy of diverse adenocarcinomas using 177LU-FAP-2286: first-in-humans results. J Nucl Med. 2022;63:415–23. doi: 10.2967/jnumed.120.259192. [DOI] [PMC free article] [PubMed] [Google Scholar]
- 30.Pouget JP, Lozza C, Deshayes E, Boudousq V, Navarro-Teulon I. Introduction to radiobiology of targeted radionuclide therapy. Front Med. 2015;2:12. doi: 10.3389/fmed.2015.00012. [DOI] [PMC free article] [PubMed] [Google Scholar]
Associated Data
This section collects any data citations, data availability statements, or supplementary materials included in this article.
Supplementary Materials
Additional file 1: Fig. S1. Lmean rank of the five SM models and CAFs immunochemistry. Table S1. Percentage of CAFs and tumors receiving ≥10 % of the maximum Dabs within the SM model of the five models using either tumors and CAFs as sources for 177Lu and 225Ac. Fig. S2. Mean Dabs within the SM model of the five models using either tumors (brown) and CAFs (violet) as sources for 177Lu (dashed) and 225Ac (solid).
Data Availability Statement
The datasets used and/or analyzed during the current study are available from the corresponding author on reasonable request.


