Abstract
Physicians have used palpation as a diagnostic examination to understand the elastic properties of pathology for a long time since they realized that tissue stiffness is closely related to its biological characteristics. US elastography provided new diagnostic information about elasticity comparing with the morphological feathers of traditional US, and thus expanded the scope of the application in clinic. US elastography is now widely used in the field of diagnosis and differential diagnosis of abnormality, evaluating the degree of fibrosis and assessment of treatment response for a range of diseases. The World Federation of Ultrasound Medicine and Biology divided elastographic techniques into strain elastography (SE), transient elastography and acoustic radiation force impulse (ARFI). The ARFI techniques can be further classified into point shear wave elastography (SWE), 2D SWE, and 3D SWE techniques. The SE measures the strain, while the shear wave-based techniques (including TE and ARFI techniques) measure the speed of shear waves in tissues. In this review, we discuss the various techniques separately based on their basic principles, clinical applications in various organs, and advantages and limitations and which might be most appropriate given that the majority of doctors have access to only one kind of machine.
Keywords: ultrasound, elastography, acoustic radiation force impulse, shear wave, strain
INTRODUCTION
Physicians have understood the elastic properties of pathology since the first time they used palpation as a diagnostic examination. They realized that tissue stiffness is closely related to its biological characteristics. In 1991, Ophir Equate first invented a model of ultrasound (US) elastography,[1] overcoming the weakness of subjectivity by manual palpation and gaining the ability to detect deep lesions as well as superficial masses. US elastography provided new diagnostic information about elasticity comparing with the morphological feathers of traditional US, and thus expanded the scope of the application in clinic. US elastography is now widely used in the field of diagnosis and differential diagnosis of abnormality, evaluating the degree of fibrosis and assessment of treatment response for a range of diseases.
Classification
The World Federation of Ultrasound Medicine and Biology divided elastography techniques into three major categories according to their different processes:[2] (i) strain elastography (SE) evaluates tissue deformation by manual compression or physiological motion; (ii) transient elastography (TE) generates a shear wave with an external vibration; and (iii) acoustic radiation force impulse (ARFI) is a method that uses acoustic radiation force to produce shear waves. The ARFI techniques can be further classified into point shear wave elastography (p-SWE), 2D shear wave elastography (2D SWE), and 3D shear wave elastography (3D SWE) techniques. The SE measures the strain, while the shear wave-based techniques (including TE and ARFI techniques) measure the speed of shear waves in tissues [Table 1].
Table 1.
Classification of ultrasound elastography
| Techniques | Measurements | Excitation | Methods | Indicators | Company | System |
|---|---|---|---|---|---|---|
| Strain imaging | Strain or displacement | Manual compression | Stain elastography | Elasticity score Strain ratio E/B size ratio |
Esaote Hitachi Aloka GE Philips Toshiba Ultrasonix Mindray Samsung Siemens |
ElaXto™ Real-time tissue elastography™ Elastography ElastoScan™ eSieTouch™ Elasticity imaging |
| Shear wave imaging | Shear wave speed | Mechanical vibration ARFI | Transient elastography p-SWE 2D SWE 3D SWE |
Young’s modulus (kPa) Shear wave speed (m/s) Young’s modulus (kPa) Shear wave speed (m/s) Young’s modulus (kPa) Shear wave speed (m/s) Young’s modulus (kPa) SuperSonic Imagine |
Echosens Siemens Philips Siemens SuperSonic Imagine |
FibroScan™ VTQ ElastPQ™ VTIQ SWE™ SWE™ |
VTQ: Virtual Touch™ quantification; VTIQ: Virtual Touch™ image quantification; SWE: ShearWave™ elastography; ARFI: Acoustic radiation force impulse; p-SWE: Point-SWE
The first commercial equipment for elastography was released in 2003 and has developed rapidly over the last 20 years. Today, most manufacturers offer an elastographic option either strain or shear wave-based approaches. Therefore, we discuss the various techniques separately based on their basic principles, clinical applications, and advantages and limitations and which might be most appropriate given that the majority of doctors have access to only one kind of machine.
STRAIN IMAGING
Strain imaging was the earliest commercially available US elastography, initially designed for the diagnosis of breast cancers using manual compression. As the pressure is applied on the body surface by hand, the deep organs such as the liver can hardly be detected. Hitachi invented a new method that exploited either cardiovascular pulsation or respiration to produce a deformation.
Basic principles
When an operator applies pressure to a tissue with a probe in the direction of US beam propagation, a tissue deformation is induced. The strain (the deformation rate) can be obtained by comparing the echo signal before and after compression. The tissue stiffness is expressed as Young's modulus (E), which is calculated using the formula (E = s/ε) after applying stress s and measuring strain ε.[3] As the stress distribution in body is hard to know, it is assumed to be uniform. As a result, strain is negatively related with stiffness. The strain image is overlaid as a color scale (usually with red being soft and blue being hard) on the B-mode image. Gray-coded and other color-coded elastograms can also be seen in different ultrasonic equipment [Figure 1]. A quality indicator is displayed in real time as a reminder whether the degree of compression is appropriate. As discussed above, strain is a relative index of stiffness and changes proportionately with the intensity of compression. Therefore, one cannot make direct comparisons between cases. Some indicators have been proposed to solve this problem:[4] (i) elasticity score, details shown in the breast section; (ii) the strain ratio, the strain of mass divided by the strain of the surroundings; (iii) the strain size ratio (EI/B ratio), the ratio of the tumor size in elastogram to that in B-mode image.
Figure 1.
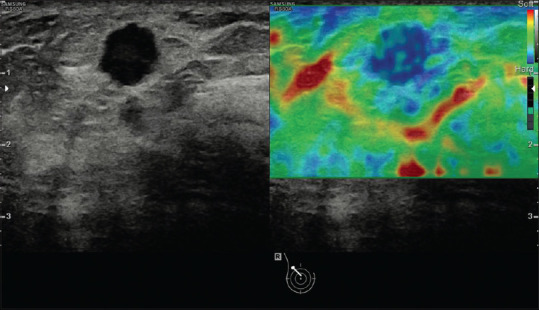
An example of strain image (breast cancer). The strain image is overlaid as a color scale with red being soft and blue being hard on the B-mode image
Clinical applications
Breast
Tips and tricks
To obtain a good elastogram, three tips are necessary.[5] The first one is to obtain an optimal B-mode image before starting to perform elastography, including the breast gland, the surrounding fat, and the lesion. Next, make sure that the probe is perpendicular to the skin. Finally, appropriate compression is applied based on the depth of the target: no or minimal pressure is applied when detecting shallow lesions, while significant vibration is necessary for deep and large lesions. Precompression should be avoided as it changes the primary elastic condition of the target.
Results
SE is widely used as a complimentary technique to B-mode imaging to characterize breast tumors as benign or malignant by using Tsukuba score, EI/B ratio, and Lesion to fat ratio (FLR):[6]
Tsukuba score (elasticity score)
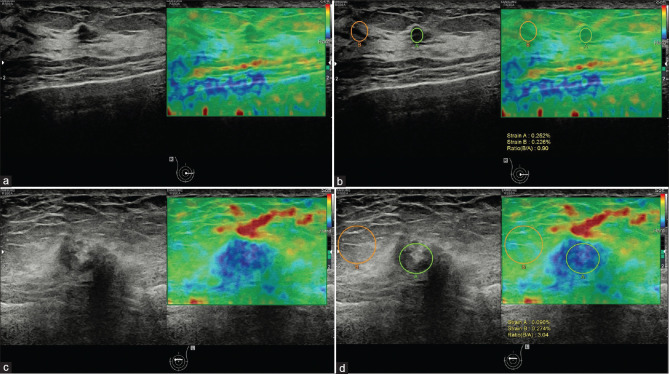
The Tsukuba score is a five-point scale that grades the stiffness of a mass visually based on the size ratio of color: (i) score 1, the lesion is entirely soft; (ii) score 2, the lesion has a mixed pattern; (iii) score 3, the lesion is hard but smaller in the elastogram; (iv) score 4, the lesion is hard but the same size in the elastogram as in the B-mode image; (v) score 5, the lesion is hard and larger in the elastogram [Table 2]. The score 3-5 is considered to indicate a high probability of malignancy with biopsy recommended, while the score 1 or 2 is probably benign [Figure 2]. A prospective study evaluated the value of Tsukuba score for differentiating between benign and malignant breast tumors, showing a sensitivity and a specificity 92.7% and 85.8%, respectively.[7] However, there is an intrinsic limitation that the judgment is subjective and the region of interest (ROI) may not cover the whole tumor and the surrounding tissue if the tumors are large.
Table 2.
Tsukuba scoring system
| Scoring | Figure | Color distribution | Significance |
|---|---|---|---|
| 1 |

|
The entire lesion is evenly shaded green | The strain of the nodule is even. The nodule is entirely soft. It often indicates a benign lesion |
| 2 |

|
The lesion is shaded with a mosaic pattern of green and blue, and the green area is bigger than the blue area | Strain in most areas of the nodule, while few areas with no strain. The nodule is mostly soft. It also indicates a benign lesion |
| 3 |

|
The middle is blue and the periphery is green | The core area of the nodule is stiff and hardly strain, while the peripheral area is still soft and has strain. It indicates a suspicious lesion usually |
| 4 |

|
The entire lesion is all blue | No strain in the nodule, it is entirely rigid. It also indicates a suspicious lesion |
| 5 |

|
Blue area extends from the nodule boundary to the surrounding tissue | No strain in the nodule and the surrounding tissue, both of them are rigid. It also indicates a suspicious lesion |
Figure 2.
A breast mass of a 56-year-old woman which proved to be adenopathy with fibroadenomatous nodules (a and b). The Tsukuba score was 1 (a) and the strain ratio was 0.90 (b). A breast mass of a 72-year-old woman, which proved to be invasive carcinoma (c and d). The Tsukuba score was 4 (c) and the strain ratio was 3.04 (d)
EI/B ratio
EI/B ratio is proposed to discriminate malignant from benign lesions based on the fact that the benign lesions are smaller than the corresponding B-mode image, while malignant masses are larger due to the infiltration of the surrounding areas. A large multicenter research study assessed 635 biopsy-proven lesions using the classification (EI/B ratio <1 as benign and EI/B ratio ≥1 as malignant), reporting a sensitivity of 99% and a specificity of 87%.[8] The EI/B ratio is also found to be significantly positively correlated with the grade of invasive ductal cancers.[9] However, when the strain of the lesion (e.g., fibroadenoma) is similar to the dense breast tissue, the lesion size on elastogram may be overestimated creating a false-positive result.
Lesion to fat ratio
Lesion to fat ratio (LFR) is a kind of strain ratio, the ratio of strain in a mass to that in the surrounding fat at the same depth. The method is suitable for the condition that the size of tumor is larger than the ROI. When faced with the situation that the lesion strain is the same as the background tissue, LFR could solve the problem of EI/B ratio. In a meta-analysis including nine studies of 2087 lesions, a pooled sensitivity of 88% and specificity of 83% were acquired.[10] The strain ratio can also be used in the assessment of nonmass abnormalities, such as intraductal carcinoma in situ. It was found that LFR was also effective for identifying the extent of tumor spread before breast-conserving surgery in Nakashima et al.'s research.[11]
Artifacts
There are some typical artifacts that can help characterize the pathological features, especially for cystic lesions. One is the BGR sign, a characteristic as three layers of blue, green, and red from the shallow to deep areas, which is usually identified in liquids (e.g., ascites, cysts). The other is the “Bull's eye” artifact, usually observed in both the simple and complicated cysts with the equipment of Siemens and Philips. This artifact shows as a black outer ring with a central and posterior bright spot, resulting from the movement of fluid.[3] In one series, the Bull's eye artifact is reported to decrease the number of biopsies. 10% of solid lesions on B-mode were in fact complicated cysts.[12]
Thyroid
Tips and tricks
The tips for thyroid examination are similar to those of breast, except that the deformation can be generated either by manual vibration or by carotid pulsations.[13] The ROI should be as large as possible, covering the nodule and some adjacent thyroid tissue. As a result, a longitudinal scan is recommended for performing transient elastography (TE) with manual compression, while a transverse scan is suggested for the utilization of carotid pulsation.
Results
SE can be used to improve the diagnostic accuracy of thyroid nodules, combined with traditional US,[14] by several semi-quantitative methods.
Tsukuba score
The Tsukuba score system can be also applied for thyroid nodules. In a study of 92 patients, scores 4 and 5 were found to be highly predictive of malignancy (P < 0.0001), with a sensitivity of 97%, specificity of 100%, positive predictive value of 100%, and negative predictive value of 98%.[15] A new four-pattern score system has been created based on the Tsukuba score system:[16] (i) score 1, the nodule is entirely soft; (ii) score 2, the nodule is mostly soft, with some hard areas; (iii) score 3, the nodule is mostly hard, with some soft areas; and (iv) score 4, the nodule is entirely stiff [Table 3]. Scores 1 and 2 are considered as probably benign, whereas scores 3 and 4 are likely to be malignant [Figure 3]. Sensitivity and specificity of this indicator were 94.1% and 81%, respectively.
Table 3.
A new four-pattern score system created based on the Tsukuba score system
| Scoring | Figure | Color distribution | Significance |
|---|---|---|---|
| 1 |

|
The entire lesion is all green | The nodule is entirely soft. It often indicates a benign lesion |
| 2 |

|
The green area in the lesion is larger than that in blue | The nodule is mostly soft. It may be a benign lesion |
| 3 |

|
Almost the whole lesion is displayed in hard blue, only a little of green areas mixed in it | The nodule is mostly rigid. It may be a suspicious lesion |
| 4 |

|
The entire lesion is all blue | The nodule is entirely rigid. It indicates a suspicious lesion usually |
Figure 3.
An example of score 3 thyroid nodule, which is proven as papillary carcinoma; almost the whole lesion is displayed in hard blue (a), the strain ratio is 4.94 (b)
The strain ratio
The strain ratio has been categorized into two types: (i) parenchyma-to-nodule strain ratio (PNSR), the mean strain in the normal thyroid parenchyma divided by the mean strain within the thyroid nodule [Figures 3 and 4], and (ii) muscle-to-nodule strain ratio (MNSR), the mean strain in surrounding muscles divided by the strain in the nodule.[17] There is no significant difference between PNSR and MNSR in the discrimination between benign and malignant lesions, suggesting that, for patients without adjacent normal thyroid tissue, a surrounding muscle can be used for instead.[18] Several studies have assessed the strain ratio, but there remains no consensus regarding the optimal cutoff for differentiating between benign and malignant lesions.[19,20,21,22,23,24,25] Cutoff values ranging from 1.5 to 5.0 have been suggested, with a sensitivity of 81.8%–97.8% and a specificity of 82.9%–85.7%. It has been shown that the SR has a lower interobserver variability and a shorter learning curve than scoring systems.[13]
Figure 4.
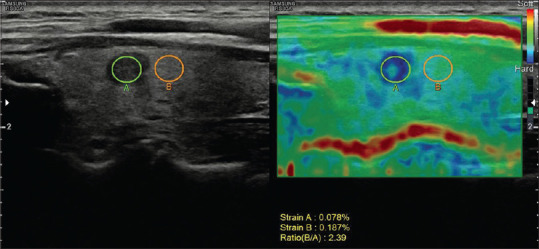
A 44-year-old female patient with a papillary microcarcinoma in the left thyroid gland. The strain ratio was 2.39
Pathology
It is well documented that most papillary carcinomas are stiff; however, other types of carcinomas may appear soft on elastogram [Figures 5 and 6]. For example, follicular carcinoma reported a 44% false-negative rate.[26] Calcification within a nodule is associated with increased stiffness, irrespective of the underlying pathology, and may lead to unreliable results. Fibrosis inside benign nodules or associated with subacute or Hashimoto thyroiditis may also cause stiffening within nodules[27,28,29] [Figure 7]. Therefore, the SE features are inferior to the conventional ultrasonographic findings in determining whether there is malignancy. If the nodule is suspicious on US, fine needle aspiration should be recommended even if the lesion looks soft on SE.
Figure 5.
Strain elastography with Virtual Touch image showing a papillary carcinoma (a and b) is hard
Figure 6.
Strain elastography with Virtual Touch image showing a nodular goiter (a and b) is soft
Figure 7.
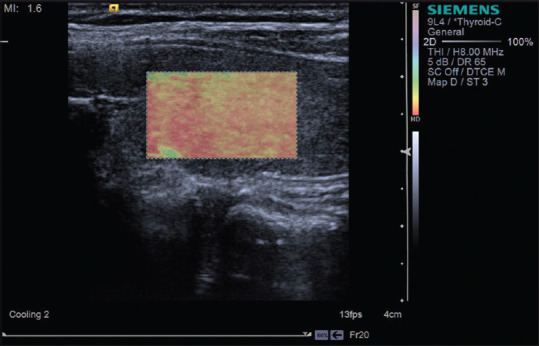
Strain elastography with Virtual Touch image showing Hashimoto thyroiditis is hard
Prostate
Tips and tricks
The prostate is located directly in front of rectum, which enables transrectal US (TRUS) to better visualize the features of lesions than abdominal US. Thus, SE can be conducted after high-quality TRUS with a same transrectal probe. A water-filled balloon can improve the homogeneity of the deformation when placed between the transducer and the rectal wall.[30] The ROI should include the entire prostate gland and the surrounding tissues but exclude the bladder.
Results
Prostate cancer (PCA) has a high incidence rate in men worldwide. Currently, prostate-specific antigen (PSA) screening and systematic biopsy (SB) are the two most frequently used methods for PCA diagnosis, although PSA testing has low specificity and SB has low sensitivity.[31] TRUS has an advantage of high resolution. Nearly 58% of PCAs are multifocal and grow beyond the prostate capsule, appearing as ill-defined nodules in contrast to other malignant tumors. Therefore, it is difficult to detect lesions accurately using traditional US.[32] PCA is generally stiffer than normal prostate tissue and benign tissue; therefore, SE can be used as an effective technique to complement conventional US for the diagnosis of PCA.
Characterization of prostatic lesions
The addition of SE increases the diagnostic performance of PCAs compared with using TRUS alone. There are several methods proposed to interpret the SE images as follows:
Five-point scoring system
A five-point scale has subjectively classified SE images according to degree and distribution of stiffness in relation to simultaneously displayed hypoechoic lesion on US. (i) Score 1: normal appearance (homogeneous relatively soft); (ii) Score 2: probably normal (symmetric heterogeneous mostly soft); (iii) Score 3: indeterminate (focal asymmetric stiff lesion not related to hypoechoic lesion); (iv) Score 4: probably carcinoma (the peripheral part of the lesion is relatively soft and the central part stiff); and (v) Score 5: definitely carcinoma (the entire lesion and the surrounding areas are stiff). This scoring method showed a sensitivity of 68% and a specificity of 81% when using a cutoff value of 3, which is comparable to power Doppler US and superior to B-mode US. The combination of SE with power Doppler US increases the sensitivity to 78%.[33]
Another five-point scoring system
This scale focuses on outer parts of the gland. (i) Score 1: there is no stiff area in the peripheral gland; (ii) Score 2: a small symmetric stiff area in the peripheral gland which is less than 5 mm; (iii) Score 3: a small symmetric stiff area in the peripheral gland which is equal to or more than 5 mm; (iv) Score 4: asymmetric stiff area in the peripheral gland which is equal to or more than 5 mm; (v) Score 5: asymmetric stiff area larger than 50% of a single peripheral gland. The sensitivity and specificity of this scoring system are 68.6% and 69.4% respectively, with a cutoff value of 3.[34]
Strain ratio index
This method compares the stiffness of a lesion with that of normal prostate tissue. The peak strain ratio index refers to the strain of background tissue divided by the strain of the stiffest area in the target lesion, which is more useful to reduce the false-positive rate. Zhang et al. reported that a cutoff value of 17.4 yielded a highest sensitivity (74.5%) and specificity (83.3%) in differentiating between benign and malignant lesions.[35]
Guiding prostate biopsy
SB is considered as the standard technique for PCA detection. However, 20%–30% of clinically significant PCAs are missed in one biopsy; on the other hand, many insignificant PCAs are detected, resulting in an over-treatment rate from 27% to 56%.[36] Aigner et al. compared SE-targeted biopsy with SB, reporting that their PCA detection rate per patient was comparable, but the detection rate of SE-targeted per core was 2.9–4.7-fold higher than that of SB;[37] SE-targeted sampling was also found to have the advantage of detecting high-risk PCA.[38,39,40,41] This makes it attractive for patients who wish to reduce the number of cores as much as possible without increasing the risk of missing significant PCA. However, currently, SE-targeted biopsy is recommended to be used in combination with SB, as a high percentage of PCAs are missed when SE-targeted sampling is used alone.[42,43,44] As a result, more research regarding the method to be useful to improve the success rate of biopsy is needed.
Staging of prostate cancer
The Gleason score is one of the most frequently used histological grading systems and is closely related to the prognosis of PCA.[45] The elastic modulus seems much greater in PCA with a Gleason score ≥7,[46] and this may be explained by the higher cell density of high-grade tumors, leading to stiffer tissue. A pericapsular “soft rim” is often seen on SE, corresponding to the capsule of the prostate; its absence may indicate extracapsular extension (ECE).[47,48] Pelzer reported a sensitivity of 79% and a specificity of 89% for the prediction of ECE with the sign of disrupted soft rim, which improved the staging ability compared with TRUS alone.
Liver
Tips and tricks
SE measures the strain response of tissue to stress usually generated by manual compression or cardiovascular pulsation. The reason why the strain response can reflect the tissue stiffness is that soft tissue can be more easily compressed than hard tissue. On US, the strain of the tissue is shown as a color map overlaid to the gray scale image. Both qualitative and semi-quantitative methods have been developed to evaluate the tissue stiffness. Qualitative technique evaluates the color pattern within a ROI, while semi-quantitative method is performed either with strain ratio which measures the relative strain between two areas inside a ROI or with strain histogram which computes the strain values of elemental areas inside a ROI.[49,50]
Results
SE is less well defined than other elastic techniques in the field of liver fibrosis. There is a lack of standardization in the assessment of liver fibrosis using SE, as experience is limited. In a meta-analysis of 15 studies with 1626 patients, SE was found to have a reasonable performance with the sensitivities for significant fibrosis (F ≥2), severe fibrosis (F ≥3), and cirrhosis (F4) as 79%, 82%, and 74%, respectively, and specificities as 76%, 81%, and 84%, respectively[51] [Figure 8]. However, the authors noted that the sensitivity and specificity might have been overestimated because there were signs of bias. In a study that compared p-SWE and transient elastography, there was no significant difference between the three techniques for the diagnosis of cirrhosis, but p-SWE and transient elastography performed better than SE in diagnosing significant fibrosis.[52] A small study revealed that the combined use of strain and shear wave imaging with a single machine might increase accuracy in the diagnosis of liver fibrosis.[53,54] Another study demonstrated that the combination of SE and serum fibrosis tests gives a better diagnostic performance than either of them applied alone.[55]
Figure 8.
Strain elastography with Virtual Touch image showing liver cirrhosis (F4) (a and b) is hard
Pancreas
Tips and tricks
The elastographic properties of the pancreas could be studied with SE through either transabdominal or endoscopic approach. EUS is a minimally invasive technique with high resolution, which is widely used in the assessment of small pancreatic lesions (SPLs).
Results
SE allows better visualization and semi-quantification of focal pancreatic lesions; a soft SPL is typically benign whereas a harder SPL in healthy pancreatic parenchyma can be malignant or benign. A multicenter study evaluated 218 small SPLs (≤15 mm) with endoscopic SE using histological pathology as a gold standard, reporting a high level of certainty of ruling out malignancy if the lesion is displayed as soft; however, the results would be less reliable in larger SPLs due to the heterogeneity of the lesions and the concomitant changes of the surrounding pancreatic parenchyma.[56] Another prospective multicenter research indicated that the best diagnostic performance of the focal pancreatic masses was obtained with an initial use of endoscopic SE and followed by contrast-enhanced EUS.[57] However, it remains difficult for endoscopic SE to decisively differentiate focal chronic pancreatitis from pancreatic ductal adenocarcinoma (PDAC), since they share a similar stiffness.[58]
SE may be used as a complimentary imaging technique for the diagnosis and staging chronic pancreatitis. A study reveals a positive correlation between a higher strain ratio (SR) value and insufficient pancreatic exocrine.[59] SE has a unique advantage in diagnosing autoimmune pancreatitis, with a specific appearance of diffuse stiff pattern both in the lesion and the surrounding tissue, since the entire gland shows stiffer properties earlier than B-mode changes occur.[60]
Others
SE has also been reported to be used in the field of gastrointestinal tract, lymph nodes, vascular, and musculoskeletal.
Gastrointestinal tract
SE is applied to assess the stiffness of the thickened bowl wall associated with inflammation or neoplasm. It is recommended to use a transducer with frequency above 7.5 MHz to better visualize the wall layers. SE can help distinguish whether a stenosis in Crohn's disease (CD) is caused by inflammation or fibrosis, which is relevant with regard to prognosis and choice of treatment, since fibrotic stenoses appear stiffer than inflammatory stenoses.[61,62] Furthermore, patients with active CD have a higher strain ratio between the inflammatory and normal segments than patients in remission.[63] A recent prospective study of 30 patients revealed that SE may predict the treatment response by using SR, reporting a significant negative relationship between the SR at baseline and wall thickness after 52 weeks of anti-tumor necrosis factor therapy.[64]
Lymph nodes
Accurate distinction between benign and malignant lymph nodes is important for predicting prognosis and making a treatment plan. Superficial and mediastinal lymph nodes can be assessed with transcutaneous and endoscopic SE, respectively. A meta-analysis including 936 superficial lymph nodes of 578 patients yielded a sensitivity of 76% using a scoring system and 83% by SR.[65] However, it should be noted that not all malignant lymph nodes are stiff as is the case of lymphoma[66] [Figures 9-11]. Therefore, SE is more suitable as a complimentary method for differential diagnosis, especially in identifying the most suspicious lymph nodes for needle aspiration.[67]
Figure 9.

Strain elastography revealed a metastatic lymph node in the neck with the Tsukuba score of 3 (a); inguinal metastatic lymph nodes with the Tsukuba score of 4 (b)
Figure 11.
Non-Hodgkin's lymphoma is not so hard on strain elastography with Virtual Touch image (a) and shear wave elastography with Virtual Touch quantification (b) and Virtual Touch tissue quantification (c)
Figure 10.
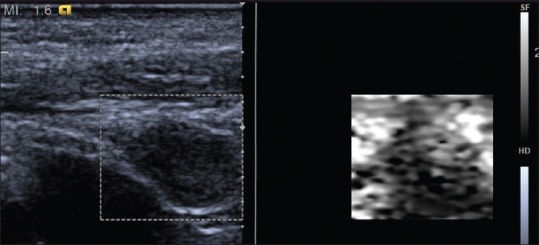
The neck lymph node metastasis appeared to be hard on strain elastography with Virtual Touch image
Vascular
It is well established that atherosclerosis is associated with increased arterial wall stiffness,[68] and elastography biomarkers are emerging as potential indicators to characterize vulnerable plaque, which indicate a high risk for diseases such as stroke and cardiovascular disease.[69] Evidence from animal and human studies[70,71,72] demonstrated that vulnerable plaque is less stiff than the stable plaque. A systematic review demonstrated that SE is a feasible aid to differentiate acute from chronic deep vein thrombosis, providing additional information for clinical decision-making.[73]
Musculoskeletal
The musculoskeletal elastography is an area of active research, especially for tendons, muscles, and nerves.
Tendons
The healthy Achilles tendon is rigid and there is an increase with age,[74] while the tendon becomes less stiff in Achilles tendinopathy, with a higher strain ratio of tendon to Kager's fat.[75] Furthermore, SE can detect the pathology before the emergence of morphologic changes, which is superior to B-mode US.[76]
Muscles
The normal relaxed muscle appears heterogeneous, has intermediate stiffness, and becomes stiffer when contracted; a lot of physiological (age, sex, fatigue, and training) and pathological (trauma, degeneration, and neuromuscular disease) factors have an influence on muscle elasticity. Song et al. reported that the stiffer muscles displayed on SE significantly correlate with histological findings in inflammatory myopathies.[77]
Nerves
SE can be used in the evaluation of median nerve in carpal tunnel syndrome, where it is much stiffer than in healthy volunteers.[78] The increased stiffness is because of nerve edema or fibrosis. Combined with B-mode US, SE can be used to follow up the recovery of the median nerve after local corticosteroid injection guided by US or carpal tunnel release.[79]
Advantage and limitations
Strain imaging has the advantages of a short learning curve and wide application across almost the whole body. However, some disadvantages remain. The biggest limitation is that it is a nonquantitative technique and does not directly measure tissue elasticity but rather identify elasticity relative to adjacent regions. In addition, due to the attenuation of vibration energy during propagation, a decrease of accuracy is occurred in deeper regions compared with superficial ones.
SHEAR WAVE-BASED ELASTOGRAPHY
Shear wave-based elastography is a method of exciting the tissue to generate shear waves and to measure shear wave speeds (SWSs). Based on the formula of Young's model: E = 3 ρ Cs2, where E is the Young's modulus, ρ is the tissue density, and Cs is the shear wave velocity, the tissue stiffness can be reported as the Young's modulus or the shear wave velocity using various commercially available systems.[3] Shear wave-based elastography can be further grouped into transient elastography and ARFI techniques according to the excitation method, as described below.
Transient elastography
Transient elastography (TE) was the first shear wave technique applied in clinical practice, with the system called FibroScan™ (Echosens, Paris, France). The equipment does not have a traditional US probe nor does it display B-mode images. It is currently only applied to the liver, mainly to evaluate the liver stiffness measurements (LSMs) of patients with chronic viral hepatitis and some other diseases.
Basic principle
A mechanical piston is integrated with the ultrasonic transducer, which can induce a thrust to the body surface under the control of a manual operation. The thrust acts on the liver through the intercostal space, causing transient shear deformation and traveling shear waves. The stiffer the liver parenchyma, the faster the shear wave propagates. Pulse-echo US acquisition is used to track the resulting shear waves and to measure SWSs. The Fibroscan™ displays the corresponding Young's modulus computed based on the SWS.
Clinical applications
A variety of etiological factors, e.g., viral hepatitis, alcoholic and nonalcoholic fatty liver disease, autoimmune hepatitis and primary biliary cholangitis, and drug-induced liver injury, may contribute to liver fibrosis. Diagnosing liver fibrosis accurately is an important role for staging disease, predicting prognosis and assessing treatment response. Liver biopsy has been considered as the gold standard for grading liver fibrosis, but several disadvantages are obvious: it is invasive, inevitably associated with rare but serious complications, and it can only sample a small portion of the liver parenchyma, making it susceptible to sampling variation.[80] To overcome these problems, noninvasive methods have been studied over decades for the assessment of liver stiffness (LS). So far, there are three main techniques established in the clinical practice: (i) serum marker of liver fibrosis, (ii) magnetic resonance elastography (MRE), and (iii) US elastography. Different methods have their own advantages and limitations: the serum maker of fibrosis is highly reproducible but has low specificity, while MRE has the potential to evaluate almost the entire liver at the same time, however is time and cost-consuming. Furthermore, US elastography is most widely used as it yields a best tradeoff between accurate results and simple operation. Shear wave elastography (SWE) is more commonly used for evaluating hepatic fibrosis compared with SE in clinical practice, with TE as a starter.
Tips and tricks
For patients
Patients should fast for at least 4 h before examination, as ingestion of food increases blood flow to the liver, increasing its stiffness.[81] Ingestion of food can only increase the LS; therefore, if patients eat and their stiffness values are normal, they are suggestive of no or mild fibrosis. Examinations should be performed with the patient in the supine position with the right arm raised above the head to expand the intercostal space. The patient is instructed to take a short breath hold in the mid-respiratory position (avoiding breath hold in deep inspiration) at the time of measurement.
Technique
The TE measurement is taken 1.5–2 cm below the right lobe of the liver capsule to avoid reverberation artifact via the intercostal space. The probe covered with coupling gel is placed perpendicular to the liver capsule. Once the ROI is fixed, the operator manually presses the button to start an acquisition. The software determines automatically whether each measurement is successful or not and controls choice between M and XL probe according to the distance between skin and liver capsule. LS is measured in kPa, ranging from 2.5 to 75 kPa. Ten measurements should be obtained from the same sites with the median value reported. The quality assessment of TE results depends on two important parameters:[82] (i) success rate (the ratio of the number of successful measurements to the total number of measurements) ≥60%; (ii) the interquartile range (IQR) reflecting the variability of measured values is less than 30% of the median measurements.
Results
Assessing fibrosis
TE is used as an alternative to liver biopsy for assessing hepatic fibrosis mainly in viral hepatitis or HIV co-infection. Based on METAVIR scoring system for chronic liver diseases, the degree of liver fibrosis can be classified into five histological stages: (i) F0, no evidence of fibrosis; (ii) F1, mild fibrosis, no formation of septum; F2, significant fibrosis with few of septum; F3, severe fibrosis with lots of septum; and F4, cirrhosis. LS correlates strongly with the METAVIR scoring system. A meta-analysis that included 50 studies utilizes the area under the receiver operator characteristic (AUROC) curve to estimate the performance of transient elastography for the staging of liver fibrosis:[83] the mean AUROC for the diagnosis of significant fibrosis (F ≥2), severe fibrosis (F ≥3), and cirrhosis (F4) was 0.84, 0.89, and 0.94, with a cutoff of 7.0, 9.5, and 12.5, respectively. A better diagnostic performance of TE was reported for lower fibrosis degrees. However, there is a substantial overlap in LS between adjacent stages of hepatic fibrosis,[84] thus making differentiation between F0 and F1 or between F1 and F2 difficult. The LS also depends on the underlying etiology. Optimal cutoff values for diagnosing cirrhosis appear to be lower for patients with chronic hepatitis B virus (HBV) than for patients with hepatitis C virus (HCV). Studies in patients with chronic HCV report optimal cutoff values of 11–14 kPa for cirrhosis.[80,85,86] In patients with chronic HBV, the cutoff values for diagnosing cirrhosis are between 9.0 and 10 kPa, based on the studies performed primarily in Asian populations.[87,88] Autoimmune hepatitis tends to have much higher LSMs compared with HBV and HCV, due to the concomitant inflammatory activity, which can increase LS. Other liver diseases need to be further investigated to gain sufficient evidence.
Predicting complications
In patients with cirrhosis, LSMs obtained with TE are able to predict liver-related complications as confirmed in a meta-analysis;[89] the higher the LSM, the greater the risk of clinical complications. LSM is significantly and positively correlated with the hepatic venous pressure gradient (HVPG, gold standard for portal hypertension in cirrhosis), with a correlation coefficient of 0.55–0.86.[90] LSM accurately discriminates between patients with and without clinically significant portal hypertension (CSPH, defined as HVPG ≥10 mmHg, threshold for the appearance of complications); the summary AUROC is 0.93 with a cutoff >20–25 kPa according to a meta-analysis.[91] High LSM values are also significantly associated with the presence and size of gastroesophageal varices, with summary AUROCs of 0.78–0.84.[90] Platelet count and spleen size significantly improve the prediction of varices, obtained by LSM alone.[92] It has been reported that compensated patients with values of LSM <25 kPa and normal platelet counts (>110 g/l) bear a very low risk of varices requiring treatment, which can eliminate unnecessary endoscopies.[93] Spleen stiffness measurement (SSM) has been proposed as an additional parameter, potentially better correlating with portal pressure, irrespective of its cause. One study found that SSM cutoff values of 3.36 and 3.51 m/s identified patients with esophageal varices and high-risk esophageal varices, respectively.[80] Recent studies using TE found that LS was more accurate than spleen stiffness (SS) for the diagnosis of CSPH (AUROCs of 0.95 vs. 0.85).[94]
Monitoring treatment
The decision to start antiviral therapy can, in most cases, be made based on serum alanine aminotransferase (ALT) and HBV DNA levels, as well as noninvasive tests of fibrosis.[95] During antiviral treatment, LS usually decreases associated with the normalization of ALT, reflecting suppression of hepatic inflammation, even when there is no improvement in histologic fibrosis.[96] However, although long-term treatment can reverse histological cirrhosis,[97] the risk of hepatocellular carcinoma and portal hypertension after sustained virologic response is much lower than untreated persons but still higher than those who never had cirrhosis.[98] The screening strategies should continue despite decreased LS.
Confounding factors
Although fibrosis is the main determinant of LS,[99,100] other factors also influence LS,[80,82,101] often resulting in a false-positive diagnosis of advanced fibrosis or cirrhosis. This is similar across all shear wave techniques as they all measure SWS. First, liver steatosis causes attenuation of ARFI pulse and can lead to more variability in the measurements. Second, elevated ALT levels (>5 times upper limit of normal) resulting from inflammatory causes such as acute hepatitis, acute-on chronic hepatitis, chronic viral hepatitis, and cholestasis are associated with increased hepatic stiffness. In a study of 104 patients with chronic hepatitis B (CHB) and 453 patients with chronic hepatitis C (CHC), histological necroinflammatory activity was found to be an independent risk factor for the overestimation of LSM in HCV and HBV, while histological steatosis was a risk factor in HCV patients only.[102] At last, the increase of central venous pressure leads to more liver perfusion along with the stiffer liver; thus, cardiopulmonary disease should be excluded. In conclusion, clinicians should exercise caution when interpreting the results of LS in such situations, with full knowledge of the patient history, disease etiology, and essential serum parameters.
Evaluating steatosis
An additional function, available on the FibroScan 502 Touch System of TE, allows the measurement of any decrease in US signal of the liver with the controlled attenuation parameter (CAP) tool. The CAP results are related to the amount of fat in the liver and are expressed as decibels per meter (dB/m).[103,104] This can only be successfully displayed when the LSM is valid, because it is derived from the US signals used for acquiring LSM. CAP is a point-of-care, standardized, and reproducible technique, promising for the detection of liver steatosis. However, for quantifying steatosis, there is a large overlap between adjacent grades and there is no agreement regarding cutoffs or quality criteria.
Advantages and limitations
Advantages
TE is easy to learn and can be used even in the outpatient clinic or bedside with the results available immediately. In addition, if a standardized protocol is followed, TE has excellent reproducibility with both good intra- and inter-observer agreement. For example, in a study with 200 patients with various liver diseases examined by two operators, reproducibility was high, with intraclass correlation coefficients of 0.98 for inter- and intra-observer agreement; however, interobserver agreement was lower in patients with mild fibrosis, steatosis, or an increased body mass index (>25 kg/m2).[105] Standard M-type probe can detect a cylinder volume of 10 mm wide and 40 mm long, which is approximately 1/500 of the entire liver parenchyma and at least 100 times the sampling volume of a biopsy. Therefore, it was pointed out that compared with liver biopsy, TE results are more representative of the stiffness of liver parenchyma.
Limitations
This technique still has some limitations: first, the absence of gray scale image guidance makes it difficult to avoid large blood vessels, bile ducts, and masses at the site of measurement. Second, TE can only be performed through a few intercostal spaces, and therefore, it is not suitable for the left liver lobe scanning. In addition, TE can only detect to a depth of 2.5–6.5 cm below the liver capsule with M probe. As a result, insufficient signals may be obtained with obese patients. The XL probe has been developed for overweight patients and the S probe for patients with narrow intercostal spaces, especially for children. However, there remains no solution for patients with ascites around the liver, since shear waves cannot propagate in liquid.
Acoustic radiation force impulse techniques
Basic principle
ARFI techniques differ from TE in the way the mechanical excitation is applied. An acoustic radiation force is used to generate tissue displacement and shear waves via a focused acoustic beam.[3] Shear waves propagate in a direction perpendicular to that of the ultrasonic waves; thus, SWSs are calculated by monitoring the time to peak displacement at each lateral position. B-mode image guidance is possible during the measurement because they share the same transducer. According to the extent of detected area, three subtypes are discussed below.
Point shear wave elastography
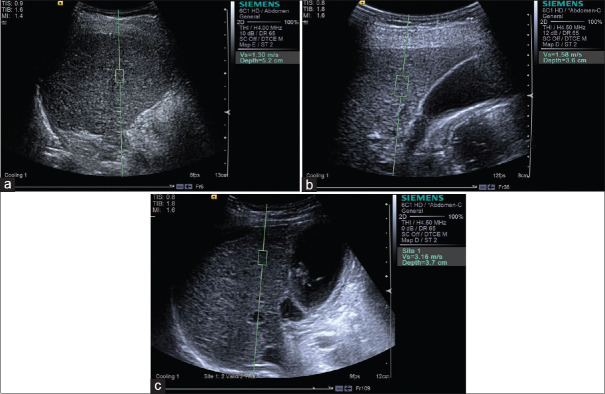
p-SWE only excites the acoustic radiation force at one point and then detects the shear wave velocity in a small ROI. The output is expressed in either m/s or kPa converted by the Young's model formula. Because only a small area is measured in shear wave imaging, it is recommended to take at least 5–10 measurements and take the average value. Currently, there are mainly two systems commercially available in clinical practice: VTQ from Siemens and ELasto-Q from Philips.
2D shear wave elastography (Supersonic, VTIQ)
If the acoustic radiation force is continuously excited at multiple points, and the arrival time of the shear wave is sequentially measured with a time-of-flight estimation technique, a shear wave image of a larger ROI can be obtained and coded with gray or color scale. This kind of shear wave image can be separately displayed or superimposed on the conventional B-US image. A measurement box can be placed within the ROI to get the stiffness value. If possible, the measurement box should be placed near the center of the ROI, as there are often errors at the borders of the ROI. Superior to p-SWE, the measurement box size of 2D-SWE is changeable and 2D-SWE reports both the average and the standard deviation of the stiffness values, as well as the minimum and maximum values. If the system has a quality measure that confirms the area of measurement has high-quality shear waves, three to five measurements are recommended.[106]
3D shear wave elastography
At present, only supersonic imagine has implemented 3D-SWE. Its 3D probe contains a mechanical scanning 2D sensor sequence and has a relatively high-speed calculation capability, which can perform three-dimensional reconstruction of tissue stiffness. 3D SWE is in development, and no recommendations regarding its use can be made at this time.
Clinical applications
Liver
Tips and tricks
The procedures of ARFI-based techniques are similar to those of TE, with an identical transducer with B-mode US. A convex probe is more widely used than a linear probe for liver examinations. In a study on 89 chronic HCV-infected patients, the linear probe gave SWS values higher than those obtained with the convex probe.[107] Due to the attenuation of the ARFI pulse, measurement accuracy decreases significantly below 6 cm from the transducer. A study has evaluated the variability of SWS assessed with a p-SWE technique at various depths using different frequencies. In the liver, the depth with the lowest variability was 4 cm from the skin with a convex probe and 3 cm with a liner probe.[108]
Results
ARFI-based techniques can measure the stiffness of the left lobe as well when the transducer is placed in the epigastric region. Higher values are often noted in the left lobe of the liver, but the accuracy of p-SWE appears to be higher in the right lobe of the liver compared with the left lobe.[50]
Assessing fibrosis
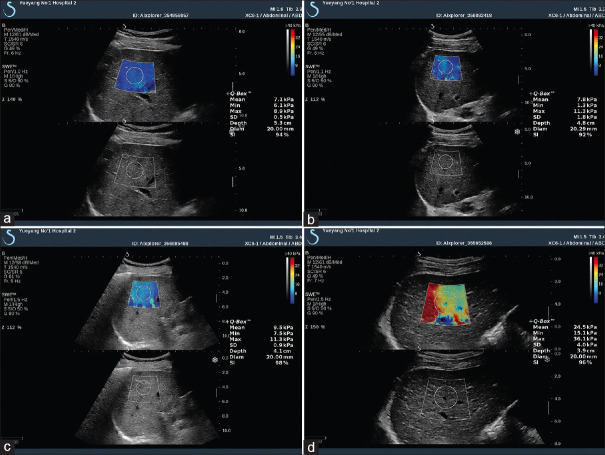
Overall, the ARFI technique has a diagnostic accuracy similar to TE but a lower failure rate, especially among obese patients. A meta-analysis that included nine studies with a total of 518 patients with chronic liver disease evaluated the overall diagnostic performance of p-SWE for staging liver fibrosis.[109] Optimal cutoff value for diagnosing F ≥2 was 1.34 m/s with a sensitivity of 79% and specificity of 85%; F ≥3: 1.55 m/s, sensitivity 86%, specificity 86%; and F4: 1.80 m/s, sensitivity 92%, specificity 86%. Another meta-analysis of 13 studies with 1163 patients with chronic liver disease compared p-SWE with TE, using liver biopsy as the gold standard.[110] It found that p-SWE had a lower failure rate than TE (2.1 vs. 6.6%). The sensitivities of p-SWE and TE were similar for diagnosing significant fibrosis (F ≥2; 74% and 78%, respectively) and cirrhosis (87% and 89%, respectively), as were the specificities (F ≥2: 83% and 84%, respectively; cirrhosis: 87% for both modalities) [Figures 12 and 13]. Another study of 336 patients revealed that the cutoff of 2D SWE for F ≥1–4 was 7.8 kPa (sensitivity 68%, specificity 100%), 8.0 kPa (sensitivity 83%, specificity 82%), 8.9 kPa (sensitivity 90%, specificity 81%), and 10.7 kPa (sensitivity 8.5%, specificity 83%), respectively. The study also compared the accuracy of 2D SWE with p-SWE and TE. The accuracy of 2D SWE was higher than that of TE for diagnosing severe fibrosis (F ≥3) and higher than that of p-SWE for diagnosing significant fibrosis (F ≥2). There were no significant differences among the three techniques for the diagnosis of mild fibrosis or cirrhosis [Figure 14].
Figure 12.
Acoustic radiation force impulse techniques with Virtual Touch quantification for diagnosis F2 (a), F3 (b), F4 (c) in hepatitis B patients
Figure 13.
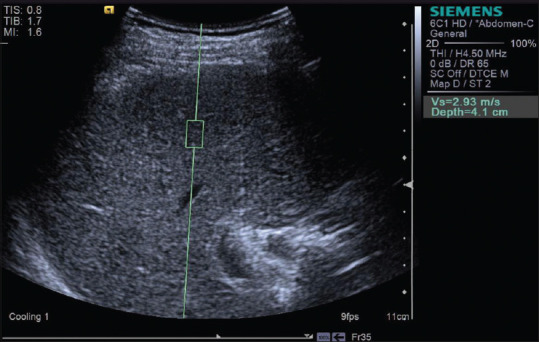
Acoustic radiation force impulse techniques with Virtual Touch quantification showing liver cirrhosis in a patient with alcoholic liver disease
Figure 14.
SWE images of the liver in patients with hepatitis B: F1 – (a) E mean 7.1 kPa; F2 – (b) E mean 7.8 kPa; F3 – (c) E mean 9.5 kPa; F4 – (d) E mean 24.5 kPa
Predicting prognosis
Data regarding LSMs by p-SWE and 2D SWE in this field remain limited. Most data available concern TE. In summary, in the available studies, the applicability and diagnostic accuracy of both techniques closely resemble those of TE (for CSPH p-SWE: AUROC 0.820–0.90; 2D SWE: AUROC 0.80–0.92).[90] Similar considerations apply to the diagnosis of varices.[111,112] Because of the limited evidence to date, noninvasive criteria to rule out varices based on p-SWE or 2D SWE cannot yet be recommended.
Diagnosing focal liver lesions
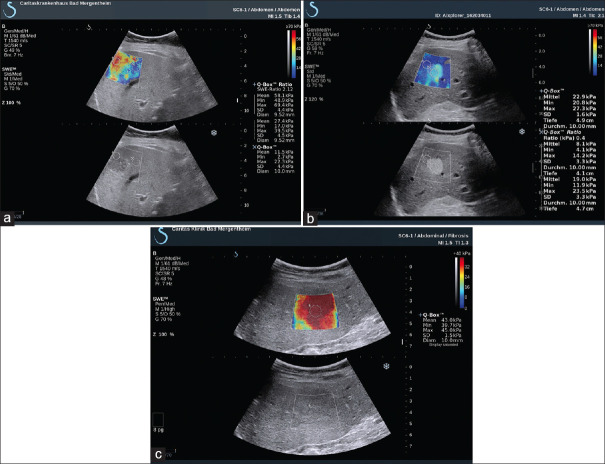
ARFI-based elastography has also been studied for the detection and characterization of focal liver lesions. However, US-based elastography cannot yet reliably differentiate benign from malignant lesions due to the overlap of the values[81] [Figures 15 and 16]. In addition, the limited depth of penetration makes it difficult to detect lesions. As a result, US-based elastography is not yet recommended for the differentiation of benign from malignant liver lesions.
Figure 15.
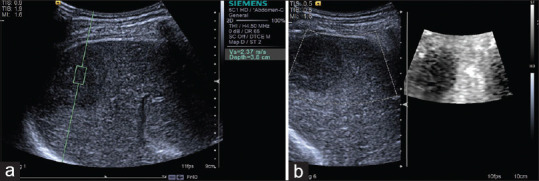
Acoustic radiation force impulse techniques with Virtual Touch quantification (a) and Virtual Touch image (b) showing hepatocellular carcinoma is hard in a patient with hepatocellular carcinoma
Figure 16.
2D SWE showing the lesion is hard in patients with metastasis (a), hemangioma (b), and focal nodular hyperplasia (c)
Breast
Tips and tricks
For 2D SWE, since SWE images are generated based on the raw data from B-mode images, a good gray scale image should be obtained before switching to the SWE mode and get high-quality SWE images.[6] Keeping the angle of the probe perpendicular to the skin is essential because vibration energy is directly emitted from the probe. The probe should lightly touch the skin without any vibration or compression to avoid making the tissue harder which may result in artifactual stiffness.[6,113] Therefore, enough contact jelly should be used. In addition, the patient should hold breath to reduce artifacts.[114] Before recording SWE images and measuring the elasticity of lesions, the probe should be held still for few to several seconds until the color display is completely stable to obtain reliable results.[6] Then, a ROI is placed over the stiffest part of the lesion to quantitatively measure the stiffness of breast lesion, which can be expressed in kPa or m/s, and the elasticity parameters include the mean (E mean), maximum (E max), minimum (E min), and standard deviation (E SD) of elasticity.
Results
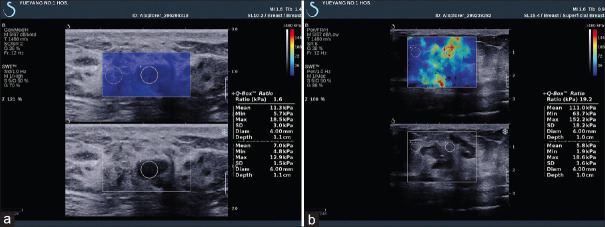
SWE can effectively improve the diagnostic accuracy of BI-RADS classification in B-mode images, as malignant tumors tend to be more heterogeneous and stiffer than benign tumors. A large multicenter trial demonstrated that a sensitivity and specificity was 97.2% and 61.1, respectively, for BI-RADS alone and 98.6% and 78.5% with the addition of SWE using a cutoff of 80 kPa (5.2 m/s). The authors note that a BI-RADS 3 lesion which appears stiff should be upgraded to a 4a lesion, requiring a biopsy or vice versa.[115] Bai et al. found that the lesion is most likely to be malignant when no result is obtained with a solid lesion, with a sensitivity and a specificity of 63.4% and 100%, respectively.[116] The shear waves in these tumors demonstrate significant noise that may be incorrectly interpreted as low SWS by the system. A quality criterion is necessary to evaluate the resulting shear waves, whether they are adequate for an accurate measurement, helping to eliminate possible false-negative cases.[117,118] Triple-negative breast cancer, which is tested negative for estrogen, progesterone, and HER2 receptors, are often misdiagnosed with BI-RADS 3 on B-mode US. These cases are reported to show increased stiffness in ARFI-based techniques and thus correctly assessed in clinical practice[104] [Figure 17]. A study of 396 breast cancers showed that SWE is an independent predictor of lymph node metastasis. With a mean elasticity value of <50 kPa, only 7% of the lymph nodes were positive, whereas 41% of the lymph nodes were positive when the mean elasticity value was >150 kPa.[119] One prospective study of 33 patients revealed that 3D SWE volume measurements correlated well with dynamic contrast-enhanced magnetic resonance imaging volume, and decreased stiffness during treatment was associated with good response.[120] A meta-analysis including 14 studies of 1951 patients with 2060 breast lesions compared the performance of traditional US and the combination of traditional US and 2D SWE or 3D SWE, suggesting a potential benefit of integrating SWE in the routine of breast lesion examination and no significant difference between 2D SWE or 3D SWE[121] [Figure 18].
Figure 17.
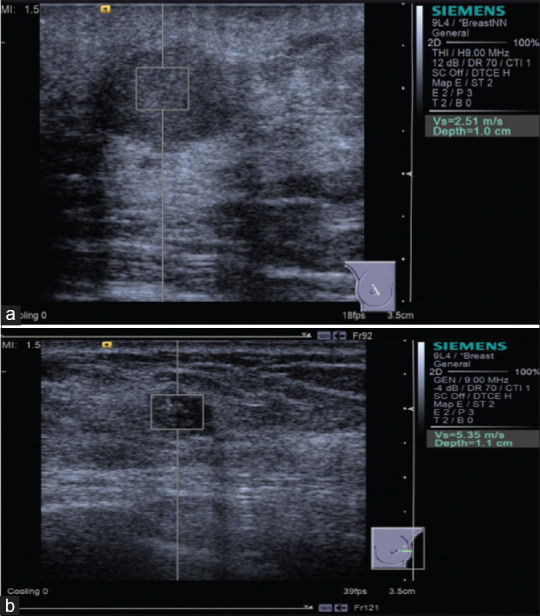
Acoustic radiation force impulse with Virtual Touch quantification shows breast fibroadenoma is softer (a) and breast invasive ductal carcinoma is harder (b)
Figure 18.
2D shear wave elastography shows fibroadenoma nodule is softer (a) and invasive ductal carcinoma is harder (b)
Thyroid
Tips and tricks
The tips for thyroid examination refer to shear wave elastography of breast: a good gray scale image, the probe perpendicular to the skin without additional compression and patient holding breath are three key pointers to get high-quality results.
Results
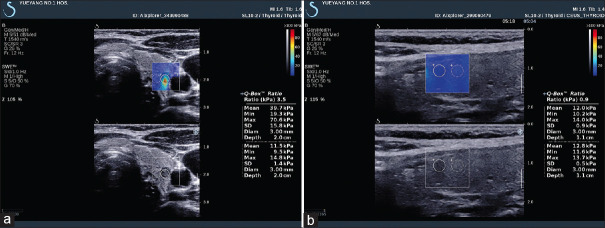
Several meta-analyses showed that SWE (p-SWE and 2D SWE) has high sensitivity (80%–86%) and specificity (84%–90%) for evaluating the stiffness of thyroid nodules and differentiating between malignant and benign nodules with cutoff values (2.4–4.7 m/s), making it a useful complementary method to B-mode US[122,123] [Figure 19]. A prospective research compared the diagnostic performance of TI-RADS classification alone and in association with SE or 2D SWE for thyroid nodule characterization and demonstrated a differential improvement for both techniques, particularly SE performing better than SWE.[124] Where there is coexistence of chronic autoimmune thyroiditis (CAT), ARFI techniques have a better diagnostic performance for thyroid nodules than SE, reporting a higher optimal cutoff value.[125,126] The stiffness of extranodular tissue increased as fibrosis is the main pathological change in CAT, associated with the degree of thyroid function damage. As a result, SWE is also useful for diagnosing CAT and evaluating the fibrosis degree of CAT.[127,128] Zhao et al. prospectively evaluated the diagnostic performance of 3D SWE for characterizing thyroid nodules, reporting that there is no significant difference concerning the diagnostic accuracy compared with 2D SWE, but the specificity was increased[129] [Figure 20]. A recent study including 237 patients with papillary thyroid carcinoma evaluated the clinical usefulness of nomogram based on SWE radiomics, showing a favorite predictive value of cervical lymph node metastasis, especially in the US-reported negative cases.[130]
Figure 19.
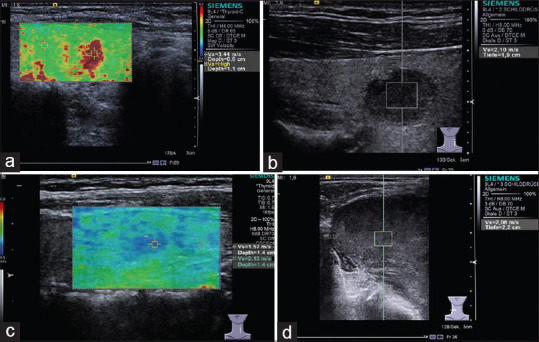
Acoustic radiation force impulse shows papillary carcinoma (a, red area) is harder and adenoma (b and c) is softer, while follicular carcinoma (d) is not so hard as papillary carcinoma
Figure 20.
2D shear wave elastography shows papillary thyroid carcinoma is harder (a) and nodular goiter is softer (b)
Prostate
Tips and tricks
SWE is usually performed on TRUS. Digital rectal examination has shown that the PCA is usually stiffer than normal prostate tissue. SWE is helpful for detecting stiffer areas in the prostate, creating a color map, and quantitatively measuring the stiffness of prostate that facilitates the visualization of abnormal areas. Targeted biopsy facilitated by SWE may potentially reduce the number of necessary biopsy samples and thereby the morbidity and cost compared to multiple blind biopsies.[131] The tips and tricks are similar with SE of the prostate.
Results
SWE is the more recently developed technique, so less literature is available. A study[132] including 184 patients revealed that a stiffness value greater than 35 kPa is suspicious for malignancy with sensitivity and specificity being 97% and 70%, respectively. Another study of 12 patients with suspected PCA was performed with 3D SWE before biopsy in a prospectively study. In the targeted biopsy lesions, the cancer-positive area was significantly stiffer than the cancer-negative area (64.1 kPa vs. 30.8 kPa; P < 0.0001). When combined 3D SWE with Prostate Imaging Reporting and Data System, the diagnostic performance is improved.[133]
Pancreas
Tips and tricks
Nowadays, SWE is mainly performed with transabdominal US.[134] Only few literature from Japan reported SWE of the pancreas conducted by the EUS.[135,136,137]
Results
Data with regard to the role of SWE remain less extensive and convincing currently. Some literature reported a higher SWS in PDAC than the adjacent pancreatic parenchyma with a cutoff value >3 m/s.[138,139,140] A recent study compared the diagnostic performance of EUS-SWE and EUS-SE and demonstrated that EUS-SE was superior to EUS-SWE for the characterization of solid pancreatic lesions, but requiring further investigation.[135]
Others
SWE has also been reported to be used in the field of gastrointestinal tract, lymph nodes, vascular, and musculoskeletal.
Gastrointestinal tract
SWE is reported as a complimentary tool to B-mode endoscopic rectal US (ERUS) to characterize and stage the rectal tumors. A study showed that SWS has a good correlation with the tumor T-stage, largely improving the diagnostic accuracy of tumor staging from 76.7% (ERUS alone) to 93.3%.[141]
Lymph nodes
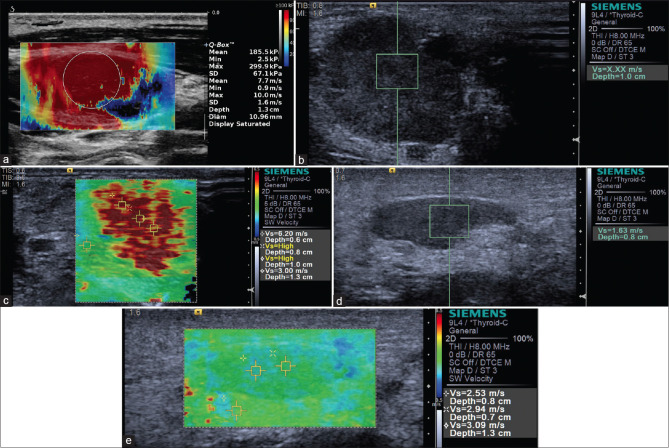
Preoperative assessment of the lymph nodes in patients with known primary cancer can be performed with SWE [Figure 21]. A meta-analysis including 481 patients with 647 lymph nodes evaluated the value of SWE in the distinction of malignant and benign superficial lymph nodes, indicating a sensitivity of 81% and a specificity of 85%.[142] An optimal cutoff of 40 kPa was reported to predict metastatic involvement, with a sensitivity of 80% and a specificity of 93.1%.[143] Another meta-analysis of 18 articles also validated the effectiveness concerning differential diagnosis with ARFI-based techniques; however, caution should be taken in the cases of tuberculosis and lymphoma.[144]
Figure 21.
Metastatic lymph node is shown to be hard on 2D shear wave elastography (a), acoustic radiation force impulse with Virtual Touch quantification (b) and Virtual Touch tissue quantification (c), while inflammatory lymph nodes appear to be soft, which is shown on acoustic radiation force impulse with Virtual Touch quantification (d) and Virtual Touch tissue quantification (e)
Vascular
SWE is helpful to improve the diagnostic performance of carotid plaque vulnerability. It was found that a lower mean Young's modulus indicated vulnerable carotid plaque, despite the values varying among different studies[145,146,147] [Figure 22].
Figure 22.
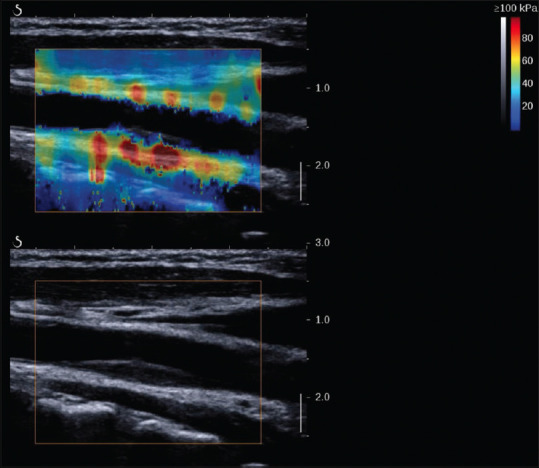
2D shear wave elastography image of a stable plaque in a 55-year-old man
Musculoskeletal
SWE is emerging as a promising supplementary method to electromyography in the clinical application of diagnosis, treatment choice, and follow-up for various neurologic conditions, e.g., Parkinson disease, chronic stroke, and multiple sclerosis.[148,149,150,151,152] Both p-SWE and 2D SWE can be used for the diagnosis of carpal tunnel syndrome with a high sensitivity and specificity.[153] SWE showed a decreased stiffness of tibial nerve in diabetic patients, which reduced further after developing peripheral neuropathy,[154] making it a promising tool for the assessment of diabetic peripheral neuropathy.
Limitations and advantages
Advantages
Unlike TE, ARFI-based techniques can display US images, avoiding blind measurement. In addition, it focuses on the shear wave generated inside the tissue. Therefore, it can be used in patients with ascites when applied to the liver. Furthermore, it is more effective for obese patients, as the penetration of a focused acoustic beam is much higher than that of the mechanical wave generated by vibration.
Limitations
As ARFI-based techniques measure the SWSs as well as the TE does, the limitation of TE is also applied to the ARFI-based techniques. In addition, there exists an inner weakness of ARFI techniques. The SWSs are dependent on ARFI frequency, which is a phenomenon called dispersion: the higher the ARFI frequency, the higher the SWSs. As each system adopts a different ARFI frequency, the effects of dispersion could result in differences of the SWSs obtained with different systems in the same patient. Radiologic Society of North America reported an intersystem variability of commercially available system ranged from 6% to 12%. Therefore, the cutoff value of one system cannot be copied and applied to another system.[155]
CONCLUSION AND FUTURE PERSPECTIVES
Elastography US is a promising additional imaging to traditional US, providing a more accurate evaluation of lesion stiffness than palpation, which can offer valuable information to clinicians. A number of other applications concerning elastography for determining tissue properties, structure, and function are being investigated, and new advanced techniques in the field will continue to grow rapidly in the coming years. Standard methodology is needed for future research to allow better comparison between studies and techniques.
Declaration of patient consent
The authors certify that they have obtained all appropriate patient consent forms. In the form, the patient has given her consent for her images and other clinical information to be reported in the journal. The patient understand that name and initials will not be published and due efforts will be made to conceal identity, but anonymity cannot be guaranteed.
Financial support and sponsorship
Nil.
Conflicts of interest
Christoph F. Dietrich is a Co-Editor-in-Chief of the journal. The article was subject to the journal's standard procedures, with peer review handled independently of this editor and his research groups.
REFERENCES
- 1.Ophir J, Céspedes I, Ponnekanti H, et al. Elastography: A quantitative method for imaging the elasticity of biological tissues. Ultrason Imaging. 1991;13:111–34. doi: 10.1177/016173469101300201. [DOI] [PubMed] [Google Scholar]
- 2.Ferraioli G, Wong VW, Castera L, et al. Liver ultrasound elastography: An update to the World Federation for Ultrasound in Medicine and Biology guidelines and recommendations. Ultrasound Med Biol. 2018;44:2419–40. doi: 10.1016/j.ultrasmedbio.2018.07.008. [DOI] [PubMed] [Google Scholar]
- 3.Shiina T, Nightingale KR, Palmeri ML, et al. WFUMB guidelines and recommendations for clinical use of ultrasound elastography: Part 1: Basic principles and terminology. Ultrasound Med Biol. 2015;41:1126–47. doi: 10.1016/j.ultrasmedbio.2015.03.009. [DOI] [PubMed] [Google Scholar]
- 4.Bamber J, Cosgrove D, Dietrich CF, et al. EFSUMB guidelines and recommendations on the clinical use of ultrasound elastography. Part 1: Basic principles and technology. Ultraschall Med. 2013;34:169–84. doi: 10.1055/s-0033-1335205. [DOI] [PubMed] [Google Scholar]
- 5.Cosgrove D, Piscaglia F, Bamber J, et al. EFSUMB guidelines and recommendations on the clinical use of ultrasound elastography. Part 2: Clinical applications. Ultraschall Med. 2013;34:238–53. doi: 10.1055/s-0033-1335375. [DOI] [PubMed] [Google Scholar]
- 6.Barr RG, Nakashima K, Amy D, et al. WFUMB guidelines and recommendations for clinical use of ultrasound elastography: Part 2: Breast. Ultrasound Med Biol. 2015;41:1148–60. doi: 10.1016/j.ultrasmedbio.2015.03.008. [DOI] [PubMed] [Google Scholar]
- 7.Raza S, Odulate A, Ong EM, et al. Using real-time tissue elastography for breast lesion evaluation: Our initial experience. J Ultrasound Med. 2010;29:551–63. doi: 10.7863/jum.2010.29.4.551. [DOI] [PubMed] [Google Scholar]
- 8.Barr RG, Destounis S, Lackey LB, 2nd, et al. Evaluation of breast lesions using sonographic elasticity imaging: A multicenter trial. J Ultrasound Med. 2012;31:281–7. doi: 10.7863/jum.2012.31.2.281. [DOI] [PubMed] [Google Scholar]
- 9.Grajo JR, Barr RG. Strain elastography for prediction of breast cancer tumor grades. J Ultrasound Med. 2014;33:129–34. doi: 10.7863/ultra.33.1.129. [DOI] [PubMed] [Google Scholar]
- 10.Sadigh G, Carlos RC, Neal CH, et al. Accuracy of quantitative ultrasound elastography for differentiation of malignant and benign breast abnormalities: A meta-analysis. Breast Cancer Res Treat. 2012;134:923–31. doi: 10.1007/s10549-012-2020-x. [DOI] [PubMed] [Google Scholar]
- 11.Nakashima K, Shiina T, Sakurai M, et al. JSUM ultrasound elastography practice guidelines: Breast. J Med Ultrason (2001) 2013;40:359–91. doi: 10.1007/s10396-013-0457-0. [DOI] [PubMed] [Google Scholar]
- 12.Barr RG, Lackey AE. The utility of the “bull's-eye” artifact on breast elasticity imaging in reducing breast lesion biopsy rate. Ultrasound Q. 2011;27:151–5. doi: 10.1097/RUQ.0b013e31822a9c75. [DOI] [PubMed] [Google Scholar]
- 13.Cosgrove D, Barr R, Bojunga J, et al. WFUMB guidelines and recommendations on the clinical use of ultrasound elastography: Part 4.Thyroid. Ultrasound Med Biol. 2017;43:4–26. doi: 10.1016/j.ultrasmedbio.2016.06.022. [DOI] [PubMed] [Google Scholar]
- 14.Moon HG, Jung EJ, Park ST, et al. Role of ultrasonography in predicting malignancy in patients with thyroid nodules. World J Surg. 2007;31:1410–6. doi: 10.1007/s00268-007-9013-7. [DOI] [PubMed] [Google Scholar]
- 15.Rago T, Di Coscio G, Basolo F, et al. Combined clinical, thyroid ultrasound and cytological features help to predict thyroid malignancy in follicular and Hupsilonrthle cell thyroid lesions: Results from a series of 505 consecutive patients. Clin Endocrinol (Oxf) 2007;66:13–20. doi: 10.1111/j.1365-2265.2006.02677.x. [DOI] [PubMed] [Google Scholar]
- 16.Rago T, Vitti P. Role of thyroid ultrasound in the diagnostic evaluation of thyroid nodules. Best Pract Res Clin Endocrinol Metab. 2008;22:913–28. doi: 10.1016/j.beem.2008.09.016. [DOI] [PubMed] [Google Scholar]
- 17.Ciledag N, Arda K, Aribas BK, et al. The utility of ultrasound elastography and MicroPure imaging in the differentiation of benign and malignant thyroid nodules. AJR Am J Roentgenol. 2012;198:W244–9. doi: 10.2214/AJR.11.6763. [DOI] [PubMed] [Google Scholar]
- 18.Aydin R, Elmali M, Polat AV, et al. Comparison of muscle-to-nodule and parenchyma-to-nodule strain ratios in the differentiation of benign and malignant thyroid nodules: Which one should we use? Eur J Radiol. 2014;83:e131–6. doi: 10.1016/j.ejrad.2013.12.003. [DOI] [PubMed] [Google Scholar]
- 19.Cantisani V, Maceroni P, D'Andrea V, et al. Strain ratio ultrasound elastography increases the accuracy of colour-Doppler ultrasound in the evaluation of Thy-3 nodules. A bi-centre university experience. Eur Radiol. 2016;26:1441–9. doi: 10.1007/s00330-015-3956-0. [DOI] [PubMed] [Google Scholar]
- 20.Cantisani V, Ulisse S, Guaitoli E, et al. Q-elastography in the presurgical diagnosis of thyroid nodules with indeterminate cytology. PLoS One. 2012;7:e50725. doi: 10.1371/journal.pone.0050725. [DOI] [PMC free article] [PubMed] [Google Scholar]
- 21.Cantisani V, D'Andrea V, Biancari F, et al. Prospective evaluation of multiparametric ultrasound and quantitative elastosonography in the differential diagnosis of benign and malignant thyroid nodules: Preliminary experience. Eur J Radiol. 2012;81:2678–83. doi: 10.1016/j.ejrad.2011.11.056. [DOI] [PubMed] [Google Scholar]
- 22.Ding J, Cheng H, Ning C, et al. Quantitative measurement for thyroid cancer characterization based on elastography. J Ultrasound Med. 2011;30:1259–66. doi: 10.7863/jum.2011.30.9.1259. [DOI] [PubMed] [Google Scholar]
- 23.Kagoya R, Monobe H, Tojima H. Utility of elastography for differential diagnosis of benign and malignant thyroid nodules. Otolaryngol Head Neck Surg. 2010;143:230–4. doi: 10.1016/j.otohns.2010.04.006. [DOI] [PubMed] [Google Scholar]
- 24.Xing P, Wu L, Zhang C, et al. Differentiation of benign from malignant thyroid lesions: Calculation of the strain ratio on thyroid sonoelastography. J Ultrasound Med. 2011;30:663–9. doi: 10.7863/jum.2011.30.5.663. [DOI] [PubMed] [Google Scholar]
- 25.Ning CP, Jiang SQ, Zhang T, et al. The value of strain ratio in differential diagnosis of thyroid solid nodules. Eur J Radiol. 2012;81:286–91. doi: 10.1016/j.ejrad.2010.12.010. [DOI] [PubMed] [Google Scholar]
- 26.Oliver C, Vaillant-Lombard J, Albarel F, et al. What is the contribution of elastography to thyroid nodules evaluation? Ann Endocrinol. 2011;72:120–4. doi: 10.1016/j.ando.2011.03.016. [DOI] [PubMed] [Google Scholar]
- 27.Cantisani V, Lodise P, Grazhdani H, et al. Ultrasound elastography in the evaluation of thyroid pathology. Current status. Eur J Radiol. 2014;83:420–8. doi: 10.1016/j.ejrad.2013.05.008. [DOI] [PubMed] [Google Scholar]
- 28.Cantisani V, Grazhdani H, Ricci P, et al. Q-elastosonography of solid thyroid nodules: Assessment of diagnostic efficacy and interobserver variability in a large patient cohort. Eur Radiol. 2014;24:143–50. doi: 10.1007/s00330-013-2991-y. [DOI] [PubMed] [Google Scholar]
- 29.Shuzhen C. Comparison analysis between conventional ultrasonography and ultrasound elastography of thyroid nodules. Eur J Radiol. 2012;81:1806–11. doi: 10.1016/j.ejrad.2011.02.070. [DOI] [PubMed] [Google Scholar]
- 30.Hirooka Y, Yamamoto T, Okihara K, et al. Clinical practice guidelines for ultrasound elastography: Prostate. J Med Ultrason. 2016;43:449–55. doi: 10.1007/s10396-016-0703-3. [DOI] [PubMed] [Google Scholar]
- 31.Barr RG, Cosgrove D, Brock M, et al. WFUMB guidelines and recommendations on the clinical use of ultrasound elastography: Part 5.Prostate. Ultrasound Med Biol. 2017;43:27–48. doi: 10.1016/j.ultrasmedbio.2016.06.020. [DOI] [PubMed] [Google Scholar]
- 32.Postema A, Mischi M, de la Rosette J, et al. Multiparametric ultrasound in the detection of prostate cancer: A systematic review. World J Urol. 2015;33:1651–9. doi: 10.1007/s00345-015-1523-6. [DOI] [PMC free article] [PubMed] [Google Scholar]
- 33.Kamoi K, Okihara K, Ochiai A, et al. The utility of transrectal real-time elastography in the diagnosis of prostate cancer. Ultrasound Med Biol. 2008;34:1025–32. doi: 10.1016/j.ultrasmedbio.2007.12.002. [DOI] [PubMed] [Google Scholar]
- 34.Xu G, Feng L, Yao M, et al. A new 5-grading score in the diagnosis of prostate cancer with real-time elastography. Int J Clin Exp Pathol. 2014;7:4128–35. [PMC free article] [PubMed] [Google Scholar]
- 35.Zhang B, Ma X, Zhan W, et al. Real-time elastography in the diagnosis of patients suspected of having prostate cancer: A meta-analysis. Ultrasound Med Biol. 2014;40:1400–7. doi: 10.1016/j.ultrasmedbio.2014.02.020. [DOI] [PubMed] [Google Scholar]
- 36.Kelloff GJ, Choyke P, Coffey DS, et al. Challenges in clinical prostate cancer: Role of imaging. AJR Am J Roentgenol. 2009;192:1455–70. doi: 10.2214/AJR.09.2579. [DOI] [PMC free article] [PubMed] [Google Scholar]
- 37.Aigner F, Pallwein L, Junker D, et al. Value of real-time elastography targeted biopsy for prostate cancer detection in men with prostate specific antigen 1.25 ng/ml or greater and 4.00 ng/ml or less. J Urol. 2010;184:913–7. doi: 10.1016/j.juro.2010.05.026. [DOI] [PubMed] [Google Scholar]
- 38.Brock M, Löppenberg B, Roghmann F, et al. Impact of real-time elastography on magnetic resonance imaging/ultrasound fusion guided biopsy in patients with prior negative prostate biopsies. J Urol. 2015;193:1191–7. doi: 10.1016/j.juro.2014.10.106. [DOI] [PubMed] [Google Scholar]
- 39.Brock M, Roghmann F, Sonntag C, et al. Fusion of magnetic resonance imaging and real-time elastography to visualize prostate cancer: A prospective analysis using whole mount sections after radical prostatectomy. Ultraschall Med. 2015;36:355–61. doi: 10.1055/s-0034-1366563. [DOI] [PubMed] [Google Scholar]
- 40.Giurgiu CR, Manea C, Crişan N, et al. Real-time sonoelastography in the diagnosis of prostate cancer. Med Ultrason. 2011;13:5–9. [PubMed] [Google Scholar]
- 41.Dudea SM, Giurgiu CR, Dumitriu D, et al. Value of ultrasound elastography in the diagnosis and management of prostate carcinoma. Med Ultrason. 2011;13:45–53. [PubMed] [Google Scholar]
- 42.Nygård Y, Haukaas SA, Halvorsen OJ, et al. A positive real-time elastography is an independent marker for detection of high-risk prostate cancers in the primary biopsy setting. BJU Int. 2014;113:E90–7. doi: 10.1111/bju.12401. [DOI] [PubMed] [Google Scholar]
- 43.Salomon G, Drews N, Autier P, et al. Incremental detection rate of prostate cancer by real-time elastography targeted biopsies in combination with a conventional 10-core biopsy in 1024 consecutive patients. BJU Int. 2014;113:548–53. doi: 10.1111/bju.12517. [DOI] [PubMed] [Google Scholar]
- 44.van Hove A, Savoie PH, Maurin C, et al. Comparison of image-guided targeted biopsies versus systematic randomized biopsies in the detection of prostate cancer: A systematic literature review of well-designed studies. World J Urol. 2014;32:847–58. doi: 10.1007/s00345-014-1332-3. [DOI] [PubMed] [Google Scholar]
- 45.Stark JR, Perner S, Stampfer MJ, et al. Gleason score and lethal prostate cancer: Does 3+4=4+3? J Clin Oncol. 2009;27:3459–64. doi: 10.1200/JCO.2008.20.4669. [DOI] [PMC free article] [PubMed] [Google Scholar]
- 46.Ahmad S, Cao R, Varghese T, et al. Transrectal quantitative shear wave elastography in the detection and characterisation of prostate cancer. Surg Endosc. 2013;27:3280–7. doi: 10.1007/s00464-013-2906-7. [DOI] [PubMed] [Google Scholar]
- 47.Pallwein L, Mitterberger M, Struve P, et al. Comparison of sonoelastography guided biopsy with systematic biopsy: Impact on prostate cancer detection. Eur Radiol. 2007;17:2278–85. doi: 10.1007/s00330-007-0606-1. [DOI] [PubMed] [Google Scholar]
- 48.Pallwein L, Mitterberger M, Struve P, et al. Real-time elastography for detecting prostate cancer: Preliminary experience. BJU Int. 2007;100:42–6. doi: 10.1111/j.1464-410X.2007.06851.x. [DOI] [PubMed] [Google Scholar]
- 49.Kan QC, Cui XW, Chang JM, et al. Strain ultrasound elastography for liver diseases. J Hepatol. 2015;63:534. doi: 10.1016/j.jhep.2015.03.038. [DOI] [PubMed] [Google Scholar]
- 50.Cui XW, Friedrich-Rust M, De Molo C, et al. Liver elastography, comments on EFSUMB elastography guidelines 2013. World J Gastroenterol. 2013;19:6329–47. doi: 10.3748/wjg.v19.i38.6329. [DOI] [PMC free article] [PubMed] [Google Scholar]
- 51.Kobayashi K, Nakao H, Nishiyama T, et al. Diagnostic accuracy of real-time tissue elastography for the staging of liver fibrosis: A meta-analysis. Eur Radiol. 2015;25:230–8. doi: 10.1007/s00330-014-3364-x. [DOI] [PubMed] [Google Scholar]
- 52.Colombo S, Buonocore M, Del Poggio A, et al. Head-to-head comparison of transient elastography (TE), real-time tissue elastography (RTE), and acoustic radiation force impulse (ARFI) imaging in the diagnosis of liver fibrosis. J Gastroenterol. 2012;47:461–9. doi: 10.1007/s00535-011-0509-4. [DOI] [PubMed] [Google Scholar]
- 53.Yada N, Tamaki N, Koizumi Y, et al. Diagnosis of fibrosis and activity by a combined use of strain and shear wave imaging in patients with liver disease. Dig Dis. 2017;35:515–20. doi: 10.1159/000480140. [DOI] [PubMed] [Google Scholar]
- 54.Yada N, Sakurai T, Minami T, et al. Influence of liver inflammation on liver stiffness measurement in patients with autoimmune hepatitis evaluation by combinational elastography. Oncology. 2017;92(Suppl 1):10–5. doi: 10.1159/000451011. [DOI] [PubMed] [Google Scholar]
- 55.Yada N, Sakurai T, Minami T, et al. Ultrasound elastography correlates treatment response by antiviral therapy in patients with chronic hepatitis C. Oncology. 2014;87(Suppl 1):118–23. doi: 10.1159/000368155. [DOI] [PubMed] [Google Scholar]
- 56.Ignee A, Jenssen C, Arcidiacono PG, et al. Endoscopic ultrasound elastography of small solid pancreatic lesions: A multicenter study. Endoscopy. 2018;50:1071–9. doi: 10.1055/a-0588-4941. [DOI] [PubMed] [Google Scholar]
- 57.Costache MI, Cazacu IM, Dietrich CF, et al. Clinical impact of strain histogram EUS elastography and contrast-enhanced EUS for the differential diagnosis of focal pancreatic masses: A prospective multicentric study. Endosc Ultrasound. 2020;9:116–21. doi: 10.4103/eus.eus_69_19. [DOI] [PMC free article] [PubMed] [Google Scholar]
- 58.Janssen J, Schlörer E, Greiner L. EUS elastography of the pancreas: Feasibility and pattern description of the normal pancreas, chronic pancreatitis, and focal pancreatic lesions. Gastrointest Endosc. 2007;65:971–8. doi: 10.1016/j.gie.2006.12.057. [DOI] [PubMed] [Google Scholar]
- 59.Dominguez-Muñoz JE, Iglesias-Garcia J, Castiñeira Alvariño M, et al. EUS elastography to predict pancreatic exocrine insufficiency in patients with chronic pancreatitis. Gastrointest Endosc. 2015;81:136–42. doi: 10.1016/j.gie.2014.06.040. [DOI] [PubMed] [Google Scholar]
- 60.Dong Y, D'Onofrio M, Hocke M, et al. Autoimmune pancreatitis: Imaging features. Endosc Ultrasound. 2018;7:196–203. doi: 10.4103/eus.eus_23_17. [DOI] [PMC free article] [PubMed] [Google Scholar]
- 61.Serafin Z, Białecki M, Białecka A, et al. Contrast-enhanced ultrasound for detection of Crohn's disease activity: Systematic review and meta-analysis. J Crohns Colitis. 2016;10:354–62. doi: 10.1093/ecco-jcc/jjv196. [DOI] [PMC free article] [PubMed] [Google Scholar]
- 62.Rimola J, Capozzi N. Differentiation of fibrotic and inflammatory component of Crohn's disease-associated strictures. Intest Res. 2020;18:144–50. doi: 10.5217/ir.2020.00015. [DOI] [PMC free article] [PubMed] [Google Scholar]
- 63.Bettenworth D, Bokemeyer A, Baker M, et al. Assessment of Crohn's disease-associated small bowel strictures and fibrosis on cross-sectional imaging: A systematic review. Gut. 2019;68:1115–26. doi: 10.1136/gutjnl-2018-318081. [DOI] [PMC free article] [PubMed] [Google Scholar]
- 64.Orlando S, Fraquelli M, Coletta M, et al. Ultrasound elasticity imaging predicts therapeutic outcomes of patients with Crohn's disease treated with anti-tumour necrosis factor antibodies. J Crohns Colitis. 2018;12:63–70. doi: 10.1093/ecco-jcc/jjx116. [DOI] [PubMed] [Google Scholar]
- 65.Ghajarzadeh M, Sodagari F, Shakiba M. Diagnostic accuracy of sonoelastography in detecting malignant thyroid nodules: A systematic review and meta-analysis. AJR Am J Roentgenol. 2014;202:W379–89. doi: 10.2214/AJR.12.9785. [DOI] [PubMed] [Google Scholar]
- 66.Łasecki M, Olchowy C, Sokołowska-Dąbek D, et al. Modified sonoelastographic scale score for lymph node assessment in lymphoma – A preliminary report. J Ultrason. 2015;15:45–55. doi: 10.15557/JoU.2015.0004. [DOI] [PMC free article] [PubMed] [Google Scholar]
- 67.Larsen MH, Fristrup C, Hansen TP, et al. Endoscopic ultrasound, endoscopic sonoelastography, and strain ratio evaluation of lymph nodes with histology as gold standard. Endoscopy. 2012;44:759–66. doi: 10.1055/s-0032-1309817. [DOI] [PubMed] [Google Scholar]
- 68.Jung EM, Rennert J, Fellner C, et al. Detection and characterization of endoleaks following endovascular treatment of abdominal aortic aneurysms using contrast harmonic imaging (CHI) with quantitative perfusion analysis (TIC) compared to CT angiography (CTA) Ultraschall Med. 2010;31:564–70. doi: 10.1055/s-0028-1109811. [DOI] [PubMed] [Google Scholar]
- 69.Mahmood B, Ewertsen C, Carlsen J, et al. Ultrasound vascular elastography as a tool for assessing atherosclerotic plaques – A systematic literature review. Ultrasound Int Open. 2016;2:E106–12. doi: 10.1055/s-0042-115564. [DOI] [PMC free article] [PubMed] [Google Scholar]
- 70.Majdouline Y, Ohayon J, Keshavarz-Motamed Z, et al. Endovascular shear strain elastography for the detection and characterization of the severity of atherosclerotic plaques: In vitro validation and in vivo evaluation. Ultrasound Med Biol. 2014;40:890–903. doi: 10.1016/j.ultrasmedbio.2013.12.008. [DOI] [PubMed] [Google Scholar]
- 71.Czernuszewicz TJ, Homeister JW, Caughey MC, et al. Non-invasive in vivo characterization of human carotid plaques with acoustic radiation force impulse ultrasound: Comparison with histology after endarterectomy. Ultrasound Med Biol. 2015;41:685–97. doi: 10.1016/j.ultrasmedbio.2014.09.016. [DOI] [PMC free article] [PubMed] [Google Scholar]
- 72.Meshram NH, Varghese T, Mitchell CC, et al. Quantification of carotid artery plaque stability with multiple region of interest based ultrasound strain indices and relationship with cognition. Phys Med Biol. 2017;62:6341–60. doi: 10.1088/1361-6560/aa781f. [DOI] [PMC free article] [PubMed] [Google Scholar]
- 73.Aslan A, Barutca H, Ayaz E, et al. Is real-time elastography helpful to differentiate acute from subacute deep venous thrombosis? A preliminary study. J Clin Ultrasound. 2018;46:116–21. doi: 10.1002/jcu.22522. [DOI] [PubMed] [Google Scholar]
- 74.Turan A, Teber MA, Yakut ZI, et al. Sonoelastographıc assessment of the age-related changes of the Achilles tendon. Med Ultrason. 2015;17:58–61. doi: 10.11152/mu.2013.2066.171.ayt. [DOI] [PubMed] [Google Scholar]
- 75.Ooi CC, Schneider ME, Malliaras P, et al. Diagnostic performance of axial-strain sonoelastography in confirming clinically diagnosed Achilles tendinopathy: Comparison with B-mode ultrasound and color Doppler imaging. Ultrasound Med Biol. 2015;41:15–25. doi: 10.1016/j.ultrasmedbio.2014.08.019. [DOI] [PubMed] [Google Scholar]
- 76.Klauser AS, Miyamoto H, Tamegger M, et al. Achilles tendon assessed with sonoelastography: Histologic agreement. Radiology. 2013;267:837–42. doi: 10.1148/radiol.13121936. [DOI] [PubMed] [Google Scholar]
- 77.Song Y, Lee S, Yoo DH, et al. Strain sonoelastography of inflammatory myopathies: Comparison with clinical examination, magnetic resonance imaging and pathologic findings. Br J Radiol. 2016;89:20160283. doi: 10.1259/bjr.20160283. [DOI] [PMC free article] [PubMed] [Google Scholar]
- 78.Yoshii Y, Tung WL, Ishii T. Strain and morphological changes of median nerve after carpal tunnel release. J Ultrasound Med. 2017;36:1153–9. doi: 10.7863/ultra.16.06070. [DOI] [PubMed] [Google Scholar]
- 79.Yoshii Y, Tung WL, Ishii T. Measurement of median nerve strain and applied pressure for the diagnosis of Carpal Tunnel syndrome. Ultrasound Med Biol. 2017;43:1205–9. doi: 10.1016/j.ultrasmedbio.2017.02.018. [DOI] [PubMed] [Google Scholar]
- 80.Dietrich CF, Bamber J, Berzigotti A, et al. EFSUMB guidelines and recommendations on the clinical use of liver ultrasound elastography, update 2017 (Long Version) Ultraschall Med. 2017;38:E16–47. doi: 10.1055/s-0043-103952. [DOI] [PubMed] [Google Scholar]
- 81.Barr RG, Ferraioli G, Levine D. Consensus on elastography of the liver response. Radiology. 2016;278:303–4. [PubMed] [Google Scholar]
- 82.Ferraioli G, Filice C, Castera L, et al. WFUMB guidelines and recommendations for clinical use of ultrasound elastography: Part 3: Liver. Ultrasound Med Biol. 2015;41:1161–79. doi: 10.1016/j.ultrasmedbio.2015.03.007. [DOI] [PubMed] [Google Scholar]
- 83.Friedrich-Rust M, Ong MF, Martens S, et al. Performance of transient elastography for the staging of liver fibrosis: A meta-analysis. Gastroenterology. 2008;134:960–74. doi: 10.1053/j.gastro.2008.01.034. [DOI] [PubMed] [Google Scholar]
- 84.Berzigotti A, Ferraioli G, Bota S, et al. Novel ultrasound-based methods to assess liver disease: The game has just begun. Dig Liver Dis. 2018;50:107–12. doi: 10.1016/j.dld.2017.11.019. [DOI] [PubMed] [Google Scholar]
- 85.European Association for the Study of the Liver Electronic address: easloffice@easlofficeeu, European Association for the Study of the Liver. EASL 2017 clinical practice guidelines on the management of hepatitis B virus infection. J Hepatol. 2017;67:370–98. doi: 10.1016/j.jhep.2017.03.021. [DOI] [PubMed] [Google Scholar]
- 86.Ferraioli G, Lissandrin R, Filice C. Real-time tissue elastography in the assessment of liver stiffness. Hepatology. 2013;58:834. doi: 10.1002/hep.26215. [DOI] [PubMed] [Google Scholar]
- 87.European Association for Study of Liver, Asociacion Latinoamericana Para el Estudio del Higado. EASL-ALEH Clinical Practice Guidelines: Non-invasive tests for evaluation of liver disease severity and prognosis. J Hepatol. 2015;63:237–64. doi: 10.1016/j.jhep.2015.04.006. [DOI] [PubMed] [Google Scholar]
- 88.Kim JE, Lee JY, Kim YJ, et al. Acoustic radiation force impulse elastography for chronic liver disease: Comparison with ultrasound-based scores of experienced radiologists, Child-Pugh scores and liver function tests. Ultrasound Med Biol. 2010;36:1637–43. doi: 10.1016/j.ultrasmedbio.2010.07.016. [DOI] [PubMed] [Google Scholar]
- 89.Singh S, Fujii LL, Murad MH, et al. Liver stiffness is associated with risk of decompensation, liver cancer, and death in patients with chronic liver diseases: A systematic review and meta-analysis. Clin Gastroenterol Hepatol. 2013;11:1573–84.e1-2. doi: 10.1016/j.cgh.2013.07.034. [DOI] [PMC free article] [PubMed] [Google Scholar]
- 90.Berzigotti A. Non-invasive evaluation of portal hypertension using ultrasound elastography. J Hepatol. 2017;67:399–411. doi: 10.1016/j.jhep.2017.02.003. [DOI] [PubMed] [Google Scholar]
- 91.You MW, Kim KW, Pyo J, et al. A meta-analysis for the diagnostic performance of transient elastography for clinically significant portal hypertension. Ultrasound Med Biol. 2017;43:59–68. doi: 10.1016/j.ultrasmedbio.2016.07.025. [DOI] [PubMed] [Google Scholar]
- 92.Berzigotti A, Seijo S, Arena U, et al. Elastography, spleen size, and platelet count identify portal hypertension in patients with compensated cirrhosis. Gastroenterology. 2013;144:102–11.e1. doi: 10.1053/j.gastro.2012.10.001. [DOI] [PubMed] [Google Scholar]
- 93.Augustin S, Pons M, Maurice JB, et al. Expanding the Baveno VI criteria for the screening of varices in patients with compensated advanced chronic liver disease. Hepatology. 2017;66:1980–8. doi: 10.1002/hep.29363. [DOI] [PubMed] [Google Scholar]
- 94.Zykus R, Jonaitis L, Petrenkienė V, et al. Liver and spleen transient elastography predicts portal hypertension in patients with chronic liver disease: A prospective cohort study. BMC Gastroenterol. 2015;15:183. doi: 10.1186/s12876-015-0414-z. [DOI] [PMC free article] [PubMed] [Google Scholar]
- 95.Terrault NA, Lok AS, McMahon BJ, et al. Update on prevention, diagnosis, and treatment of chronic hepatitis B: AASLD 2018 hepatitis B guidance. Hepatology. 2018;67:1560–99. doi: 10.1002/hep.29800. [DOI] [PMC free article] [PubMed] [Google Scholar]
- 96.Liang X, Xie Q, Tan D, et al. Interpretation of liver stiffness measurement-based approach for the monitoring of hepatitis B patients with antiviral therapy: A 2-year prospective study. J Viral Hepat. 2018;25:296–305. doi: 10.1111/jvh.12814. [DOI] [PubMed] [Google Scholar]
- 97.Marcellin P, Gane E, Buti M, et al. Regression of cirrhosis during treatment with tenofovir disoproxil fumarate for chronic hepatitis B: A 5-year open-label follow-up study. Lancet. 2013;381:468–75. doi: 10.1016/S0140-6736(12)61425-1. [DOI] [PubMed] [Google Scholar]
- 98.Wong GL, Wong VW, Choi PC, et al. On-treatment monitoring of liver fibrosis with transient elastography in chronic hepatitis B patients. Antivir Ther. 2011;16:165–72. doi: 10.3851/IMP1726. [DOI] [PubMed] [Google Scholar]
- 99.Marginean CO, Marginean C. Elastographic assessment of liver fibrosis in children: A prospective single center experience. Eur J Radiol. 2012;81:e870–4. doi: 10.1016/j.ejrad.2012.04.014. [DOI] [PubMed] [Google Scholar]
- 100.Yoon KT, Lim SM, Park JY, et al. Liver stiffness measurement using acoustic radiation force impulse (ARFI) elastography and effect of necroinflammation. Dig Dis Sci. 2012;57:1682–91. doi: 10.1007/s10620-012-2044-4. [DOI] [PubMed] [Google Scholar]
- 101.Barr RG, Ferraioli G, Palmeri ML, et al. Elastography assessment of liver fibrosis: Society of radiologists in ultrasound consensus conference statement. Radiology. 2015;276:845–61. doi: 10.1148/radiol.2015150619. [DOI] [PubMed] [Google Scholar]
- 102.Fraquelli M, Rigamonti C, Casazza G, et al. Etiology-related determinants of liver stiffness values in chronic viral hepatitis B or C. J Hepatol. 2011;54:621–8. doi: 10.1016/j.jhep.2010.07.017. [DOI] [PubMed] [Google Scholar]
- 103.Newsome PN, Sasso M, Deeks JJ, et al. FibroScan-AST (FAST) score for the non-invasive identification of patients with non-alcoholic steatohepatitis with significant activity and fibrosis: A prospective derivation and global validation study. Lancet Gastroenterol Hepatol. 2020;5:362–73. doi: 10.1016/S2468-1253(19)30383-8. [DOI] [PMC free article] [PubMed] [Google Scholar]
- 104.Eddowes PJ, Sasso M, Allison M, et al. Accuracy of FibroScan controlled attenuation parameter and liver stiffness measurement in assessing steatosis and fibrosis in patients with nonalcoholic fatty liver disease. Gastroenterology. 2019;156:1717–30. doi: 10.1053/j.gastro.2019.01.042. [DOI] [PubMed] [Google Scholar]
- 105.Fraquelli M, Rigamonti C, Casazza G, et al. Reproducibility of transient elastography in the evaluation of liver fibrosis in patients with chronic liver disease. Gut. 2007;56:968–73. doi: 10.1136/gut.2006.111302. [DOI] [PMC free article] [PubMed] [Google Scholar]
- 106.Dietrich CF, Bamber J, Berzigotti A, et al. EFSUMB guidelines and recommendations on the clinical use of liver ultrasound elastography, update 2017 (Short Version) Ultraschall Med. 2017;38:377–94. doi: 10.1055/s-0043-103955. [DOI] [PubMed] [Google Scholar]
- 107.Potthoff A, Attia D, Pischke S, et al. Influence of different frequencies and insertion depths on the diagnostic accuracy of liver elastography by acoustic radiation force impulse imaging (ARFI) Eur J Radiol. 2013;82:1207–12. doi: 10.1016/j.ejrad.2013.02.011. [DOI] [PubMed] [Google Scholar]
- 108.Chang S, Kim MJ, Kim J, et al. Variability of ShearWave velocity using different frequencies in acoustic radiation force impulse (ARFI) elastography: A Phantom and Normal Liver Study. Ultraschall Med. 2013;34:260–5. doi: 10.1055/s-0032-1313008. [DOI] [PubMed] [Google Scholar]
- 109.Friedrich-Rust M, Nierhoff J, Lupsor M, et al. Performance of acoustic radiation force impulse imaging for the staging of liver fibrosis: A pooled meta-analysis. J Viral Hepat. 2012;19:e212–9. doi: 10.1111/j.1365-2893.2011.01537.x. [DOI] [PubMed] [Google Scholar]
- 110.Bota S, Herkner H, Sporea I, et al. Meta-analysis: ARFI elastography versus transient elastography for the evaluation of liver fibrosis. Liver Int. 2013;33:1138–47. doi: 10.1111/liv.12240. [DOI] [PubMed] [Google Scholar]
- 111.Elkrief L, Rautou PE, Ronot M, et al. Prospective comparison of spleen and liver stiffness by using shear-wave and transient elastography for detection of portal hypertension in cirrhosis. Radiology. 2015;275:589–98. doi: 10.1148/radiol.14141210. [DOI] [PubMed] [Google Scholar]
- 112.Procopet B, Berzigotti A, Abraldes JG, et al. Real-time shear-wave elastography: Applicability, reliability and accuracy for clinically significant portal hypertension. J Hepatol. 2015;62:1068–75. doi: 10.1016/j.jhep.2014.12.007. [DOI] [PubMed] [Google Scholar]
- 113.Youk JH, Gweon HM, Son EJ. Shear-wave elastography in breast ultrasonography: The state of the art. Ultrasonography. 2017;36:300–9. doi: 10.14366/usg.17024. [DOI] [PMC free article] [PubMed] [Google Scholar]
- 114.Lee SH, Chang JM, Cho N, et al. Practice guideline for the performance of breast ultrasound elastography. Ultrasonography. 2014;33:3–10. doi: 10.14366/usg.13012. [DOI] [PMC free article] [PubMed] [Google Scholar]
- 115.Berg WA, Cosgrove DO, Doré CJ, et al. Shear-wave elastography improves the specificity of breast US: The BE1 multinational study of 939 masses. Radiology. 2012;262:435–49. doi: 10.1148/radiol.11110640. [DOI] [PubMed] [Google Scholar]
- 116.Bai M, Du L, Gu J, et al. Virtual touch tissue quantification using acoustic radiation force impulse technology: Initial clinical experience with solid breast masses. J Ultrasound Med. 2012;31:289–94. doi: 10.7863/jum.2012.31.2.289. [DOI] [PubMed] [Google Scholar]
- 117.Barr RG. Sonographic breast elastography. J Ultrasound Med. 2012;31:773–83. doi: 10.7863/jum.2012.31.5.773. [DOI] [PubMed] [Google Scholar]
- 118.Barr RG. Elastography in clinical practice. Radiol Clin North Am. 2014;52:1145–62. doi: 10.1016/j.rcl.2014.07.002. [DOI] [PubMed] [Google Scholar]
- 119.Evans A, Rauchhaus P, Whelehan P, et al. Does shear wave ultrasound independently predict axillary lymph node metastasis in women with invasive breast cancer? Breast Cancer Res Treat. 2014;143:153–7. doi: 10.1007/s10549-013-2747-z. [DOI] [PMC free article] [PubMed] [Google Scholar]
- 120.Athanasiou A, Latorre-Ossa H, Criton A, et al. Feasibility of imaging and treatment monitoring of breast lesions with three-dimensional shear wave elastography. Ultraschall Med. 2017;38:51–9. doi: 10.1055/s-0034-1398980. [DOI] [PubMed] [Google Scholar]
- 121.Luo J, Cao Y, Nian W, et al. Benefit of Shear-wave Elastography in the differential diagnosis of breast lesion: A diagnostic meta-analysis. Med Ultrason. 2018;1:43–9. doi: 10.11152/mu-1209. [DOI] [PubMed] [Google Scholar]
- 122.Dong FJ, Li M, Jiao Y, et al. Acoustic Radiation Force Impulse imaging for detecting thyroid nodules: A systematic review and pooled meta-analysis. Med Ultrason. 2015;17:192–9. doi: 10.11152/mu.2013.2066.172.hyr. [DOI] [PubMed] [Google Scholar]
- 123.Liu BJ, Li DD, Xu HX, et al. Quantitative shear wave velocity measurement on acoustic radiation force impulse elastography for differential diagnosis between benign and malignant thyroid nodules: A meta-analysis. Ultrasound Med Biol. 2015;41:3035–43. doi: 10.1016/j.ultrasmedbio.2015.08.003. [DOI] [PubMed] [Google Scholar]
- 124.Cantisani V, David E, Grazhdani H, et al. Prospective evaluation of semiquantitative strain ratio and quantitative 2D ultrasound ShearWave Elastography (SWE) in Association with TIRADS classification for thyroid nodule characterization. Ultraschall Med. 2019;40:495–503. doi: 10.1055/a-0853-1821. [DOI] [PubMed] [Google Scholar]
- 125.Han R, Li F, Wang Y, et al. Virtual touch tissue quantification (VTQ) in the diagnosis of thyroid nodules with coexistent chronic autoimmune Hashimoto'sthyroiditis: A preliminary study. Eur J Radiol. 2015;84:327–31. doi: 10.1016/j.ejrad.2014.11.005. [DOI] [PubMed] [Google Scholar]
- 126.Liu B, Liang J, Zhou L, et al. Shear wave elastography in the diagnosis of thyroid nodules with coexistent chronic autoimmune Hashimoto's thyroiditis. Otolaryngol Head Neck Surg. 2015;153:779–85. doi: 10.1177/0194599815600149. [DOI] [PubMed] [Google Scholar]
- 127.Dudea SM, Botar-Jid C. Ultrasound elastography in thyroid disease. Med Ultrason. 2015;17:74–96. doi: 10.11152/mu.2013.2066.171.smd. [DOI] [PubMed] [Google Scholar]
- 128.Kim I, Kim EK, Yoon JH, et al. Diagnostic role of conventional ultrasonography and shearwave elastography in asymptomatic patients with diffuse thyroid disease: Initial experience with 57 patients. Yonsei Med J. 2014;55:247–53. doi: 10.3349/ymj.2014.55.1.247. [DOI] [PMC free article] [PubMed] [Google Scholar]
- 129.Zhao CK, Chen SG, Alizad A, et al. Three-dimensional shear wave elastography for differentiating benign from malignant thyroid nodules. J Ultrasound Med. 2018;37:1777–88. doi: 10.1002/jum.14531. [DOI] [PubMed] [Google Scholar]
- 130.Jiang M, Li C, Tang S, et al. Nomogram based on shear-wave elastography radiomics can improve preoperative cervical lymph node staging for papillary thyroid carcinoma. Thyroid. 2020;30:885–97. doi: 10.1089/thy.2019.0780. [DOI] [PubMed] [Google Scholar]
- 131.Sigrist RM, Liau J, Kaffas AE, et al. Ultrasound elastography: Review of techniques and clinical applications. Theranostics. 2017;7:1303–29. doi: 10.7150/thno.18650. [DOI] [PMC free article] [PubMed] [Google Scholar]
- 132.Correas JM, Tissier AM, Khairoune A, et al. Prostate cancer: Diagnostic performance of real-time shear-wave elastography. Radiology. 2015;275:280–9. doi: 10.1148/radiol.14140567. [DOI] [PubMed] [Google Scholar]
- 133.Shoji S, Hashimoto A, Nakamura T, et al. Novel application of three-dimensional shear wave elastography in the detection of clinically significant prostate cancer. Biomed Rep. 2018;8:373–7. doi: 10.3892/br.2018.1059. [DOI] [PMC free article] [PubMed] [Google Scholar]
- 134.Dietrich CF, Hocke M. Elastography of the pancreas, current view. Clin Endosc. 2019;52:533–40. doi: 10.5946/ce.2018.156. [DOI] [PMC free article] [PubMed] [Google Scholar]
- 135.Ohno E, Kawashima H, Ishikawa T, et al. Diagnostic performance of endoscopic ultrasonography-guided elastography for solid pancreatic lesions: Shear-wave measurements versus strain elastography with histogram analysis. Dig Endosc. 2021;33:629–38. doi: 10.1111/den.13791. [DOI] [PubMed] [Google Scholar]
- 136.Kuwahara T, Hara K, Mizuno N, et al. Present status of ultrasound elastography for the diagnosis of pancreatic tumors: Review of the literature. J Med Ultrason (2001) 2020;47:413–20. doi: 10.1007/s10396-020-01026-6. [DOI] [PubMed] [Google Scholar]
- 137.Wada Y, Aoki T, Fujimori A, et al. Intraoperative shear wave elastography as a quantitative predictor of pancreatic fibrosis and exocrine function. Anticancer Res. 2021;41:1013–9. doi: 10.21873/anticanres.14856. [DOI] [PubMed] [Google Scholar]
- 138.Goertz RS, Schuderer J, Strobel D, et al. Acoustic radiation force impulse shear wave elastography (ARFI) of acute and chronic pancreatitis and pancreatic tumor. Eur J Radiol. 2016;85:2211–6. doi: 10.1016/j.ejrad.2016.10.019. [DOI] [PubMed] [Google Scholar]
- 139.Onoyama T, Koda M, Fujise Y, et al. Utility of virtual touch quantification in the diagnosis of pancreatic ductal adenocarcinoma. Clin Imaging. 2017;42:64–7. doi: 10.1016/j.clinimag.2016.11.013. [DOI] [PubMed] [Google Scholar]
- 140.D'Onofrio M, De Robertis R, Crosara S, et al. Acoustic radiation force impulse with shear wave speed quantification of pancreatic masses: A prospective study. Pancreatology. 2016;16:106–9. doi: 10.1016/j.pan.2015.12.003. [DOI] [PubMed] [Google Scholar]
- 141.Chen LD, Wang W, Xu JB, et al. Assessment of rectal tumors with shear-wave elastography before surgery: Comparison with endorectal US. Radiology. 2017;285:279–92. doi: 10.1148/radiol.2017162128. [DOI] [PubMed] [Google Scholar]
- 142.Suh CH, Choi YJ, Baek JH, et al. The diagnostic performance of shear wave elastography for malignant cervical lymph nodes: A systematic review and meta-analysis. Eur Radiol. 2017;27:222–30. doi: 10.1007/s00330-016-4378-3. [DOI] [PubMed] [Google Scholar]
- 143.You J, Chen J, Xiang F, et al. The value of quantitative shear wave elastography in differentiating the cervical lymph nodes in patients with thyroid nodules. J Med Ultrason (2001) 2018;45:251–9. doi: 10.1007/s10396-017-0819-0. [DOI] [PubMed] [Google Scholar]
- 144.Li J, Chen M, Cao CL, et al. Diagnostic performance of acoustic radiation force impulse elastography for the differentiation of benign and malignant superficial lymph nodes: A meta-analysis. J Ultrasound Med. 2020;39:213–22. doi: 10.1002/jum.15096. [DOI] [PubMed] [Google Scholar]
- 145.Ramnarine KV, Garrard JW, Kanber B, et al. Shear wave elastography imaging of carotid plaques: Feasible, reproducible and of clinical potential. Cardiovasc Ultrasound. 2014;12:49. doi: 10.1186/1476-7120-12-49. [DOI] [PMC free article] [PubMed] [Google Scholar]
- 146.Lou Z, Yang J, Tang L, et al. Shear wave elastography imaging for the features of symptomatic carotid plaques: A feasibility study. J Ultrasound Med. 2017;36:1213–23. doi: 10.7863/ultra.16.04073. [DOI] [PubMed] [Google Scholar]
- 147.Garrard JW, Ummur P, Nduwayo S, et al. Shear wave elastography may be superior to greyscale median for the identification of carotid plaque vulnerability: A comparison with histology. Ultraschall Med. 2015;36:386–90. doi: 10.1055/s-0034-1399676. [DOI] [PubMed] [Google Scholar]
- 148.Eby S, Zhao H, Song P, et al. Quantitative evaluation of passive muscle stiffness in chronic stroke. Am J Phys Med Rehabil. 2016;95:899–910. doi: 10.1097/PHM.0000000000000516. [DOI] [PMC free article] [PubMed] [Google Scholar]
- 149.Lee SS, Spear S, Rymer WZ. Quantifying changes in material properties of stroke-impaired muscle. Clin Biomech (Bristol, Avon) 2015;30:269–75. doi: 10.1016/j.clinbiomech.2015.01.004. [DOI] [PMC free article] [PubMed] [Google Scholar]
- 150.Lacourpaille L, Hug F, Guével A, et al. Non-invasive assessment of muscle stiffness in patients with Duchenne muscular dystrophy. Muscle Nerve. 2015;51:284–6. doi: 10.1002/mus.24445. [DOI] [PubMed] [Google Scholar]
- 151.Illomei G, Spinicci G, Locci E, et al. Muscle elastography: A new imaging technique for multiple sclerosis spasticity measurement. Neurol Sci. 2017;38:433–9. doi: 10.1007/s10072-016-2780-x. [DOI] [PubMed] [Google Scholar]
- 152.Brandenburg JE, Eby SF, Song P, et al. Quantifying passive muscle stiffness in children with and without cerebral palsy using ultrasound shear wave elastography. Dev Med Child Neurol. 2016;58:1288–94. doi: 10.1111/dmcn.13179. [DOI] [PMC free article] [PubMed] [Google Scholar]
- 153.Tatar IG, Kurt A, Yavasoglu NG, et al. Carpal tunnel syndrome: Elastosonographic strain ratio and cross-sectional area evaluation for the diagnosis and disease severity. Med Ultrason. 2016;18:305–11. doi: 10.11152/mu.2013.2066.183.tat. [DOI] [PubMed] [Google Scholar]
- 154.Dikici AS, Ustabasioglu FE, Delil S, et al. Evaluation of the tibial nerve with shear-wave elastography: A potential sonographic method for the diagnosis of diabetic peripheral neuropathy. Radiology. 2017;282:494–501. doi: 10.1148/radiol.2016160135. [DOI] [PubMed] [Google Scholar]
- 155.Hall TJ, Milkowski A, Garra B, et al. RSNA/QIBA: Shear Wave Speed as a Biomarker for Liver Fibrosis Staging. 2013 Ieee International Ultrasonics Symposium. 2013:397–400. [Google Scholar]


