Abstract
Cryo electron microscopy (cryo-EM) is a powerful technique that can be used to elucidate the structural architecture of a protein molecule in a physiologically relevant environment. In this method, purified protein is frozen in its aqueous buffer in a thin layer of vitreous ice in which the biological macromolecules are embedded in various orientations. Images of this frozen sample are collected with an electron microscope, and the data is processed using different software algorithms resulting in high-resolution structures of the protein. Proteins in the presence of various ligands or other macromolecular complexes can also be studied by this method. Here, we present a protocol for the purification and vitrification of TRP channels for single particle cryo-EM.
Keywords: Cryo electron microscopy, Transient receptor potential channels, Ion channels, Membrane protein purification, Negative staining
1. Introduction
Understanding the mechanistic details regarding how biological macromolecules perform their complicated task in a living cell is the fundamental goal of structural biology. Detailed atomic structures provide some insight in understanding the relevant functional states of such macromolecules. Though, to completely understand the mechanism of action, the dynamicity of the protein needs to be captured. Cryo-EM provides the opportunity to study the dynamics of biological macromolecules and complexes. Cryo-EM is a unique technique in that it allows for the visualization of proteins in native or near-native aqueous environments. The proteins are vitrified in glass like ice and therefore exist in random orientations within the ice that can be imaged using an electron microscope. Once imaged, the random orientations allow for the reconstruction of a 3D protein structure.
Electron microscopy has existed for decades, but, in the mid-1970s, the era of cryo-EM with vitrified water successfully began [1]. Jacques Dubochet, Joachim Frank, and Richard Henderson received the Nobel Prize in 2017 for their contribution in development of cryo-electron microscopy. The resolution of protein structures in the early years of cryo-EM was severely limited due to imaging techniques and reconstruction software. Additionally, the field had been limited to large oligomeric proteins such as viruses. A revolution in the field of cryo-EM occurred in 2013 resulting in the structures of membrane proteins being resolved to near atomic resolution [2, 3]. This was possible due to the development of the direct electron detection camera [4–6] and advancements in reconstruction algorithms [7, 8]. Now cryo-EM is routinely being used to generate near atomic resolution structures of biomolecules including membrane proteins in aqueous environments. It has also been demonstrated by the Subramaniam group that structure of <100 kDa biomolecule can now be solved to near atomic resolution using this technique and it is now possible to solve cryo-EM structures to atomic resolution [9]. Overall, cryo-EM is now an extremely powerful technique that can provide answers to an abundance of biological questions.
For membrane proteins and other proteins that do not readily crystalize, this technique has opened the door for atomic and near atomic analyses. Transient receptor potential (TRP) channels in particular have a long and successful history with cryo-EM [2, 3, 10–15]. The mammalian TRP superfamily of channels is made up of 28 cation selective channels that are involved in a variety of processes from sensory transduction to systemic ion homeostasis. Herein we have provided methods for membrane protein purification and vitrification that has led to near atomic resolution structures of TRP channels.
2. Materials
All solutions are prepared using ultrapure water (deionized water purified to attain a sensitivity of 18 MΩ-cm at 22 °C) and analytical grade reagents. All reagents are stored at 4 °C, unless indicated otherwise (see Note 1).
2.1. 1D4 Tagged Sepharose Bead Preparation
Preswelling Buffer: 1 mM HCl.
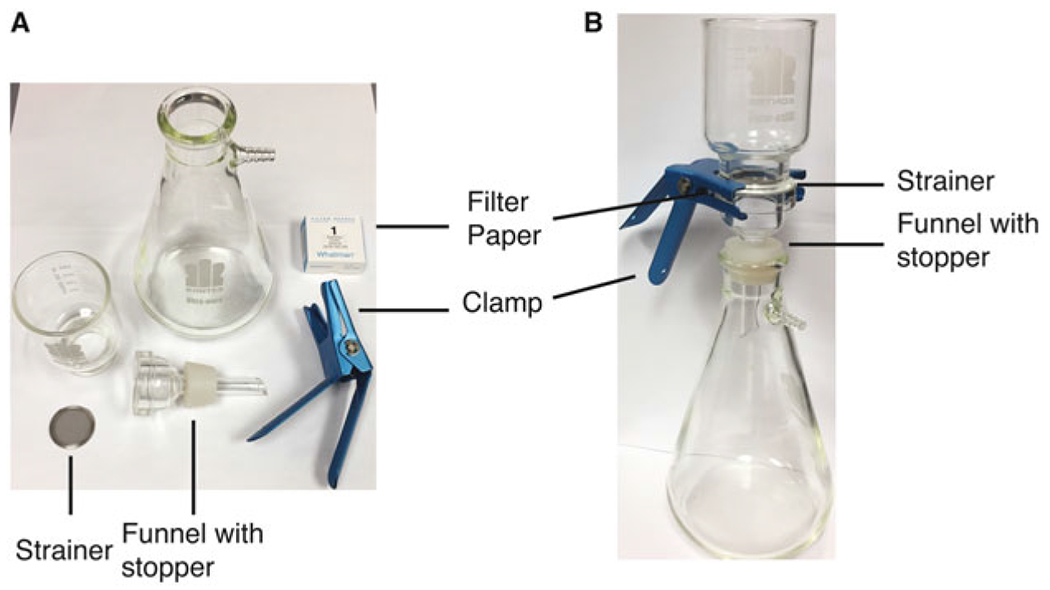
Glass filtration system (Fig. 1).
Whatman #1 filter paper (55 mm).
Coupling Buffer pH 8.5: 0.1 M NaHCO3, 0.5 M NaCl, adjust the pH to 8.5 using NaOH.
Purified and filtered 1D4 antibody.
Blocking Buffer pH 8.0: 0.2 M glycine, adjust the pH to 8.0 using NaOH.
Washing Buffer: 0.1 M NaC2H3O2 (sodium acetate), 0.5 M NaCl, pH to 4.0 using acetic acid (see Note 2).
Fig. 1.

The filtration apparatus and setup used for preparing 1D4 columns. (a) The individual parts of the filtration apparatus are shown. (b) Shows the assembled and completed setup; the filter paper is on top of the strainer which sits on top of the funnel
2.2. Protein Purification
Solubilization buffer: 20 mM HEPES, pH 8 (see Note 3), 150 mM NaCl, 5% glycerol, 2 mM Tris(2-carboxyethyl) phosphine hydrochloride (TCEP) (see Note 4), 1 mM phenylmethylsulfonyl fluoride (PMSF) (see Note 5) and 10× CMC detergent (see Note 6). Prepare a stock buffer (Buffer A) by adding 430 mL of water to a glass beaker with a magnetic stir bar and place it on a stir plate. To this add 20 mL of 1 M HEPES, pH 8, 50 mL glycerol, and 8.2 mg of NaCl and mix. Transfer this to a graduated cylinder and bring the volume to 1 L with water and transfer to a glass bottle. Store this Buffer A at 4 °C. On the day of purification add required amount of TCEP, PMSF, and detergent to the required amount of preprepared cold Buffer A (see Note 7).
Wash buffer: 20 mM HEPES, pH 8, 150 mM NaCl, 2 mM TCEP, and 3× CMC detergent. Prepare a stock buffer (Buffer B) with 20 mM HEPES, pH 8 and 150 mM NaCl as seen above with Buffer A and store at 4 °C. On the day of purification add required amount of TCEP and detergent to the required amount of preprepared cold Buffer B.
Elution Buffer: 3 mg/mL of 1D4 peptide (NH2-TETSQVAPA-CO2H) in Wash buffer. Take 30 mL Wash buffer in a 50 mL conical tube and add 90 mg of 1D4 peptide to it. Mix well and place it on ice until needed (see Note 8).
Size exclusion chromatography (SEC) buffer: 20 mM HEPES, pH 8, 150 mM NaCl, 2 mM TCEP, and 3× CMC detergent (see Note 9). For this add 1 mL of thawed 500 mM TCEP (see Note 4) and 3× CMC detergent to 250 mL stock Buffer B (stored at 4 °C).
1D4 tagged sepharose beads.
Cell membranes containing the protein of interest with a 1D4 epitope tag (see Note 10).
2.3. Negative Staining
Carbon film 200 Mesh copper grids (see Note 11).
2% uranyl acetate (see Note 12). Add 20 mg uranyl acetate powder to 1 mL water and stir until mixed. Use fresh or make 100 μL aliquots in eppendorf tubes covered with aluminum foil and store at 4 °C.
Ultrapure water.
Whatman filter paper #1, 90 mm.
Parafilm (approximately 3 × 3 in.).
Timer or stopwatch.
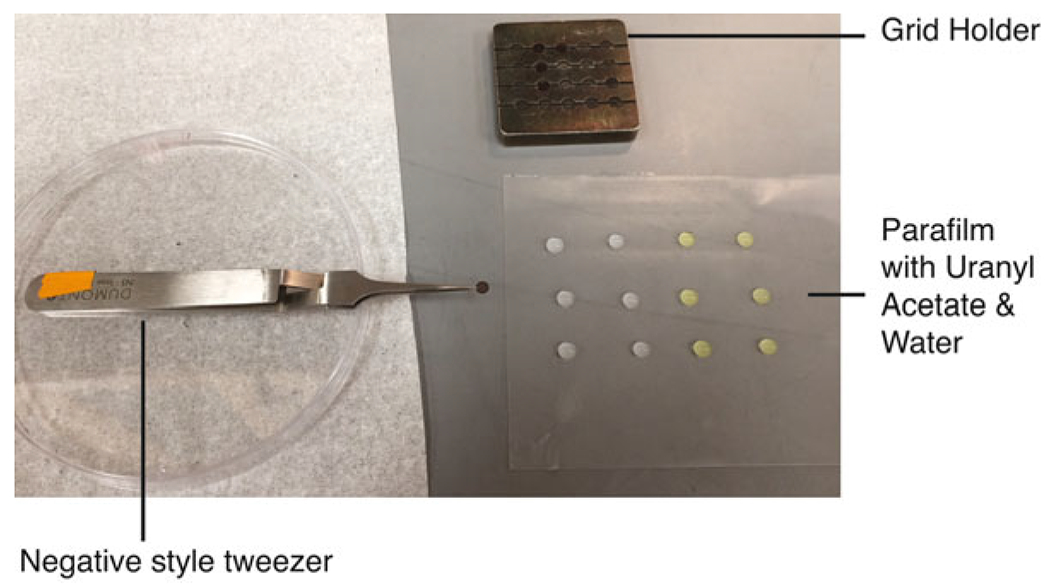
Negative action style tweezers (Fig. 2).
Glow discharging unit (e.g., the Emitech K100X model).
Grid holder or glass slab (Fig. 2).
Fig. 2.

Negative staining setup. The layout during a negative stain session is shown. The negative style tweezers is used to hold a grid, the grid holder is used to hold grids during glow discharge and the water and uranyl acetate drops are placed on the Parafilm
2.4. Sample Vitrification
Quantifoil r 1.2/1.3100 Holey carbon films 300 mesh copper grids (see Note 13).
Vitrobot (e.g., FEI Vitrobot Mark IV).
Filter paper (e.g., Ted Pella, Inc. 55/20 mm).
Tweezers with clamp ring fitted for use in a vitrobot (for example, Dumont Tweezers L5 by Electron Microscopy Sciences).
Ethane gas.
Liquid nitrogen.
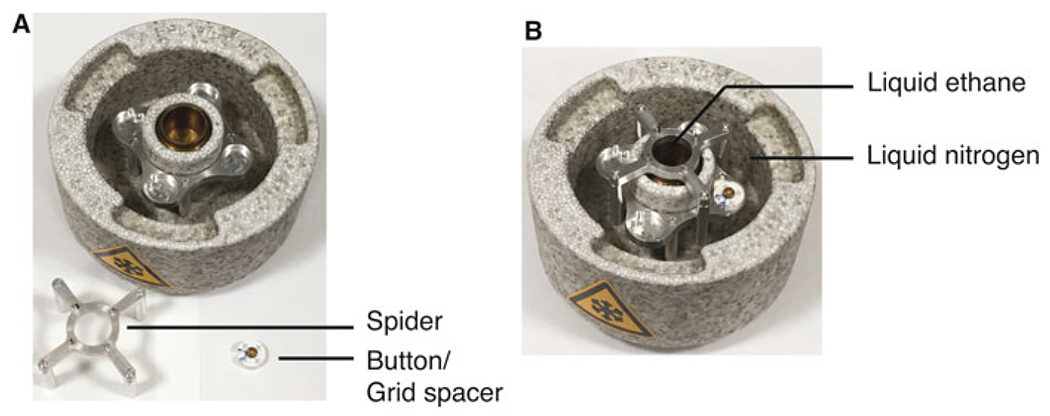
Cooling chamber (Fig. 3).
Grid boxes, or grid spacers (e.g., Cryo Grid Boxes by Electron Microscopy Sciences).
Fig. 3.

Cooling chamber used for freezing. (a) The individual parts of the cooling chamber. (b) Shows the assembled and completed setup; after the entire chamber is cooled down to the temperature of liquid nitrogen, there should be no liquid nitrogen in the inner chamber, but the outer chamber should be filled with liquid nitrogen. Then ethane should be added to the inner chamber and then the spider should be removed before freezing
3. Methods
3.1. 1D4 Sepharose Bead Preparation
To prepare the beads add 2.0 g of CNB activated Sepharose powder to a 50 mL conical tube. Bring to a volume of 40 mL with Preswelling Buffer and incubate with stirring at 4 °C for 15 min (see Note 14).
Wash the beads with 500 mL of Preswelling Buffer using a glass filter system (see Fig. 1) with Whatman #1 filter paper. All steps using the glass filter system can be done at room temperature. Using a metal spatula, transfer the washed beads to a clean 50 mL conical tube and rinse both the spatula and filter paper into the tube using 10 mL of Coupling Buffer pH 8.5.
Add 100 mg of purified and filtered 1D4 antibody to the beads and bring to 40 mL with Coupling Buffer pH 8.5. Incubate with stirring at 4 °C for 8–16 h (see Note 14). Remove excess ligand using a glass filter system with Whatman #1 filter paper and measure the antibody concentration of the flow through using UV spectroscopy (see Note 15).
Wash the beads with 250 mL of Coupling Buffer pH 8.5. Using a metal spatula, transfer the washed beads to a clean 50 mL conical tube and rinse both the spatula and filter paper into the tube using 10 mL of Blocking Buffer pH 8.0. Bring to a volume of 40 mL with Blocking Buffer pH 8.0 and incubate with stirring at 4 °C for 2 h (see Note 14).
Wash the beads with 300 mL of Coupling Buffer pH 8.5 using a glass filter system with Whatman #1 filter paper.
Begin the pH changing cycle by first washing with 300 mL Washing Buffer pH 4.0 then immediately wash with 300 mL Coupling Buffer pH 8.5. Repeat this cycle two more times for a total of 3 pH changing cycles (see Note 16). Using a metal spatula, transfer the pH changed beads to a clean 50 mL conical tube and rinse both the spatula and filter paper into the tube using Coupling Buffer pH 8.5. Bring to a volume of 40 mL with Coupling Buffer pH 8.5 and store at 4 °C until needed.
3.2. Membrane Protein Purification
All steps should be performed with clean glassware and equipment at 4 °C with cold reagents, unless otherwise specified.
Measure the UV absorbance at 280 nm of the cell membranes containing the protein of interest with a 1D4 epitope tag and calculate the amount of solubilization buffer required to dilute the membrane to a final concentration of 15 as measured by UV absorbance at 280 nm (see Note 17).
In a clean beaker with a stir bar measure out required amount of Buffer A, detergent, TCEP and PMSF (see Note 17). Stir to mix everything and once the solution is clear. Add the membrane and solubilize for 1 h with gentle stirring.
In a clean beaker with a stir bar combine 450 mL of Buffer B, TCEP, and the required amount of detergent (see Note 17).
Divide the solubilized membrane solution from step 2 into clean, precooled ultracentrifuge tubes. Centrifuge at 100,000 × g for 1 hat 4 ° C.
Collect supernatant into a bottle and add 1D4 tagged sepharose beads (see Note 18). Incubate for 3 h with rotation.
Pour the protein bead mixture into a clean glass column (20 μM porosity polyethylene bed should be situated at base of column). Wash with 20 column volumes of Wash Buffer.
Gently layer one-third column volume of Elution Buffer and immediately collect this one-third column volume in an Eppendorf tube.
Gently layer the remaining Elution Buffer onto the column and incubate for 8–16 h.
Collect 1 mL elution fractions with 5 min incubation in between collections.
Determine which fractions contain eluted protein by measuring the UV absorbance at 280 nm of each elution fraction or by running a western blot assay.
Combine the elution fractions containing protein and concentrate to desired volume to perform size exclusion chromatography.
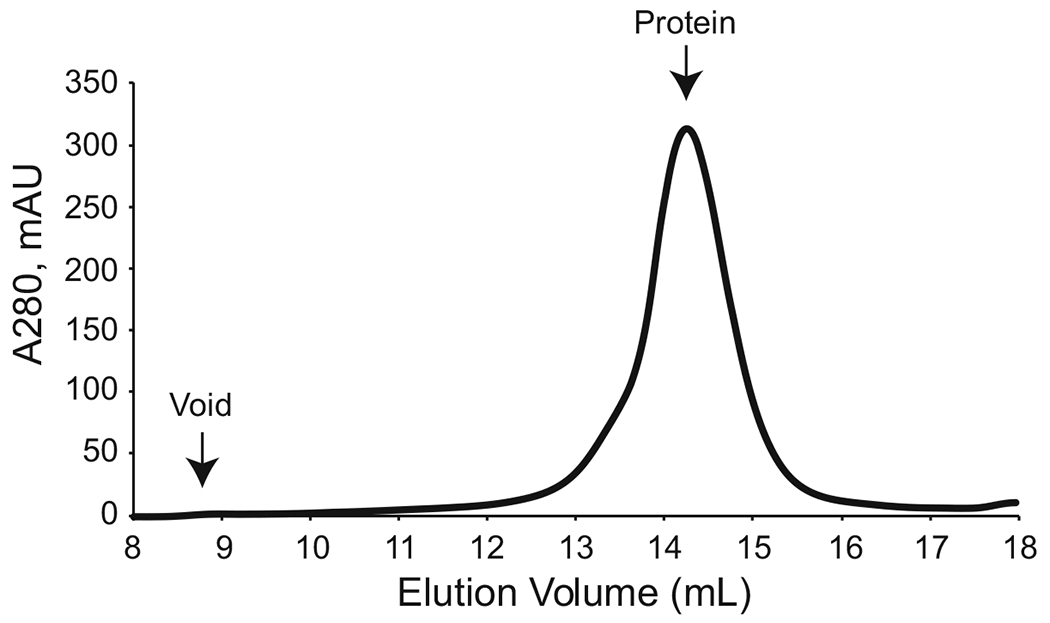
Inject the concentrated protein sample into preequilibrated size exclusion chromatography column. Once the run is complete, collect the peak corresponding to the molecular weight of the protein (Fig. 4).
For negative staining use the purified protein directly. For cryo-EM use, concentrate the protein to ~3 mg mL−1 (see Note 19).
Fig. 4.

Size exclusion chromatography. A representative size exclusion chromatogram is shown; the peak corresponds to fractions 14–15 mL. Elution fraction will vary based on size of protein
3.3. Sample Negative Staining
All steps can be performed at room temperature, but the bulk protein sample should remain on ice during the negative staining procedure. The purpose of negative staining a sample in the protocol is to ensure the sample is homogeneous and in the proper oligomeric state. High-resolution refinements are not possible with negative stain data collection and processing.
Glow discharge the carbon grids at 15 mA for 15 s with the carbon-coated side facing up on a grid holder or glass slab (see Note 20).
Spray a 3 x 3 in. clean flat surface with water and place the 3 × 3 in. Parafilm square in the water (see Note 21).
Place two 10 μL drops of ultrapure water and two 10 μL drops of 2% uranyl acetate next to each other on the Parafilm (see Fig. 2).
Secure one glow discharged grid in the negative action style tweezers with the glow discharged side facing up.
Apply 3 μL of the protein sample to the glow discharged side of the grid and incubate for 30 s (see Note 22).
Wick away excess liquid by touching the edge of the grid to a small piece of Whatman filter paper #1.
Using the tweezers to maneuver the grid, contact the glow discharged side of the grid to the surface of the first water drop and allow it to incubate for 10 s (see Note 23).
Wick away excess liquid by touching the edge of the grid to a small piece of Whatman filter paper #1.
Using the tweezers to maneuver the grid, contact the glow discharged side of the grid to the surface of the second water drop and allow it to incubate for 10 s.
Wick away excess liquid by touching the edge of the grid to a small piece of Whatman filter paper #1.
Using the tweezers to maneuver the grid, contact the glow discharged side of the grid to the surface of the first drop of 2% uranyl acetate and allow it to incubate for 20 s.
Wick away excess liquid by touching the edge of the grid to a small piece of Whatman filter paper #1.
Using the tweezers to maneuver the grid, contact the glow discharged side of the grid to the surface of the second drop of 2% uranyl acetate and allow it to incubate for 1 min.
Wick away excess liquid by touching the edge of the grid to a small piece of Whatman filter paper #1. Allow to dry for several minutes before use. For long-term storage, negative stain grids should be kept in a desiccator.
3.4. Sample Vitrification
The freezing or vitrification process can be performed at room temperature, but the bulk protein sample should remain on ice and the frozen grids should always remain below the temperature of liquid nitrogen (−196 °C). If the protein needs to be incubated or treated with ligand, then it should be done before the protein sample is frozen.
Switch on the vitrobot and set the humidity and temperature to the desired values (see Note 24).
Cool down the cooling chamber with clean liquid nitrogen until all parts of the chamber are at liquid nitrogen temperature.
Place the grid boxes or grid spacers in the designated area and cool them down inside the cooling chamber (see Note 25).
Add liquid ethane to the metal inset of the cooling chamber. Then remove the spider (Fig. 3).
Secure one cryo-EM grid with the tweezers fitted for the vitrobot and place it in the vitrobot (see Note 26).
Apply 3.5 μL of protein sample to one side of the grid. Follow the steps programed in the vitrobot to freeze the protein (see Note 27).
Detach the tweezers with the frozen grid from the vitrobot arm carefully so that the grid is not exposed to air and quickly transfer to the liquid nitrogen, minimizing the time the grid is outside of a cooling liquid. Gently place the grid into the grid box or grid spacer.
4 Notes
All reagents should be cold when used for the experiments.
The pH of the Washing Buffer pH 4.0 must be adjusted using acetic acid only. Glacial acetic acid is recommended here.
A stock solution of 1 M HEPES-HCl (238.3 g in 1 L water), pH adjusted to 8.0 with HCl is prepared and stored at 4 °C.
A stock solution of 500 mM TCEP (238.3 mgs in 15 mL water), pH adjusted to 8.0 with HCl is prepared and stored at −20 °C.
A stock solution of 100 mM PMSF (238.3 mgs in 50 mL methanol) is prepared and stored at 4 °C.
10× CMC of detergent is a generic value that works for a variety of membrane proteins but higher or lower values can be optimum for specific proteins. Common detergents that have been successful for membrane protein solubilization and vitrification include DDM, MNG detergents and digitonin.
The quantity of Solubilization Buffer required for purification is dependent on the amount of membrane used to purify the protein. Thus the measurements for TCEP, PMSF, and detergent needs to be adjusted accordingly.
The Elution Buffer should be made fresh before each use.
If the protein is stable or in amphipol then no detergent is required in the SEC buffer.
Though any affinity tag can be used for this purification, included in this chapter are instructions for the purification of TRP channels expressed with a 1D4 tag (TETSQVAPA) specifically. Channels expressing other affinity tags should alter the affinity chromatography portion of these methods accordingly. Expression of the 1D4 tag on the C-terminus is preferred.
Other carbon coated grids suitable for negative staining can also be used. Variations in carbon thickness and mesh sizes will change the contrast and dispersion of particles.
Other heavy metal salt dyes appropriate for negative staining may be used here.
Other grids like gold or copper grids with different specification suitable for the sample can also be used for this.
To ensure effective stirring at the appropriate temperature, the incubating beads were placed on a tube rotator located in a cold room.
Measure the UV absorbance at 280 nm. If the protocol was successful this absorbance value will be close to zero.
A total of 900 mL of each buffer should be used throughout the pH changing cycles and the last wash should consist of Coupling Buffer pH 8.5.
An example: for one tube of 12 mL membrane with a UV absorbance at 280 nm of 521, the final volume of Solubilization Buffer required is 417 mL ([12×521]/15). For this, use 400 mL of Buffer A, 362 mg DDM detergent (for example), 1.6 mL TCEP, and 4.17 mL PMSF.
For every ~300 mL of solubilized membrane add 15 mL of 1D4 tagged sepharose beads.
The concentration can be adjusted depending on how the protein is distributed after vitrification.
A range of glow discharging settings can be tested for best particle distribution and stain contrast. Plasma cleaning can be used here as well. The glow discharge will lose its effect after ~30 min and will need to be performed again.
This should allow the Parafilm to lay flat on the working surface and will minimize static electricity which could interfere with grid preparation.
Protein concentrations for negative staining will be much lower than that used in cryo-EM samples. Depending on the sample a concentration between 0.2 and 0.6 mg/mL should allow for particle visualization without stain-induced particle clumping.
If the grid has been effectively glow discharged the water drop should ‘jump’ up to the grid leaving little to none on the Parafilm. This will be the case for all four liquid droplets.
A range of temperature and humidity can be tested. But 100% humidity with a temperature of 4 °C is a good starting point.
When the liquid nitrogen stops boiling it indicates that the grid spacers are cooled.
The grid can be glow discharged or used directly from the box. This again needs to be tested to confirm what works best for the sample of interest. If the protein has a preferred orientation in the vitrified ice, then glow discharging should be avoided. If the protein has strong preference toward the carbon edges and does not disperse into the hole, then glow discharging is an option. Another option if the protein has strong preference toward the carbon edges is to do multiple blots during the vitrification process so that the carbon becomes saturated with protein and remaining protein will be forced into the hole. In some cases detergents like OG (n-octyl-β-d-glucopyranoside) have also been helpful with preferred orientation.
A range of condition needs to be tested to find the perfect ice that is neither too thick nor too thin. Usually several grids with various blotting times (2, 4, 6 s, etc.) and blotting forces (−2, −6, −8, +2, +4, +8, etc.) should be prepared and screened first. Then the conditions that give good ice should be further fine-tuned to get the perfect ice.
References
- 1.Dubochet J (2012) Cryo-EM—the first thirty years. J Microsc 245(3):221–224. 10.1111/j.1365-2818.2011.03569.x [DOI] [PubMed] [Google Scholar]
- 2.Liao M, Cao E, Julius D, Cheng Y (2013) Structure of the TRPV1 ion channel determined by electron cryo-microscopy. Nature 504(7478):107–112. 10.1038/nature12822 [DOI] [PMC free article] [PubMed] [Google Scholar]
- 3.Cao E, Liao M, Cheng Y, Julius D (2013) TRPV1 structures in distinct conformations reveal activation mechanisms. Nature 504 (7478):113–118. 10.1038/nature12823 [DOI] [PMC free article] [PubMed] [Google Scholar]
- 4.Bammes BE, Rochat RH, Jakana J et al. (2012) Direct electron detection yields cryo-EM reconstructions at resolutions beyond ¾ Nyquist frequency. J Struct Biol 177 (3):589–601. 10.1016/j.jsb.2012.01.008 [DOI] [PMC free article] [PubMed] [Google Scholar]
- 5.Milazzo AC, Moldovan G, Lanman J et al. (2010) Characterization of a direct detection device imaging camera for transmission electron microscopy. Ultramicroscopy 110 (7):744–747. 10.1016/j.ultramic.2010.03.007 [DOI] [PMC free article] [PubMed] [Google Scholar]
- 6.Jin L, Milazzo AC, Kleinfelder S et al. (2008) Applications of direct detection device in transmission electron microscopy. J Struct Biol 161 (3):352–358. 10.1016/j.jsb.2007.10.007 [DOI] [PMC free article] [PubMed] [Google Scholar]
- 7.Scheres SHW (2012) RELION: implementation of a Bayesian approach to cryo-EM structure determination. J Struct Biol 180 (3):519–530. 10.1016/j.jsb.2012.09.006 [DOI] [PMC free article] [PubMed] [Google Scholar]
- 8.Grigorieff N (2007) FREALIGN: high-resolution refinement of single particle structures. J Struct Biol 157(1):117–125. 10.1016/j.jsb.2006.05.004 [DOI] [PubMed] [Google Scholar]
- 9.Merk A, Bartesaghi A, Banerjee S et al. (2016) Breaking cryo-EM resolution barriers to facilitate drug discovery. Cell 165(7):1698–1707. 10.1016/j.cell.2016.05.040 [DOI] [PMC free article] [PubMed] [Google Scholar]
- 10.Huynh KW, Cohen MR, Jiang J et al. (2016) Structure of the full-length TRPV2 channel by cryo-EM. Nat Commun 7:11130. 10.1038/ncomms11130. http://www.nature.com/articles/ncomms11130 - supplementary-information [DOI] [PMC free article] [PubMed] [Google Scholar]
- 11.Gao Y, Cao E, Julius D, Cheng Y (2016) TRPV1 structures in nanodiscs reveal mechanisms of ligand and lipid action. Nature 534 (7607):347–351. 10.1038/nature17964 [DOI] [PMC free article] [PubMed] [Google Scholar]
- 12.Zubcevic L, Herzik MA Jr, Chung BC et al. (2016) Cryo-electron microscopy structure of the TRPV2 ion channel. Nat Struct Mol Biol 23(2):180–186. 10.1038/nsmb.3159 [DOI] [PMC free article] [PubMed] [Google Scholar]
- 13.Shen PS, Yang X, DeCaen PG et al. (2016) The structure of the polycystic kidney disease channel PKD2 in lipid nanodiscs. Cell 167 (3):763–773.e711. 10.1016/j.cell.2016.09.048 [DOI] [PMC free article] [PubMed] [Google Scholar]
- 14.Grieben M, Pike ACW, Shintre CA et al. (2016) Structure of the polycystic kidney disease TRP channel Polycystin-2 (PC2). Nat Struct Mol Biol 24(2):114–122. 10.1038/nsmb.3343. http://www.nature.com/nsmb/journal/vaop/ncurrent/abs/nsmb.3343.html - supplementary-information [DOI] [PubMed] [Google Scholar]
- 15.Paulsen CE, Armache JP, Gao Y et al. (2015) Structure of the TRPA1 ion channel suggests regulatory mechanisms. Nature 520 (7548):511–517. 10.1038/nature14367 [DOI] [PMC free article] [PubMed] [Google Scholar]


