

Abstract
Touch and other types of patient stimulation are necessary in critical care and generally presumed to be beneficial. Recent pre-clinical studies as well as randomized trials assessing early mobilization have challenged the safety of such routine practices in patients with acute neurological injury such as stroke. We sought to determine if patient stimulation could result in spreading depolarization (SD), a dramatic pathophysiological event that likely contributes to metabolic stress and ischemic expansion in such patients. Patients undergoing surgical intervention for severe acute neurological injuries (stroke, aneurysm rupture, or trauma) were prospectively consented and enrolled in an observational study monitoring SD with implanted subdural electrodes. Subjects also underwent simultaneous video recordings (from continuous EEG monitoring) to assess for physical touch and other forms of patient stimulation (such as suctioning and positioning). The association of patient stimulation with subsequent SD was assessed. Increased frequency of patient stimulation was associated with increased risk of SD (OR=4.39 [95%CI= 1.71-11.24]). The overall risk of SD was also increased in the 60 minutes following patient stimulation compared to times with no stimulation (OR=1.19 [95%CI= 1.13-1.26]), though not all subjects demonstrated this effect individually. Positioning of the subject was the subtype of stimulation with the strongest overall effect on SD (OR= 4.92 [95%CI= 3.74-6.47]). We conclude that in patients with some acute neurological injuries, touch and other patient stimulation can induce SD (PS-SD), potentially increasing the risk of metabolic and ischemic stress. PS-SD may represent an underlying mechanism for observed increased risk of early mobilization in such patients.
Keywords: spreading depolarization, early mobilization, neuro-critical care, stroke mechanisms
INTRODUCTION
The role of therapeutic touch in medicine is one that is both increasingly supported by evidence of objective benefit[1] and is central to providing humanistic care to suffering patients. As medicine becomes increasingly holistic, patients are appropriately seen as part of their social network and as individuals rather than as a “manifestation of disease”. This has led to improved understanding of the importance of family presence and human interactions, particularly during times of severe illness. Specifically, controlled trials have increasingly demonstrated benefits of family presence[2] as well as early mobilization in intensive care unit (ICU) patients[3] across a variety of conditions by decreasing complications related to immobility. It is within this context that cautionary observations both from pre-clinical work[4] and clinical trials in patients with acute neurological injuries[5] suggest that some patients may actually be harmed by these interactions.
While tactile stimulation has been proposed to potentially represent a therapeutic strategy in ischemic stroke by increasing collateral circulation to the brain[6], such an approach may in fact be harmful under some circumstances where spreading depolarization (SD) is induced[7]. Spreading depolarization is a massive, slow-moving wave of brain depolarization, resulting in transient loss of neuronal signaling and depression of normal high frequency activity[8,9]. In stroke and other neurological injuries, SDs occur in repeated, cycling patterns around an ischemic core and can be accompanied by waves of spreading ischemia. SD is strongly implicated in exacerbation of metabolic stress, edema, and infarction in vulnerable penumbral tissue[10,11]. In a recent pre-clinical study of middle cerebral artery (MCA) stroke[4], limb somatosensory stimulation resulted in additional SDs, which in turn were linked to infarct expansion. In that model, SDs were initiated only when the stimulated cortical brain region was in vulnerable penumbra adjacent to the infarct core. No such effect of excess SD was observed when the stimulated region was in the ischemic core itself or in normally perfused brain[4]. The fact that additional SDs induced by peripheral touching were associated with increased injury in mice raises the question of whether similar effects occur in clinical settings.
It is noteworthy that a recent randomized controlled trial (RCT) of very early mobilization after hemorrhagic and ischemic stroke reported the surprising finding of significantly decreased risk of good outcomes in patients randomized to mobilization within 24 hours compared to standard care[12]. Even more concerningly, those randomized to very early mobilization demonstrated increased risk of stroke expansion[13]. Possible explanations for these effects included impaired autoregulation[14], making patients tired and slumping in their chairs[14], orthostatic hypotension[15], and upward head position[16]. These may be plausible contributors, however the above mentioned pre-clinical work strongly suggests that induced SD due to patient stimulation may in fact be a prominent underlying mechanism.
In the present study, we sought to determine if routine patient stimulation early after acute neurological injuries could result in induced SD. We present an exemplary case, illustrating this plausible connection. We then assess the association of more frequent stimulation with SD in a larger group of subjects with various acute neurological injuries. Finally, we assess the temporal priority of stimulation with subsequent SD. These data, coupled with published mechanistic plausibility[4] assess the key causality factors regarding whether patient stimulation can induce SD (PS-SD). Our observations could serve as a possible mechanistic explanation for the findings of worse outcomes with mobilization and suggest new targeted therapeutic approaches such as limiting stimulation during SD vulnerable times.
RESULTS
Exemplary case with clinical stimulation increasing the risk of subsequent SD
A 29-year-old female presented with a left carotid occlusion related to cervical dissection with an NIH stroke scale score of 22. IV rt-PA was administered at 3h30min from last know well (LKW). She was then taken for mechanical thrombectomy which was complicated due to need for multiple stent-retriever passes and cervical stent placement. A TICI (thrombolysis in cerebral infarction) 2b revascularization was achieved at 5h39min from LKW. She nonetheless still developed a large area of infarct in the left hemisphere with early signs of herniation and so a decompressive craniectomy was performed. She was enrolled in the current study (UNM HRPO 10-159), allowing for intra-operative placement of a subdural electricorticography (ECoG) recording electrode in a cortical region adjacent to the infarct core. She remained minimally responsive with a poor neurological exam and so was monitored with continuous EEG. Per protocol, the ECoG data were not reviewed for SD during the monitoring time, but was used to guide seizure management. The electrode strip was removed at bedside after approximately 5 days of monitoring when the neurological examination began to improve. She was eventually discharged to inpatient rehabilitation. Her 90-day modified Rankin Scale (mRS) was 4 with residual hemiparesis and aphasia. At 2 years, her mRS had improved to 3 with mild residual aphasia and significant hemiparesis, but is ambulatory and able to take care of her own affairs.
Review of ECoG data revealed that 40 recurrent SDs were detected by the electrode strip during the acute post-operative days (Fig 1A). A significant, repeating association of standard clinical stimulation and SD was noted, with an approximately 9-minute latency between stimulation and SD (Fig. 1B). We used logistic regression to estimate the risk of SD after clinical stimulation. For each minute, we found that stimulation significantly increased the odds of SD being measured 9 minutes later (OR= 2.85, 95% CI= 1.5-5.37, 5536 observations) (Fig 1C). Manual ECoG review indicated that the first measurement site of SD consistently occurred in electrode lead 6 (Fig 1A). Using the known propagation rate of SD as ~3mm/min[17,18], we sought to determine if a potential initiation site would be in regions that would be activated by patient stimulation. A rough estimate of the distance traveled by SD in 9 minutes would thus be 27mm and this distance was mapped onto a fused image of the CT demonstrating the electrode strip location with the pre-operative MRI, demonstrating the anatomical location (Fig 1D). We recognize that this does not consider the complex gyriform geometry of the cortex, so serves only as a rough estimate which could overestimate the linear distance. However, this plausible region of initiation very reasonably includes both the sensory cortex, motor cortex, and supplemental motor area (SMA). This is particularly relevant in that SMA is known to have bilateral input[19] and would be expected to be activated during many types of patient stimulation. The SMA is represented in a relatively large cortical region anterior to the motor cortex, so even if the proposed initiation site is closer to the electrode due to complex SD propagation patterns, it would still be within the SMA.
Figure 1: Exemplary case illustrating patient stimulation associated with SD and subsequent infarct expansion.

See text for detailed clinical explanation A) Example SD on ECoG tracing. There was a stimulation event (examination and suction) 9 minutes prior to the SD, which was confirmed both by artifact on ECoG (larger black arrow) and review of the video recordings at that time (photo inset showing bedside nurse examining patient). These traces are referential recordings from the 1x6 electrode strip. Standard 0.5-50Hz high frequency data are shown in black (±800μV) with the near DC (0.05Hz high pass filter) shown in red (±6mV). The characteristic SD (small arrow) is seen in the red recordings traveling from electrode 6 to 5 with associated “depression” of the high frequency activity in the black recordings. There is baseline suppressed activity in electrodes 2-4 due to proximity to the infarct core and very slow recovery of leads 5 and 6, indicating the highly compromised nature of this region. B) Correlation of stimulation and SD across the entire dataset. Introducing negative lag allows for “correction” of proposed latency from initiation to detection on the electrode. There is a notable peak at 9 minutes indicating that the highest association between stimulation and SD occurs if the SD dataset is shifted 9 minutes negatively. C) Using the proposed latency of 9 minutes, logistic regression was used to calculate the Odds of SD 9 minutes after stimulation, which was significant (OR= 2.85, 95% CI= 1.5-5.37, 5536 observations). D) Merged pre-operative T2 weighted MRI with immediate post-operative CT. This allows visualization of the anatomic relationship between the electrode strip (Lead 5 and Lead 6 labeled) and the central sulcus. Supplemental motor area (SMA), motor cortex (MC), and somatosensory cortex (SSC) are labeled. In 9min, SD would propagate linearly 27mm so a rough potential initiation site was hypothesized as the white translucent shaded region. The electrodes from the subdural ECoG strip corresponding to the traces in panel 1 are labeled. E) Merged pre-operative Diffusion weighted MRI and immediate post-operative CT shows the relationship of the electrode strip to the infarct core, with the strip located at the margin of the infarct core. This places the white shaded hypothesized initiation zone within presumed peri-infarct penumbra. F) Infarct expansion at one-week noted with consolidation and expansion of hypodensity on the CT scan (white arrows). The infarct volume was also quantified, demonstrating a notable increase in infarct volume between the pre-monitoring and post-monitoring imaging (graph inset).
We then sought to determine if it would be expected that this proposed initiation sone would be anatomically located within vulnerable penumbra. The diffusion weighted MRI was therefore fused with the post-operative CT, demonstrating that the edge of the core infarct was extending into the anterior part of the SMA, strongly suggesting that this region would be vulnerable penumbra. Finally, infarct volume was measured using semi-automated segmentation[20] segmentation between the initial MRI and the CT one week later after removal of the recording electrode. There was a marked increase in final infarct volume, nearly doubling (244cc to 416cc) (Fig 1D).
This case illustrates all of the core principles of our hypothesis that patient stimulation may induce SD due to cortical activation in vulnerable penumbra. In turn, these recurrent SD would be expected, based on previous data[4,9] to cause ongoing metabolic stress in compromised tissue, leading to infarct expansion (Fig. 2). We sought to rigorously test this hypothesis across a larger group of patients with stroke and brain injury in order to determine if these associations and temporal relationships between stimulation and SD are generalizable.
Figure 2: Proposed mechanism for patient stimulation induced SD (PS-SD).

Patients with compromised brain from stroke penumbra, delayed cerebral ischemia after aneurysmal subarachnoid hemorrhage, or traumatic injury may be susceptible to PS-SD. Such SD may result in expansion of regions of ischemia into compromised brain.
Demographics and scoring reliability
Recordings and analyses were made from 13 subjects:
2 with malignant hemispheric stroke (MHS), 8 with aneurysmal subarachnoid hemorrhage (aSAH), and 3 with severe TBI. Five additional subjects had complete data sets (scored SD and video data), however these did not have overlapping times of video and ECoG data that contained more than 1 SD. Subject demographics and outcomes are summarized in Table 1. All subjects had >48h of recordings with both ECoG and video recordings. Total SD counts in individual subjects ranged from 2-103. Interobserver reliability testing for stimulation scoring on video (any stim versus no stim) between two independent reviewers demonstrated a median Kappa statistic of 0.78 across included subjects (standard deviation= 0.06, range= 0.70-0.92).
Table 1: Subject Demographics and outcomes.
MHS=malignant hemispheric stroke, SAH= subarachnoid hemorrhage, TBI= traumatic brain injury, GCS= Glasgow coma scale score, WFNS= world federation of neurosurgical societies SAH grading system, mRS= modified Rankin score, SD= spreading depolarization, ISD= isoelectric spreading depolarization, - = factors only relevant to SAH.
| Subject | Sex | Age | Admission GCS |
Admission WFNS |
90day mRS |
Angiographic Vasospasm |
Recording time (h:m)* |
SD count |
SD rate per hour |
SD or ISD |
|---|---|---|---|---|---|---|---|---|---|---|
| MHS 1 | F | 34 | 6 | - | 4 | - | 93:34 | 40 | 0.43 | SD and ISD |
| MHS 2 | M | 29 | 12 | - | 3 | - | 143:20 | 103 | 0.72 | SD |
| SAH 1 | M | 55 | 7 | 4 | 1 | None | 184:41 | 10 | 0.05 | SD and ISD |
| SAH 2 | F | 47 | 15 | 1 | 2 | Severe | 113:23 | 13 | 0.12 | SD |
| SAH 3 | M | 53 | 7 | 4 | 6 | None | 52:48 | 7 | 0.26 | SD |
| SAH 4 | F | 69 | 15 | 1 | 4 | None | 352:05 | 23 | 0.07 | SD and ISD |
| SAH 5 | F | 54 | 15 | 2 | 2 | None | 136:18 | 2 | 0.01 | SD |
| SAH 6 | F | 68 | 14 | 3 | 2 | Moderate | 168:02 | 6 | 0.04 | SD and ISD |
| SAH 7 | F | 53 | 15 | 1 | 6 | Severe | 156:28 | 3 | 0.02 | SD |
| SAH 8 | F | 57 | 9 | 4 | 6 | None | 160:14 | 10 | 0.06 | SD and ISD |
| TBI 1 | M | 39 | 3 | - | 2 | - | 164:42 | 57 | 0.35 | SD and ISD |
| TBI 2 | M | 74 | 11 | - | 4 | - | 90:31 | 5 | 0.06 | SD and ISD |
| TBI 3 | M | 70 | 14 | - | 2 | - | 134:12 | 11 | 0.08 | SD and ISD |
Association of SD with increased stimulation frequency
Descriptive analysis:
Comparing the frequency distribution between 60-minute bins containing SD versus those without SD demonstrates a significant shift toward more patient stimulation in bins with more SD (Fig. 3). In Fig. 3A, this rightward shift in the frequency distribution of bins containing SD primarily emphasizes the lower proportion of bins with very low frequency of patient stimulation (0 or 1) in bins with SD compared to bins without SD (Kolmogorov-Smirnov test p=0.0010). In order to assess if this difference was limited to a shift in low frequencies of stimulation, we also displayed the relative frequency of bins across the distribution of touch frequencies (Fig. 3B). This display emphasizes that there are more bins with SD with higher touch frequency. Note specifically that the SD bins (blue) have a larger relative frequency for nearly every touch number >5 compared to No SD bins (orange) (Fig. 3B).
Figure 3: More frequent stimulation is associated with SD.

Cumulative (A) and relative (B) frequency distributions of 60-minute bins with SD (blue) and without SD (orange) are shown as a function of frequency of stimulation in each one-hour bin. There is a significant (p=0.0010) shift in the overall curve, indicating that the distribution of SD bins is dissimilar to the distribution of no SD bins. This effect appears to be driven both by fewer SD bins with zero stimulation as well as more SD bins with more frequent stimulation (10-60 stimulation).
Inferential analysis:
To assess for a possible “dose dependent” effect of patient stimulation, we assessed the odds of SD with increasing stimulation frequency (up to 30) in 60-minute bins. Very high frequencies of stimulation were uncommon (as can be seen in Fig.3), so only values up to 30/hour were assessed. Given that we used a one-minute sampling unit for stimulation scoring, this would correspond to 30 minutes with stimulation in a given one hour bin. The effect of increased stimulation frequency in these non-overlapping 60-minute bins was significantly associated with an increased risk of SD with increasing stimulation frequency (Fig. 4). This risk increased up to a maximum at 16-20 stimulation per hour and remained stable up to 26-30 stimulation per hour. Increasing stimulation was associated with increased risk of SD, particularly in the range of 6-10 stimulation/hour compared to 16-20 stimulation/hour. Data represent pooled analysis across subjects using logistic regression with mixed effect modeling.
Figure 4: Dose dependent effect of increased stimulation frequency on spreading depolarization occurrence.
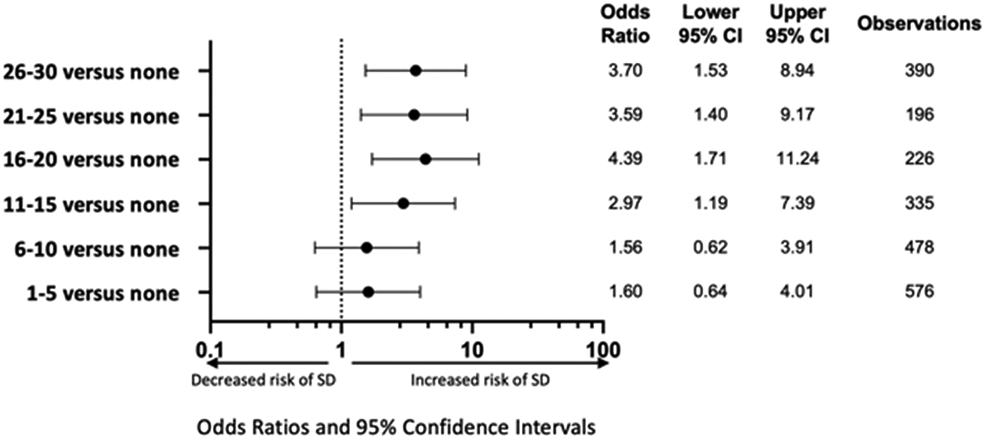
Lower frequency stimulation trended toward increased risk of SD, but increased to a significant, maximum risk of SD at 16-20 minutes with stimulation/ hour. Log Odds Ratio Scale used
Patient stimulation precedes SD
Having established 1) an empirical association between stimulation and SD (Figs. 3 and 4) and 2) a biologically plausible mechanism(Fig. 2 and Reference [4]), we now sought to test the temporal priority of the independent variable (stimulation) in order to support or refute a causal relationship[21,22]. As discussed above (Fig. 1), an important consideration is the slow propagation rate of SD (~3mm/minute[18,17]) and thus the recording electrode may be remote from the initiation site. It would therefore be expected that if stimulation caused SD initiation, that there would be a patient specific, but internally consistent latency of several minutes between stimulation and SD detection.
Descriptive analysis:
First, we assessed for this temporal relationship on an individual patient basis, since location of injury (and relationship to recording strip) varies among the 13 subjects. Our hypothesis was that patient stimulation would be associated with subsequent SD. In order to test this time dependency, we performed correlation analysis after introducing negative “lag” across the entire data stream for each subject. This allowed assessment of a possible latency time to detection of SD if the initiation location was remote from the monitoring electrode (i.e. “correcting” for the slow travel time between SD initiation and measurement, as shown in Fig. 2). Positive lag serves as an internal control to test the null (and biologically implausible) hypothesis that SD would be associated with subsequent patient stimulation. We noted robust effects of patient stimulation with subsequent SD, including in subject MHS1at maximum 9 minutes of lag (also shown graphically in Fig. 1B) and SAH3 at 1 minute of lag (Fig 5A). On pooled analysis, we noted overall increased correlation of stimulation and SD for up to 50 minutes prior to SD, with no similar increased association with shift with positive (control) lag (Fig. 5B). Such a duration would correlate to a propagation distance of up to 15cm, which is consistent with SD observed in previous clinical studies[23,24].
Figure 5: Patient stimulation is associated with subsequent SD.

Cross correlation matrix assessing patient specific correlation across each data set at time zero and with negative and positive lag. Increased correlation with negative lag indicates that patient stimulation precedes SD while increased correlation with positive lag serves as a control. Negative range indicates correlation peaks between stimulation and subsequent SD noted at varying time latencies between subjects (top panel). The higher yellow numbers preceding SD support the hypothesis that there are subject specific “peaks” of correlation that occur in the ~50 minutes preceding SD. The bottom panel represents the averaged data across subjects.
Inferential analysis:
To further assess the temporal priority of patient stimulation on the risk of subsequent SD, the odds of SD in the 60 minutes following stimulation was assessed in each subject and overall (Fig. 6). Overall, in grouped analysis using mixed effect modeling, there was a significantly increased risk of SD after stimulation (OR=1.19, 95% CI= 1.13-1.26). Most subjects demonstrated a positive association of stimulation with subsequent SD. Two notable exceptions were subject MHS2 and SAH7 where a possible inhibitory effect of stimulation on subsequent SD was noted. The implications of these observations are discussed below (Discusion).
Figure 6: Overall increased risk of SD in the next 60 minutes after stimulation compared to no stimulation.
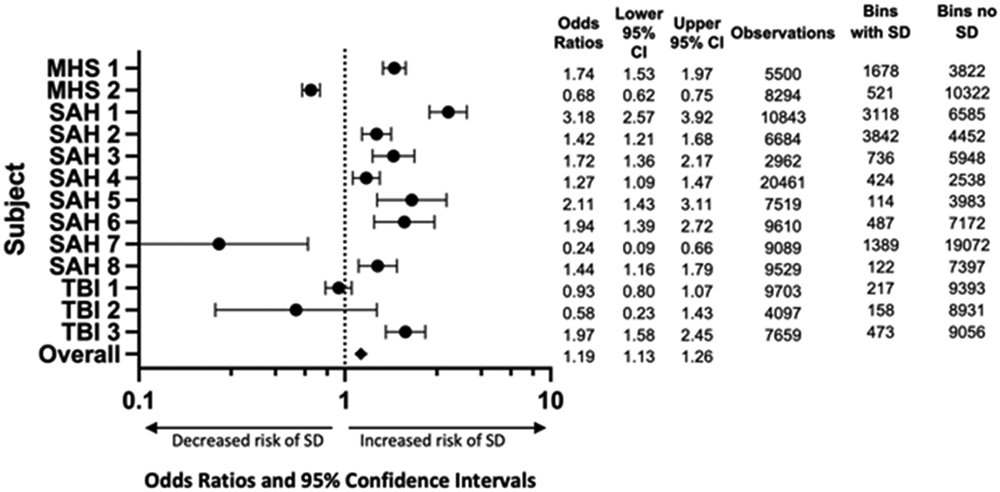
All subjects except for MHS 2, SAH 7, TBI 1, and TBI 2 demonstrated a significant increase in the odds of SD occurring within the next 60 minutes after stimulation. Overall assessment with mixed effect modeling demonstrated a significant overall risk of SD. Log Odds Ratio scale used.
Effects of type of stimulation on SD
In order to assess whether different subtypes of patient stimulation had different magnitudes of effect, we repeated a similar assessment as above, focusing only on individual types of stimulation. See Table 2 for summary of different stimulation types. “Positioning” (e.g. turning, boosting up in bed, changing to sitting position, etc.) exerted the strongest effect on risk of subsequent SD with an OR of 4.92 (95%CI=3.74-6.47). “Light touch” (e.g. isolated hand holding, etc.) also demonstrated a significant effect with an OR of 1.59 (95% CI= 1.46-1.74). “Suctioning” trended in the same direction with an OR of 1.68 (95% CI= 0.28-10.06) but was not significant due to wide confidence intervals, possibly due to the lower number of observations of this type of patient interaction. Finally, we wanted to determine if there was a different effect of contralateral versus ipsilateral isolated light touch. While both were significantly associated with SD, surprisingly the effect of ipsilateral touch was stronger than contralateral touch (respectively OR= 1.98, 95% CI=1.76- 2.23 and OR=1.28, 95%CI= 1.12-1.46). The reason for this result is unclear, but it is possible that if more proximal signaling pathways are interrupted by stroke then the direct sensory pathways would not be in continuity to the cortex. Contralateral cortical stimulation with cross-hemispheric signaling through the SMA or other association areas could therefore be the mechanism for the significant effect of ipsilateral touch inducing SD. Overall the prominent effect of positioning, however, is the most notable finding in this analysis, as this would be the type of stimulation most closely related to “mobilization” as practiced in the AVERT II clinical trial[12].
Table 2: Effect of different subtypes of stimulation on spreading depolarization.
Odds ratios refer to the risk of SD in the next 60 minutes in minutes where two reviewers agreed on the stimulation subtype compared to no stimulation (both reviewers scored “no stimulation”).
| Stimulation type | Odds Ratios of SD | Lower 95% CI | Upper 95% CI |
|---|---|---|---|
| Positioning | 4.92 | 3.74 | 6.47 |
| Suctioning | 1.68 | 0.28 | 10.06 |
| Any Light Touch | 1.59 | 1.46 | 1.74 |
| Contralateral Light Touch | 1.28 | 1.12 | 1.46 |
| Ipsilateral Light Touch | 1.98 | 1.76 | 2.23 |
DISCUSSION
Our results show that in subjects with acute neurological injuries who require craniotomy, touch and other physical stimulation is associated with increased risk of subsequent SD. Our data also support a causal relationship of PS-SD based on accepted criteria for causal inference[21,22], most prominently, 1) association, 2) time dependency, and 3) a biologically plausible mechanism. Our observations provide the first test in human subjects of a hypothesis proposed from a preclinical study in mice[4] and provides strong mechanistic observational data to question the safety of aggressive early stimulation and mobilization practices in specific patient populations with acute neurological injuries. Further, our observations are consistent with SD as a mechanism of delayed ischemia which has been well established in pre-clinical models[4,25,9]. In addition, RCTs of very early mobilization suggest that such practices can result in worse neurological outcomes and larger infarct burden [5,13,12]. For these reasons, we agree with a recent systematic review[5] arguing for caution with early aggressive stimulation in patients with severe acute neurological injuries at risk of ischemia, until the safety of such practices can be better established.
The proximate mechanism of SD initiation in PS-SD is presumed to be related to supply-demand mismatch[4]. Specifically, when focal regions with impaired metabolic reserve (such as ischemic penumbra) are subjected to the increased demand of cortical activation with stimulation, the expected local vasodilatory response is absent[26,4]. Similarly hyperthermia (which also results in increased metabolic demand) has also been associated with increased risk of SD[27]. In addition to metabolic compromise and impaired neurovascular coupling, other factors such as local blood brain barrier disruption[28] and decreased levels of nitric oxide [29] may also lower the threshold for initiation of SD[28].
Some hypotheses can be generated regarding which patients may be most at risk for PS-SD based on mechanisms and patterns of SD in pre-clinical and clinical studies. SD has been detected nearly universally after acute ischemic stroke, in the majority of severe aneurysmal subarachnoid hemorrhage patients, and in around half of intracerebral hemorrhage and traumatic brain injury patients[30,9]. Some degree of tissue damage or stroke is probably a prerequisite for SD in these cases[31]. The time course of SD is particularly important, with an initial spike in the frequency of SD typically occurring at the time of injury followed by a delayed secondary peak occurring over days to weeks[32,33]. Previous studies have suggested that this represents a secondary phase where therapeutic intervention targeting SD may be of benefit[33], however our data supports the possibility that this may also represent a secondary vulnerable period to PS-SD in patients with ongoing regions of penumbra or compromised brain. Clinically, such delayed injury phases correlate well with the swelling noted after large ischemic strokes[34], edema progression after TBI and ICH[35], and “vasospasm” or delayed cerebral ischemia observed after aneurysmal subarachnoid hemorrhage[36]. All of these phenomena may plausibly be explained by the effects of recurrent SD[37]. In our analyses, we identified example subjects with each of these injury types with PS-SD, suggesting that this phenomenon is not limited to ischemic stroke.
The type and degree of stimulation also deserves consideration. While the preclinical study by Von Bornstadt[4] provides a model emphasizing a narrow window of ischemia being the key determinant of SD generation, we suggest that the clinical relevance of this is much more complicated. While some cortical regions such as the somatosensory or calcarine cortex have been proposed as more vulnerable to SD based on the neuronal density[38], in ischemia, it is plausible that any region with the appropriate supply-demand mismatch of ischemia and excitation could be at risk of PS-SD. We illustrate this in an exemplary patient who may have had sensorimotor stimulation within a known ischemic region with appropriate latency to SD detection with a possible SMA or sensorimotor initiation site. In addition, if visual, auditory, or other association regions are stimulated and have an appropriate degree of ischemia, it is possible that SD may be induced in other regions as well. This could have implications for common clinical activities such as pupillary light reflex examination, television, neurologic assessment and other non-tactile stimuli. Supporting this hypothesis, we found that patient positioning was the most robust subtype of patient interaction we assessed, which would be expected to be a more prolonged and diffuse cortical activation compared to isolated light touch given that such interventions typically involve stimulation over at least many minutes. Ischemia in aSAH and TBI patients can occur in patchy and variable regions, and thus we were not able to directly hypothesize a potential cortical stimulation site within an ischemic region (as the in the case in Fig.1), however we identified significant associations of stimulation and SD in more than half of our aSAH and TBI subjects.
While these data appear consistent with a hypothesized pre-clinical physiology and separate clinical trials which failed to demonstrate safety of very early mobilization, there are limitations to our study. SD was only assessed in a small cortical region at the site of the electrode strip and so it is possible that additional unmeasured PS-SD or stronger associations could be present in some subjects. We also did not have a method to assess for regional areas of ischemia or changes in ischemic risk over the observation time (such as development of DCI in aSAH). Further studies with perfusion imaging or focal probes in high-risk regions may be of benefit. The type of stimulation we observed may also under-estimate true stimulation occurring in the complex ICU environment. Other sources such as auditory or visual stimulation (for example if the television was on) could not be accounted for with the video analysis. All these critiques however, suggest that we actually may be underestimating the true magnitude of PS-SD. On the other hand, we acknowledge that these data focus on a heterogeneous but high-risk group, all of whom required surgical treatment. While this diverse patient population supports the hypothesis that this is a generalizable mechanism may be present across several disease types, it is unknown if PS-SD are present in cases of minor or subcortical stroke or less severe aSAH cases without large hematomas that are typically treated endovascularly in modern practice. Finally, though positioning events may be the most similar to the type of mobilization in AVERT II, the AVERT II mobilization included sitting, standing, and walking at least three times per day. These clinical interventions were probably even more stimulating than the repositioning events in our subjects.
Finally, the data suggesting a possible protective effect of stimulation in two subjects deserves brief attention. Physiologically, this seems plausible, given that in some regions with adequate perfusion, somatosensory stimulation could increase blood flow[7]. Further, mounting data suggest that the harmful effects of SD may be most prominent in metabolically compromised tissue, while could theoretically have protective mechanisms remote from the injury and ischemia[39]. Additional studies coupling perfusion measurements with ECoG could help determine if there are some subjects where stimulation increases local tissue perfusion.
These observations have significant and concerning implications for standard practices in the care of patients with neurological injuries. While large scale practice changes should not be made based on small case series, our observations are supported by strong pre-clinical and clinical data regarding ischemic progression mechanisms as well as pragmatic trials which resulted in a call for caution in early mobilization of ischemic stroke patients. It therefore seems prudent at the very least, for clinicians to express some degree of uncertainty regarding the safety of early frequent stimulation in acute stroke and brain injury patients if not medically necessary for clinical care. Further mechanistic, clinical, and outcome data are urgently needed to assess the implications of the current study for acute neurological care and determine if targeted pharmacologic approaches[40,41] could minimize such risk.
MATERIALS AND METHODS
Study population:
Subjects were prospectively enrolled in an observational study focused on the role of SD in acute neurological injuries using previously published criteria[42]. (UNM HRPO 10-159) Informed consent from the patient or legally authorized representative was obtained for all subjects, which included discussion of the nature of the study and possible consequences. Briefly, inclusion criteria were any adult patient undergoing craniotomy or craniectomy for hemorrhagic or ischemic stroke (including aneurysm rupture) or traumatic brain injury (TBI) who were expected to require at least 72 hours of neuro-intensive care monitoring. Consent was sought prospectively from a legally authorized representative in most cases (unless the subject themselves were able to consent). Some of these subjects also underwent continuous EEG monitoring at the clinical discretion of the neuro-intensivist and neurosurgeon, and this was considered a second inclusion criteria for the current analysis.
ECoG and VideoEEG recordings:
The methodology for recording and analysis of ECoG for SD has been published[42]. Briefly, at the conclusion of the intradural portion of the procedure, a 1x6 subdural platinum recording electrode (Auragen, IntegraLife: Plainsboro, NJ) was placed over the region thought to be at highest risk of injury expansion (for example, adjacent to infarct in MHS and in the region at highest risk of vasospasm after aneurysm clipping). After return to the ICU, ECoG was recorded using a full spectrum DC coupled amplifier[43]. DC ECoG was reviewed post hoc. In all subjects, continuous standard EEG and ECoG recordings with video were also collected. Video EEG recording and management was performed using standard 10-20 EEG montage and AC coupled amplifier with at least daily review by a board certified epileptologist. These data were used to guide care regarding antiseizure medications if required. The strip electrode was then removed at the bedside using gentle traction, similar to a surgical drain, when further invasive monitoring was no longer thought to be needed by the critical care team.
SD and stimulation scoring:
SD was scored offline after data collection was complete – it was not incorporated into clinical management so as not to introduce any potential bias. The EEG analysis described above incorporates the high frequency ECoG data, however it is not possible to assess for SD using these data. Separate ECoG recordings were acquired using a full spectrum DC amplifier coupled with the Component Neuromonitoring System (Moberg ICU solutions: Ambler PA) and archived in a hospital server. Data were exported to LabChart (ADInstruments: Colorado Springs, CO) for formal scoring using standardized approaches and criteria[42] with scoring by expert reviewers (APC and CWS). SD was defined as a DC shift, usually with associated transient depression of high frequency (0.5-50Hz) filtered data unless occurring on a baseline of suppressed activity (which was then defined as isoelectric spreading depolarization [ISD]). In addition, spread to adjacent electrodes and stereotypical repeating patterns[44] are additional criteria to aid in scoring. Only subjects with >1 SD were included for further analysis. SD times were then exported in spreadsheet files for each subject to a central server.
Continuous video recordings used for EEG were then reviewed by a separate panel of reviewers. Each file was reviewed in its entirety by two independent reviewers with no knowledge of the SD scoring and no EEG interpretation experience (to ensure that no EEG findings would be incorporated into the video review). The video files were reviewed continuously for the entire monitoring period at up to 20x playback speed. Scoring was performed on a minute by minute basis and scored as to valid video recording (yes/no) and stimulation versus no stimulation. Stimulation was further divided into light touch (ipsilateral/ contralateral), suctioning, positioning, or other interventions. Scoring was assessed for inter-rater reliability using the kappa statistic. Stimulation scoring was combined into a single column where both raters agreed on touch and touch type to ensure the highest standard of rigor.
SD and video files for each subject were then linked into continuous time-series files. Data were reviewed for accuracy and continuity of monitoring start and stop dates and times to ensure standardization between data sets. Absent data was recorded as NaN to maintain continuity of the time series. See Fig. 7 for summary of the data acquisition and linking.
Figure 7: Data sources.

Electrocorticography (ECoG) was recorded with subdural 1x6 electrode placed at the time of clinically indicated craniotomy or craniectomy. ECoG recorded using a full spectrum DC amplifier (Moberg CNS). Spreading Depolarizations (SD) scored offline using standard criteria of characteristic DC shift with associated suppression of high frequency activity, typically propagating to adjacent electrodes. All subjects were also recorded with multi-day, continuous video EEG recordings for clinical seizure evaluation using a separate machine. These video files were manually reviewed by two separate reviewers blinded to the ECoG scoring in one-minute bins as stimulation versus no stimulation. Data streams were then linked based on time of day, which was synced between systems.
Illustrative case methods:
After standard clinical data were extracted, additional image analysis was performed. Infarct volumes were extracted using semi-automated segmentation (ITK SNAP 3.8.0[20]). The pre-operative MRI with diffusion weighted (DWI) sequence was used for the baseline measurement and the first head CT performed the day after strip electrode removal was used for the final measurement. These measurements were used for descriptive purposed only. In order to assess the anatomic relationship of the strip electrode to both cortical structures and to the infarct, the pre-operative MRI (DWI) and T2 sequences were used. Image fusion was performed using automated software (StealthStation S7, Medtronic: Minneapolis, MN) and validated with manual review. DICOM measurement references were preserved in order to perform subsequent distance measurements.
Analysis and statistics:
No formal power analysis or sample size was conducted as the ability to detect any effect within subjects or between subjects was entirely unknown. We limited the sample to the subjects enrolled prior to separate efforts that incorporate SD analysis into clinical management of patients, so that there would be no potential confounding effect of medications being tested for SD[40,41] or of clinical interventions targeting SD[45].
Multiple potential confounders exist in testing our hypothesis that stimulation could trigger SD[4]. Specific concerns include the fact that the position of the electrode strip relative to either a vulnerable region or a potential initiation site are unknown. Due to the this, the predicted latency from initiation to measurement is unknown, even if a strong association exists. In addition, we expected that more stimulation duration (i.e. more stimulation in a certain interval) would be necessary as compared to isolated stimulation. For all these reasons, we used multiple methods to try to prove or disprove our hypothesis.
First, we assessed the overall proportion of 60-minute bins that contained at least one SD and compared the number of manipulations within those bins. Since we used a one-minute sampling period, this can also be thought of as assessing the number of minutes with at least some type of manipulation. These were non-overlapping consecutive bins. Only bins with complete data for both variables were included. These two frequency distributions were compared using the Kolmogorov-Smirnov two sample test. This approach was performed to assess whether more frequent stimulation was associated with increased risk of SD. In the study by Von Bornstadt[4], SD was only initiated after several minutes of continuous stimulation. The effect of more stimulation burden would be expected to have a larger impact compared to more isolated stimulation events.
In order to attempt to generate an inference of the effect of more manipulation, we used logistic regression to assess the risk of SD with increased frequency of manipulation within non-overlapping 60-minute bins. Mixed effect modeling was used, treating each subject as an independent variable in order to account for bias related to repeated within-subject measures.
In order to assess the possibility of time latency from stimulation to subsequent triggered SD, shifting cross-correlation analysis was performed. For each subject, the time series data manipulation stream (video scoring) was lagged in one-minute intervals and the correlation between SD and stimulation at that latency was assessed. Shifting the SD in the negative direction would “correct” for a possible latency from stimulation to subsequent, triggered SD only if they occurred in a predictable, repeating pattern after stimulation. Shifting in the positive direction serves as an internal control (i.e. ruling out that any association could be due to SD occurring before stimulation). We assessed the Pearson correlation coefficient per subject and overall for each shifted interval and displayed the results using a heat map.
This approach provided relevant descriptive data in order to perform subsequent inferential assessment. Given that the effect of increased correlation appeared to last for nearly one hour (Fig. 3), we chose this time as a reasonable sampling time to determine whether there was an increased risk of SD after stimulation. For each subject we used each minute of data and determined if there was stimulation versus no stimulation (independent variable). For each minute, we then assessed the risk of SD (dependent variable) in the subsequent 60 minutes using logistic regression. Though inter-observer reliability was very good, we sought to further increase the rigor of this approach by assessing only stimulation times that were scored by both reviewers compared to times scored as no stimulation by both reviewers. In other words, the discordant times were not factored into this analysis. This still left >2000 observations in all subjects due to the prolonged monitoring times. To combine data between subjects, we used mixed effect modeling. Using this approach, we can assess whether or not there is an increased risk of SD after stimulation compared to no stimulation and also assess the weather stimulation could be protective against subsequent SD.
In order to assess the effects of individual subtype of stimulation, the types of stimulation as assessed above were reviewed. In order to be the most restrictive of subtype, we considered only times when both reviewers scored the stimulation subtype. As above, we performed logistic regression for each minute to assess the risk of SD in the following 60 minutes using mixed effect modeling. In this analysis, we only assessed homogeneously scored subtype versus no stimulation. For example “both reviewers scored suction versus no stimulation”. We repeated this analysis for “positioning”, “suction”, “any light touch”, “ipsilateral light touch”, and “contralateral light touch” (both of these relative to the side of the electrode strip and craniotomy.)
Data handling and display was performed with MatLab (vR2020b). Statistical analysis was performed using SAS (v9.4).
Acknowledgments:
General:Kevin K Wilson, Adarsh Vangala, Breannan Howell, Saul Fernandez, Emma Brandt, and Zainab Cheema for video scoring. Li Luo and Mark Krasberg for developmental statistical analysis Yiliang Zhu, Richard A Campbell for advisory support. Medical Illustration by Yvonne Wylie Walston.
Funding:
National Institutes of Health grant P20 GM109089 (APC, CWS); National Institutes of Health grant NS 102978, 104742 (KCB)
Footnotes
Competing interests: Authors declare that they have no competing interests.
Data and materials availability: Data available upon reasonable request, subject to institutional and IRB oversight policies
References and Notes:
- 1.Watt JA, Goodarzi Z, Veroniki AA, Nincic V, Khan PA, Ghassemi M, Lai Y, Treister V, Thompson Y, Schneider R, Tricco AC, Straus SE (2021) Comparative efficacy of interventions for reducing symptoms of depression in people with dementia: systematic review and network meta-analysis. BMJ 372:n532. doi: 10.1136/bmj.n532 [DOI] [PMC free article] [PubMed] [Google Scholar]
- 2.Jabre P, Belpomme V, Azoulay E, Jacob L, Bertrand L, Lapostolle F, Tazarourte K, Bouilleau G, Pinaud V, Broche C, Normand D, Baubet T, Ricard-Hibon A, Istria J, Beltramini A, Alheritiere A, Assez N, Nace L, Vivien B, Turi L, Launay S, Desmaizieres M, Borron SW, Vicaut E, Adnet F (2013) Family presence during cardiopulmonary resuscitation. N Engl J Med 368 (11):1008–1018. doi: 10.1056/NEJMoa1203366 [DOI] [PubMed] [Google Scholar]
- 3.Zhang L, Hu W, Cai Z, Liu J, Wu J, Deng Y, Yu K, Chen X, Zhu L, Ma J, Qin Y (2019) Early mobilization of critically ill patients in the intensive care unit: A systematic review and meta-analysis. PLoS One 14 (10):e0223185. doi: 10.1371/journal.pone.0223185 [DOI] [PMC free article] [PubMed] [Google Scholar]
- 4.von Bornstadt D, Houben T, Seidel JL, Zheng Y, Dilekoz E, Qin T, Sandow N, Kura S, Eikermann-Haerter K, Endres M, Boas DA, Moskowitz MA, Lo EH, Dreier JP, Woitzik J, Sakadzic S, Ayata C (2015) Supply-Demand Mismatch Transients in Susceptible Peri-infarct Hot Zones Explain the Origins of Spreading Injury Depolarizations. Neuron 85 (5):1117–1131. doi: 10.1016/j.neuron.2015.02.007 [DOI] [PMC free article] [PubMed] [Google Scholar]
- 5.Langhorne P, Collier JM, Bate PJ, Thuy MNT, Bernhardt J (2018) Very early versus delayed mobilisation after stroke. Cochrane Database of Systematic Reviews (10). doi:ARTN CD006187 10.1002/14651858.CD006187.pub [DOI] [PMC free article] [PubMed] [Google Scholar]
- 6.Frostig RD, Lay CC, Davis MF (2013) A rat's whiskers point the way toward a novel stimulus-dependent, protective stroke therapy. Neuroscientist 19 (3):313–328. doi: 10.1177/1073858412462607 [DOI] [PMC free article] [PubMed] [Google Scholar]
- 7.von Bornstadt D, Gertz K, Lagumersindez Denis N, Seners P, Baron JC, Endres M (2018) Sensory stimulation in acute stroke therapy. J Cereb Blood Flow Metab 38 (10):1682–1689. doi: 10.1177/0271678X18791073 [DOI] [PMC free article] [PubMed] [Google Scholar]
- 8.Leao AAP (1944) Spreading depression of activity in the cerebral cortex. Journal of Neurophysiology 7 (6):359–390 [DOI] [PubMed] [Google Scholar]
- 9.Hartings JA, Shuttleworth CW, Kirov SA, Ayata C, Hinzman JM, Foreman B, Andrew RD, Boutelle MG, Brennan KC, Carlson AP, Dahlem MA, Drenckhahn C, Dohmen C, Fabricius M, Farkas E, Feuerstein D, Graf R, Helbok R, Lauritzen M, Major S, Oliveira-Ferreira AI, Richter F, Rosenthal ES, Sakowitz OW, Sanchez-Porras R, Santos E, Scholl M, Strong AJ, Urbach A, Westover MB, Winkler MK, Witte OW, Woitzik J, Dreier JP (2017) The continuum of spreading depolarizations in acute cortical lesion development: Examining Leao's legacy. J Cereb Blood Flow Metab 37 (5):1571–1594. doi: 10.1177/0271678X16654495 [DOI] [PMC free article] [PubMed] [Google Scholar]
- 10.Dreier JP, Lemale CL, Kola V, Friedman A, Schoknecht K (2018) Spreading depolarization is not an epiphenomenon but the principal mechanism of the cytotoxic edema in various gray matter structures of the brain during stroke. Neuropharmacology 134 (Pt B):189–207. doi: 10.1016/j.neuropharm.2017.09.027 [DOI] [PubMed] [Google Scholar]
- 11.Mestre H, Du T, Sweeney AM, Liu G, Samson AJ, Peng W, Mortensen KN, Staeger FF, Bork PAR, Bashford L, Toro ER, Tithof J, Kelley DH, Thomas JH, Hjorth PG, Martens EA, Mehta RI, Solis O, Blinder P, Kleinfeld D, Hirase H, Mori Y, Nedergaard M (2020) Cerebrospinal fluid influx drives acute ischemic tissue swelling. Science 367 (6483). doi: 10.1126/science.aax7171 [DOI] [PMC free article] [PubMed] [Google Scholar]
- 12.group ATC (2015) Efficacy and safety of very early mobilisation within 24 h of stroke onset (AVERT): a randomised controlled trial. Lancet 386 (9988):46–55. doi: 10.1016/S0140-6736(15)60690-0 [DOI] [PubMed] [Google Scholar]
- 13.Bernhardt J, Borschmann K, Collier JM, Thrift AG, Langhorne P, Middleton S, Lindley RI, Dewey HM, Bath P, Said CM, Churilov L, Ellery F, Bladin C, Reid CM, Frayne JH, Srikanth V, Read SJ, Donnan GA, Group ATC (2020) Fatal and non-fatal events within 14 days after early, intensive mobilization post stroke. Neurology. doi: 10.1212/WNL.0000000000011106 [DOI] [PMC free article] [PubMed] [Google Scholar]
- 14.Kwakkel G (2015) Very early mobilisation within 24 hours of stroke results in a less favourable outcome at 3 months [commentary 2]. J Physiother 61 (4):220. doi: 10.1016/j.jphys.2015.07.012 [DOI] [PubMed] [Google Scholar]
- 15.Luft AR, Kesselring J (2016) Critique of A Very Early Rehabilitation Trial (AVERT). Stroke 47 (1):291–292. doi: 10.1161/Strokeaha.115.010483 [DOI] [PubMed] [Google Scholar]
- 16.Barer D, Watkins C (2015) Could upright posture be harmful in the early stages of stroke? Lancet 386 (10005):1734. doi: 10.1016/S0140-6736(15)00691-1 [DOI] [PubMed] [Google Scholar]
- 17.Cui Y, Kataoka Y, Li QH, Yokoyama C, Yamagata A, Mochizuki-Oda N, Watanabe J, Yamada H, Watanabe Y (2003) Targeted tissue oxidation in the cerebral cortex induces local prolonged depolarization and cortical spreading depression in the rat brain. Biochem Biophys Res Commun 300 (3):631–636. doi:S0006291X02029066 [pii] [DOI] [PubMed] [Google Scholar]
- 18.Aiba I, Carlson AP, Sheline CT, Shuttleworth CW (2012) Synaptic release and extracellular actions of Zn2+ limit propagation of spreading depression and related events in vitro and in vivo. Journal of neurophysiology 107 (3):1032–1041. doi: 10.1152/jn.00453.2011 [DOI] [PMC free article] [PubMed] [Google Scholar]
- 19.Gao Q, Tao Z, Zhang M, Chen H (2014) Differential contribution of bilateral supplementary motor area to the effective connectivity networks induced by task conditions using dynamic causal modeling. Brain Connect 4 (4):256–264. doi: 10.1089/brain.2013.0194 [DOI] [PMC free article] [PubMed] [Google Scholar]
- 20.Yushkevich PA, Piven J, Hazlett HC, Smith RG, Ho S, Gee JC, Gerig G (2006) User-guided 3D active contour segmentation of anatomical structures: significantly improved efficiency and reliability. Neuroimage 31 (3):1116–1128. doi: 10.1016/j.neuroimage.2006.01.015 [DOI] [PubMed] [Google Scholar]
- 21.Hill AB (1965) The Environment and Disease: Association or Causation? Proc R Soc Med 58:295–300 [DOI] [PMC free article] [PubMed] [Google Scholar]
- 22.Rothman KJ, Greenland S (2005) Causation and causal inference in epidemiology. Am J Public Health 95 Suppl 1:S144–150. doi: 10.2105/AJPH.2004.059204 [DOI] [PubMed] [Google Scholar]
- 23.Hadjikhani N, Sanchez Del Rio M, Wu O, Schwartz D, Bakker D, Fischl B, Kwong KK, Cutrer FM, Rosen BR, Tootell RB, Sorensen AG, Moskowitz MA (2001) Mechanisms of migraine aura revealed by functional MRI in human visual cortex. Proc Natl Acad Sci U S A 98 (8):4687–4692. doi: 10.1073/pnas.071582498071582498 [pii] [DOI] [PMC free article] [PubMed] [Google Scholar]
- 24.Olesen J, Larsen B, Lauritzen M (1981) Focal hyperemia followed by spreading oligemia and impaired activation of rCBF in classic migraine. Annals of neurology 9 (4):344–352. doi: 10.1002/ana.410090406 [DOI] [PubMed] [Google Scholar]
- 25.Dietz RM, Weiss JH, Shuttleworth CW (2009) Contributions of Ca2+ and Zn2+ to spreading depression-like events and neuronal injury. Journal of neurochemistry 109 Suppl 1:145–152. doi: 10.1111/j.1471-4159.2009.05853.x [DOI] [PMC free article] [PubMed] [Google Scholar]
- 26.Kleinfeld D, Mitra PP, Helmchen F, Denk W (1998) Fluctuations and stimulus-induced changes in blood flow observed in individual capillaries in layers 2 through 4 of rat neocortex. Proc Natl Acad Sci U S A 95 (26):15741–15746 [DOI] [PMC free article] [PubMed] [Google Scholar]
- 27.Hartings JA, Strong AJ, Fabricius M, Manning A, Bhatia R, Dreier JP, Mazzeo AT, Tortella FC, Bullock MR (2009) Spreading depolarizations and late secondary insults after traumatic brain injury. J Neurotrauma 26 (11):1857–1866. doi: 10.1089/neu.2009-0961 [DOI] [PMC free article] [PubMed] [Google Scholar]
- 28.Lapilover EG, Lippmann K, Salar S, Maslarova A, Dreier JP, Heinemann U, Friedman A (2012) Peri-infarct blood-brain barrier dysfunction facilitates induction of spreading depolarization associated with epileptiform discharges. Neurobiology of disease 48 (3):495–506. doi: 10.1016/j.nbd.2012.06.024 [DOI] [PMC free article] [PubMed] [Google Scholar]
- 29.Petzold GC, Haack S, von Bohlen Und Halbach O, Priller J, Lehmann TN, Heinemann U, Dirnagl U, Dreier JP (2008) Nitric oxide modulates spreading depolarization threshold in the human and rodent cortex. Stroke 39 (4):1292–1299. doi:STROKEAHA.107.500710 [pii] 10.1161/STROKEAHA.107.500710 [doi] [DOI] [PubMed] [Google Scholar]
- 30.Lauritzen M, Dreier JP, Fabricius M, Hartings JA, Graf R, Strong AJ (2011) Clinical relevance of cortical spreading depression in neurological disorders: migraine, malignant stroke, subarachnoid and intracranial hemorrhage, and traumatic brain injury. Journal of cerebral blood flow and metabolism : official journal of the International Society of Cerebral Blood Flow and Metabolism 31 (1):17–35. doi: 10.1038/jcbfm.2010.191 [DOI] [PMC free article] [PubMed] [Google Scholar]
- 31.Oka F, Hoffmann U, Lee JH, Shin HK, Chung DY, Yuzawa I, Chen SP, Atalay YB, Nozari A, Hopson KP, Qin T, Ayata C (2017) Requisite ischemia for spreading depolarization occurrence after subarachnoid hemorrhage in rodents. J Cereb Blood Flow Metab 37 (5):1829–1840. doi: 10.1177/0271678X16659303 [DOI] [PMC free article] [PubMed] [Google Scholar]
- 32.Hartings JA, Bullock MR, Okonkwo DO, Murray LS, Murray GD, Fabricius M, Maas AI, Woitzik J, Sakowitz O, Mathern B, Roozenbeek B, Lingsma H, Dreier JP, Puccio AM, Shutter LA, Pahl C, Strong AJ (2011) Spreading depolarisations and outcome after traumatic brain injury: a prospective observational study. Lancet neurology 10 (12):1058–1064. doi: 10.1016/S1474-4422(11)70243-5 [DOI] [PubMed] [Google Scholar]
- 33.Dohmen C, Sakowitz OW, Fabricius M, Bosche B, Reithmeier T, Ernestus RI, Brinker G, Dreier JP, Woitzik J, Strong AJ, Graf R (2008) Spreading depolarizations occur in human ischemic stroke with high incidence. Ann Neurol 63 (6):720–728. doi: 10.1002/ana.21390 [DOI] [PubMed] [Google Scholar]
- 34.Baird TA, Parsons MW, Phan T, Butcher KS, Desmond PM, Tress BM, Colman PG, Chambers BR, Davis SM (2003) Persistent poststroke hyperglycemia is independently associated with infarct expansion and worse clinical outcome. Stroke 34 (9):2208–2214. doi: 10.1161/01.STR.0000085087.41330.FF [DOI] [PubMed] [Google Scholar]
- 35.Aarabi B, Hesdorffer DC, Ahn ES, Aresco C, Scalea TM, Eisenberg HM (2006) Outcome following decompressive craniectomy for malignant swelling due to severe head injury. J Neurosurg 104 (4):469–479. doi: 10.3171/jns.2006.104.4.469 [doi] [DOI] [PubMed] [Google Scholar]
- 36.Vergouwen MD, Vermeulen M, van Gijn J, Rinkel GJ, Wijdicks EF, Muizelaar JP, Mendelow AD, Juvela S, Yonas H, Terbrugge KG, Macdonald RL, Diringer MN, Broderick JP, Dreier JP, Roos YB (2010) Definition of delayed cerebral ischemia after aneurysmal subarachnoid hemorrhage as an outcome event in clinical trials and observational studies: proposal of a multidisciplinary research group. Stroke 41 (10):2391–2395. doi: 10.1161/STROKEAHA.110.589275 [DOI] [PubMed] [Google Scholar]
- 37.Dreier JP (2011) The role of spreading depression, spreading depolarization and spreading ischemia in neurological disease. Nature medicine 17 (4):439–447. doi: 10.1038/nm.2333 [DOI] [PubMed] [Google Scholar]
- 38.Bogdanov VB, Middleton NA, Theriot JJ, Parker PD, Abdullah OM, Ju YS, Hartings JA, Brennan KC (2016) Susceptibility of Primary Sensory Cortex to Spreading Depolarizations. J Neurosci 36 (17):4733–4743. doi: 10.1523/JNEUROSCI.3694-15.2016 [DOI] [PMC free article] [PubMed] [Google Scholar]
- 39.Reinhart KM, Shuttleworth CW (2018) Ketamine reduces deleterious consequences of spreading depolarizations. Exp Neurol 305:121–128. doi: 10.1016/j.expneurol.2018.04.007 [DOI] [PMC free article] [PubMed] [Google Scholar]
- 40.Carlson AP, Abbas M, Alunday RL, Qeadan F, Shuttleworth CW (2018) Spreading depolarization in acute brain injury inhibited by ketamine: a prospective, randomized, multiple crossover trial. J Neurosurg:1–7. doi: 10.3171/2017.12.JNS171665 [DOI] [PMC free article] [PubMed] [Google Scholar]
- 41.Carlson AP, Alchbli A, Hanggi D, Macdonald RL, Shuttleworth CW (2020) Effect of Locally Delivered Nimodipine Microparticles on Spreading Depolarization in Aneurysmal Subarachnoid Hemorrhage. Neurocrit Care. doi: 10.1007/s12028-020-00935-1 [DOI] [PubMed] [Google Scholar]
- 42.Dreier JP, Fabricius M, Ayata C, Sakowitz OW, William Shuttleworth C, Dohmen C, Graf R, Vajkoczy P, Helbok R, Suzuki M, Schiefecker AJ, Major S, Winkler MK, Kang EJ, Milakara D, Oliveira-Ferreira AI, Reiffurth C, Revankar GS, Sugimoto K, Dengler NF, Hecht N, Foreman B, Feyen B, Kondziella D, Friberg CK, Piilgaard H, Rosenthal ES, Westover MB, Maslarova A, Santos E, Hertle D, Sanchez-Porras R, Jewell SL, Balanca B, Platz J, Hinzman JM, Luckl J, Schoknecht K, Scholl M, Drenckhahn C, Feuerstein D, Eriksen N, Horst V, Bretz JS, Jahnke P, Scheel M, Bohner G, Rostrup E, Pakkenberg B, Heinemann U, Claassen J, Carlson AP, Kowoll CM, Lublinsky S, Chassidim Y, Shelef I, Friedman A, Brinker G, Reiner M, Kirov SA, Andrew RD, Farkas E, Guresir E, Vatter H, Chung LS, Brennan KC, Lieutaud T, Marinesco S, Maas AI, Sahuquillo J, Dahlem MA, Richter F, Herreras O, Boutelle MG, Okonkwo DO, Bullock MR, Witte OW, Martus P, van den Maagdenberg AM, Ferrari MD, Dijkhuizen RM, Shutter LA, Andaluz N, Schulte AP, MacVicar B, Watanabe T, Woitzik J, Lauritzen M, Strong AJ, Hartings JA (2017) Recording, analysis, and interpretation of spreading depolarizations in neurointensive care: Review and recommendations of the COSBID research group. J Cereb Blood Flow Metab 37 (5):1595–1625. doi: 10.1177/0271678X16654496 [DOI] [PMC free article] [PubMed] [Google Scholar]
- 43.Hartings JA, Li C, Hinzman JM, Shuttleworth CW, Ernst GL, Dreier JP, Wilson JA, Andaluz N, Foreman B, Carlson AP (2017) Direct current electrocorticography for clinical neuromonitoring of spreading depolarizations. J Cereb Blood Flow Metab 37 (5):1857–1870. doi: 10.1177/0271678X16653135 [DOI] [PMC free article] [PubMed] [Google Scholar]
- 44.Fritch CD, Qeadan F, Shuttleworth CW, Carlson AP (2021) Spreading depolarization occurs in repeating, recognizable, patient-specific patterns after human brain injury. Brain Inj 35 (3):299–303. doi: 10.1080/02699052.2020.1861480 [DOI] [PubMed] [Google Scholar]
- 45.Helbok R, Hartings JA, Schiefecker A, Balanca B, Jewel S, Foreman B, Ercole A, Balu R, Ayata C, Ngwenya L, Rosenthal E, Boutelle MG, Farkas E, Dreier JP, Fabricius M, Shuttleworth CW, Carlson A (2019) What Should a Clinician Do When Spreading Depolarizations are Observed in a Patient? Neurocrit Care. doi: 10.1007/s12028-019-00777-6 [DOI] [PMC free article] [PubMed] [Google Scholar]