Abstract
Spinal cord injury (SCI) often leads to sensory and motor dysfunction. Two major factors that hinder spinal cord repair are local inflammation and glial scar formation after SCI, and thus appropriate immunotherapy may alleviate damage. To characterize changes in gene expression that occur during SCI and thereby identify putative targets for immunotherapy, here we analyzed the dataset GSE5296 (containing one control group and six SCI groups at different timepoints) to identify differentially‐expressed genes. Functional enrichment analysis was performed and a protein–protein interaction network was created to identify possible hub genes. Finally, we performed quantitative PCR to verify changes in gene expression. The CIBERSORT algorithm was used to analyze innate immune cell infiltration patterns. The dataset GSE162610 (containing one control group and three SCI groups at different timepoints) was analyzed to evaluate innate immune cell infiltration at the single‐cell level. The dataset GSE151371 (containing one control group [n = 10] and an SCI group [n = 38]) was used to detect the expression of hub genes in the blood from SCI patients. Differentially‐expressed innate immune‐related genes at each timepoint were identified, and the functions and related signaling pathways of these genes were examined. Six hub genes were identified and verified. We then analyzed the expression characteristics of these hub genes and characteristics of innate immune infiltration in SCI; finally, we examined ligand expression in the context of the CCL signaling pathway and COMPLEMENT signaling pathway networks. This study reveals the characteristics of innate immune cell infiltration and temporal expression patterns of hub genes, and may aid in the development of immunotherapies for SCI.
Keywords: bioinformatics analysis, hub gene, immunity therapy, innate immune infiltration, spinal cord injury, temporal expression
Here we report the characteristics of innate immune cell infiltration in spinal cord injury (SCI) and temporal expression of innate immune‐related hub genes. Additionally, we report the involvement of certain signaling pathways for cell‐to‐cell communication and associated receptor‐ligand combinations in SCI. These findings may help efforts in the development of effective and timely therapies for SCI.
Abbreviations
- C3
complement 3
- Ccl2
C‐C motif chemokine ligand 2
- Ccr2
C‐C motif chemokine receptor 2
- CXCL10
C‐X‐C motif chemokine ligand 10
- Cxcl10
C‐X‐C motif chemokine ligand 10
- DCs
dendritic cells
- GEO
Gene Expression Omnibus
- GO
Gene Ontology
- IL‐1R
interleukin 1 receptor type 1
- ITGAM
integrin subunit alpha M
- Itgam
integrin subunit alpha M
- Itgb2
integrin subunit beta 2
- KEGG
Kyoto Encyclopedia of Genes and Genomes
- MAPK14
mitogen‐activated protein kinase 14
- Mapk14
mitogen‐activated protein kinase 14
- Mapk8
mitogen‐activated protein kinase 8
- MYD88
myeloid differentiation primary response 88
- Myd88
myeloid differentiation primary response 88
- NCBI
National Center for Biotechnology Information
- NF‐κB
nuclear factor of kappa light polypeptide gene enhancer in B cells
- NK
natural killer
- OPC
oligodendrocyte progenitor cell
- PCs
principal components
- PPIN
protein–protein interaction network
- qPCR
quantitative polymerase chain reaction
- SCI
spinal cord injury
- SEM
standard error of the mean
- STAT1
signal transducer and activator of transcription 1
- Stat1
signal transducer and activator of transcription 1
- STAT3
signal transducer and activator of transcription 3
- Stat3
signal transducer and activator of transcription 3
- STRING
Search Tool for Retrieval of Interacting Genes/Proteins
- TLR
Toll‐like receptor
- TLR2
Toll‐like receptor 2
- Tlr2
Toll‐like receptor 2
- TLR4
Toll‐like receptor 4
- UMAP
uniform manifold approximation and projection
Spinal cord injury (SCI) often leads to sensory and motor dysfunction. SCI is accompanied by a series of complications and psychological problems, and places a heavy burden on individuals, families, and society [1]. Reportedly, the global incidence of SCI is about 23 per million and mainly involves adult men, most of whom are victims of motor vehicle accidents and falls [2, 3, 4]. Despite great progress made in understanding the pathophysiological changes and regeneration mechanisms of SCI, the cure for SCI remains a medical problem. Two major factors that hinder spinal cord repair are local inflammation and glial scar formation after SCI. The inflammatory response in SCI can not only aggravate SCI, but also promote its repair. Human SCI is defined as a primary injury and can be divided into the immediate phase (< 2 h), acute phase (< 48 h), subacute phase (48 h to 14 days), intermediate phase (14 days to 6 months), and chronic phase (> 6 months) [3, 5]. Reportedly, the levels of proinflammatory cytokines increase in the spinal cord a few minutes after SCI in mice [6]. Inflammatory cells in blood vessels, such as neutrophils and macrophages, infiltrate the SCI area due to local vascular damage and cause inflammation driven by inflammatory chemokines [7, 8, 9]. These phenomena are inherent in this process, and the expressions of some innate immune‐related genes also change [10, 11, 12].
Based on the above findings, we obtained differentially‐expressed immune‐related genes in SCI tissues of mice through dataset analysis, analyzed the changes in related functions and signaling pathways, and identified hub genes and their temporal expression characteristics. We also performed SCI modeling of mice and quantitative PCR (qPCR) to verify the temporal expression changes of hub genes. After that, the communication relationship between some cells, as well as the temporal expression characteristics of hub genes in various cells, were obtained at the single‐cell level through dataset analysis. The expressions of hub genes in the blood of human SCI were explored through dataset analysis. The temporal characteristics of immune infiltration in SCI were also explored. The workflow of this study is shown in Fig. 1.
Fig. 1.
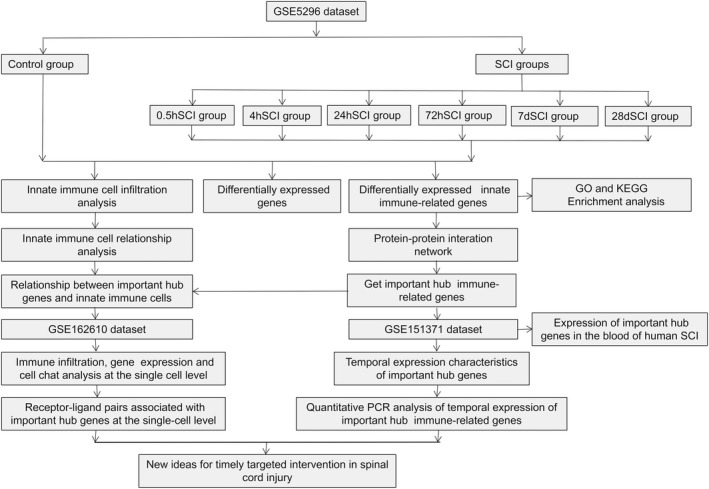
Workflow of this study.
Materials and methods
Animals in our validation experiments
Twenty‐one female C57BL/6 mice weighing 20–22 g, 6 weeks old, were purchased from Baishitong Biological Technology (Zhuhai, China). All animals were kept in the Laboratory Animal Center of Sun Yat‐Sen University, with the animal use permit number SYXK (Guangdong) 2015‐0107. The animal experiments were approved by the Institutional Animal Care and Use Committee of Sun Yat‐Sen University on April 19, 2021 (approval number: SYSU‐IACUC‐2021‐000196). The address is Laboratory Animal Center, Sun Yat‐Sen University, No. 74, Zhongshan Road II, Guangzhou, 510080, P.R. China. All mice were kept in an environment with controlled temperature and humidity, with a 12‐h light/dark cycle, fed on time, watered, and the litter changed. All breeding and experimental operations followed relevant guidelines provided by the Ethics Committee. Then we performed some experiments using these mice under isoflurane inhalation anesthesia, and constructed a moderate spinal cord contusion model at the T8 spinal segment according to Allen's blow method in the SCI group [13]. The control samples only received laminectomy and the T8 spinal segment was not injured. RNAs from the injured spinal cord tissues were extracted for verification of expression levels of hub genes.
Dataset source and basic information
First, datasets GSE5296 microarray, GSE162610, and GSE151371 were downloaded from the Gene Expression Omnibus (GEO, https://www.ncbi.nlm.nih.gov/gds), and their platforms were GPL1261 (Affymetrix Mouse Genome 430 2.0 Array, San Francisco, CA, USA)), GPL19057 (Illumina NextSeq 500, San Diego, CA, USA) and GPL20301 (Illumina HiSeq 4000, San Diego, CA, USA), respectively. In GSE5296, C57BL/6 mice were used to construct SCI models under isoflurane anesthesia based on Allen's method [13]. Six SCI groups were given moderate injury at the T8 spinal segment, which was not injured in the control group. Then the injured segments, about 4 mm of spinal cord tissues, were obtained at certain timepoints for sequencing. Data were collected from the control group (n = 2) and six SCI groups at different timepoints (0.5, 4, 24, and 72 h and 7 and 28 days; n = 3/timepoint). Then GSE5296 was normalized using the function normalizeBetweenArrays in the package bioconductor limma, and the correction method was “quantile” [14]. In GSE162610, C57BL/6 female mice of 8–10 weeks were also used to construct a moderate spinal cord contusion model at the T8 spinal segment according to Allen's blow method in the SCI group [13], and the T8 spinal segment was not injured in the control group. This dataset included one control group (n = 5) and three SCI groups at different timepoints (1, 3, and 7 days, from 5, 3, and 3 mice, respectively). This dataset used the canonical correlation analysis algorithm in the package seurat r to correct the batch effect. GSE151371 was normalized before downloading and included one control group (blood from 10 health people) and one SCI group (blood from 38 SCI patients). Blood of humans was collected at 30.3 ± 18.9 h after SCI, but there were no special requirements for the time to collect blood from healthy volunteers in the control group. Lastly, the list of innate immunity‐related genes was downloaded from the Innate DB database (https://www.innatedb.com) to obtain the expression matrix of these genes using the package “limma.”
Identification of differentially‐expressed genes and differentially‐expressed innate immune‐related genes
The differentially‐expressed genes and innate immune‐related genes in the control group and experimental groups were identified using the package bioconductor limma [15]. These genes were screened out using adjusted P < 0.05 as the significance threshold. The results were visualized using the packages “limma” and “pheatmap.”
Gene Oncology and KEGG enrichment analysis of differentially‐expressed innate immune‐related genes
Gene Ontology (GO) and Kyoto Encyclopedia of Genes and Genomes (KEGG) pathway analyses of differentially‐expressed innate immune‐related genes and the selected innate immune‐related hub genes were performed with the busing packages “org.mm.eg.db,” “clusterprofiler,” “ggplot2,” and “enrichplot” [16]. The cutoff criterion was P < 0.05.
Protein–protein interaction network and hub genes
Protein–protein interaction network (PPIN) analysis of innate immune‐related genes was performed using the Search Tool for Retrieval of Interacting Genes/Proteins (STRING) (https://www.string‐db.org/), and the minimum required interaction score was set to be 0.400. The nodes that were disconnected in the network were hidden in the PPIN. Then four genes of the top four degrees at the timepoint 0.5 h and 10 genes of the top 10 degrees at the timepoints 4, 24, and 72 h and 7 and 28 days were visualized using bar plots. Among the genes screened above, those that appeared at least at three timepoints were identified as hub genes. The genes that appeared at least at three timepoints were identified as hub genes. Then dynamic changes in the hub genes at different timepoints were visualized using R packages “ggplot” and “reshape” (Vienna, Austria). Then National Center for Biotechnology Information (NCBI) (https://www.ncbi.nlm.nih.gov/gene/) and UniProt (https://www.uniprot.org/) were searched to find the full names and functions of the hub genes.
Quantitative PCR of gene expression
We constructed a similar mouse SCI model according to GSE5296 by using Allen's method. There were three mice in the blank group and the injury group at each timepoint. All animal operations were performed under general anesthesia after inhalation with isopentane (RWD Life Science, Shenzhen, China). Then spinal cord tissues were collected from the injured areas, and RNA was extracted from these tissues using an RNAeasy animal RNA extraction kit (Beyotime, Shanghai, China). The RNA was reverse‐transcribed into DNA using PrimeScript RT Master Mix (TAKARA, Dalian, China). Then the expression levels of hub genes at various timepoints after SCI were verified through qPCR. PowerUp SYBR reagents (Thermo Fisher Scientific, Waltham, MA, USA) and a qPCR platform (Bio‐Rad, Hercules, CA, USA) were used. The primer sequences used for qPCR were listed in Table 1.
Table 1.
Primers used for RT‐qPCR.
| Gene | Sequences (5′–3′) |
|---|---|
| Gapdh | Forward TGGAATCCTGTGGCATCCATGAAAC |
| Reverse TAAAACGCAGCTCAGTAACAGTCCG | |
| Ccl2 | Forward TAAAAACCTGGATCGGAACCAAA |
| Reverse GCATTAGCTTCAGATTTACGGGT | |
| MyD88 | Forward GACCGTGAGGATATACTGAAGGA |
| Reverse GGCCACCTGTAAAGGCTTCTC | |
| Stat3 | Forward CACCTTGGATTGAGAGTCAAGAC |
| Reverse AGGAATCGGCTATATTGCTGGT | |
| Cxcl10 | Forward CCAAGTGCTGCCGTCATTTTC |
| Reverse GGCTCGCAGGGATGATTTCAA | |
| Tlr2 | Forward primer TCTAAAGTCGATCCGCGACAT |
| Reverse primer CTACGGGCAGTGGTGAAAACT | |
| Mapk8 | Forward primer GTGGAATCAAGCACCTTCACT |
| Reverse primer TCCTCGCCAGTCCAAAATCAA | |
| Itgam | Forward primer GGCTCCGGTAGCATCAACAA |
| Reverse primer ATCTTGGGCTAGGGTTTCTCT | |
| Mapk14 | Forward primer ACCTAGCTGTGAACGAAGACT |
| Reverse primer GTAGCCACGTAGCCTGTCATC | |
| Stat1 | Forward primer TCACAGTGGTTCGAGCTTCAG |
| Reverse primer CGAGACATCATAGGCAGCGTG |
Assessment of innate immune cell infiltration
The mouse reference gene file to define 11 subgroups of innate immune cells was downloaded [17]. The CIBERSORT algorithm was used to evaluate the infiltration of innate immune cells from the peripheral blood to injured spinal cord tissues [18]. R packages including “limma,” “ggplot2,” “ggpubr,” and “ggextra” and Spearman correlation tests were used to evaluate the relationship between the expressions of hub genes and the proportion of innate immune cells. Then P < 0.05 was set as the cutoff criterion to judge the correlations between them.
Single‐cell sequencing dataset analysis of SCI innate immunity
GSE162610 was analyzed using some R packages, including “seurat,” “ggplot2,” “cowplot,” “matrix,” “dplyr,” “ggsci,” “cellchat,” and “singler.” We filtered the data to retain cells with more than 400 genes and 1000 transcripts to exclude genes expressed in fewer than 10 cells. Cells with more than 5% of mitochondrial genes were also filtered out. The Uniform Manifold Approximation and Projection (UMAP) and 16 significant principal components (PCs) used in dimensionality reduction and clustering. Annotation of cell types was based on the package “singler” [19], database CellMarker (http://bio‐bigdata.hrbmu.edu.cn/CellMarker/), and related articles [20, 21, 22]. All immune cell populations were extracted, reclustered and annotated according to GO function analysis and definition methods [20]. Then the proportion of cell subpopulations was calculated, and the expression levels of some hub genes in various cell subpopulations were displayed.
Analysis of expressions of hub genes in the blood of SCI patients
The R package “ggpubr” was used to detect the expression statuses of hub genes in GSE151371, and human SCI blood transcriptome sequencing data. Then P < 0.05 was used as the significance threshold to screen differentially‐expressed genes.
Statistical analysis
The qPCR data are expressed as mean ± SEM from at least three independent experiments. Student's t‐test was used for two‐group comparison of qPCR data. P < 0.05 was considered significant.
Results
Identification of differentially‐expressed genes and innate immune‐related genes
Through dataset analysis, differentially‐expressed genes and innate immune‐related genes were identified. The number of differentially‐expressed genes peaked at 72 h after SCI, but the number of downregulated genes from 24 h to 28 days after SCI was larger than that of upregulated genes (Fig. 2A). The number of differentially‐expressed immune‐related genes maximized at 72 h, and maintained a high level until 28 days, but the number of upregulated genes was far greater than that of downregulated genes (Fig. 2B). Then, eight differentially‐expressed innate immune‐related genes at 0.5 h after SCI and 20 differentially‐expressed innate immune‐related genes with the lowest adjusted P value at other timepoints were visualized using heatmaps (Fig. 2C). All differentially‐expressed innate immune‐related genes are listed in Table S1.
Fig. 2.
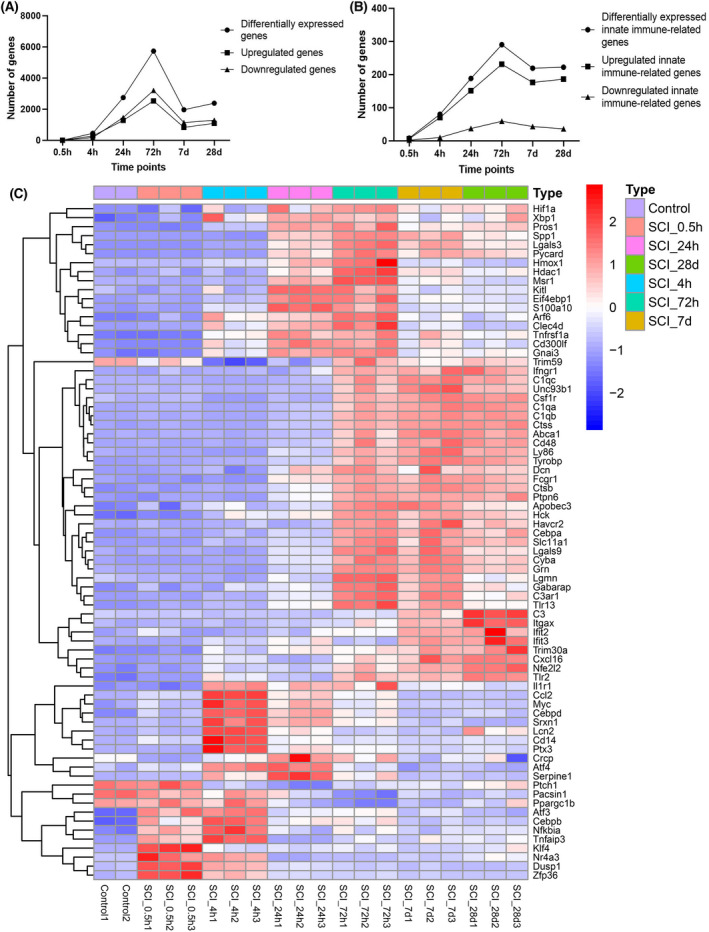
Differential expression of genes in SCI. (A) The number of genes in the SCI that are differently expressed throughout time. The abscissa shows each timepoint following SCI, while the ordinate reflects the number of genes. (B) Temporal evolution of the number of genes involved in innate immunity that are differently expressed in SCI. The abscissa indicates each timepoint following SCI, while the ordinate reflects the quantity of innate immunity‐related genes. (C) Heatmap of several SCI genes associated with innate immunity that exhibit differential expression. Each column represents an SCI sample, and each row is a gene associated with innate immunity that is differentially expressed. Statistical significance was defined as an adjustment P value < 0.5. d, day; h, hour.
GO and KEGG enrichment analysis of differentially‐expressed innate immune‐related genes at each timepoint after SCI
κGO enrichment analysis showed the functions mainly included positive regulation of response to external stimulus, regulation of immune cell chemotaxis and migration, immune cell activation, regulation of DNA‐binding transcription factor, and negative regulation of angiogenesis. Ten GO terms with the lowest P value at each timepoint and related innate immune‐related genes are listed in Table S2. KEGG enrichment analysis demonstrated the complement and coagulation cascades. The IL‐17 signaling pathway changed at 0.5 h after SCI. Some pathways, such as the TNF, NF‐κB, IL‐17, Toll‐like receptor, and NOD‐like receptor signaling pathways changed in the 4th hour to 28 days. Ten KEGG pathway terms of upregulated or downregulated immune‐related genes with the lowest P values at each timepoint are listed in Table S3.
Construction of PPIN and screening of hub genes by dataset analysis
The PPIN at each timepoint was made. Four genes at 0.5 h and 10 genes at other timepoints were the top degrees (Fig. 3). Then nine hub genes that appeared in at least three timepoints were identified, including C‐C motif chemokine ligand 2 (Ccl2), signal transducer and activator of transcription 3 (Stat3), mitogen‐activated protein kinase 14 (Mapk14), signal transducer and activator of transcription 1 (Stat1), Toll‐like receptor 2 (Tlr2), C‐X‐C motif chemokine ligand 10 (Cxcl10), myeloid differentiation primary response 88 (Myd88), integrin subunit alpha M (Itgam) and mitogen‐activated protein kinase 8 (Mapk8). The full names and functions of these genes are listed in Table S4.
Fig. 3.
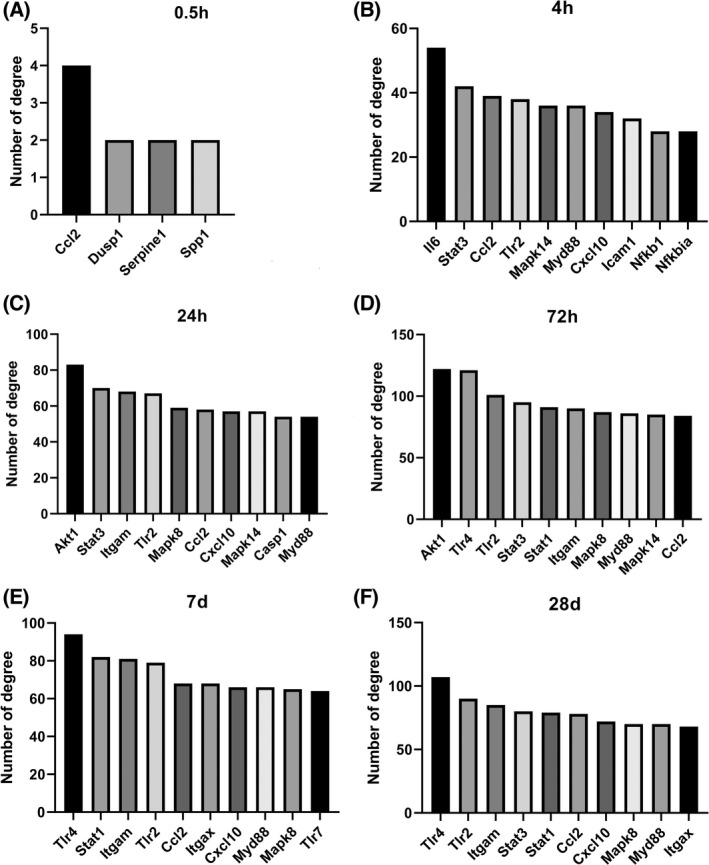
PPIN and hub gene identification. (A) Top 4 genes in the PPIN were screened based on their connectivity degree at 0.5 h after SCI. (B) Top 10 genes in the PPIN were screened based on their connectivity degree at 4 h after SCI. (C) Top 10 genes in the PPIN were screened based on their connectivity degree at 24 h after SCI. (D) Top 10 genes in the PPIN were screened based on their connectivity degree at 72 h after SCI. (E) Top 10 genes in the PPIN were screened based on their connectivity degree at 7 d after SCI. (F) Top 10 genes in the PPIN were screened based on their connectivity degree at 28 d after SCI. d, day; h, hour.
Timing expression of hub genes of injured spinal cord tissue
The dataset analysis showed that the dynamic expression characteristics of the hub genes were different (Fig. 4A). Among them, Ccl2, Stat3, Mapk14, Cxcl10, and Tlr2 peaked at the 4th hour, Stat1 and Myd88 peaked at the 24th hour, Tlr2 and Itgam peaked at the 72nd hour, and Mapk8 was downregulated after SCI. However, Stat1, Tlr2, and Cxcl10 still had relatively high expression levels at 7 h and 28 days after SCI.
Fig. 4.
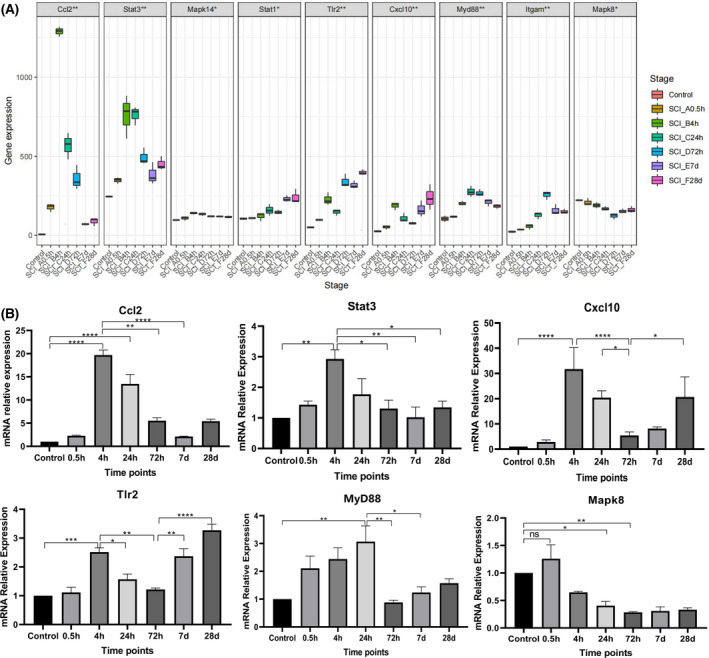
Dynamic expression of hub genes. (A) Trends in the temporal expression of hub genes. The ordinate shows the degree of gene expression, the bottom abscissa shows each timepoint, and the top abscissa shows the names of the genes. (B) The trends in the qPCR time‐series expression levels of various significant hub genes. Each timepoint is represented by the abscissa, and the ordinate shows the relative level of expression of genes relevant to the innate immune system. d, day; h, hour; Values are expressed as the means ± SEM. n = 3 for each group. Student's t‐test was used. ****P < 0.0001; ***P < 0.005; **P < 0.01; *P < 0.05. A P value < 0.5 was regarded as statistically significant.
The verification results of qPCR showed that the changes in the expression levels of Ccl2, Stat3, Cxcl10, and Tlr2 at each timepoint were consistent with the data analysis. The Myd88 expression levels were consistent with the change before the 72nd hour in the data analysis. The Mapk8 expression level was consistent with the data analysis from 4th hour to 28th day after SCI. However, the expression levels of Itgam, Stat1, and Mapk14 were not consistent with the data analysis (Fig. 4B).
Dataset analysis captures characteristics of innate immune cell infiltration in SCI tissues
The infiltration levels of 11 types of innate immune cells in SCI were evaluated. The infiltration level of activated dendritic cells (DCs) increased and peaked at the 4th hour. The infiltration level of neutrophils maintained relatively high within 24 h of SCI, then declined and remained low. The infiltration level of M2‐type macrophages decreased from 0.5 to 24 h after SCI but increased after 72 h and remained at a high state. M1 macrophages began to appear 24 h after SCI and remained until the 28th day. The infiltration of innate immune cells in spinal cord tissues at each timepoint is shown in Fig. 5A.
Fig. 5.
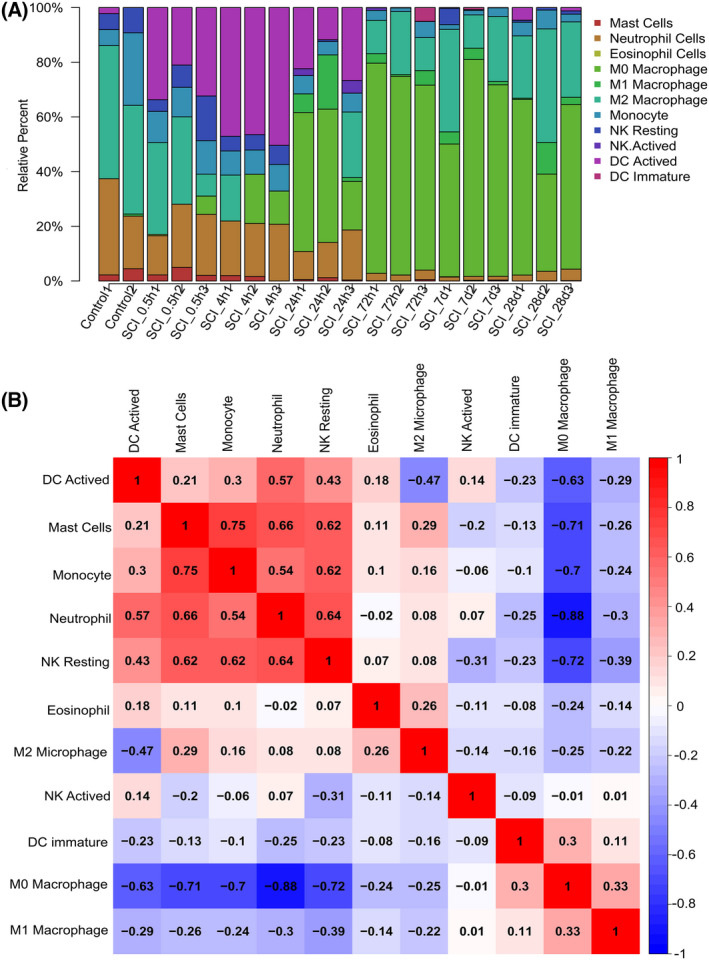
Infiltration of innate immune cells in spinal cord tissue after SCI. (A) The proportion of the 11 innate immune cell subgroups in SCI. Each GEO sample is represented on the X‐axis, and the percentage of each type of immune cell is represented on the Y‐axis. (B) Heatmap of correlation displaying 11 different types of innate immune cells. The square's color intensity conveys the correlation's strength. A positive correlation is denoted by red, whereas a negative correlation is denoted by blue. con, control; d, days; h, hours.
The relationship among the infiltration of 11 types of innate immune cells was also evaluated. Neutrophils, monocytes, and resting natural killer (NK) cells all were significantly and positively correlated with mast cells, while activated DCs, mast cells, monocytes, neutrophils, and resting NK cells were all negatively correlated with M0 macrophages. Neutrophils were significantly and positively correlated with resting NK cells and activated DCs. Monocytes were obviously and positively correlated with NK cells (Fig. 5B).
Dataset analysis captures correlation between hub innate immunity‐related genes and innate immune cells
The correlations between the hub innate immune‐related genes and the infiltration level of innate immune cells were analyzed (Fig. 6). Ccl2 was positively correlated with activated DCs. Myd88 was positively correlated with M0 macrophages, M1 macrophages, immature DCs, and activated NK cells. Tlr2 was correlated positively with M0 macrophages, but negatively with activated DCs, NK resting cells, mast cells, monocytes, and neutrophils. Cxcl10 was negatively correlated with mast cells. Itgam was positively correlated with immature DCs, M0 macrophages, M1 macrophages, and activated NK cells. Mapk8 was positively correlated with neutrophils, NK resting cells, mast cells, monocytes, and activated DCs.
Fig. 6.
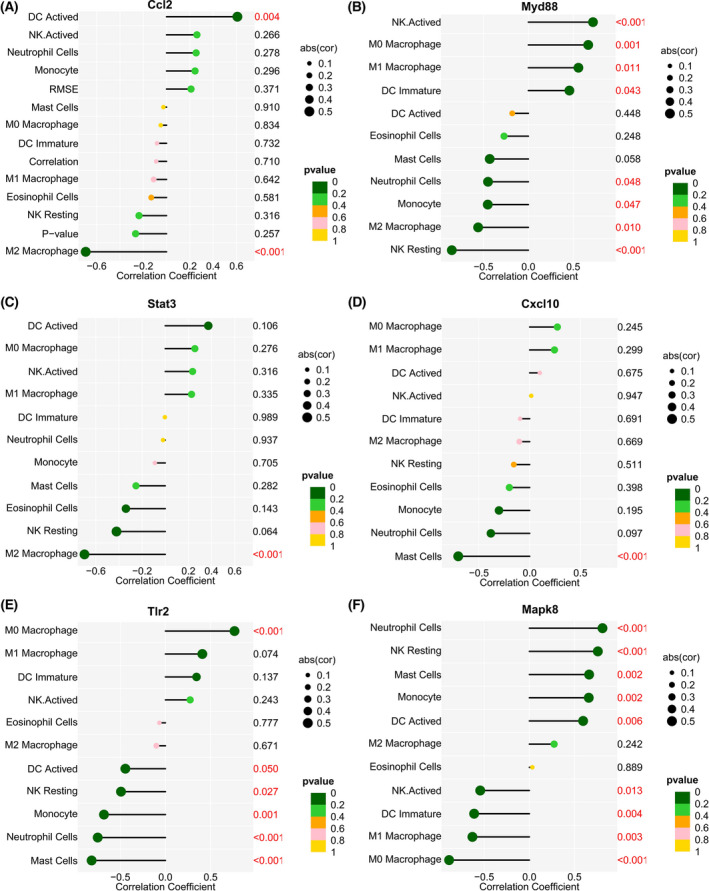
Correlation between innate immune‐related hub genes and innate immune cells. (A) Correlation between Ccl2 and innate immune cells. (B) Correlation between Myd88 and innate immune cells. (C) Correlation between Stat3 and innate immune cells. (D) Correlation between Cxcl10 and innate immune cells. (E) Correlation between Tlr2 and innate immune cells. (F) Correlation between Mapk8 and innate immune cells. The fraction of innate immune cells is represented by the ordinate on the left, the correlation test's P value is shown by the ordinate on the right, and the correlation coefficient is shown by the abscissa. The correlation coefficient is shown by the size of the circle, while the correlation test's P value is shown by the color of the circle. A P value < 0.5 was regarded as statistically significant.
Single‐cell sequencing dataset analysis
After batch correction of the data, the cell population was clustered and labeled (Fig. 7A,B). The percentage of homogeneous cells in different samples and the time‐series changes in the number of some innate immune cells were analyzed (Fig. 7C,D). The numbers of DCs, monocytes, and neutrophils all increased significantly on the first day after SCI. The number of neutrophils decreased significantly on the third day, the numbers of macrophages and mitotic myeloid cells peaked on the third day, and the number of microglia peaked on the seventh day.
Fig. 7.
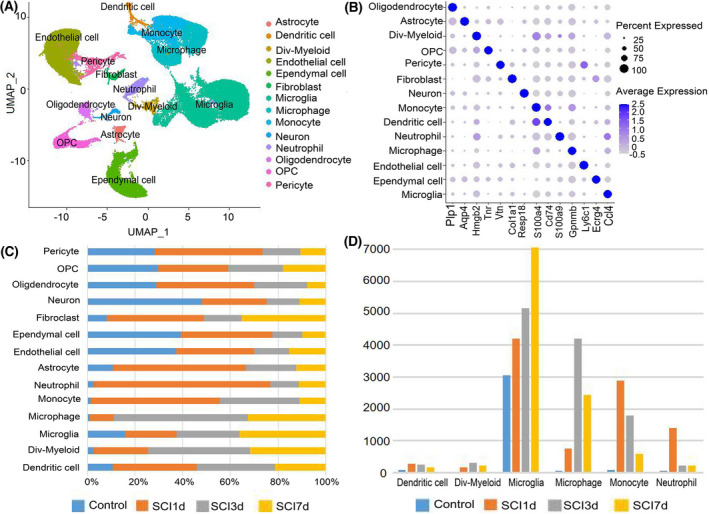
Cell clusters in SCI samples. (A) Cell clustering diagram with annotations. The UMAP graphic shows various cell types in different colors. (B) Cell type‐specific marker genes. The cell type is represented by the ordinate, the gene name by the abscissa, the circle's size by the percentage of that cell type's cells that express the gene, and the level of gene expression is indicated by the depth of the circle's color. (C) The proportion of cells in various samples. The abscissa denotes the proportion, and the ordinate the type of cell. (D) The number of various cell kinds present in the samples at various timepoints. The ordinate denotes the quantity of cells, and the abscissa, the type of cells. d, day; Div‐Myeloid, dividing‐myeloid; OPC, oligodendrocyte progenitor cell.
The communication relationships among different cells after SCI were analyzed. In the CCL signaling pathway network, the ligand Ccl2 was mainly expressed in microglia, macrophages, monocytes, fibroblasts, and Dividing‐Myeloid cells. Receptor Ccr2 was mainly expressed in DCs, monocytes, and Dividing‐Myeloid cells (Fig. 8A,C). In the COMPLEMENT signaling pathway network, ligand complement 3 (C3) was mainly expressed in neutrophils and Dividing‐Myeloid cells, while its receptor Itgam was mainly expressed in microglia, macrophages, neutrophils, monocytes, and Dividing‐Myeloid cells (Fig. 8B,D).
Fig. 8.
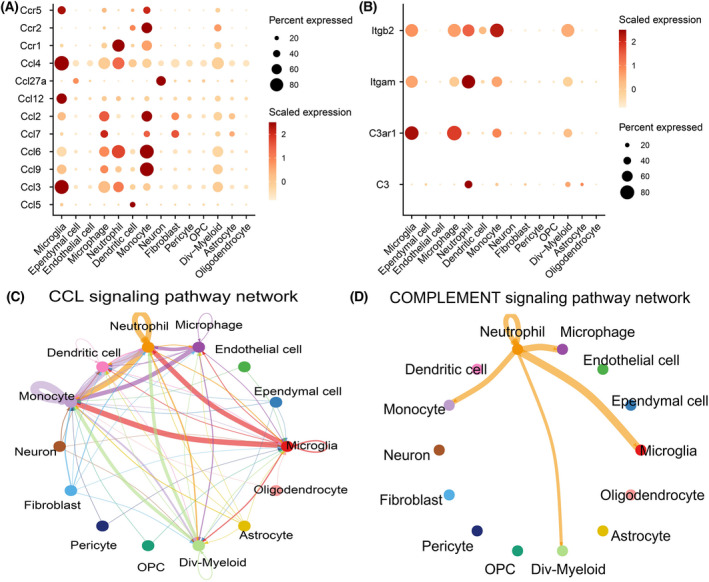
Cell communication in spinal cord after SCI. Expression of receptors and ligands in the CCL and COMPLEMENT signaling pathways (A) and (B). The diameter of the circle denotes the percentage of a cell type's cells that express a certain gene, and the intensity of the color denotes the degree of that expression. Between cells in the SCI, the CCL signaling pathway (C) and the COMPLEMENT signaling pathway (D). The strength of the signal is determined by the intercellular lines' thickness; the thicker the line, the stronger the signal intensity.
According to the annotated map of cell clusters (Fig. 7A), the Ccl2 expression increased significantly at 1 day after SCI, and mainly occurred in macrophages, monocytes, and microglia. After that, the expression decreased and mainly occurred in monocytes and macrophages (Fig. 9A). Itgam was also significantly expressed in microglia, macrophages, monocytes, and neutrophils at 1 day after SCI, and the expression decreased significantly thereafter (Fig. 9B). Tlr2 was mainly expressed in microglia, monocytes, macrophages, and neutrophils at 1 day after SCI, but on the 3rd and 7th day, it was mainly expressed in microglia (Fig. 9C). Cxcl10 was mainly expressed in microglia after SCI (Fig. 9D).
Fig. 9.
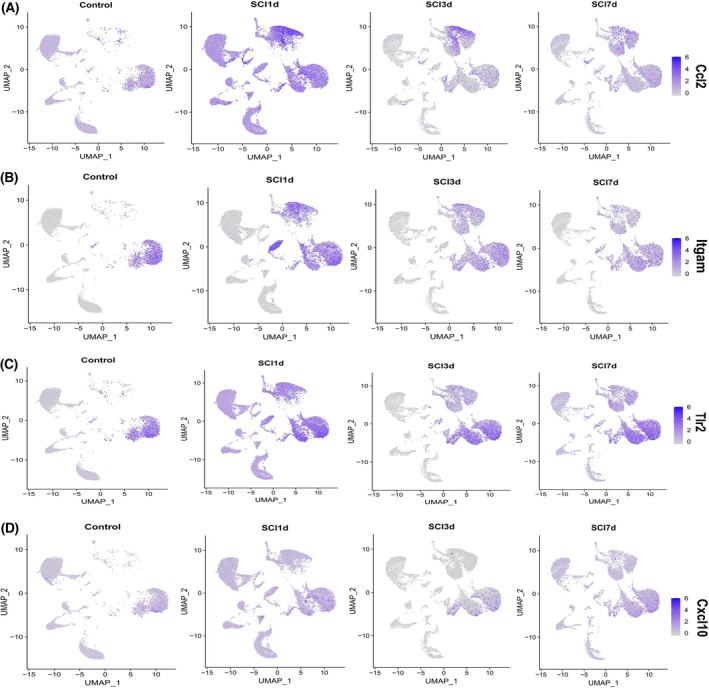
The expression of hub genes in the cells of spinal cord after SCI at different timepoints. (A) Expression of Ccl2 in spinal cord tissue cells of the control group and each timepoint of SCI group. (B) Expression of Itgam in spinal cord tissue cells of control group and each timepoint of the SCI group. (C) Expression of Tlr2 in spinal cord tissue cells of the control group and each timepoint of the SCI group. (D) Expression of Cxcl10 in spinal cord tissue cells of the control group and each timepoint of the SCI group. The degree of gene expression is represented by the color intensity in the UMAP graph. d, days.
Expressions of hub genes in the blood of human SCI
Analysis of blood immune changes of human SCI showed that the expressions of integrin subunit alpha M (ITGAM), mitogen‐activated protein kinase 14 (MAPK14), myeloid differentiation primary response 88 (MYD88), signal transducer and activator of transcription 3 (STAT3), Toll‐like receptor 2 (TLR2) in human blood were higher, and the expressions of signal transducer and activator of transcription 1 (STAT1) and C‐X‐C motif chemokine ligand 10 (CXCL10) were lower compared with the control group. These results suggest that these hub genes may also play an important role in human SCI (Fig. 10).
Fig. 10.
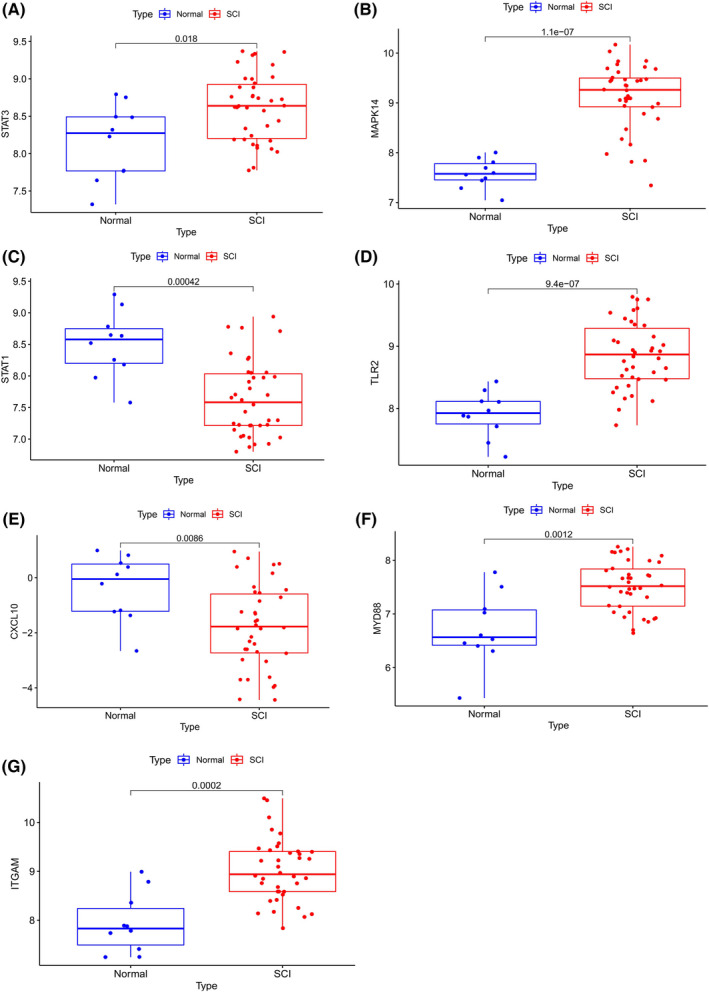
Expression of innate immune‐related genes in the blood cells of human SCI. (A) Differential expression of STAT3 in blood cells of normal people and patients with SCI. (B) Differential expression of MAPK14 in blood cells of normal people and patients with SCI. (C) Differential expression of STAT1 in blood cells of normal people and patients with SCI. (D) Differential expression of TLR2 in blood cells of normal people and patients with SCI. (E) Differential expression of CXCL10 in blood cells of normal people and patients with SCI. (F) Differential expression of MYD88 in blood cells of normal people and patients with SCI. (G) Differential expression of ITGAM in blood cells of normal people and patients with SCI. The abscissa denotes the type of sample, while the ordinate denotes the degree of gene expression. The gene name appears as the title of the vertical axis, and the title of the horizontal axis denotes the type of sample. n (normal) = 10; n (SCI) = 38; Student's t‐test was used. Statistical significance was defined as P < 0.5.
Discussion
The blood–brain barrier is destroyed after SCI. The innate immune cells derived from peripheral blood can quickly participate in the regulation of the local microenvironment after SCI and play important roles in secondary SCI and repair [23, 24]. In our study, the differentially‐expressed innate immune‐related genes and hub genes were identified. Then the dynamic changes in the expression levels of these hub genes were analyzed and verified to identify the optimal time to target these genes. Furthermore, the infiltration of innate immune cells and their relationship with hub genes were characterized. Two hub genes related signaling pathways and receptor–ligand pairs were identified in the cells of SCI. These hub genes were also highly expressed in human blood after SCI. This result also reveals that finding characteristic blood immune‐related genes related to the severity of SCI may be of great significance for research, auxiliary diagnosis, and treatment of human SCI.
Dataset analysis showed the number of upregulated innate immune‐related genes was much larger than that of downregulated genes, which indicates a clear innate immune response after SCI. The infiltration levels of DCs and neutrophils increased rapidly within 24 h of SCI, and significantly reduced after 24 h. In addition, the Ccl2 expression remained at a relatively high level within 24 h of SCI and was positively correlated with the infiltration level of activated DCs, indicating that Ccl2 may play a relatively important role in the infiltration of activated DCs. Single‐cell sequencing data analysis demonstrated that hub genes were mainly expressed in innate immune cells, such as microglia, macrophages, monocytes, DCs, and neutrophils, but less expressed in glial cells, neurons, endothelial cells, and ependymal cells from spinal cord tissues. This result clarifies the relationship between cells in SCI tissues and the expression of hub genes, and indicates that the innate immune cells derived from peripheral blood and microglia constitute the main innate immune components in SCI.
Due to the breakdown of the blood–brain barrier after human SCI, the peripheral circulation communicates with the SCI area. When immune cells in the blood infiltrate the SCI area, the immune status in the circulating blood also changes [25, 26]. The blood–brain barrier is also destroyed after SCI in mice [27, 28]. Our dataset analysis shows that genes such as Ccl2, Tlr2, Itgam, and Cxcl10 are highly expressed not only in microglia after SCI in mice, but also in peripheral blood‐derived immune cells such as macrophages, monocytes, and neutrophils. Due to the absence of sequencing data for mouse SCI blood in the database, there is also no sequencing data for human SCI tissues. Therefore, we analyzed the blood sequencing dataset of human SCI to explore the expression of hub genes in peripheral circulating blood after SCI. The blood of these patients was collected at 30.3 ± 18.9 h after SCI to detect the expression of hub genes. Most of the hub genes were also highly expressed in the blood of SCI patients, but only CXCL10 was downregulated. These results suggest the expression of these genes may also play an important role in the tissues of human SCI, but the current research on the sequential expression of blood genes in human SCI is not comprehensive. Exploring the temporal expression characteristics of hub innate immune‐related genes in the blood of human SCI may have important significance for the diagnosis and treatment of SCI.
From the characteristics of the temporal expressions of hub genes verified above and the infiltration of innate immune cells, we can find a potential suitable time for immunotherapy of SCI in mice, which may experimentally underlie the immunotherapy of SCI. Ccl2 acts through expressing the C‐C motif chemokine receptor 2 (Ccr2), thereby regulating the migration and infiltration of monocytes, T‐lymphocytes, and NK cells into inflammation areas [29, 30]. Our dataset analysis showed that the Ccl2‐Ccr2 receptor ligand pair in the CCL signaling pathway network plays a regulatory role between microglia, macrophages, monocytes, fibroblasts, Dividing‐Myeloid cells and DCs, monocytes, and Dividing‐Myeloid cells. In addition, Ccl2 can promote the polarization of M2‐type macrophages and enhance the growth of axons in peripheral nerve injury [9]. Inhibiting Ccr2 after SCI can alleviate SCI in mice [31]. Both our dataset analysis and qPCR validation showed the Ccl2 expression level quickly peaked at 4 h after SCI, indicating regulating Ccl2 or its receptor Ccr2 within 4 h of SCI may promptly promote the recovery of SCI. In addition, Stat3 controls different pathways of emergency granulocyte production and mature neutrophils [32, 33], the migration of neutrophils [34], and the differentiation of DCs in the innate immune response [35]. Both our dataset analysis and qPCR validation showed that the Stat3 expression level peaked at the 4th hour after SCI and remained at a high level before the 24th hour. In addition, the dataset analysis showed that the infiltration level of neutrophils and activated DCs also increased rapidly and remained at a higher level within 24 h after SCI, indicating that Stat3 may play a role in urgently regulating the migration of neutrophils and the activation of DCs. Therefore, regulating Stat3 within 4 h may better improve SCI recovery.
After peripheral nerve injury, TLR2 induces the expressions of proinflammatory cytokines in the nerve injury area, then induce the activation and infiltration of macrophages into the nerve injury area, and plays a certain neuroprotective effect [36, 37]. Application of Tlr2 agonists in the acute phase of SCI can promote spinal cord repair [11]. However, our dataset analysis and qPCR validation both showed that the Tlr2 expression level not only increased within 4 h after SCI, but also reached higher levels on the 7th and 28th day after SCI. Therefore, regulating Tlr2 expression in the acute, subacute, and intermediate phases of SCI may help with spinal cord repair. Cxcl10 mainly mediates Thl‐type inflammatory responses as well as the chemotaxis of monocytes and T cells, prompting these immune cells to migrate to the injury site, strengthen Thl response, and destroy Th2 response [38]. Anti‐Cxcl10 treatment of SCI in mice can increase neuronal survival and axonal sprouts, reduce cell apoptosis, and promote revascularization of the damaged spinal cords [39, 40, 41]. However, our dataset analysis and qPCR validation both showed that the Cxcl10 expression level reached a small peak at the 24th hour after SCI but reached a higher level on the 28th day. Therefore, modulating Cxcl10 in acute, subacute, and intermediate phases may promote the repair of SCI.
Myd88 is an anchored adaptor protein primarily responsible for directing intracellular signal transduction, integrating, and transducing intracellular signals generated by the Toll‐like receptor (TLR) and interleukin 1 receptor type 1 (IL‐1R) superfamily. MyD88 can promote the migration of white blood cells to the damaged area, which is essential for innate immune regulation [42, 43, 44]. Inhibition of the Toll‐like receptor 4 (TLR4)/Myd88/nuclear factor of kappa light polypeptide gene enhancer in B cells (NF‐κB) signaling pathway can reduce apoptosis and inflammation during SCI [45, 46]. In our study, both dataset analysis and qPCR validation showed that the Myd88 expression level also reached a peak at the 24th hour and remained high at the 72nd hour. The dataset analysis also showed that Myd88 was also positively correlated with the infiltration level of M1 macrophages and NK activation, suggesting that Myd88 plays a relatively important role in the proinflammatory response during the acute and subacute phases of SCI. Therefore, inhibiting Myd88 expression in these two phases of SCI may suppress inflammation and have a better treatment effect on reducing secondary SCI. Interestingly, both dataset analysis and qPCR validation showed that the Mapk8 expression was downregulated after SCI, and minimized at 72 h after SCI. Only a few articles have studied the Mapk8 gene in SCI. Therefore, the important role of Mapk8 in SCI is worthy of further study. Regulating the Mapk8 expression at about 72 h in the subacute phase may be a focus of research.
Itgam , an integrin α‐M, can form a dimer with integrin subunit beta 2 (Itgb2) to participate in various adhesion interactions of monocytes, macrophages, and granulocytes, and to mediate the uptake of complement‐coated particles as well as the migration of immune cells to infected or injured areas [47, 48, 49]. Itgam can also promote the polarization of microglia and macrophages to the M2 type. Our dataset analysis showed that the C3‐(Itgam+Itgb2) receptor ligand pair in the COMPLEMENT signaling pathway network played a regulatory role between neutrophils, Dividing‐Myeloid cells and microglia, macrophages, neutrophils, monocytes, and Dividing‐Myeloid cells. The dataset analysis also showed that the Itgam expression level peaked at 72 h, and then gradually decreased. This result also indicates that regulating Itgam before 72 h after SCI may improve spinal cord repair.
However, our data were mainly obtained from analysis of sequencing data, with a brief experimental validation of gene expression using qPCR. In addition, the sample size is relatively small. Although we identified hub genes and found that some hub genes played a certain role in spinal cord repair, intervention only on one gene may not lead to more ideal spinal cord repair results. In the future, in vivo and in vitro experiments with larger sample sizes are required to analyze and verify the roles of these hub genes in SCI repair.
Conclusion
This study revealed the characteristics of innate immune cell infiltration and identified hub innate immune‐related genes. The characteristics of temporal expression of these genes after SCI may have certain significance in allowing us to intervene in these hub genes and innate immune cells at the right time to reduce secondary SCI and promote spinal cord repair. These hub innate immune‐related genes are also highly expressed in human blood, and the temporal changes of the innate immunity of human SCI blood are worthy of further study. Therefore, this study provides certain ideas and the basis for immunotherapy of SCI. We anticipate that our research can provide certain experimental basis and ideas for the research and treatment of SCI.
Conflict of interest
The authors declare no conflicts of interest.
Author contributions
JL involved in methodology, formal analysis, investigation, and writing—original draft. XL involved in methodology, investigation, and writing—original draft. HW involved in formal analysis, investigation, and writing—review and editing. PG involved in methodology and writing—review and editing. BL involved in methodology and investigation. JW involved in conceptualization and writing—review and editing. WT involved in visualization and funding acquisition. DC involved in conceptualization, project administration and funding acquisition. MG involved in conceptualization, data curation, writing—review and editing, revision, and project administration. ZZ involved in conceptualization, data curation, writing—review and editing, supervision, project administration, and funding acquisition. SL involved in conceptualization, resources, supervision, project administration, and funding acquisition.
Supporting information
Table S1. Differentially expressed innate immune‐related genes between control group and SCI group at each timepoint.
Table S1A. Differentially expressed innate immune‐related genes at 0.5 hours after SCI.
Table S1B. Differentially expressed innate immune‐related genes at 4 hours after SCI.
Table S1C. Differentially expressed innate immune‐related genes at 24 hours after SCI.
Table S1D. Differentially expressed innate immune‐related genes at 72 hours after SCI.
Table S1E. Differentially expressed innate immune‐related genes at 7 days after SCI.
Table S1F. Differentially expressed innate immune‐related genes at 28 days after SCI.
Table S2. Thirty GO terms with the lowest P value at each timepoint.
Table S3. Ten KEGG terms of upregulated immune‐related genes and downregulated immune‐related genes with the lowest P values at each timepoint.
Table S4. Annotation of hub innate immune‐related genes.
Acknowledgments
This study was supported by the National Natural Science Foundation of China (31900583, 82102604, 32071351, 81772400), the Natural Science Foundation of Guangzhou City (201807010031), Foundation of Shenzhen Committee for Science and Technology Innovation (JCYJ20190809142211354, GJHZ20180929160004704), Sanming Project of Medicine in Shenzhen (SZSM201911002), the Beijing Municipal Health Commission (Grant No. BMHC‐2021‐6, BMHC‐2019‐9, BMHC‐2018‐4, PXM2020_026275_000002), AOCMF Translational approaches for bone constructs CPP, Sun Yat‐sen University Clinical Research 5010 Program (2019009), Academic Affairs Office of Sun Yat‐sen University (202211583, 202211589). Special thanks are extended to Cheng Ruijuan for technical support.
Contributor Information
Manman Gao, Email: gaomanm@mail2.sysu.edu.cn.
Zhiyu Zhou, Email: zhouzhy23@mail.sysu.edu.cn.
Data accessibility
Publicly available datasets were analyzed in this study. All of the raw data used in this study are derived from the public GEO data portal (https://www.ncbi.nlm.nih.gov/geo/; Accession numbers: GSE5296, GSE162610, GSE151371).
References
- 1. Binder H. Traumatic spinal cord injury. Handb Clin Neurol. 2013;110:411–26. [DOI] [PubMed] [Google Scholar]
- 2. Lee BB, Cripps RA, Fitzharris M, Wing PC. The global map for traumatic spinal cord injury epidemiology: update 2011, global incidence rate. Spinal Cord. 2014;52:110–6. [DOI] [PubMed] [Google Scholar]
- 3. Ahuja CS, Wilson JR, Nori S, Kotter MRN, Druschel C, Curt A, et al. Traumatic spinal cord injury. Nat Rev Dis Primers. 2017;3:17018. [DOI] [PubMed] [Google Scholar]
- 4. Gomes‐Osman J, Cortes M, Guest J, Pascual‐Leone A. A systematic review of experimental strategies aimed at improving motor function after acute and chronic spinal cord injury. J Neurotrauma. 2016;33:425–38. [DOI] [PMC free article] [PubMed] [Google Scholar]
- 5. Rowland JW, Hawryluk GW, Kwon B, Fehlings MG. Current status of acute spinal cord injury pathophysiology and emerging therapies: promise on the horizon. Neurosurg Focus. 2008;25:E2. [DOI] [PubMed] [Google Scholar]
- 6. Pineau I, Lacroix S. Proinflammatory cytokine synthesis in the injured mouse spinal cord: multiphasic expression pattern and identification of the cell types involved. J Comp Neurol. 2007;500:267–85. [DOI] [PubMed] [Google Scholar]
- 7. Orr MB, Gensel JC. Spinal cord injury scarring and inflammation: therapies targeting glial and inflammatory responses. Neurotherapeutics. 2018;15:541–53. [DOI] [PMC free article] [PubMed] [Google Scholar]
- 8. Kobayakawa K, Ohkawa Y, Yoshizaki S, Tamaru T, Saito T, Kijima K, et al. Macrophage centripetal migration drives spontaneous healing process after spinal cord injury. Sci Adv. 2019;5:eaav5086. [DOI] [PMC free article] [PubMed] [Google Scholar]
- 9. Neirinckx V, Coste C, Franzen R, Gothot A, Rogister B, Wislet S. Neutrophil contribution to spinal cord injury and repair. J Neuroinflammation. 2014;11:150. [DOI] [PMC free article] [PubMed] [Google Scholar]
- 10. Kwon MJ, Shin HY, Cui Y, Kim H, Thi AHL, Choi JY, et al. CCL2 mediates neuron‐macrophage interactions to drive proregenerative macrophage activation following preconditioning injury. J Neurosci. 2015;35:15934–47. [DOI] [PMC free article] [PubMed] [Google Scholar]
- 11. Stivers NS, Pelisch N, Orem BC, Williams J, Nally JM, Stirling DP. The Toll‐like receptor 2 agonist Pam3CSK4 is neuroprotective after spinal cord injury. Exp Neurol. 2017;294:1–11. [DOI] [PubMed] [Google Scholar]
- 12. Xu S, Wang J, Jiang J, Song J, Zhu W, Zhang F, et al. TLR4 promotes microglial pyroptosis via lncRNA‐F6300 28O10Rik by activating PI3K/AKT pathway after spinal cord injury. Cell Death Dis. 2020;11:693. [DOI] [PMC free article] [PubMed] [Google Scholar]
- 13. Wu H, Tong K, Liu X, Li J, Li X, Gao M, et al. A comparison between two laminectomy procedures in mouse spinal cord injury on Allen's animal model. J Neurosci Methods. 2022;368:109461. [DOI] [PubMed] [Google Scholar]
- 14. Ritchie ME, Phipson B, Wu D, Hu Y, Law CW, Shi W, et al. limma powers differential expression analyses for RNA‐sequencing and microarray studies. Nucleic Acids Res. 2015;43:e47. [DOI] [PMC free article] [PubMed] [Google Scholar]
- 15. Yu G, Wang LG, Han Y, He QY. clusterProfiler: an R package for comparing biological themes among gene clusters. OMICS. 2012;16:284–7. [DOI] [PMC free article] [PubMed] [Google Scholar]
- 16. Zhang C, Zheng Y, Li X, Hu X, Qi F, Luo J. Genome‐wide mutation profiling and related risk signature for prognosis of papillary renal cell carcinoma. Ann Transl Med. 2019;7:427. [DOI] [PMC free article] [PubMed] [Google Scholar]
- 17. Chen Z, Huang A, Sun J, Jiang T, Qin FXF, Wu A. Inference of immune cell composition on the expression profiles of mouse tissue. Sci Rep. 2017;7:40508. [DOI] [PMC free article] [PubMed] [Google Scholar]
- 18. Chen B, Khodadoust MS, Liu CL, Newman AM, Alizadeh AA. Profiling tumor infiltrating immune cells with CIBERSORT. Methods Mol Biol. 2018;1711:243–59. [DOI] [PMC free article] [PubMed] [Google Scholar]
- 19. Aran D, Looney AP, Liu L, Wu E, Fong V, Hsu A, et al. Reference‐based analysis of lung single‐cell sequencing reveals a transitional profibrotic macrophage. Nat Immunol. 2019;20:163–72. [DOI] [PMC free article] [PubMed] [Google Scholar]
- 20. Milich LM, Choi JS, Ryan C, Cerqueira SR, Benavides S, Yahn SL, et al. Single‐cell analysis of the cellular heterogeneity and interactions in the injured mouse spinal cord. J Exp Med. 2021;218:e20210040. [DOI] [PMC free article] [PubMed] [Google Scholar]
- 21. Rosenberg AB, Roco CM, Muscat RA, Kuchina A, Sample P, Yao Z, et al. Single‐cell profiling of the developing mouse brain and spinal cord with split‐pool barcoding. Science. 2018;360:176–82. [DOI] [PMC free article] [PubMed] [Google Scholar]
- 22. Sathyamurthy A, Johnson KR, Matson K, Dobrott CI, Li L, Ryba AR, et al. Massively parallel single nucleus transcriptional profiling defines spinal cord neurons and their activity during behavior. Cell Rep. 2018;22:2216–25. [DOI] [PMC free article] [PubMed] [Google Scholar]
- 23. Park J, Zhang Y, Saito E, Gurczynski SJ, Moore BB, Cummings BJ, et al. Intravascular innate immune cells reprogrammed via intravenous nanoparticles to promote functional recovery after spinal cord injury. Proc Natl Acad Sci USA. 2019;116:14947–54. [DOI] [PMC free article] [PubMed] [Google Scholar]
- 24. David S, Greenhalgh AD, Kroner A. Macrophage and microglial plasticity in the injured spinal cord. Neuroscience. 2015;307:311–8. [DOI] [PubMed] [Google Scholar]
- 25. Kyritsis N, Torres‐Espín A, Schupp PG, Huie JR, Chou A, Duong‐Fernandez X, et al. Diagnostic blood RNA profiles for human acute spinal cord injury. J Exp Med. 2021;218:e20201795. [DOI] [PMC free article] [PubMed] [Google Scholar]
- 26. Zhao JL, Lai ST, Du ZY, Xu J, Sun Y‐R, Yuan Q, et al. Circulating neutrophil‐to‐lymphocyte ratio at admission predicts the long‐term outcome in acute traumatic cervical spinal cord injury patients. BMC Musculoskelet Disord. 2020;21:548. [DOI] [PMC free article] [PubMed] [Google Scholar]
- 27. Whetstone WD, Hsu JY, Eisenberg M, Werb Z, Noble‐Haeusslein LJ. Blood‐spinal cord barrier after spinal cord injury: relation to revascularization and wound healing. J Neurosci Res. 2014;74:227–39. [DOI] [PMC free article] [PubMed] [Google Scholar]
- 28. Cahill LS, Laliberté CL, Liu XJ, Bishop J, Nieman BJ, Mogil JS, et al. Quantifying blood‐spinal cord barrier permeability after peripheral nerve injury in the living mouse. Mol Pain. 2014;10:60. [DOI] [PMC free article] [PubMed] [Google Scholar]
- 29. Semple BD, Kossmann T, Morganti‐Kossmann MC. Role of chemokines in CNS health and pathology: a focus on the CCL2/CCR2 and CXCL8/CXCR2 networks. J Cereb Blood Flow Metab. 2010;30:459–73. [DOI] [PMC free article] [PubMed] [Google Scholar]
- 30. Xu P, Zhang F, Chang MM, Zhong C, Sun CH, Zhu HR, et al. Recruitment of γδ T cells to the lesion via the CCL2/CCR2 signaling after spinal cord injury. J Neuroinflammation. 2021;18:64. [DOI] [PMC free article] [PubMed] [Google Scholar]
- 31. Zhang Q, Zhu C, Li X, Shi Y, Zhang Z. CCR2 downregulation attenuates spinal cord injury by suppressing inflammatory monocytes. Synapse. 2021;75:e22191. [DOI] [PubMed] [Google Scholar]
- 32. Panopoulos AD, Zhang L, Snow JW, Jones DM, Smith AM, el Kasmi KC, et al. STAT3 governs distinct pathways in emergency granulopoiesis and mature neutrophils. Blood. 2006;108:3682–90. [DOI] [PMC free article] [PubMed] [Google Scholar]
- 33. Zhang H, Nguyen‐Jackson H, Panopoulos AD, Li HS, Murray PJ, Watowich SS. STAT3 controls myeloid progenitor growth during emergency granulopoiesis. Blood. 2010;116:2462–71. [DOI] [PMC free article] [PubMed] [Google Scholar]
- 34. Nguyen‐Jackson H, Panopoulos AD, Zhang H, Li HS, Watowich SS. STAT3 controls the neutrophil migratory response to CXCR2 ligands by direct activation of G‐CSF‐induced CXCR2 expression and via modulation of CXCR2 signal transduction. Blood. 2010;115:3354–63. [DOI] [PMC free article] [PubMed] [Google Scholar]
- 35. Laouar Y, Welte T, Fu XY, Flavell RA. STAT3 is required for Flt3L‐dependent dendritic cell differentiation. Immunity. 2003;19:903–12. [DOI] [PubMed] [Google Scholar]
- 36. Kim D, You B, Lim H, Lee SJ. Toll‐like receptor 2 contributes to chemokine gene expression and macrophage infiltration in the dorsal root ganglia after peripheral nerve injury. Mol Pain. 2011;7:74. [DOI] [PMC free article] [PubMed] [Google Scholar]
- 37. Gensel JC, Wang Y, Guan Z, Beckwith KA, Braun KJ, Wei P, et al. Toll‐like receptors and Dectin‐1, a C‐type lectin receptor, trigger divergent functions in CNS macrophages. J Neurosci. 2015;35:9966–76. [DOI] [PMC free article] [PubMed] [Google Scholar]
- 38. Chen Y, Yin D, Fan B, Zhu X, Chen Q, Li Y, et al. Chemokine CXCL10/CXCR3 signaling contributes to neuropathic pain in spinal cord and dorsal root ganglia after chronic constriction injury in rats. Neurosci Lett. 2019;694:20–8. [DOI] [PubMed] [Google Scholar]
- 39. Glaser J, Gonzalez R, Sadr E, Keirstead HS. Neutralization of the chemokine CXCL10 reduces apoptosis and increases axon sprouting after spinal cord injury. J Neurosci Res. 2006;84:724–34. [DOI] [PubMed] [Google Scholar]
- 40. Gonzalez R, Hickey MJ, Espinosa JM, Nistor G, Lane TE, Keirstead HS. Therapeutic neutralization of CXCL10 decreases secondary degeneration and functional deficit after spinal cord injury in mice. Regen Med. 2007;2:771–83. [DOI] [PubMed] [Google Scholar]
- 41. Wang Q, Liu L, Cao J, Abula M, Yimingjiang Y, Feng S. Weighted gene co‐expression network analysis reveals that CXCL10, IRF7, MX1, RSAD2, and STAT1 are related to the chronic stage of spinal cord injury. Ann Transl Med. 2021;9:1248. [DOI] [PMC free article] [PubMed] [Google Scholar]
- 42. Saikh KU. MyD88 and beyond: a perspective on MyD88‐targeted therapeutic approach for modulation of host immunity. Immunol Res. 2021;69:117–28. [DOI] [PMC free article] [PubMed] [Google Scholar]
- 43. Hu N, Wang C. Phillygenin inhibits LPS‐induced activation and inflammation of LX2 cells by TLR4/MyD88/NF‐κB signaling pathway. J Ethnopharmacol. 2020;248:112361. [DOI] [PubMed] [Google Scholar]
- 44. Babcock AA, Toft‐Hansen H, Owens T. Signaling through MyD88 regulates leukocyte recruitment after brain injury. J Immunol. 2008;181:6481–90. [DOI] [PubMed] [Google Scholar]
- 45. Deguine J, Barton GM. MyD88: a central player in innate immune signaling. F1000Prime Rep. 2014;6:97. [DOI] [PMC free article] [PubMed] [Google Scholar]
- 46. Fan L, Dong J, He X, Zhang C, Zhang T. Bone marrow mesenchymal stem cells‐derived exosomes reduce apoptosis and inflammatory response during spinal cord injury by inhibiting the TLR4/MyD88/NF‐κB signaling pathway. Hum Exp Toxicol. 2021;40:1612–23. [DOI] [PubMed] [Google Scholar]
- 47. Blight BJ, Gill AS, Sumsion JS, Pollard CE, Ashby S, Oakley GM, et al. Cell adhesion molecules are upregulated and may drive inflammation in chronic rhinosinusitis with nasal polyposis. J Asthma Allergy. 2021;14:585–93. [DOI] [PMC free article] [PubMed] [Google Scholar]
- 48. Abram CL, Lowell CA. The ins and outs of leukocyte integrin signaling. Annu Rev Immunol. 2009;27:339–62. [DOI] [PMC free article] [PubMed] [Google Scholar]
- 49. Hu X, Han C, Jin J, Qin K, Zhang H, Li T, et al. Integrin CD11b attenuates colitis by strengthening Src‐Akt pathway to polarize anti‐inflammatory IL‐10 expression. Sci Rep. 2020;10:19885. [DOI] [PMC free article] [PubMed] [Google Scholar]
Associated Data
This section collects any data citations, data availability statements, or supplementary materials included in this article.
Supplementary Materials
Table S1. Differentially expressed innate immune‐related genes between control group and SCI group at each timepoint.
Table S1A. Differentially expressed innate immune‐related genes at 0.5 hours after SCI.
Table S1B. Differentially expressed innate immune‐related genes at 4 hours after SCI.
Table S1C. Differentially expressed innate immune‐related genes at 24 hours after SCI.
Table S1D. Differentially expressed innate immune‐related genes at 72 hours after SCI.
Table S1E. Differentially expressed innate immune‐related genes at 7 days after SCI.
Table S1F. Differentially expressed innate immune‐related genes at 28 days after SCI.
Table S2. Thirty GO terms with the lowest P value at each timepoint.
Table S3. Ten KEGG terms of upregulated immune‐related genes and downregulated immune‐related genes with the lowest P values at each timepoint.
Table S4. Annotation of hub innate immune‐related genes.
Data Availability Statement
Publicly available datasets were analyzed in this study. All of the raw data used in this study are derived from the public GEO data portal (https://www.ncbi.nlm.nih.gov/geo/; Accession numbers: GSE5296, GSE162610, GSE151371).


