

Abstract
Introduction
The development of valid methods to diagnose prodromal Alzheimer's disease (AD) in adults with Down syndrome (DS) is one of the many goals of the Alzheimer's Biomarkers Consortium—Down Syndrome (ABC‐DS).
Methods
The diagnostic utility of a modified Cued Recall Test (mCRT) was evaluated in 332 adults with DS ranging from 25 to 81 years of age. Total recall was selected a priori, as the primary indicator of performance. Multiple regression and receiver‐operating characteristic (ROC) analyses were used to compare diagnostic groups.
Results
Performance on the mCRT, as indicated by the total recall score, was highly sensitive to differences between diagnostic groups. ROC areas under the curve (AUCs) ranging from 0.843 to 0.955, were observed.,
Discussion
The mCRT has strong empirical support for its use in clinical settings, as a valuable tool in studies targeting biomarkers of AD, and as a potential outcome measure in clinical trials targeting AD in this high‐risk population.
Keywords: Alzheimer's disease (AD), cued recall, dementia, Down syndrome, memory impairment, mild cognitive impairment (MCI)
1. INTRODUCTION
Life expectancy has increased over recent decades for all adult populations, and this has been especially dramatic for individuals with Down syndrome (DS). With increased longevity comes an increase in the prevalence of age‐associated diseases. Elevated risk for Alzheimer's disease (AD), a phenotypic feature of DS, now ranks among the most serious health concerns facing affected adults as they age.
Our research group, Alzheimer's Biomarkers Consortium—Down Syndrome (ABC‐DS), has been examining the timing and sequence of events associated with AD progression for adults with DS, the largest population at increased risk associated with a specific genotype, including identification of biomarkers of preclinical AD. 1 The earliest detection of AD will affect the type of therapy and the approach to long‐term care that is prescribed, not only for people with DS, but also for adults with neurotypical developmental histories.
Clinical interest in identifying biomarkers of AD has underscored the construct of mild cognitive impairment (MCI), a prodromal stage of AD. MCI is characterized clinically by declines in abilities with severity between “normal” cognitive aging and clinical dementia. Symptoms for neurotypical adults include limited declines in cognition with minimal impact on activities of daily living. 2 , 3 Petersen et al. 3 originally emphasized impairments in memory (amnestic‐MCI), but there has been significant broadening of the construct to include non‐amnestic and mixed subtypes. 4 The distinctive feature of amnestic‐MCI is the presence of episodic memory impairment characterized by diminished free recall. 5
The development of an operational definition of MCI that is sufficiently precise to serve as a useful diagnostic entity for adults with DS (MCI‐DS) has proven to be extremely challenging, primarily due to the presence of lifelong cognitive impairments unrelated to concerns arising in old age. These impairments vary substantially in severity between affected individuals and are difficult to distinguish from new impairments caused by AD, especially during the prodromal stage. Empirically validated assessment methods that can distinguish between impairments associated with MCI‐DS and lifelong impairments are a major focus of our study 6 , 7 (and see ref. 8 , 9 ). Findings to date have indicated that primary symptomatology appears to be qualitatively similar to the amnestic‐MCI profile for adults with neurotypical developmental histories, including objectively measurable decline in episodic memory. 10
RESEARCH IN CONTEXT
Systematic review: Literature on methods to detect prodromal Alzheimer's disease (AD) in adults with Down syndrome (DS) was reviewed using traditional sources (e.g., PubMed and related citations). Direct tests of memory were a primary focus, with emphasis on the validity of the Cued Recall Test (CRT).
Interpretation: Performance on a modified CRT (mCRT), adapted to the abilities of adults with DS, discriminated between individuals in preclinical, prodromal, and more advanced AD, providing high sensitivity and specificity.
Future directions: Future research will focus on the utility of the mCRT for tracking the transition from preclinical to prodromal AD longitudinally, reinforcing its potential as an outcome measure in clinical trials and as a valuable tool in discovery studies for biomarkers of prodromal AD.
HIGHLIGHTS
A modified Cued Recall Test (mCRT) detected prodromal Alzheimer's disease (AD) in adults with Down syndrome (DS).
Differences in performance among groups defined by AD clinical status were large.
The mCRT is easily adaptable to clinical practice.
The mCRT can inform the diagnosis of AD clinical progression in adults with DS.
The mCRT can serve to strengthen studies of AD biomarkers in adults with DS.
The Cued Recall Test (CRT) is a task widely used to evaluate episodic memory of older neurotypical adults, 11,and Grober et al. 11 , 12 , 13 , 14 found that performance on this task effectively improves the identification of individuals with preclinical disease who are at elevated risk for progression to dementia. 13 , 15 The CRT paradigm consists of two‐phases. During the learning phase participants are presented with a list of items, each an exemplar of a specific category (e.g., “Fruit–Grapes”), and are asked to name items in response to their respective category cues. This phase ensures that participants are familiar with the specific items and have attended to them and their cues. During the testing phase, participants are asked to recall all items on the list, initially without cues and then with the provision of cues for omitted items.
Devenny et al. 16 modified the Grober et al. 11 test for use with adults with DS (mCRT) and found it to be a useful screening test for what they referred to as “early dementia” 17 , 18 (also see ref. 19 ). With a 12‐item list and three recall trials they found that a total recall criterion of ≤23 items (maximum score = 36) resulted in near‐perfect sensitivity (0.947) and specificity (0.939). However, they acknowledged that their independent characterization of the diagnostic status was imperfect and that their sample size was relatively small. Therefore, there remained a need for this study, focused on the validity of the mCRT for a larger sample evaluated with a more comprehensive assessment of AD‐related diagnostic status.
2. METHOD
2.1. Participants
Participants in the current study were enrolled in the ABC‐DS program (see author affiliations). The ABC‐DS is an ongoing program with continuous enrollment and longitudinal evaluations of participants. The present study was limited to cross‐sectional analyses of scores at entry into the study available as of January 2020. Inclusion criteria were (1) a phenotypic or genetic diagnosis of DS, (2) 25 years of age or older, (3) vision and hearing sufficient for participation, (4) communication ability sufficient to understand testing and to provide assent, and (5) provision of consent (by the participant, or a legally authorized representative). Recruitment, informed consent, and study procedures were approved by the institutional review boards or their equivalents for each participating site.
The sample consisted of 332 of the 376 participants enrolled in the ABC‐DS program (88.3%). Two individuals were excluded because of lack of cooperation or unplanned disruption during the testing session, 16 individuals were excluded because of substantive uncertainty about their overall diagnostic status, and the mCRT was not presented to another 26 individuals. Exclusion was unrelated to mCRT performance or to consensus determinations of diagnostic status.
2.2. Assessments
All participants received extensive evaluations 1 encompassing demographic information, family and health history, and medication use; direct assessment focused on cognitive functions likely to be affected by AD progression; and structured informant interviews regarding day‐to‐day functioning. Neurological and physical examinations were carried out to provide an independent medical opinion and to rule out comorbidities that might confound a diagnosis regarding dementia status.
2.2.1. Neuropsychological evaluations
For the mCRT, stimuli were two sets of 12 black‐and‐white line drawings of simple objects, each representing a distinct semantic category, adapted from the Snodgrass and Vanderwart picture set. 20 Items were selected to be easily recognizable objects, although not the prototypical exemplar of their respective category.
During the learning phase, participants were shown three 8½ × 11 white, laminated cards, one at a time, with each illustrating four items, one item per quadrant (Figure 1).
FIGURE 1.

Version A and Version B of the modified Cued Recall Test (mCRT) 16
Participants were asked to point to and name aloud each item (e.g., grapes) in response to the verbal presentation of the semantic category (e.g., “What is the piece of fruit?”). After the four items on the card were pointed to and named, the card was turned over and participants were asked to immediately recall them. For items not recalled, the card was shown for a second time, and participants were reminded of those items not recalled on the preceding trial. The card was then withdrawn, and participants were given another opportunity to recall. If a participant successfully named all four items, the next set of four items was presented and the process repeated. If a participant failed to recall all four items, they were shown the card a third time and asked to point to and name the items. This continued until either all four items were named or three learning trials per card were completed.
The testing phase immediately followed and consisted of three trials, each requiring recall of all 12 items. Initially participants were asked to recall as many items as possible. Approximately 1 minute was allowed for free recall, after which category cues were provided for missed items. One point was given for each item that was recalled correctly.
Following Devenny et al., 16 the total number of items recalled across all three trials, combining free and cued recall, was selected as the primary measure of performance (range = 0–36). Additional measures included (1) the total number of correct responses during free recall only (range = 0–36); (2) the number of items correctly recalled on each of the three trials individually (range 0–12 items per trial); and (3) the number of extra‐list responses (intrusions, range from 0 upward).
2.2.2. Diagnostic status based on the case consensus review procedures 7 , 21
Data from assessments of performance, excluding the mCRT, were examined to provide an indication of AD‐related diagnostic status. Details of the procedures for determining these “consensus classifications” of overall diagnostic status have been described in earlier publications. 1 , 7 , 21 In brief, determination of diagnostic status was made during case consensus conferences and based on a consideration of overall profiles of performance combined with highly experienced clinical judgment. Diagnostic status considered for the present analyses were (1) cognitively‐stable (CS), indicating with reasonable certainty that significant impairment was absent; (2) mild cognitive impairment‐down syndrome (or MCI‐DS), indicating that there was some indication of cognitive and/or functional decline over and above what would be expected with aging alone, although of insufficient severity to suggest the presence of dementia; and (3) AD‐dementia, indicating that multiple indications of significant declines were likely to have occurred that could not be explained by circumstances unrelated to AD neuropathology (such as a traumatic life event or severe illness) or other underlying progressive neuropathology. Furthermore, consensus classifications and all analyses were conducted blind to the ABC‐DS neuroimaging and other “biological” marker findings.
2.3. Statistical analyses
Continuous data were summarized descriptively as means (with standard deviation) and categorical data were summarized as percentage and/or number of participants. Multiple regression methods, including analysis of covariance (ANCOVA), were used to compare sample characteristics according to diagnostic status. Receiver‐operating characteristic (ROC) analyses were used to examine the distribution overlaps in performance among groups defined by their diagnostic status. Partial Eta squared (ηp2) served as the measure of effect size, and significant findings were explored further with appropriate post hoc analyses. Analyses were performed using the Statistical Package for the Social Sciences (SPSS, version 26.0; IBM SPSS, Inc., Chicago, IL).
3. RESULTS
3.1. Preliminary analyses
Table 1 presents the number and mean ages of participants by sex, severity of premorbid intellectual disability (ID; mild, moderate, or severe), and diagnostic status (CS, MCI‐DS, AD‐dementia). Clinically defined groups differed in age, as expected—F(2, 329) = 59.27, P < .0001, ηp 2 = 0.27—but not in other characteristics.
TABLE 1.
Mean age and standard deviation (in parentheses) of participants × diagnostic status × premorbid level of intellectual disability (ID)
| Cognitively stable (N = 247) | MCI‐DS (N = 43) | AD‐dementia (N = 42) | |||||||
|---|---|---|---|---|---|---|---|---|---|
| Mild (N = 108) | Moderate (N = 130) | Severe (N = 9) | Mild (N = 18) | Moderate (N = 22) | Severe (N = 3) | Mild (N = 17) | Moderate (N = 20) | Severe (N = 5) | |
|
Females (N = 154) |
42.66 (8.46) |
40.54 (8.46) |
43.67 (14.15) |
50.50 (5.89) |
52.44 (7.02) |
– |
54.56 (4.22) |
53.20 (4.21) |
52.33 (5.13) |
|
Males (N = 178) |
43.38 (8.08) |
42.19 (10.26) |
45.83 (12.45) |
55.00 (9.54) |
51.54 (3.43) |
61.67 (5.13) |
55.00 (6.35) |
55.20 (9.40) |
59.50 (6.36) |
Abbreviations: AD, Alzheimer's disease; DS, Down syndrome; MCI, mild cognitive impairment.
3.2. Primary outcome measure
The primary measure of mCRT performance was the total number of items correctly recalled. Summary scores for all outcome measures are reported in Table 2. Because mCRT data were available for only 17 individuals with a history of severe ID, the performance of this group was examined only descriptively. This group performed poorly overall and only seven individuals had a total recall score above 20; all were CS. This indicated that although poor performance is uninformative for individuals with a history of severe ID, individuals recalling 20 or more items will be extremely unlikely to be experiencing AD‐related cognitive decline. All further analyses focused on the two groups with histories of mild or moderate ID.
TABLE 2.
Unadjusted means and standard deviations (in parentheses) and the minimum and maximum obtained scores [in brackets] generated from the modified Cued Recall Test (mCRT)
| Summary score totals | CS | MCI‐DS | AD‐dementia | ||||||
|---|---|---|---|---|---|---|---|---|---|
| Mild | Moderate | Severe | Mild | Moderate | Severe | Mild | Moderate | Severe | |
| Total recall score |
[0–36] 32.27 (6.03) |
[0–36] 30.80 (7.11) |
[0–36] 22.78 (14.33) |
[3–35] 23.61 (10.30) |
[0–35] 16.00 (9.90) |
[2–20] 8.67 (9.87) |
[0–31] 9.00 (9.83) |
[0–33] 7.40 (10.79) |
[0–7] 1.40 3.13 |
| Free recall score |
[0–31] 19.31 (6.12) |
[0–31] 17.20 (6.56) |
[0–25] 11.78 (9.72) |
[0–18] 10.00 (6.11) |
[0–20] 8.32 (6.20) |
[0–12] 4.00 (6.93) |
[0–20] 4.53 (5.70) |
[0–21] 3.35 (5.81) |
[0–2] 0.40 (0.89) |
| Total intrusions a |
[0–29] 4.25 (5.53) |
[0–25] 4.95 (5.37) |
[0–18] 5.00 (5.96) |
[1–25] 8.94 (7.48) |
[1–33] 15.50 (9.70) |
[19–24] 22.00 (2.65) |
[0–35] 13.12 (11.14) |
[1–33] 15.43 (11.51) |
[11–11] 11.00 (–) |
| Trial 1 recall |
[0‐12] 10.42 (2.31) |
[0–12] 9.90 (2.54) |
[0‐12] 7.67 (4.61) |
[1–12] 7.78 (3.41) |
[0–12] 5.18 (3.19) |
[2–5] 3.00 (1.73) |
[0–8] 2.76 (2.86) |
[0–11] 2.40 (3.73) |
[0–2] 0.40 (0.89) |
| Trial 2 recall |
[0–12] 10.91 (2.11) |
[0–12] 10.27 (2.66) |
[0–12] 7.00 (4.90) |
[1–12] 7.83 (3.71) |
[0‐12] 5.68 (3.32) |
[0–9] 3.33 (4.93) |
[0‐11] 3.29 (3.51) |
[0–12] 2.45 (3.72) |
[0–2] 0.40 (0.89) |
| Trial 3 recall |
[0–12] 10.94 (2.20) |
[1–12] 10.62 (2.39) |
[0–12] 8.11 (4.96) |
[1–12] 8.00 (3.50) |
[0–0.12] 5.14 (3.86) |
[0–6] 2.33 (3.22) |
[0–12] 2.94 (3.67) |
[0–11] 2.55 (3.55) |
[0–3] 0.75 (1.50) |
Abbreviations: AD, Alzheimer's disease; CS, cognitively stable; DS, Down syndrome; MCI, mild cognitive impairment.
Lower scores indicate better performance.
Total recall scores of the three consensus‐defined groups were compared using an ANCOVA with diagnostic status and premorbid level of ID as between‐subject variables and age as a covariate (see Table 3). The effect of diagnostic status was large: F(2, 308) = 102.29, P < .001, ηp2= 0.40. Furthermore, small but statistically significant effects were observed for premorbid level of ID, in the expected direction. The interaction between premorbid level of ID and diagnostic status was not significant; however, a weak trend indicated that impairments associated with MCI‐DS and AD‐dementia were slightly greater for the moderate ID group compared to the mild ID group.
TABLE 3.
Premorbid level of ID × diagnostic status multivariate interaction and post hoc comparisons within diagnostic status group
| Main effects | |||||
|---|---|---|---|---|---|
| Diagnostic status | |||||
| Comparison by diagnostic status | Interaction | ||||
| Summary score totals | Premorbid level of ID | CS/MCI‐DS | CS/AD‐dementia | MCI‐DS/ AD‐dementia | Premorbid level of ID × diagnostic status |
| Total recall score | F(1, 308) = 10.55, P < .0001, ηp 2 = 0.03, | F(2, 308) = 102.29, P < .0001, ηp 2 = 0.40 | F(1, 308) = 2.94, P = .06 | ||
| <.0001 | <.0001 | <.0001 | |||
| Free recall score | F(1, 308) = 4.18, P = .042, ηp 2 = 0.01 | F(2, 308) = 54.44, P < .0001, ηp 2 = 0.26 | F(1, 308) < 1 | ||
| <.0001 | <.0001 | =.002 | |||
| Total intrusions | F(1, 302) = 10.07, P = .002, ηp 2 = 0.03 | F(2, 302) = 21.70, P < .0001, ηp 2 = 0.13 | F(1, 302) = 3.34, P = .034, ηp 2 = 0.02 | ||
| <.0001 | <.0001 | ns | |||
| Trial 1 recall | F(1, 308) = 9.52, P = .002, ηp 2 = 0.03 | F(2, 308) = 86.44, P < .0001, ηp 2 = 0.34 | F(1, 308) = 2.92, P = .06 | ||
| <.0001 | <.0001 | <.0001 | |||
| Trial 2 recall | F(1, 308) = 9.75, P = .002, ηp 2 = 0.03 | F(2, 308) = 86.57, P < .0001, ηp 2 = 0.36 | F(1, 308) = 1.38, ns | ||
| <.0001 | <.0001 | <.0001 | |||
| Trial 3 recall | F(1308) = 9.36, P = .002, ηp 2 = 0.03 | F(1308) = 104.26, P < .0001, ηp 2 = 0.40 | F(1308) = 4.02, P = .019, ηp 2 = 0.03 | ||
| <.0001 | <.0001 | <.0001 | |||
Abbreviations: AD, Alzheimer's disease; CS, cognitively stable; DS, Down syndrome; MCI, mild cognitive impairment.
Large group differences are important and necessary for any informative outcome measure in clinical trials targeting the transition from preclinical to prodromal AD. However, they do not provide a basis for informing individual diagnostic decisions. Receiver‐operating characteristic (or ROC) analyses were developed for that purpose, to determine the degree of overlap in score distributions between groups and to generate estimates of sensitivity and specificity. The overlap of the total recall score distributions was examined, initially comparing CS and MCI‐DS groups and then CS and AD‐dementia groups. The ROC analysis plots the proportion of affected individuals correctly identified (sensitivity) against the proportion of unaffected individuals incorrectly identified (1‐specificity, or false positives) across every possible score value. This provides a measure, the area under the curve (AUC), ranging from 0.5 (indicating total distribution overlap) to 1.0 (indicating complete non‐overlap).
Table 4 summarizes results from the ROC analyses of the total recall score, showing the trade‐off between sensitivity and specificity as scores fluctuate over the informative range of 20 (56% correct) to 36 (100% correct). The AUC of 0.843 (standard error [SE] = 0.032, 95% confidence interval [CI] = 0.78–0.91) when the CS and MCI‐DS groups were compared indicated that the mCRT total recall score is highly sensitive to MCI‐DS (reflective of prodromal AD in adults with DS) (Figure 2A). Sensitivity is even higher for individuals with AD‐dementia (see Table 4), with the AUC increasing to 0.955 (SE = 0.015, 95% CI = 0.93–0.99) when scores for the AD‐dementia group were compared to those for the CS group.
TABLE 4.
Sensitivity and specificity for total recall scores of 20 and above (possible range = 0–36) based on comparisons with CS individuals
| Criterion score | Specificity | Sensitivity: MCI‐DS | Sensitivity: AD‐dementia |
|---|---|---|---|
| 36 | 0.256 | 1.0 | 1.0 |
| 35 | 0.433 | 0.950 | 1.0 |
| 34 | 0.559 | 0.875 | 1.0 |
| 33 | 0.647 | 0.800 | 0.973 |
| 32 | 0.706 | 0.800 | 0.973 |
| 31 | 0.722 | 0.775 | 0.946 |
| 30 | 0.819 | 0.775 | 0.919 |
| 29 | 0.824 | 0.750 | 0.919 |
| 28 | 0.836 | 0.725 | 0.919 |
| 27 | 0.853 | 0.700 | 0.919 |
| 26 | 0.878 | 0.675 | 0.892 |
| 25 | 0.891 | 0.675 | 0.892 |
| 24 | 0.895 | 0.650 | 0.865 |
| 23 | 0.908 | 0.625 | 0.865 |
| 22 | 0.908 | 0.575 | 0.865 |
| 21 | 0.912 | 0.450 | 0.865 |
| 20 | 0.929 | 0.425 | 0.865 |
Abbreviations: AD, Alzheimer's disease; CS, cognitively stable; DS, Down syndrome; MCI, mild cognitive impairment.
FIGURE 2.
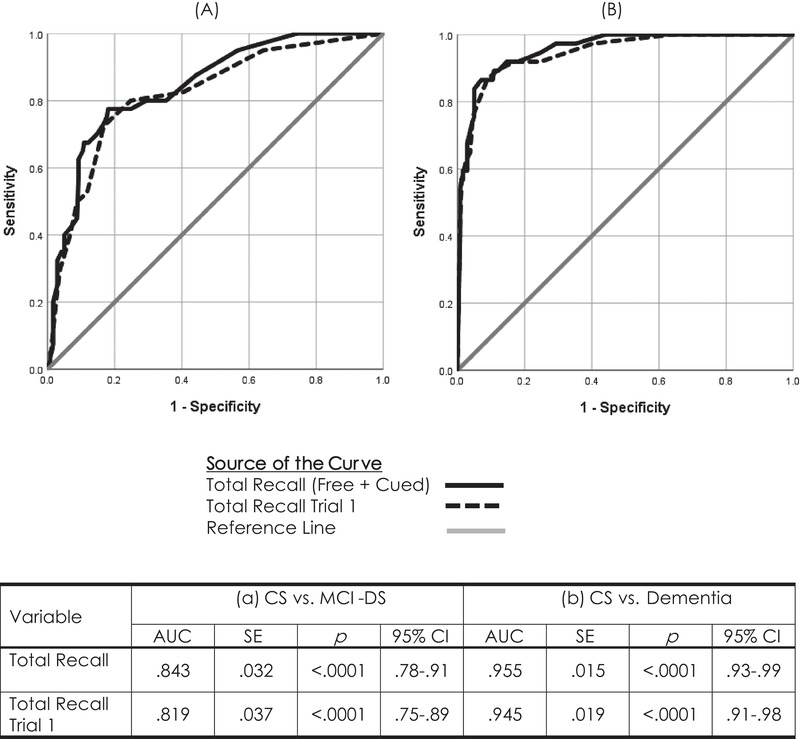
Receiver‐operating characteristic (ROC) curves comparing Total Recall performance of CS adults with Down syndrome to their peers with mild cognitive impairment (MCI‐DS) (panel A) or Alzheimer's disease (AD)‐dementia (panel B) across all three trials and for just Trial 1 of the modified Cued Recall Test (mCRT)
Additional analyses examined the effects of premorbid level of ID and age (coded here as a categorical variable) within the CS group, only to determine if these factors influenced performance independent of diagnostic status. The age‐group main effect was significant—F(4, 228) = 8.02, P < .001, ηp 2 = 0.123—with post hoc comparisons indicating that the oldest group (individuals over 55) performed worse than their younger peers (P’’s < .0001). The main effect of premorbid level of ID was not significant—F (1228) = 3.73, P = .055—although a weak trend was in the expected direction. An interaction between age‐group and premorbid level of ID was also not significant, with a trend indicating a greater difference between the oldest group and other age groups for individuals with moderate ID compared to mild ID. These additional results suggest that, compared to younger adults with DS, the mCRT total recall score will have lower specificity for adults with DS in their late 50s and older.
3.3. Analyses of secondary measures
Secondary measures derived from the mCRT include (1) the total number of items recalled without cueing (Total Free Recall), (2) the total number of Intrusions (extra‐list responses) across all three trials, and (3) trial by trial total recall score. As indicated in Table 3, secondary measures of mCRT performance showed significant differences between diagnostic groups. Thus each measure has potential for adding useful information to that provided by the total recall score, and these measures were examined further to address this potential.
First, correlations with total recall scores were calculated and all were highly significant (P’’s < .0001). The strongest associations were found for the individual trial scores (possible range for each trial = 0–12), r’s ≥ 0.93. Correlations with Free Recall and for Intrusions were lower, r = 0.75 and r = −0.65, respectively. (Note that high intrusion errors indicate poorer performance, accounting for the negative correlation coefficient.) These strong associations reflected a high degree of shared variance with Total Recall, implying that these additional measures of performance were unlikely to significantly improve predictions of diagnostic status.
The high correlation between Trial 1 performance and Total Recall, r = 0.933, P < .0001, suggested that administering only one trial might predict diagnostic status as well as the complete procedure, reducing the time and effort needed to obtain informative findings. An ROC analysis largely confirmed this suggestion, yielding an AUC = 0.819 (SE = 0.037, p < .0001, 95% CI = 0.747–0.892) when the CS and MCI‐DS groups (see Figure 2A) were compared based only on Trial 1 Total Recall performance. Sensitivities and specificities across the range of possible scores closely mirrored the profile observed for all three trials. A classification criterion of 10 (of a possible 12) yielded sensitivities of 0.800 and 0.919 for individuals with MCI‐DS and AD‐dementia (Figure 2B), respectively, while providing a specificity of 0.752.
4. DISCUSSION
The need for empirically validated measures reflecting cognitive decline related to prodromal AD in adults with DS is broadly recognized, as are the difficulties imposed by the presence of lifelong impairments that are known to vary considerably within this high‐risk population. Here, we have demonstrated the potential of the mCRT task for: (1) serving as an outcome measure in clinical trials targeting prevention or delay of the transition from preclinical to prodromal AD, (2) serving as an indicator of diagnostic status in studies examining the validity of AD biomarkers, and (3) informing individual diagnostic decisions in clinical practice. Overall, our results support the utility of this test, which is administered easily at a single point in time, for distinguishing CS adults with DS (and likely adults with mild to moderate ID due to other causes) from those with prodromal AD, at least for those without a history of severe intellectual or sensory impairments. This is especially true when extreme scores are observed, either high (indicating confidence that cognitive processes are stable) or low (indicating confidence that declines have occurred).
Although the present study confirmed that mCRT performance is sensitive to prodromal AD and its further progression (consistent with the findings of Benejam et al. 19 ), findings diverged from an earlier 16 study. Devenny et al. 16 found that a total recall score criterion of ≤23 provided near perfect sensitivity (0.947) and specificity (0.939), whereas the present ROC analysis, was unable to identify a comparable balance between sensitivity and specificity. This is an important difference that merits discussion. Devenny et al. included a smaller sample, and it is possible that the present sample is more representative of the overall population of older adults with DS. However, the use of very different methods for determining diagnostic status seems a more likely source of inconsistency. The present study evaluated each individual on a broad set of cognitive and behavioral measures at a case consensus meeting, whereas Devenny et al. relied on either a positive finding on the Dementia Scale for Down Syndrome 22 or a physician diagnosis of dementia. Most important, Devenny et al. did not distinguish between MCI‐DS and “early dementia.”
Accepting differences in methods, both studies have provided strong empirical support for the utility of the mCRT for evaluating individuals with DS, who are at high risk for AD dementia, especially for individuals with histories of mild to moderate ID. Criterion scores provided in Tables 4 and 5, associated with varying degrees of confidence, offer a guide for use in clinical settings. For example, individuals with total recall scores ≥33 are extremely unlikely to have MCI‐DS, and dementia can be ruled out altogether. On the other hand, individuals scoring below 20 are unlikely to be CS. “Intermediate” values provide estimates of diagnostic confidence that can also help to inform clinical judgment. Our results also suggest that three trials may not be necessary; one trial may provide sufficient information for informing clinical judgments. This would significantly reduce time of administration and participant burden. Furthermore, ease of use together with its ability to inform clinical judgments through a single administration make the mCRT attractive for use in clinical practice.
TABLE 5.
Sensitivity and specificity for total recall scores during Trial 1 based on comparisons with CS individuals
| Criterion score | Specificity | Sensitivity: MCI‐DS | Sensitivity: AD‐dementia |
|---|---|---|---|
| 12 | 0.357 | 0.950 | 0.973 |
| 11 | 0.597 | 0.825 | 0.919 |
| 10 | 0.752 | 0.800 | 0.919 |
| 9 | 0.832 | 0.725 | 0.892 |
| 8 | 0.882 | 0.525 | 0.865 |
| 7 | 0.912 | 0.500 | 0.500 |
| 6 | 0.933 | 0.400 | 0.811 |
| 5 | 0.954 | 0.325 | 0.757 |
| 4 | 0.962 | 0.300 | 0.649 |
| 3 | 0.975 | 0.200 | 0.622 |
| 2 | 0.987 | 0.075 | 0.568 |
| 1 | 0.992 | 0.025 | 0.459 |
| 0 | 1.0 | 0 | 0 |
Abbreviations: AD, Alzheimer's disease; CS, cognitively stable; DS, Down syndrome; MCI, mild cognitive impairment.
The mCRT may also serve as a critically important tool in studies targeting biomarkers of preclinical AD prior to MCI‐DS onset. In vitro biomarker technology is developing rapidly and prospective studies that are able to show relationships with future clinical progression are needed. Objective measures able to distinguish between preclinical and prodromal AD must be a critical component of this research.
Several limitations of the present findings need to be recognized. First, reliance on any evaluation conducted at a single point is unable to provide a literal measure of change in performance, and the mCRT, when used in this way, provides only an indication of how present performance likely compares to past ability. Second, performance on the mCRT was found to be age dependent and detailed inspection showed that false‐positive scores increased substantially for CS adults with DS who were older than 55 years. For these adults, high performance provides evidence of cognitive stability but low performance is less informative. This also applies to adults with histories of severe ID. For the small number of cases with uninformative performance on the mCRT, additional sources of information are clearly needed for guiding diagnostic decisions. Those other sources can include other direct tests of cognition (e.g., Down Syndrome Mental Status Examination 23 ), empirically validated informant interviews (e.g., the Dementia Questionnaire for People with Learning Disabilities 24 or the National Task Group–Early Detection Screen for Dementia 25 , 26 ) and follow‐up longitudinal assessment. Third, this evaluation of the mCRT rests on the validity of the reference standard for determining diagnostic status. In this case, comprehensive cognitive testing, information provided by multiple informant interviews, and examinations by physicians or neurologists. However, efforts to standardize all procedures across multiple enrolling sites invariably fell short of perfection, and clinical judgments across teams at different sites can always introduce some level of variability. These sources of possible “noise” would have little effect on group comparisons but would be expected to lower estimates of sensitivity and specificity.
Finally, some “false‐negative” findings, where mCRT performance was high within the MCI‐DS and AD‐dementia groups, could prove to be “true negatives.” In studies of other populations at risk for AD and related diseases, a substantial minority of prodromal cases “revert” to preclinical status at follow‐up. It seems likely that something similar could apply for adults with MCI‐DS. We plan to address this possibility with future analyses as data provided by longitudinal follow‐up becomes available.
From a biomedical science perspective, knowledge regarding the earliest stages of AD is vital in furthering an understanding of how the disease evolves, for adults with DS and more generally. More than two‐thirds of adults with DS have the clinical symptoms of dementia by the time they reach 65 years of age, which speaks to a pressing need for clear and objective standards defining MCI in this largest genetically defined high‐risk population. In summary, our study shows that the mCRT is a sensitive test and provides an important advancement toward this goal.
CONFLICT OF INTEREST
The authors have no conflicts of interest to disclose.
Supporting information
SUPPORTING INFORAMTION
ACKNOWLEDGMENTS
The authors thank the Alzheimer's Biomarker Consortium (ABC‐DS) study participants (adults with Down syndrome and their siblings), their families and other care providers, and the ABC‐DS research and support staff for their invaluable contributions to this study. Finally, the authors thank the staff contributing their many hours of support to this work. The content is the sole responsibility of the authors and does not necessarily represent the official views of the National Institutes of Health (NIH). This work was supported by grants from the NHI (R01 AG021912, R01 HD065160, R56 AG061837, P01 HD035897, AG014673, U01 AG051406, U01 AG051412, and U19 AG068054), funds from the New York State Office for People with Developmental Disabilities, and unrestricted funds from the UCI School of Medicine (MM). The work contained in this publication was also supported through the following NIH Programs: The Alzheimer's Disease Research Centers Program (P50 AG008702, P30 AG062421, P50 AG16537, P50 AG005133, P50 AG005681, and P30 AG062715), the Eunice Kennedy Shriver Intellectual and Developmental Disabilities Research Centers Program (U54 HD090256 and U54 HD087011), the National Centers for Advancing Translational Sciences (UL1 TR001873, UL1 TR002373, UL1 TR001414, UL1 TR001857, and UL1 TR002345), the National Centralized Repository for Alzheimer Disease and Related Dementias (U24 AG21886), and DS‐Connect (The Down Syndrome Registry), supported by the Eunice Kennedy Shriver National Institute of Child Health and Human Development.
APPENDIX A.
Alzheimer's Biomarker Consortium—Down Syndrome (ABC‐DS) collaborators
Howard J. Aizenstein, MD, PhD; Beau M. Ances, MD, PhD; Howard F. Andrews, PhD; Karen Bell, MD; Rasmus M. Birn, PhD; Adam M. Brickman, PhD; Peter Bulova, MD; Amrita Cheema, PhD; Kewei Chen, PhD; Bradley T. Christian, PhD; Isabel C.H. Clare, PhD; Lorraine Clark, PhD; Ann D. Cohen, PhD; John N. Constantino, MD; Eric W. Doran, MS; Anne Fagan, PhD; Eleanor Feingold, PhD; Tatiana M. Foroud, PhD; Benjamin L. Handen, PhD; Sigan L. Hartley, PhD; Elizabeth Head, PhD; Rachel Henson, PhD; Christy Hom, PhD; Lawrence Honig, MD; Milos D. Ikonomovic, MD; Sterling C Johnson, PhD; Courtney Jordan, RN; M. Ilyas Kamboh, PhD; David Keator, PhD; William E. Klunk, MD, PhD; Julia K. Kofler, MD; Cynthia Kovacs, MA; William Charles Kreisl, MD; Sharon J. Krinsky‐McHale, PhD; Florence Lai, MD; Patrick Lao, PhD; Charles Laymon, PhD; Joseph H Lee, PhD; Tracy Listwan, MPH; Ira T. Lott, MD; Victoria Lupson, PhD; Mark Mapstone, PhD; Chester A. Mathis, PhD; Davneet Singh Minhas, PhD; Neelesh Nadkarni, MD; Sid O'Bryant, PhD; Deborah Pang, MPH; Melissa Petersen, PhD; Julie C. Price, PhD; Margaret Pulsifer, PhD; Michael Rafii, MD, PhD; Eric Reiman, MD; Batool Rizvi, MS; Herminia Diana Rosas, MD; Nicole Schupf, PhD; Wayne P. Silverman, PhD; Dana L. Tudorascu, PhD; Rameshwari Tumuluru, MD; Benjamin Tycko, MD, PhD; Badri Varadarajan, PhD; Desiree A. White, PhD; Michael A. Yassa, PhD; Shahid Zaman, MD, PhD; Fan Zhang, PhD.
Krinsky‐McHale SJ, Hartley S, Hom C, et al. A modified Cued Recall Test for detecting prodromal AD in adults with Down syndrome. Alzheimer's Dement. 2022;14:e12361. 10.1002/dad2.12361
Krinsky‐McHale and Silverman contributed equally to the work reported in this article.
REFERENCES
- 1. Handen BL, Lott IT, Christian BT, et al. The Alzheimer's Biomarker Consortium—Down Syndrome: rationale and methodology. Alzheimers Dement. 2020;12(1):1‐15.e12065. doi: 10.1002/dad2.12065 [DOI] [PMC free article] [PubMed] [Google Scholar]
- 2. McKhann GM, Knopman DS, Chertkow H, et al. The diagnosis of dementia due to Alzheimer's disease: recommendations from the National Institute on Aging‐Alzheimer's Association workgroups on diagnostic guidelines for Alzheimer's disease. Alzheimers Dement. 2011;7(3):263‐269. doi: 10.1016/j.jalz.2011.03.005 [DOI] [PMC free article] [PubMed] [Google Scholar]
- 3. Petersen RC, Smith GE, Waring SC, Ivnik RJ, Tangalos EG, Kokmen E. Mild cognitive impairment: clinical characterization and outcome. Arch Neurol. 1999;56(3):303‐308. doi: 10.1001/archneur.56.3.303 [DOI] [PubMed] [Google Scholar]
- 4. Machulda MM, Lundt ES, Albertson SM, et al. Neuropsychological subtypes of incident mild cognitive impairment in the Mayo Clinic Study of Aging. Alzheimers Dement. 2019;15(7):878‐887. doi: 10.1016/j.jalz.2019.03.014 [DOI] [PMC free article] [PubMed] [Google Scholar]
- 5. Markowitsch HJ, Staniloiu A, Amnesic disorders. Lancet. 2012;380(9851):1429‐1440. doi: 10.1016/s0140-6736(11)61304-4 [DOI] [PubMed] [Google Scholar]
- 6. Krinsky‐McHale SJ, Zigman WB, Lee JH, et al. Promising outcome measures of early Alzheimer's dementia in adults with Down syndrome. Alzheimers Dement (Amst). 2020;12(1):e12044. doi: 10.1002/dad2.12044 [DOI] [PMC free article] [PubMed] [Google Scholar]
- 7. Silverman W, Schupf N, Zigman W, et al. Dementia in adults with mental retardation: assessment at a single point in time. Am J Ment Retard. 2004;109(2):111‐125. [DOI] [PubMed] [Google Scholar]
- 8. Startin CM, Hamburg S, Hithersay R, et al. The LonDownS adult cognitive assessment to study cognitive abilities and decline in Down syndrome. Wellcome Open Res. 2016;1:11. doi: 10.12688/wellcomeopenres.9961.1 [DOI] [PMC free article] [PubMed] [Google Scholar]
- 9. Ball SL, Holland AJ, Treppner P, Watson PC, Huppert FA. Executive dysfunction and its association with personality and behaviour changes in the development of Alzheimer's disease in mild to moderately learning disabled adults with Down syndrome. Br J Clin Psychol. 200847(1):1‐29. [DOI] [PubMed] [Google Scholar]
- 10. Desgranges B, Baron JC, Giffard B, et al. The neural basis of intrusions in free recall and cued recall: a PET study in Alzheimer's disease. Neuroimage. 2002;17(3):1658‐1664. doi: 10.1006/nimg.2002.1289 [DOI] [PubMed] [Google Scholar]
- 11. Grober E, Buschke H. Genuine memory deficits indementia. Dev Neuro Psycho. 1987;13:13‐36. doi: 10.1080/8756564870954036115 [DOI] [Google Scholar]
- 12. Grober E, Buschke H, Crystal H, Bang S, Dresner R. Screening for dementia by memory testing. Neurology. 1988;38(6):900‐903. [DOI] [PubMed] [Google Scholar]
- 13. Grober E, Hall C, Sanders AE, Lipton RB. Free and cued selective reminding distinguishes Alzheimer's disease from vascular dementia. J Am Geriatr Soc. 2008;56(5):944‐946. doi: 10.1111/j.1532-5415.2008.01652.x [DOI] [PMC free article] [PubMed] [Google Scholar]
- 14. Grober E, Veroff AE, Lipton RB. Temporal unfolding of declining episodic memory on the Free and Cued Selective Reminding Test in the predementia phase of Alzheimer's disease: implications for clinical trials. Alzheimers Dement (Amst). 2018;10:161‐171. doi: 10.1016/j.dadm.2017.12.004 [DOI] [PMC free article] [PubMed] [Google Scholar]
- 15. Buschke H. Cued recall in amnesia. J Clin Neuropsychol. 1984;6(4):433‐440. [DOI] [PubMed] [Google Scholar]
- 16. Devenny DA, Zimmerli EJ, Kittler P, Krinsky‐McHale SJ. Cued recall in early‐stage dementia in adults with Down's syndrome. J Intellect Disabil Res. 2002;46(Pt 6):472‐483. [DOI] [PubMed] [Google Scholar]
- 17. Devenny DA, Krinsky‐McHale SJ. The Cued Recall Test: detection of memory impairment. In: Prasher VP, ed. Neuropsychological Assessments of Dementia in Down Syndrome and Intellectual Disabilities. Springer; 2009:143‐161:chap 9. [Google Scholar]
- 18. Devenny DA, Krinsky‐McHale SJ, Adetoki A. The Cued Recall Test: detection of memory impairment. In: Prasher VP, ed. Neuropsychological Assessments of Dementia in Down Syndrome and Intellectual Disabilities. 2nd ed. Springer International Publishing; 2018:161‐180:chap 9. [Google Scholar]
- 19. Benejam B, Videla L, Vilaplana E, et al. Diagnosis of prodromal and Alzheimer's disease dementia in adults with Down syndrome using neuropsychological tests. Alzheimers Dement (Amst). 2020;12(1):e12047. doi: 10.1002/dad2.12047 [DOI] [PMC free article] [PubMed] [Google Scholar]
- 20. Snodgrass JG, Vanderwart M. A standardized set of 260 pictures: norms for name agreement, image agreement, familiarity, and visual complexity. J Exp Psychol Hum Learn. 1980;6(2):174‐215. doi: 10.1037//0278-7393.6.2.174 [DOI] [PubMed] [Google Scholar]
- 21. Krinsky‐Mchale SJ, Zigman WB, Lee JH, et al. Promising outcome measures of early Alzheimer's dementia in adults with Down syndrome. Alzheimers Dement (Amst). 2020;12(1):1‐11.e12044. doi: 10.1002/dad2.12044 [DOI] [PMC free article] [PubMed] [Google Scholar]
- 22. Gedye A. Dementia scale for down syndrome manual. Vancouver (BC) 1995. [Google Scholar]
- 23. Haxby JV. Neuropsychological evaluation of adults with Down's syndrome: patterns of selective impairment in non‐demented old adults. J Ment Defic Res. 1989;33(Pt 3):193‐210. [DOI] [PubMed] [Google Scholar]
- 24. Evenhuis HM. Evaluation of a screening instrument for dementia in ageing mentally retarded persons. J Intellect Disabil Res. 1992;36(Pt 4):337‐347. [DOI] [PubMed] [Google Scholar]
- 25. Esralew L, Janicki MP, DiSipio M, Jokinen N, Keller S and Members of the. National Task Group Early Detection Screen for Dementia: manual. 2013; Manual. Available from: www.aadmd.org/ntg/screening
- 26. Silverman W, Krinsky‐McHale SJ, Lai F, et al. Evaluation of the National Task Group‐Early Detection Screen for Dementia: sensitivity to 'mild cognitive impairment' in adults with Down syndrome. J Appl Res Intellect Disabil. 2021;34(3):905‐915. doi: 10.1111/jar.12849 [DOI] [PMC free article] [PubMed] [Google Scholar]
Associated Data
This section collects any data citations, data availability statements, or supplementary materials included in this article.
Supplementary Materials
SUPPORTING INFORAMTION