Abstract
Objective
To detect the expression of fibrinogen like protein-1 (FGL-1) in laryngeal cancer and evaluate its effect on tumor proliferation, metastasis, and antitumor immunity.
Methods
ELISA and immunohistochemistry were performed to detect FGL-1 expression in laryngeal cancer. The effects of FGL-1 knockdown on the proliferation, cell cycle progression, apoptosis, migration, and invasion of laryngeal cancer cells were evaluated by the CCK-8, colony formation, flow cytometry, Transwell migration, and western blot assays. We detected changes in tumorigenesis and drug response in vivo following FGL-1 knockdown as well as the effects of anti-LAG3 immunotherapy. Immunohistochemistry was performed to determine CD8 and LAG-3 expression in mouse tumor tissues.
Results
FGL-1 was highly expressed in the plasma and tumor tissues of laryngeal cancer patients. FGL-1 knockdown suppressed the proliferation of TU-686 cells and inhibited the migration and invasion of laryngeal cancer by blocking epithelial-to-mesenchymal transition. Moreover, silencing FGL-1 inhibited tumorigenicity in vivo and synergized with anti-LAG3 immunotherapy.
Conclusions
We confirmed the high expression of FGL-1 in laryngeal cancer and identified FGL-1 as a potential marker for immunotherapy in laryngeal cancer.
Keywords: Fibrinogen like protein-1, lymphocyte activating gene 3, laryngeal cancer, immunotherapy, migration, invasion, epithelial-to-mesenchymal transition
Introduction
Laryngeal squamous cell cancer is the second most common subtype of head and neck squamous cell cancer (second only to oral squamous cell cancer), with 184,615 new cases and 99,840 deaths reported annually worldwide. 1 Common treatments for laryngeal cancer include surgery, radiotherapy, and chemotherapy, with combination treatment strategies involving surgery being the first choice treatment for advanced laryngeal cancers. 2 However, patients lose the opportunity for surgery when laryngeal tumors invade the carotid artery, skull base, and/or anterior vertebral muscles. 3
Immunotherapy achieves long-lasting antitumor effects by activating the host's immune system. 4 Immunosuppressive receptor molecules including programmed cell death protein 1 (PD-1), cytotoxic T lymphocyte antigen 4 (CTLA-4), lymphocyte activating gene 3 (LAG-3), and T cell immunoglobulin mucin 3 (TIM-3), which combine with their corresponding ligands to exert immunosuppressive effects, have all been successfully targeted for anticancer therapy. Targeting these molecules can reverse immunosuppressive effects and activate antitumor immunity.5–6 Nivolumab and pembrolizumab, which are monoclonal antibodies against PD-1, were the first immunotherapies approved by the FDA for the treatment of platinum-refractory head and neck squamous cell cancer.7–8 However, immunotherapies still have limitations in clinical application such as pseudoprogression, hyperprogression, primary or adaptive drug resistance, and side effects.9–13 Therefore, it is important to find new immunotherapy targets to improve the efficacy of immunotherapy.
LAG-3 is an inhibitory co-receptor that is structurally similar to CD4 and plays a crucial role in immunotolerance. 14 Additionally, LAG-3 cooperates with PD-1 to exert immunosuppression in autoimmunity, tumor immunity, and infection. Previous studies have concluded that major histocompatibility complex II (MHC II) is the canonical ligand for LAG-3;15–16 however, a recent study demonstrated fibrinogen like protein-1 (FGL-1) to be a novel high-affinity ligand of LAG-3. 17
FGL-1 is a member of the fibrinogen family that is mainly expressed in the liver, pancreas, and blood plasma. In physiological conditions, FGL-1 is primarily involved in liver repair, hepatocyte regeneration, and glucose and fat metabolism. In pathological conditions such as acute hepatitis, there is elevated FGL-1 expression in the blood plasma. 18 Additionally, FGL-1 binds to LAG-3 to exert immunosuppressive effects in non-small cell lung cancer and melanoma mouse models.19–20 However, the expression and mechanism of FGL-1 in laryngeal carcinoma remains unclear.
In this study, we evaluated the expression of FGL-1 in the tumor tissue and blood plasma of laryngeal cancer patients. We also investigated the role of FGL-1 in the proliferation and metastasis of laryngeal cancer cells. Importantly, our in vivo data show a synergistic antitumor effect of inhibiting FGL-1 with LAG-3 blockade in tumor-bearing mice.
Materials and methods
Ethics statement
The use of clinical specimens in this study was approved by the Ethics Committee of The Eye and ENT Hospital Affiliated to Fudan University, Shanghai, China. A signed informed consent form was obtained from each patient. All animal experiments were reviewed and approved by the Ethics Committee of The Eye and ENT Hospital Affiliated to Fudan University (No. 2022076). Mice were housed in laminar flow cabinets at The Department of Laboratory Animal Science of The Eye and ENT Hospital Affiliated to Fudan University. All mouse surgeries were performed under ketamine/xylazine-induced anesthesia.
Patients and tissue samples
All surgical tissue specimens were obtained from laryngeal squamous cell carcinoma patients or patients with vocal cord polyps who underwent surgery at The Fudan University Eye and ENT Hospital between January 2017 and December 2017. None of the patients had received prior chemotherapy or radiotherapy. All blood plasma samples were obtained from patients with laryngeal squamous cell carcinoma, vocal cord polyps, or vocal cord leukoplakia who had undergone surgery at The Fudan University Eye and ENT Hospital between January 2019 and December 2019.
Cell culture
The human laryngeal squamous cancer cell line TU-686 was purchased from The Chinese Academy of Sciences Cell Bank (Shanghai, China) and cultured in high-glucose DMEM (Gibco, Thermo Fisher Scientific, Waltham, MA, USA) supplemented with 10% fetal bovine serum (FBS; Gibco). The murine squamous cancer cell line SCC7 (RRID: CVCL_V412) was obtained from The ENT National Laboratory of The Fudan Eye and ENT Hospital and cultured in RPMI 1640 media (Gibco, Thermo Fisher Scientific) supplemented with 10% FBS (Gibco). Cells were cultured in a humidified thermostatic incubator at 37°C with 5% CO2, and the medium was replaced every other day.
Reverse transcription-quantitative PCR (qPCR)
Total RNA was extracted using TRIzol (Invitrogen; Thermo Fisher Scientific) in accordance with the manufacturer’s protocol, and cDNA was generated using PrimeScript RT Master Mix (RR036A, Takara Bio Inc., Kusatsu, Japan). The protocol included incubation at 37°C for 15 minutes, followed by 85°C for 5 s, and then termination at 4°C. Real-time PCR assays were performed using SYBR Premix Ex Taq™ (RR420A, Takara Bio Inc.) in accordance with the manufacturer’s protocol (initial denaturation for 15 minutes at 95°C, followed by 40 cycles of denaturation at 94°C for 30 s, annealing at 56°C for 30 s, and extension at 72°C for 30 s, with a final extension at 72°C for 5 minutes). Sequences of the primers used are listed in Supplementary Table S1. All results were analyzed by the 2−ΔΔCt method.
FGL-1 knockdown lentiviral vector construction and infection
FGL-1 shRNA constructs were cloned into the PGMLV-SC5 vector. A FGL-1 knockdown cell line was developed by lentivirus-mediated shRNA infection. Briefly, the plasmid was transfected into 293T cells using HG transgene reagent (Genomeditech, Shanghai, China). Then, media containing transfection reagents were removed 18 hours later, and the 293T cells were cultured in DMEM + 10% FBS for 48 hours. The cell culture medium was collected and centrifuged at 4500 × g for 5 minutes. The virus was syringe-filtered through a 0.45-μm nylon filter, and then concentrated to 5 × 10⁸ TU/mL. Lentivirus-containing medium was then added onto TU-686 and SCC7 cells. After 48-hour infection, the virus-containing medium was replaced with fresh medium. The stably expressing shRNA cell line with FGL-1 knockdown was established after puromycin selection. Western blot and qPCR assays were performed to verify the knockout effect.
Enzyme-linked immunosorbent assay (ELISA)
FGL-1 expression levels in plasma specimen were detected using a human FGL-1 ELISA Kit (CUSABIO, Wuhan, China). Briefly, diluted plasma samples were co-incubated for 2 hours at 37°C in a microwell plate pre-coated with anti-FGL-1 antibody. Then anti-biotin antibody was added into the microwell and incubated for 1 hour at 37°C. Following a washing step, horseradish peroxide (HRP)-avidin was added into the microwell and incubated for 1 hour at 37°C. After stopping the enzymatic reaction, results were generated by measuring the optical density of the solution in the well at 450 nm.
Immunohistochemistry
Slices of paraffin-embedded tumor and vocal cord polyp tissues were deparaffinized with xylene, rehydrated with a graded series of ethanol solutions, rinsed with phosphate-buffered saline (PBS), and treated with 3% hydrogen peroxide and goat serum to inactivate endogenous peroxidases. Then tissue sections were probed with recombinant anti-FGL1 antibody [EPR24018-27] (ab275091, Abcam, Cambridge, UK) at 4°C overnight. After washing, sections were incubated with goat anti-rabbit secondary antibody (1:250 dilution; cat no., BA1003, Wuhan Boster Biological Technology, Ltd., Wuhan, China) for 1 hour at room temperature. The tissue sections were washed with TBST, and then 3,3′-diaminobenzidine (DAB; Wuhan Boster Biological Technology, Ltd.) was added onto sections as the chromogen and incubated at room temperature for 5 minutes. Images were captured with a fluorescence microscope (DMI4000b, Leica, Wetzlar, Germany) and evaluated by two pathologists. The evaluation criteria were as follows: the percentage of positive expression was evaluated as: 0, 0% positive cells; 1, 1% to 10% positive cells; 2, 11% to 50% positive cells; 3, >50% positive cells; the staining intensity was evaluated as follows: 0, negative; 1, weak; 2, moderate; 3, high. The final score was the sum of the percentage and intensity scores. Together, cases with 0 to 3 total points were considered negative and cases with 4 to 9 total points were considered positive. The immunohistochemistry methods for murine tumor tissues were the same as above. The primary antibodies used were as follows: anti-CD8 antibody (ab209775, Abcam) and anti-LAG-3 antibody (ab209238, Abcam). The Image-Pro Plus 6.0 (Media Cybernetics, Silver Springs, MD, USA) image analysis system was used for quantitative analysis.
Cell proliferation assay
TU-686 (RRID: CVCL_4916) cells with FGL-1 knockdown were cultured in 96-well microwell plates at a density of 1 × 10³ cells/well. The cells were divided into 5 groups according to the number of days in culture (1–5 days). CCK-8 was used to detect cell proliferation. Briefly, CCK-8 reagent was added to the microwells and incubated at 37°C for 2.5 hours. The absorbance of each well at 450 nm was evaluated using a microplate reader (Bio-Rad 680; Bio-Rad Laboratories, Inc., Hercules, CA, USA).
Colony formation assay
TU-686-FGL1-sh and TU-686-NC-sh cells were placed into 6-well plates at 200 cells per well. The medium was replaced every 3 days for 2 weeks. After staining with crystal violet, ImageJ software was used to determine the number of colonies. Statistical analysis was performed with the independent-samples Student’s T test.
Apoptosis and cell cycle analyses
TU-686 cells were digested with trypsin and washed with PBS. Then a portion of the cells was incubated with Annexin-V and propidium iodide (PI) (Invitrogen; Thermo Fisher Scientific). Rates of apoptosis were evaluated by flow cytometry, and the results were analyzed using FlowJo v10 software (FlowJo LLC, Ashland, OR, USA). Another portion of the cells was fixed with ethanol at 4°C overnight, washed with PBS, and stained with PI. Flow cytometry was used to evaluate the proportion of cells in each phase of the cell cycle.
Transwell invasion assay
A 24-well plate containing an 8-μm pore insert (Corning Incorp., Corning, NY, USA) was used to assess tumor cell migration and invasion. For the invasion assay, the membrane was coated with Matrigel to form a matrix barrier, and 2 × 10⁵ cells were placed into the upper chamber. For migration assays, only 5 × 10⁴ cells were seeded into the upper chamber. After gently loading 200 μL of cells in serum-free RPMI 1640 medium into each filter element (upper chamber), 600 μL of RPMI 1640 medium containing 10% FBS was added to each lower chamber. Then the plates were incubated at 37°C 18 or 24 hours, for migration and invasion assays, respectively. Next, the filter element was removed from the chamber, and the migrated or invaded cells were fixed and stained with hematoxylin for 20 minutes. A Nikon Ti-E inverted microscope (Nikon, Tokyo, Japan) was used to count and image the number of cells that had migrated or invaded.
Western blot
TU-686 cell lysates were prepared using RIPA lysis buffer (Beyotime Institute of Biotechnology, Shanghai, China). The protein concentrations were determined using the BCA assay (Beyotime Institute of Biotechnology). For electrophoresis, equal amounts of cell lysates (30 μg) were separated by SDS-PAGE, and then transferred to polyvinylidene fluoride membranes (Beyotime Institute of Biotechnology). Primary antibodies were incubated with the membranes in 5% milk/TBST overnight at 4°C. Membranes were probed with the following antibodies: anti-FGL-1 (ab275091, Abcam), anti-E-cadherin, anti-N-cadherin, anti-Snail, and anti-Vimentin (Epithelial-to-Mesenchymal Transition [EMT] Antibody Sampler Kit, #9782, Cell Signaling Technology, Danvers, MA, USA), and anti-GADPH (Beyotime Institute of Biotechnology). Bound antibodies were detected with HRP-conjugated secondary antibodies and visualized with enhanced chemiluminescent substrates (Beyotime Institute of Biotechnology).
In vivo drug response and tumor growth assays
SCC7-FGL1-sh cells were transplanted into 5-week-old C57BL/6 mice by subcutaneous injection into the right flanks (5 × 10⁵ cells/mouse). Mice were treated weekly with LAG-3 antibody (IP0070, BioXcell, Lebanon, NH, USA) or isotype control (BE0088, BioXcell) starting at the first week after subcutaneous injection (200 μg/mouse/week). Tumor volumes were recorded weekly. After 4 weeks, mice were sacrificed by cervical dislocation, and tumors were surgically removed, weighed, photographed, and stored in the formalin at room temperature for histological analysis. Detailed immunohistochemistry methods are described above, and the expression of CD8 and LAG-3 were evaluated.
Statistical analysis
All experiments were performed three times independently. The chi-square test was used to analyze immunohistochemistry results. A two-tailed Student’s t-test was used to analyze all other results. SPSS version 20 (IBM Corp., Armonk, NY, USA) and GraphPad Prism 7 (GraphPad Software, Inc., San Diego, CA, USA) were used to perform statistical analyses and generate graphs. P < 0.05 was the cutoff to indicate a statistically significant difference.
Results
FGL-1 was highly expressed in the plasma and tumor tissues of laryngeal cancer patients
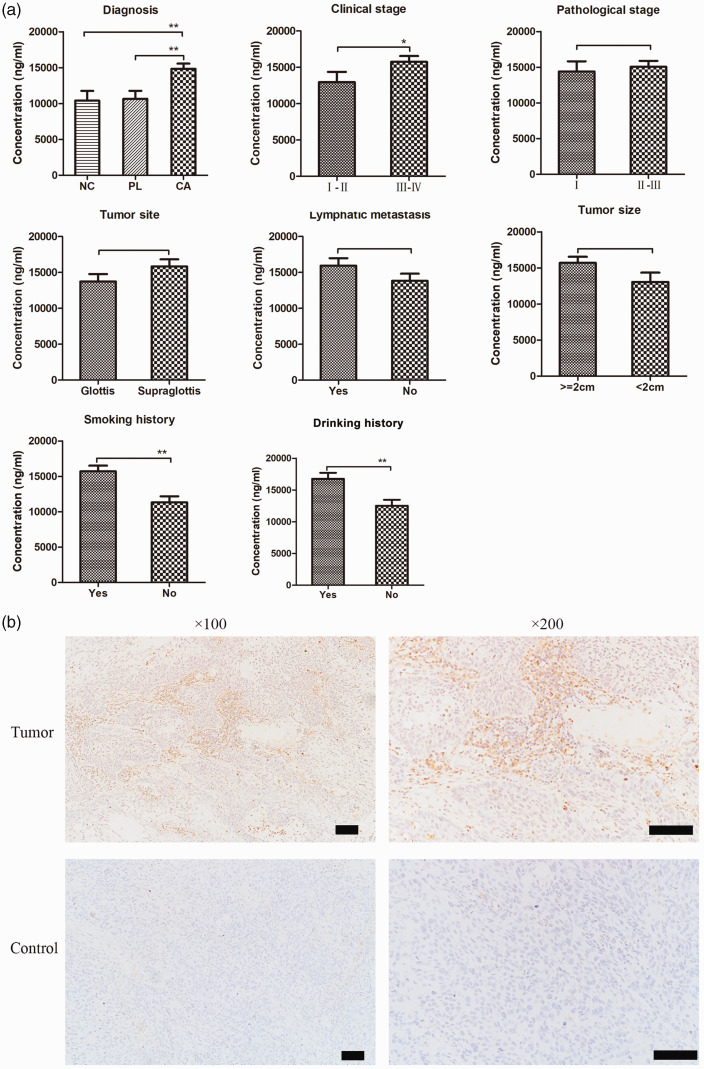
To determine FGL-1 expression levels in plasma and tumor samples of laryngeal cancer patients, we performed ELISA and immunohistochemistry, respectively. We collected blood samples from 62 patients with laryngeal cancer, 28 with vocal cord polyps, and 17 with vocal cord leukoplakia from The Fudan ENT Hospital, and ELISA was performed to investigate FGL-1 expression. The results are shown in Table 1. We found significantly higher FGL-1 expression in the plasma of laryngeal cancer patients than in those with vocal polyps (p < 0.01) or precancerous lesions (p < 0.01); however, there was no significant difference between FGL-1 expression in patients with vocal polyps or precancerous lesions (Figure 1a). To further explore the relationship between plasma FGL-1 levels and the clinical characteristics of laryngeal cancer patients, FGL-1 plasma expression was compared between patients with various clinical stages, pathological stages, tumor sites, tumor sizes, lymphatic metastasis, and smoking and drinking histories (Figure 1a). The results showed that FGL-1 expression was higher in patients with later clinical stages (p = 0.04) and histories of smoking (p < 0.01) and drinking (p < 0.01) but was not associated with tumor site, tumor size, pathological stage, or lymphatic metastasis.
Table 1.
FGL-1 levels in the plasma of laryngeal cancer patients.
| Sample size | FGL-1 Concentration (ng/mL) | P-value | |
|---|---|---|---|
| Diagnosis | |||
| Laryngeal cancer | 62 | 14999.8804 | 0.001 |
| Vocal leukoplakia | 17 | 10652.96659 | |
| Vocal polyps | 28 | 10414.33396 | |
| Clinical stage | |||
| I–II | 20 | 12943.9235 | 0.041 |
| III–IV | 42 | 15978.9076 | |
| Pathological stage | |||
| I | 21 | 14398.53523 | 0.541 |
| II–III | 41 | 15307.88653 | |
| Tumor site | |||
| Glottis | 29 | 13718.3852 | 0.085 |
| Supraglottis | 33 | 16126.0429 | |
| Lymphatic metastasis | |||
| Yes | 30 | 16262.6754 | 0.079 |
| No | 32 | 13816.01016 | |
| Tumor size | |||
| ≥2 cm | 42 | 15932.4566 | 0.052 |
| <2 cm | 20 | 13041.4705 | |
| Smoking history | |||
| Yes | 50 | 15886.7508 | 0.008 |
| No | 12 | 11304.5873 | |
| Drinking history | |||
| Yes | 34 | 16762.5614 | 0.008 |
| No | 28 | 12859.4822 |
Two-tailed Student’s t-tests were used to analyze the data.
ELISA, Enzyme-linked immunosorbent assay.
Figure 1.
FGL-1 expression in laryngeal cancer. The expression of FGL-1 in plasma samples of laryngeal cancer patients divided by different clinical characteristics including diagnosis, clinical stage, pathological grade, primary tumor site, lymphatic metastasis, tumor size, smoking history, and drinking history (a) and *p < 0.05, **p < 0.01; two-tailed Student’s t-test. Immunohistochemical stanning of FGL-1 in laryngeal cancer tissues and vocal cord polyp tissues (control) (b). Scale bars, 100 µm.
To detect FGL-1 expression in laryngeal cancer tissues, 20 vocal cord polyp tissues and 78 laryngeal cancer tissues were stained by immunohistochemistry (Figure 1b). The results are shown in Table 2. Among the 20 vocal cord polyp tissues, 16 cases were negative for FGL-1 and four showed positive expression. Among laryngeal squamous cell carcinoma samples, there were 25 cases negative for FGL-1 expression and 53 showing positive expression. Thus, the rate of positive FGL-1 expression in laryngeal carcinoma tissues was significantly higher than that in vocal cord polyp tissues (p = 0.019). However, FGL-1 expression showed no statistically significant differences when laryngeal squamous cell carcinoma patients were divided by sex, age, tumor site, lymphatic metastasis, tumor size, or pathological grade.
Table 2.
FGL-1 expression in the tumor tissue of laryngeal cancer patients.
| Total cases | Negative | Positive | P-value | |
|---|---|---|---|---|
| Age (years) | ||||
| <60 | 45 | 19 | 26 | 0.94 |
| ≥60 | 53 | 22 | 31 | |
| Sex | ||||
| Male | 93 | 37 | 56 | 0.19 |
| Female | 5 | 4 | 1 | |
| Diagnosis | ||||
| LSCC | 78 | 25 | 53 | <0.01 |
| Healthy control | 20 | 16 | 4 | |
| Tumor Site | ||||
| Supraglottic | 32 | 8 | 24 | 0.26 |
| Glottic | 46 | 17 | 29 | |
| Metastasis | ||||
| N0 | 54 | 20 | 34 | 0.15 |
| N1, 2 | 24 | 5 | 19 | |
| Clinical Stage | ||||
| I–II | 54 | 20 | 34 | 0.15 |
| III–IV | 24 | 5 | 19 | |
| Histological grade | ||||
| SCC I | 14 | 6 | 8 | 0.33 |
| SCC II–III | 64 | 19 | 45 | |
| Smoking history | ||||
| Yes | 76 | 32 | 44 | 0.92 |
| No | 22 | 9 | 13 | |
| Drinking history | ||||
| Yes | 31 | 10 | 21 | 0.19 |
| No | 67 | 31 | 36 | |
| Tumor Size | ||||
| <2 cm | 41 | 12 | 29 | 0.57 |
| >2 cm | 37 | 13 | 24 |
The chi-square test was used to analyze all results.
FGL-1 knockdown suppressed the proliferation of TU-686 cells by preventing them from entering S phase of the cell cycle
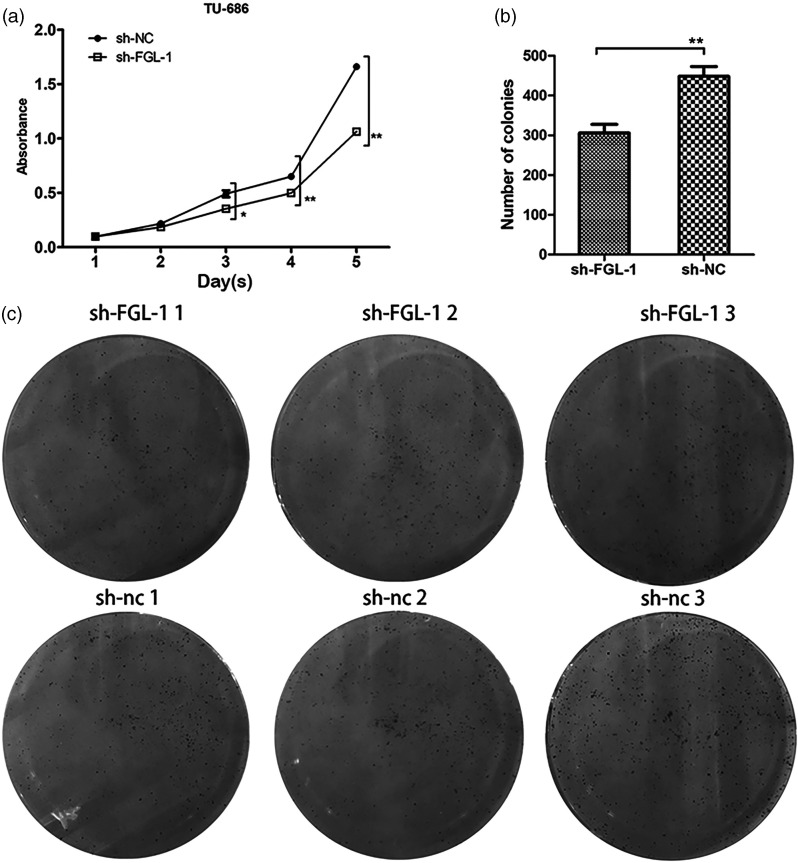
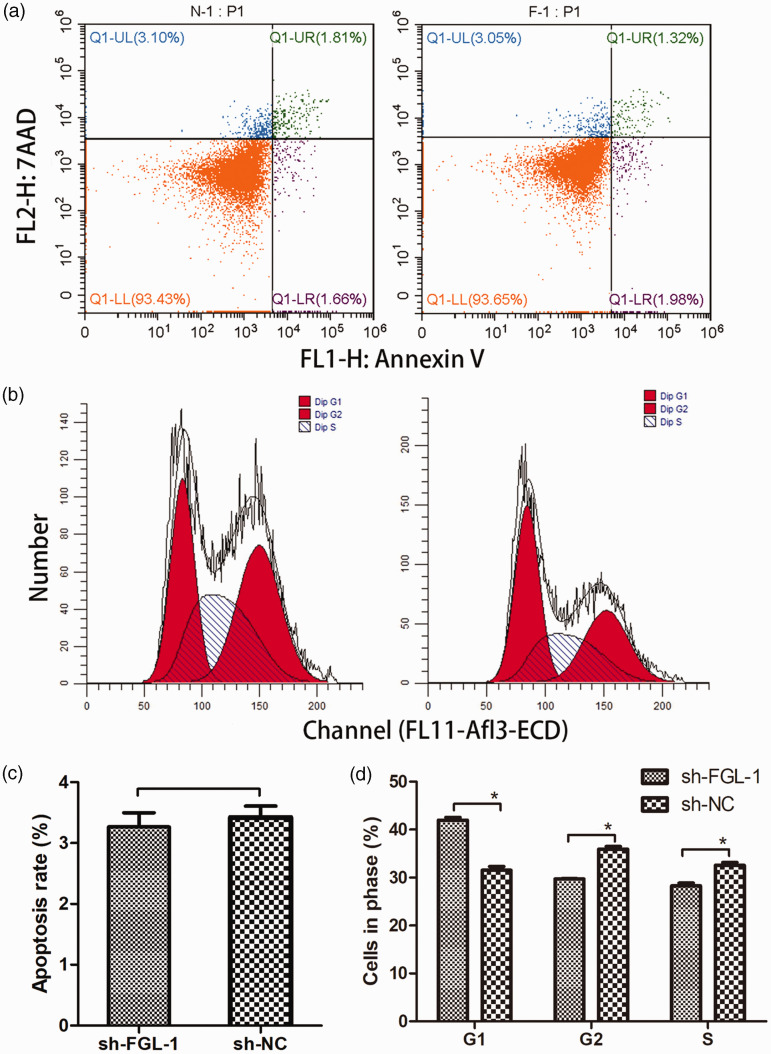
The FGL-1 knockdown cell line was constructed by lentiviral infection (Supplementary figure 1A). Western blot and qPCR were performed to confirm the knockdown efficiency (Supplementary figure 1B-C). CCK-8 and colony formation assays were then performed to investigate the effect of FGL-1 knockdown on the proliferation of TU-686 cells. The results showed that the proliferative capacity of FGL-1 knockdown cells was significantly reduced compared with that of the sh-NC cells, showing statistically significant differences from the third day (p = 0.04) to the fifth day (p < 0.01) of cell culture (Figure 2a). In colony formation assays, cells with FGL-1 knockdown also showed decreased cell proliferation capacity compared with the control group (p < 0.01) (Figure 2b–c). Cell cycle and apoptosis analyses were conducted by flow cytometry to examine the effect of FGL-1 knockdown on TU-686 cells. The apoptosis assay was performed by staining cells with Annexin V and PI, and the results showed that the average apoptosis rate of FGL-1 knockdown cells was 3.266% ± 0.061%, whereas the rate in the control group was 3.420% ± 0.05%, which revealed that there was no significant difference in the apoptosis rate between FGL-1 knockdown cells and control cells (Figure 3a, 3c). However, cell cycle analysis showed more FGL-1 knockdown cells accumulating in the G0 and G1 phases (p = 0.005), with fewer in S phase compared with the control group (p = 0.007) (Figure 3b, 3d).
Figure 2.
The effect of silencing FGL-1 on the proliferation of TU-686 cells. The proliferation curves of cells before and after transfection using the CCK-8 assay (a). The number of cell colonies formed during colony formation assays (b) and Images of colony formation assays (c). *p < 0.05, **p < 0.01; two-tailed Student’s t-test.
Figure 3.
Changes in cell cycle progression and apoptosis after silencing FGL-1 in TU-686 cells. Annexin V and propidium iodide staining were used for the apoptosis assay, and cells were detected by flow cytometry (a). Cell cycle progression was evaluated by flow cytometry (b). The apoptosis rates between the FGL-1-sh group and the control group (c) and Differences in cell cycle progression between the FGL-1 knockdown group and the control group (d). *P < 0.05; two-tailed Student’s t-test.
FGL-1 knockdown inhibited the migration and invasion of laryngeal squamous cell carcinoma cells
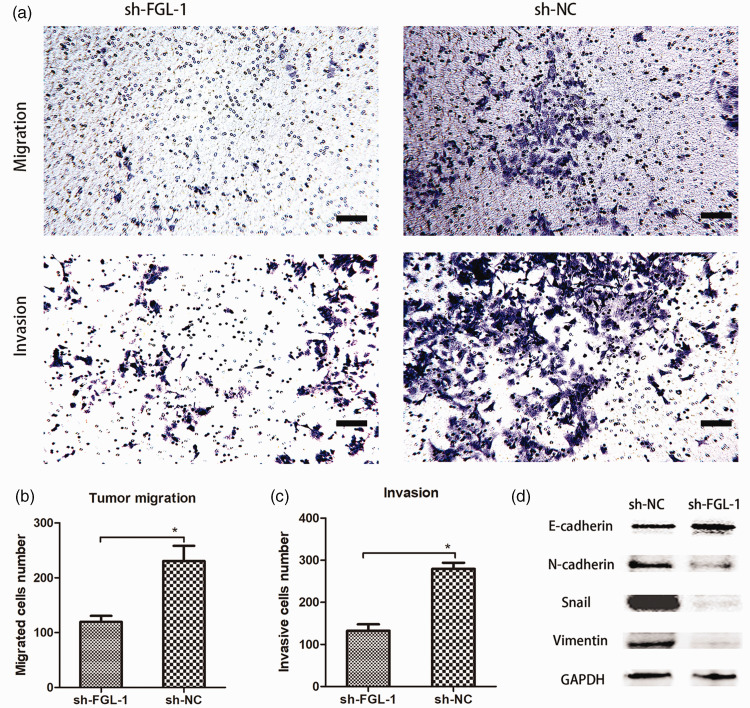
Transwell assays were conducted to investigate the migration and invasion of FGL-1 knockdown TU-686 cells (Figure 4a). Compared with the control group, FGL-1 knockdown decreased the number of cells that migrated (p = 0.003) (Figure 4b) and invaded (p < 0.001) (Figure 4c) through the Transwell inserts. To further investigate the relationship between FGL-1 and tumor cell EMT, we assessed the expression of EMT-related proteins by western blot. The results showed that compared with the control group, E-cadherin was upregulated, while N-cadherin, Snail and Vimentin were downregulated in the FGL-1-sh group, suggesting that silencing FGL-1 blocks EMT progression in laryngeal cancer cells (Figure 4d).
Figure 4.
Silencing FGL-1 suppressed invasion, migration, and the epithelial-to-mesenchymal transition (EMT) status of TU-686 cells. Cell staining after Transwell migration and invasion experiments (a). Comparison of migration abilities between the FGL-1-sh group and the NC-sh groups (b). Comparison of invasion abilities between the FGL-1-sh group and the NC-sh groups (c) and The expression of EMT-related proteins was detected by western blot (d). *p < 0.05; two-tailed Student’s t-test; scale bars, 10 µm.
Silencing FGL-1 inhibited the tumorigenicity of SCC7 cells in vivo
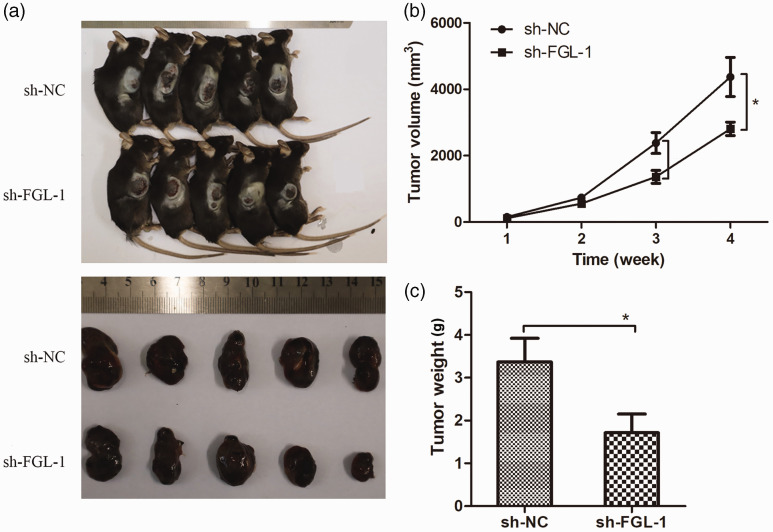
To study the effect of silencing FGL-1 on the tumorigenic ability of laryngeal cancer cells in vivo, we inoculated FGL-1-sh SCC7 cells into C57BL/6 mice by subcutaneous transplantation; FGL-1 knockdown was verified by qPCR (Supplementary figure 2). After 4 weeks, tumor growth curves for each group of mice were recorded, and differences in the volumes of transplanted tumors between the FGL-1-sh and control groups were analyzed (Figure 5a). The results showed that the tumor growth rate of the FGL-1-sh group was decreased from the third week compared with the control group; tumor volumes were significantly reduced in the fourth week (4372.13 ± 589.30 mm3 vs. 2807.83 ± 202.21 mm3, p = 0.01) (Figure 5b). Similarly, the weights of transplanted tumors in mice of the FGL-1-sh group were significantly lower than of those in the control group (3.34 ± 0.55 g vs. 1.71 ± 0.43 g, p = 0.04) (Figure 5c).
Figure 5.
Effects of FGL-1 knockdown on in vivo tumorigenesis. Tumor-bearing mice and tumor masses in the sh-FGL-1 and sh-NC groups (a). Tumor growth curves (b) and Comparison of tumor weights between the sh-FGL-1 and sh-NC groups (c). *p < 0.05; two-tailed Student’s t-test.
Silencing FGL-1 synergized with anti-LAG-3 immunotherapy
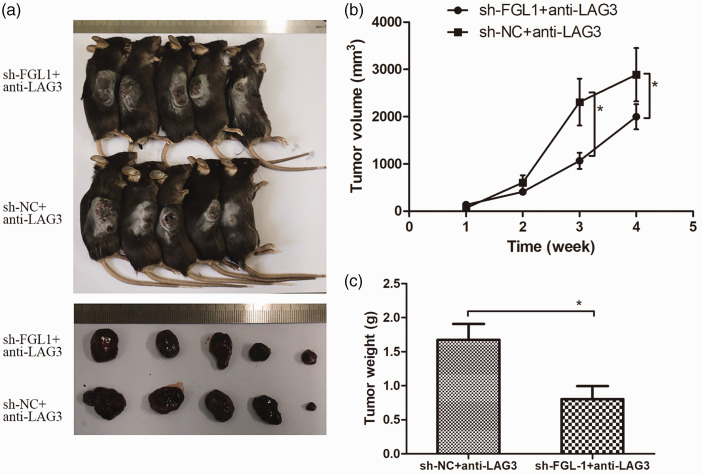
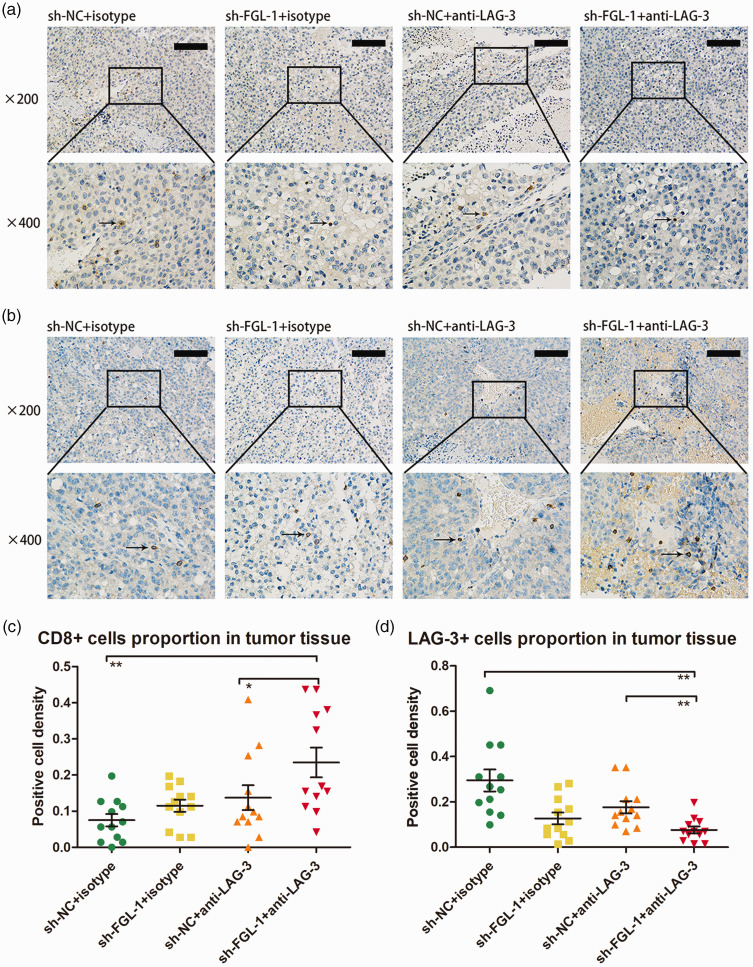
To test the effect of FGL-1 on anti-LAG-3 immunotherapy, we treated tumor-bearing mice with anti-LAG-3 monoclonal antibody (Figure 6a). The results of the tumor growth curve showed that the volumes of transplanted tumors in the FGL-1-sh group were significantly smaller than those in the NC-sh group (1064.91 ± 379.94 mm3 vs. 2307.63 ± 469.70 mm3, p = 0.04) from the third week of treatment (Figure 6b). Similar to tumor volumes, tumor weights of the FGL-1-sh group were significantly lower than of the NC-sh group (0.80 ± 0.18 g vs. 1.67 ± 0.23 g, p = 0.02) (Figure 6c). These results indicated that silencing FGL-1 synergized with anti-LAG-3 immunotherapy. Immunohistochemistry was used to further verify the altered immunity states of tumor tissues in tumor-bearing mice after FGL-1 silencing and anti-LAG-3 treatment (Figure 7a–b). The results showed that after receiving anti-LAG-3 targeted therapy, there was increased CD8 expression in tumor tissue compared with the untreated group (p < 0.05); additionally LAG-3 expression was confirmed to be downregulated (p < 0.01). In the treatment groups, CD8 expression was higher in the FGL-1-sh group than in the NC-sh group (p < 0.05), and LAG-3 expression was also downregulated (p < 0.01) (Figure 7c–d). These results suggested that silencing FGL-1 synergized with anti-LAG-3 to increase the number of CD8+ T cells and reduce T lymphocyte exhaustion in tumor tissues.
Figure 6.
Anti-LAG-3 drug response assay in tumor-bearing mice. Tumor-bearing mice and tumor masses in the FGL-1-sh + anti-LAG-3 and sh-NC+anti-LAG-3 groups (a). Tumor growth curves of the anti-LAG-3 experiment (b) and Comparison of tumor weights between the FGL-1-sh+anti-LAG-3 and NC-sh+anti-LAG-3 groups (c). *p < 0.05; two-tailed Student’s t-test.
Figure 7.
CD8 and LAG-3 immunohistochemistry in murine tumor tissues with FGL-1 silencing treated with anti-LAG-3 immunotherapy. CD8 immunohistochemistry in murine tumor tissues (a). LAG-3 immunohistochemistry in murine tumor tissues (b). The proportion of CD8+ cells in murine tumor tissues with ±FGL-1-sh and ±anti-LAG-3 (c). The proportion of LAG-3-positive cells in murine tumor tissues with ±FGL-1-sh and ±anti-LAG-3 (d). Arrows indicate positive cells. *p < 0.05, **p < 0.01; two-tailed Student’s t-test.
Discussion
Although anti-PD-1/PD-L1 immunotherapy has shown efficacy in various tumors, acquired or primary resistance still limits its further application.20–23 A deeper understanding of the mechanisms of immunotherapy treatment strategies and the search for new immunotherapy targets and biomarkers are particularly important. A previous study confirmed that FGL-1 is the major ligand for LAG-3 for synergizing with PD-L1/PD-1 in immunosuppression. 17 However, the expression and mechanism of FGL-1 in laryngeal cancer remained obscure. In this study, we identified FGL-1 to be highly expressed in laryngeal squamous cell carcinoma in both plasma and tumor tissues. We confirmed that increased FGL-1 expression promoted the proliferation, invasion, and migration of laryngeal cancer cells and participated in the process of tumor EMT. Additionally, we confirmed that FGL-1 was involved in the immune regulation of tumor cells, as the number of CD8 cells in tumor tissues was increased in FGL-1 knockdown tumors, while exhaustion of tumor infiltrating lymphocytes was reduced. These effects represent the mechanisms through which FGL-1 knockdown synergistically enhanced the antitumor efficacy of anti-LAG3 treatment.
Under physiological conditions, FGL-1 is concentrated in the liver and pancreas. In the event of acute hepatitis, increased plasma FGL-1 expression is detected. 18 At the same time, FGL-1 expression in plasma is also related to energy metabolism. For example, increased plasma FGL-1 is detected under the condition of insulin resistance. 24 Under pathological conditions, plasma FGL-1 expression can predict the severity of certain chronic diseases such as rheumatoid arthritis and dengue fever.25–26 Wang et al. 17 found higher plasma FGL-1 levels in non-small cell lung cancer patients than in healthy donors, and high expression was associated with a worse overall survival rate in patients treated with anti-PD-1/PD-L1 therapy both in melanoma and lung cancer. Consist with their study, we first confirmed high expression of FGL-1 in the plasma of laryngeal cancer patients who had been excluded from chronic diseases such as diabetes and chronic liver disease, which can influence the expression of FGL-1. However, the relationships between overall survival rate, immunotherapy, and FGL-1 expression were not found, and the cause of elevated plasma FGL-1 levels in cancer patients remains unknown. Thus, more research will be needed to reveal these mechanisms.
By analyzing the expression of FGL-1 in a pan-cancer dataset from The Cancer Genome Atlas, it was concluded that FGL-1 expression was significantly higher in tumor tissues including head and neck squamous carcinoma, lung adenocarcinoma, prostate adenocarcinoma, and stomach adenocarcinoma than in adjacent control tissues, while in cholangiocarcinoma, breast invasive carcinoma, kidney chromophobe, and liver hepatocellular carcinoma, FGL-1 expression was decreased in tumor tissues compared with adjacent controls (Supplementary figure 3). Studies in breast cancer, 27 hepatocellular carcinoma 28 and lung adenocarcinoma (LUAD) 29 are consistent with the results of The Cancer Genome Atlas dataset. We found that FGL-1 was upregulated in tumor tissues compared with vocal polyp tissues; however, more paired samples are needed to confirm this conclusion.
The effect of FGL-1 on tumor proliferation varies across tumor types. Previous studies have confirmed that FGL-1 can inhibit the proliferation of hepatocellular carcinoma by suppressing the AKT-mTOR pathway.30–31 However, FGL-1 knockdown significantly inhibited the proliferation of PC9/GR lung cancer cells with gefitinib treatment, 32 and in gastric cancer, knocking out FGL-1 decreased the proliferation of SGC-7901 cells. 33 Consist with the results in lung and gastric cancers, we found that the proliferation of TU-686 laryngeal cancer cells was inhibited after silencing FGL-1. However, the mechanism through which FGL-1 affects the proliferation of laryngeal squamous cell carcinoma cells remains to be determined.
Tumor cell EMT plays an important role in tumor metastasis by reducing epithelial cell polarity and increasing cell invasive and migratory abilities. FGL-1 had been verified to be related to tumor EMT in previous studies. In lung cancer, E-cadherin expression was downregulated, while N-cadherin and vimentin expression were elevated after silencing FGL-1. 29 Zhang et al. 33 also confirmed that FGL-1 knockout resulted in decreased tumor invasion and migration in gastric cancer. Consistent with the research in gastric cancer, we found that silencing FGL-1 inhibited the invasion and migration of laryngeal squamous cell carcinoma cells. Moreover, western blot results showed that E-cadherin expression was increased after FGL-1 silencing, while levels of N-cadherin, Vimentin, and Snail were decreased. Therefore, we believe that FGL-1 accelerates tumor invasion and migration by promoting tumor cell EMT in laryngeal cancer.
Previous studies have shown that the combination of LAG-3 and FGL-1 plays an important role in tumor immunity. In addition to the synergistic effects of LAG-3 with PD-1 to inhibit tumor immunity,34–35 LAG-3 also has PD-1-independent immunosuppressive effects. Blocking the binding site of FGL-1 and LAG-3 can increase the activity of tumor-infiltrating T lymphocytes and promote their proliferation in vivo. 17 Consistent with these findings, we confirmed that silencing FGL-1 sensitized laryngeal cancer cells to the antitumor effects of anti-LAG-3 immunotherapy by increasing the activity of cytotoxic T lymphocytes and decreasing T cell exhaustion. These results indicated that FGL-1 could be a potential target for laryngeal cancer treatment. However, clinical trials for FGL-1 targeted small molecules in cancer are insufficient. Wang et al. 17 reported that high plasma FGL-1 levels were associated with poor outcomes in patients who received anti-PD-1 therapy. However, the relationship between plasma FGL-1 levels and the prognosis of anti-PD-1/PD-L1 immunotherapy in laryngeal cancer remains unknown. Therefore, we need to spend more effort uncovering the mechanism of FGL-1 in immunosuppression and the clinical significance of immunotherapy for laryngeal squamous cell carcinoma.
In conclusion, FGL-1 was highly expressed in both the plasma and tumor tissues of laryngeal cancer patients, and FGL-1 knockdown decreased the proliferation, invasion, and migration of laryngeal cancer cells. Finally, silencing FGL-1 sensitized laryngeal cancer cells to the antitumor effects of anti-LAG-3 immunotherapy.
Supplemental Material
Supplemental material, sj-pdf-1-imr-10.1177_03000605221126874 for Fibrinogen like protein-1 knockdown suppresses the proliferation and metastasis of TU-686 cells and sensitizes laryngeal cancer to LAG-3 blockade by Jiameng Huang, Qiang Huang, Jiyao Xue, Huiqin Liu, Yang Guo, Hui Chen and Liang Zhou in Journal of International Medical Research
Supplemental material, sj-pdf-2-imr-10.1177_03000605221126874 for Fibrinogen like protein-1 knockdown suppresses the proliferation and metastasis of TU-686 cells and sensitizes laryngeal cancer to LAG-3 blockade by Jiameng Huang, Qiang Huang, Jiyao Xue, Huiqin Liu, Yang Guo, Hui Chen and Liang Zhou in Journal of International Medical Research
Supplemental material, sj-pdf-3-imr-10.1177_03000605221126874 for Fibrinogen like protein-1 knockdown suppresses the proliferation and metastasis of TU-686 cells and sensitizes laryngeal cancer to LAG-3 blockade by Jiameng Huang, Qiang Huang, Jiyao Xue, Huiqin Liu, Yang Guo, Hui Chen and Liang Zhou in Journal of International Medical Research
Author contributions: Hui Chen, Liang Zhou, and Jiameng Huang contributed to the conception and design of the study. Qiang Huang, Jiyao Xue, Huiqin Liu, and Yang Guo contributed to providing study materials and patients. Jiameng Huang contributed to data analysis and manuscript writing.
Declaration of conflicting interest: The author(s) declare that there is no conflict of interest.
Funding: The authors disclosed receipt of the following financial support for the research, authorship, and/or publication of this article: This study was supported by grants from the National Natural Science Foundation of China (81972529) and the Science and Technology Commission of Shanghai Municipality (19411961300).
Data availability statement
The datasets used and/or analyzed in this study are available from the corresponding author upon reasonable request.
ORCID iDs
Jiameng Huang https://orcid.org/0000-0002-1241-7087
Supplemental material
Supplemental material for this article is available online.
References
- 1.Sung H, Ferlay J, Siegel RL, et al. Global Cancer Statistics 2020: GLOBOCAN Estimates of Incidence and Mortality Worldwide for 36 Cancers in 185 Countries. CA Cancer J Clin 2021; 71: 209–249. Journal Article. DOI: 10.3322/caac.21660. [DOI] [PubMed] [Google Scholar]
- 2.Pfister DG, Spencer S, Adelstein D, et al. Head and Neck Cancers, Version 2.2020, NCCN Clinical Practice Guidelines in Oncology. J Natl Compr Canc Netw 2020; 18: 873–898. Journal Article. DOI: 10.6004/jnccn.2020.0031. [DOI] [PubMed] [Google Scholar]
- 3.Mody MD, Rocco JW, Yom SS, et al. Head and neck cancer. Lancet 2021; 398: 2289–2299. Journal Article; Review. DOI: 10.1016/S0140-6736(21)01550-6. [DOI] [PubMed] [Google Scholar]
- 4.Hughes PE, Caenepeel S, Wu LC. Targeted Therapy and Checkpoint Immunotherapy Combinations for the Treatment of Cancer. Trends Immunol 2016; 37: 462–476. Journal Article; Review. DOI: 10.1016/j.it.2016.04.010. [DOI] [PubMed] [Google Scholar]
- 5.Qin S, Xu L, Yi M, et al. Novel immune checkpoint targets: moving beyond PD-1 and CTLA-4. Mol Cancer 2019; 18: 155. DOI: 10.1186/s12943-019-1091-2. [DOI] [PMC free article] [PubMed] [Google Scholar]
- 6.Groisberg R, Hong DS, Behrang A, et al. Characteristics and outcomes of patients with advanced sarcoma enrolled in early phase immunotherapy trials. J Immunother Cancer 2017; 5: 100. DOI: 10.1186/s40425-017-0301-y. [DOI] [PMC free article] [PubMed] [Google Scholar]
- 7.Ferris RL, Blumenschein GJ, Fayette J, et al. Nivolumab for Recurrent Squamous-Cell Carcinoma of the Head and Neck. N Engl J Med 2016; 375: 1856–1867. DOI: 10.1056/NEJMoa1602252. [DOI] [PMC free article] [PubMed] [Google Scholar]
- 8.Cohen E, Soulières D, Le Tourneau C, et al. Pembrolizumab versus methotrexate, docetaxel, or cetuximab for recurrent or metastatic head-and-neck squamous cell carcinoma (KEYNOTE-040): a randomised, open-label, phase 3 study. Lancet 2019; 393: 156–167. DOI: 10.1016/S0140-6736(18)31999-8. [DOI] [PubMed] [Google Scholar]
- 9.Kurra V, Sullivan RJ, Gainor JF, et al. Pseudoprogression in cancer immunotherapy: Rates, time course and patient outcomes. J Clin Oncol 2016; 34: 34S. DOI: 10.1200/JCO.2016.34.15_suppl.6580. [Google Scholar]
- 10.Li Y, Kang X, Wang H, et al. Clinical diagnosis and treatment of immune checkpoint inhibitor-associated adverse events in the digestive system. Thorac Cancer 2020; 11: 829–834. DOI: 10.1111/1759-7714.13338. [DOI] [PMC free article] [PubMed] [Google Scholar]
- 11.Shergold AL, Millar R, Nibbs RJB. Understanding and overcoming the resistance of cancer to PD-1/PD-L1 blockade. Pharmacol Res 2019; 145: 104258. DOI: 10.1016/j.phrs.2019.104258. [DOI] [PubMed] [Google Scholar]
- 12.Khan Z, Hammer C, Guardino E, et al. Mechanisms of immune-related adverse events associated with immune checkpoint blockade: using germline genetics to develop a personalized approach. Genome Med 2019; 11: 39. DOI: 10.1186/s13073-019-0652-8. [DOI] [PMC free article] [PubMed] [Google Scholar]
- 13.Champiat S, Dercle L, Ammari S, et al. Hyperprogressive Disease Is a New Pattern of Progression in Cancer Patients Treated by Anti-PD-1/PD-L1. Clin Cancer Res 2017; 23: 1920–1928. DOI: 10.1158/1078-0432.CCR-16-1741. [DOI] [PubMed] [Google Scholar]
- 14.Maruhashi T, Okazaki IM, Sugiura D, et al. LAG-3 inhibits the activation of CD4(+) T cells that recognize stable pMHCII through its conformation-dependent recognition of pMHCII. Nat. Immunol 2018; 19: 1415–1426. DOI: 10.1038/s41590-018-0217-9. [DOI] [PubMed] [Google Scholar]
- 15.Marty R, Thompson WK, Salem RM, et al. Evolutionary Pressure against MHC Class II Binding Cancer Mutations. Cell 2018; 175: 416–428.e13. DOI: 10.1016/j.cell.2018.08.048. [DOI] [PMC free article] [PubMed] [Google Scholar]
- 16.Johnson AM, Bullock BL, Neuwelt AJ, et al. Cancer Cell-Intrinsic Expression of MHC Class II Regulates the Immune Microenvironment and Response to Anti-PD-1 Therapy in Lung Adenocarcinoma. J. Immunol 2020; 204: 2295–2307. DOI: 10.4049/jimmunol.1900778. [DOI] [PMC free article] [PubMed] [Google Scholar]
- 17.Wang J, Sanmamed MF, Datar I, et al. Fibrinogen-like Protein 1 Is a Major Immune Inhibitory Ligand of LAG-3. Cell 2019; 176: 334–347.e12. DOI: 10.1016/j.cell.2018.11.010. [DOI] [PMC free article] [PubMed] [Google Scholar]
- 18.Liu Z, Ukomadu C. Fibrinogen-like protein 1, a hepatocyte derived protein is an acute phase reactant. Biochem Biophys Res Commun 2008; 365: 729–734. DOI: 10.1016/j.bbrc.2007.11.069. [DOI] [PMC free article] [PubMed] [Google Scholar]
- 19.Lichtenegger FS, Rothe M, Schnorfeil FM, et al. Targeting LAG-3 and PD-1 to Enhance T Cell Activation by Antigen-Presenting Cells. Front Immunol 2018; 9: 385. DOI: 10.3389/fimmu.2018.00385. [DOI] [PMC free article] [PubMed] [Google Scholar]
- 20.Niu B, Zhou F, Su Y, et al. Different Expression Characteristics of LAG3 and PD-1 in Sepsis and Their Synergistic Effect on T Cell Exhaustion: A New Strategy for Immune Checkpoint Blockade. Front Immunol 2019; 10: 1888. DOI: 10.3389/fimmu.2019.01888. [DOI] [PMC free article] [PubMed] [Google Scholar]
- 21.Jerby-Arnon L, Shah P, Cuoco MS, et al. A Cancer Cell Program Promotes T Cell Exclusion and Resistance to Checkpoint Blockade. Cell 2018; 175: 984–997.e24. DOI: 10.1016/j.cell.2018.09.006. [DOI] [PMC free article] [PubMed] [Google Scholar]
- 22.Dosset M, Vargas TR, Lagrange A, et al. PD-1/PD-L1 pathway: an adaptive immune resistance mechanism to immunogenic chemotherapy in colorectal cancer. Oncoimmunology 2018; 7: e1433981. DOI: 10.1080/2162402X.2018.1433981. [DOI] [PMC free article] [PubMed] [Google Scholar]
- 23.Nowicki TS, Hu-Lieskovan S, Ribas A. Mechanisms of Resistance to PD-1 and PD-L1 Blockade. Cancer J 2018; 24: 47–53. [DOI] [PMC free article] [PubMed] [Google Scholar]
- 24.Wu HT, Ou HY, Hung HC, et al. A novel hepatokine, HFREP1, plays a crucial role in the development of insulin resistance and type 2 diabetes. Diabetologia 2016; 59: 1732–1742. Journal Article; Research Support, Non-U.S. Gov't. DOI: 10.1007/s00125-016-3991-7. [DOI] [PubMed] [Google Scholar]
- 25.Liu S, Guo Y, Lu L, et al. Fibrinogen-Like Protein 1 Is a Novel Biomarker for Predicting Disease Activity and Prognosis of Rheumatoid Arthritis. Front Immunol 2020; 11: 579228. DOI: 10.3389/fimmu.2020.579228. [DOI] [PMC free article] [PubMed] [Google Scholar]
- 26.Han L, Ao X, Lin S, et al. Quantitative Comparative Proteomics Reveal Biomarkers for Dengue Disease Severity. Front Microbiol 2019; 10: 2836. DOI: 10.3389/fmicb.2019.02836. [DOI] [PMC free article] [PubMed] [Google Scholar]
- 27.Du H, Yi Z, Wang L, et al . The co-expression characteristics of LAG3 and PD-1 on the T cells of patients with breast cancer reveal a new therapeutic strategy. Int Immunopharmacol 2020; 78: 106113. DOI: 10.1016/j.intimp.2019.106113. [DOI] [PubMed] [Google Scholar]
- 28.Guo M, Yuan F, Qi F, et al. Expression and clinical significance of LAG-3, FGL1, PD-L1 and CD8(+) T cells in hepatocellular carcinoma using multiplex quantitative analysis. J Transl Med 2020; 18: 306. DOI: 10.1186/s12967-020-02469-8. [DOI] [PMC free article] [PubMed] [Google Scholar]
- 29.Bie F, Wang G, Qu X, et al. Loss of FGL1 induces epithelial-mesenchymal transition and angiogenesis in LKB1 mutant lung adenocarcinoma. Int J Oncol 2019; 55: 697–707. DOI: 10.3892/ijo.2019.4838. [DOI] [PubMed] [Google Scholar]
- 30.Nayeb-Hashemi H, Desai A, Demchev V, et al. Targeted disruption of fibrinogen like protein-1 accelerates hepatocellular carcinoma development. Biochem Bioph Res Co 2015; 465: 167–173. DOI: 10.1016/j.bbrc.2015.07.078. [DOI] [PMC free article] [PubMed] [Google Scholar]
- 31.Grabinski N, Ewald F, Hofmann BT, et al. Combined targeting of AKT and mTOR synergistically inhibits proliferation of hepatocellular carcinoma cells. Mol Cancer 2012; 11: 85. DOI: 10.1186/1476-4598-11-85. [DOI] [PMC free article] [PubMed] [Google Scholar]
- 32.Sun C, Gao W, Liu J, et al. FGL1 regulates acquired resistance to Gefitinib by inhibiting apoptosis in non-small cell lung cancer. Resp Res 2020; 21: 210. DOI: 10.1186/s12931-020-01477-y. [DOI] [PMC free article] [PubMed] [Google Scholar]
- 33.Zhang Y, Qiao H, Zhou Y, et al. Fibrinogen-like-protein 1 promotes the invasion and metastasis of gastric cancer and is associated with poor prognosis. Mol Med Rep 2018; 18: 1465–1472. DOI: 10.3892/mmr.2018.9097. [DOI] [PMC free article] [PubMed] [Google Scholar]
- 34.Atkinson V, Khattak A, Haydon A, et al. Eftilagimod alpha, a soluble lymphocyte activation gene-3 (LAG-3) protein plus pembrolizumab in patients with metastatic melanoma. J Immunother Cancer 2020; 8: e001681. DOI: 10.1136/jitc-2020-001681. [DOI] [PMC free article] [PubMed] [Google Scholar]
- 35.Okazaki T, Okazaki I, Wang J, et al. PD-1 and LAG-3 inhibitory co-receptors act synergistically to prevent autoimmunity in mice. J Exp Med 2011; 208: 395–407. DOI: 10.1084/jem.20100466. [DOI] [PMC free article] [PubMed] [Google Scholar]
Associated Data
This section collects any data citations, data availability statements, or supplementary materials included in this article.
Supplementary Materials
Supplemental material, sj-pdf-1-imr-10.1177_03000605221126874 for Fibrinogen like protein-1 knockdown suppresses the proliferation and metastasis of TU-686 cells and sensitizes laryngeal cancer to LAG-3 blockade by Jiameng Huang, Qiang Huang, Jiyao Xue, Huiqin Liu, Yang Guo, Hui Chen and Liang Zhou in Journal of International Medical Research
Supplemental material, sj-pdf-2-imr-10.1177_03000605221126874 for Fibrinogen like protein-1 knockdown suppresses the proliferation and metastasis of TU-686 cells and sensitizes laryngeal cancer to LAG-3 blockade by Jiameng Huang, Qiang Huang, Jiyao Xue, Huiqin Liu, Yang Guo, Hui Chen and Liang Zhou in Journal of International Medical Research
Supplemental material, sj-pdf-3-imr-10.1177_03000605221126874 for Fibrinogen like protein-1 knockdown suppresses the proliferation and metastasis of TU-686 cells and sensitizes laryngeal cancer to LAG-3 blockade by Jiameng Huang, Qiang Huang, Jiyao Xue, Huiqin Liu, Yang Guo, Hui Chen and Liang Zhou in Journal of International Medical Research
Data Availability Statement
The datasets used and/or analyzed in this study are available from the corresponding author upon reasonable request.


