

Abstract
Cancer-associated fibroblasts (CAFs) in the tumor microenvironment are often linked to drug resistance. Here, we found that co-culture with CAFs or culture in CAF-conditioned medium unexpectedly induced drug sensitivity in certain lung cancer cell lines. Gene expression and secretome analyses of CAFs and normal lung-associated fibroblasts (NAFs) revealed differential abundance of insulin-like growth factors (IGFs) and IGF-binding proteins (IGFBPs), which promoted or inhibited, respectively, signaling by the receptor IGF1R and the kinase FAK. Similar drug sensitization was seen in gefitinib-resistant, EGFR-mutant PC9GR lung cancer cells treated with recombinant IGFBPs. Conversely, drug sensitivity was decreased by recombinant IGFs or conditioned medium from CAFs in which IGFBP5 or IGFBP6 was silenced. Phosphoproteomics and receptor tyrosine kinase (RTK) array analyses indicated that exposure of PC9GR cells to CAF-conditioned medium also inhibited compensatory IGF1R and FAK signaling induced by the EGFR inhibitor osimertinib. Combined small-molecule inhibition of IGF1R and FAK phenocopied the CAF-mediated effects in culture and increased the antitumor effect of osimertinib in mice. Cells that were osimertinib resistant and had MET amplification or showed epithelial-to-mesenchymal transition also displayed residual sensitivity to IGFBPs. Thus, CAFs promote or reduce drug resistance in a context-dependent manner, and deciphering the relationship between the differential content of CAF secretomes and the signaling dependencies of the tumor may reveal effective combination treatment strategies.
INTRODUCTION
Precision medicine approaches with targeted drugs have been transformative in cancer therapy, particularly when directed at genetically activated oncogenes that cause aberrant kinase signaling, such as BCR-ABL and EML4-ALK fusions that arise from chromosomal translocations or activating BRAF and EGFR mutations (1–4). However, such targeted therapies are often followed by drug resistance leading to tumor relapse (5). There are various mechanisms of acquired resistance, including secondary mutations within the driver gene, upregulation of bypass signaling, gene amplification, epithelial-to-mesenchymal transition (EMT), and histologic transformation (6, 7). In addition, compensatory signaling can lead to adaptive resistance through enabling survival of small numbers of drug-tolerant “persister” cells (8–10), which avoid cell death and over time repopulate the primary tumor site and/or metastasize to new locations. However, tumor cells do not grow in isolation or display only cancer cell-intrinsic mechanisms of drug resistance; they also recruit and remodel various types of other cells that support their growth and, often, their drug resistance. These cells form the tumor microenvironment (TME), a complex entity made up of multiple non-malignant cell types, including various immune cells, endothelial cells, and cancer-associated fibroblasts (CAFs) (11–15). CAFs provide physical support in the TME, produce extracellular matrix (ECM), and secrete a multitude of other proteins—such as growth factors (such as hepatocyte growth factor (HGF), IGF1/2) and cytokines (for instance, interleukin-6 (IL-6))—that can drive tumor growth and survival, particularly in response to drug pressure (16–19). As such, CAF-mediated signaling may increase the pool of persister cells, thus reducing the duration of clinical responses and increasing the degree of heterogeneity within drug-resistant tumors. Although CAFs are mostly associated with promoting tumor growth, metastasis and drug resistance (17–20), some reports also suggest a substantial degree of heterogeneity in CAF populations (21, 22) and that some CAFs exhibit anti-tumor and drug-sensitizing properties (23–25). This indicates that eliminating CAFs in an undifferentiated way may be detrimental to cancer therapy. These studies also suggest that individual CAFs either promote or suppress tumor cells depending on their specific subtype. In this study, we investigated the mechanisms governing these divergent properties of CAFs with regard to drug sensitivity.
RESULTS
CAFs cause context-dependent resistance or sensitization to targeted drugs in NSCLC cells
To investigate the effect of fibroblasts on various non-small cell lung cancer (NSCLC) cells, we co-cultured nucleus-labeled KRAS-mutant, EML4-ALK-fusion positive, and EGFR-mutant NSCLC cells with CAFs or normal lung-associated fibroblasts (NAFs). CAFs were selected from a panel of patient-derived lung CAF lines (see Materials and Methods) based on having sufficient remaining cell culture life before onset of senescence. As expected, CAFs and NAFs both caused resistance to the MEK inhibitors trametinib and AZD8330 in KRAS-mutant A549 cells with these CAFs exhibiting somewhat stronger effects than NAFs (Fig. 1A). Fibroblast effects on EML4-ALK-fusion cell lines treated with the ALK/MET inhibitor crizotinib, on the other hand, were variable: Both CAFs and NAFs induced resistance in H3122 cells and had more limited effects in H2228 cells, whereas only CAFs mildly sensitized STE-1 cells (fig. S1A). Similarly, whereas these CAFs showed a tendency towards protecting EGFR-mutant PC9 cells from the multi-targeted SRC/ABL inhibitor dasatinib, the same CAFs, in contrast to NAFs, mildly enhanced the response to the EGFR inhibitor gefitinib (Fig. 1B). Furthermore, we observed pronounced sensitization of gefitinib-resistant PC9GR cells, which express the EGFRT790M gatekeeper mutant, by these specific CAFs, but not NAFs, when treating with the second- or third-generation EGFR inhibitors afatinib or osimertinib, respectively (Fig. 1C). Given the differential CAF effects on cell viability depending on cell line and drug treatment, we confirmed that all fibroblasts expressed the common fibroblast markers alpha-smooth muscle actin (α-SMA) and fibroblast activation protein (FAP)-α, as well as the mesenchymal marker vimentin, though not expressing the epithelial and lung cancer markers E-cadherin and cytokeratin, respectively (Fig. 1D and fig. S1B). We also observed the expected mesenchymal, spindle-like morphology of the Moffitt-generated lung CAF cells (fig. S1C). Stromal effects on cancer growth can be mediated by both secreted factors and contact-dependent mechanisms (cell-cell or cell-ECM). To determine the relevance of paracrine effects, we examined the impact of CAF- or NAF-conditioned medium (CM) on the response of PC9GR cells to EGFR inhibition (Fig. 1E). Indeed, sensitization was evoked by CAF CM, but not by NAF CM, suggesting that potentially a large proportion of the sensitizing effect is the result of secreted proteins. Furthermore, caspase-3 and PARP1 cleavage indicated strong drug-induced apoptosis of PC9GR cells by osimertinib in the presence of CAF CM, but not NAF CM (Fig. 1F). In summary, these findings suggest the presence of secreted, CAF-specific cancer suppressive factors and that the same CAFs, in a context-dependent manner, can either cause drug resistance or sensitization.
Fig. 1. Context-dependent TKI sensitivity of NSCLC cells by fibroblasts.
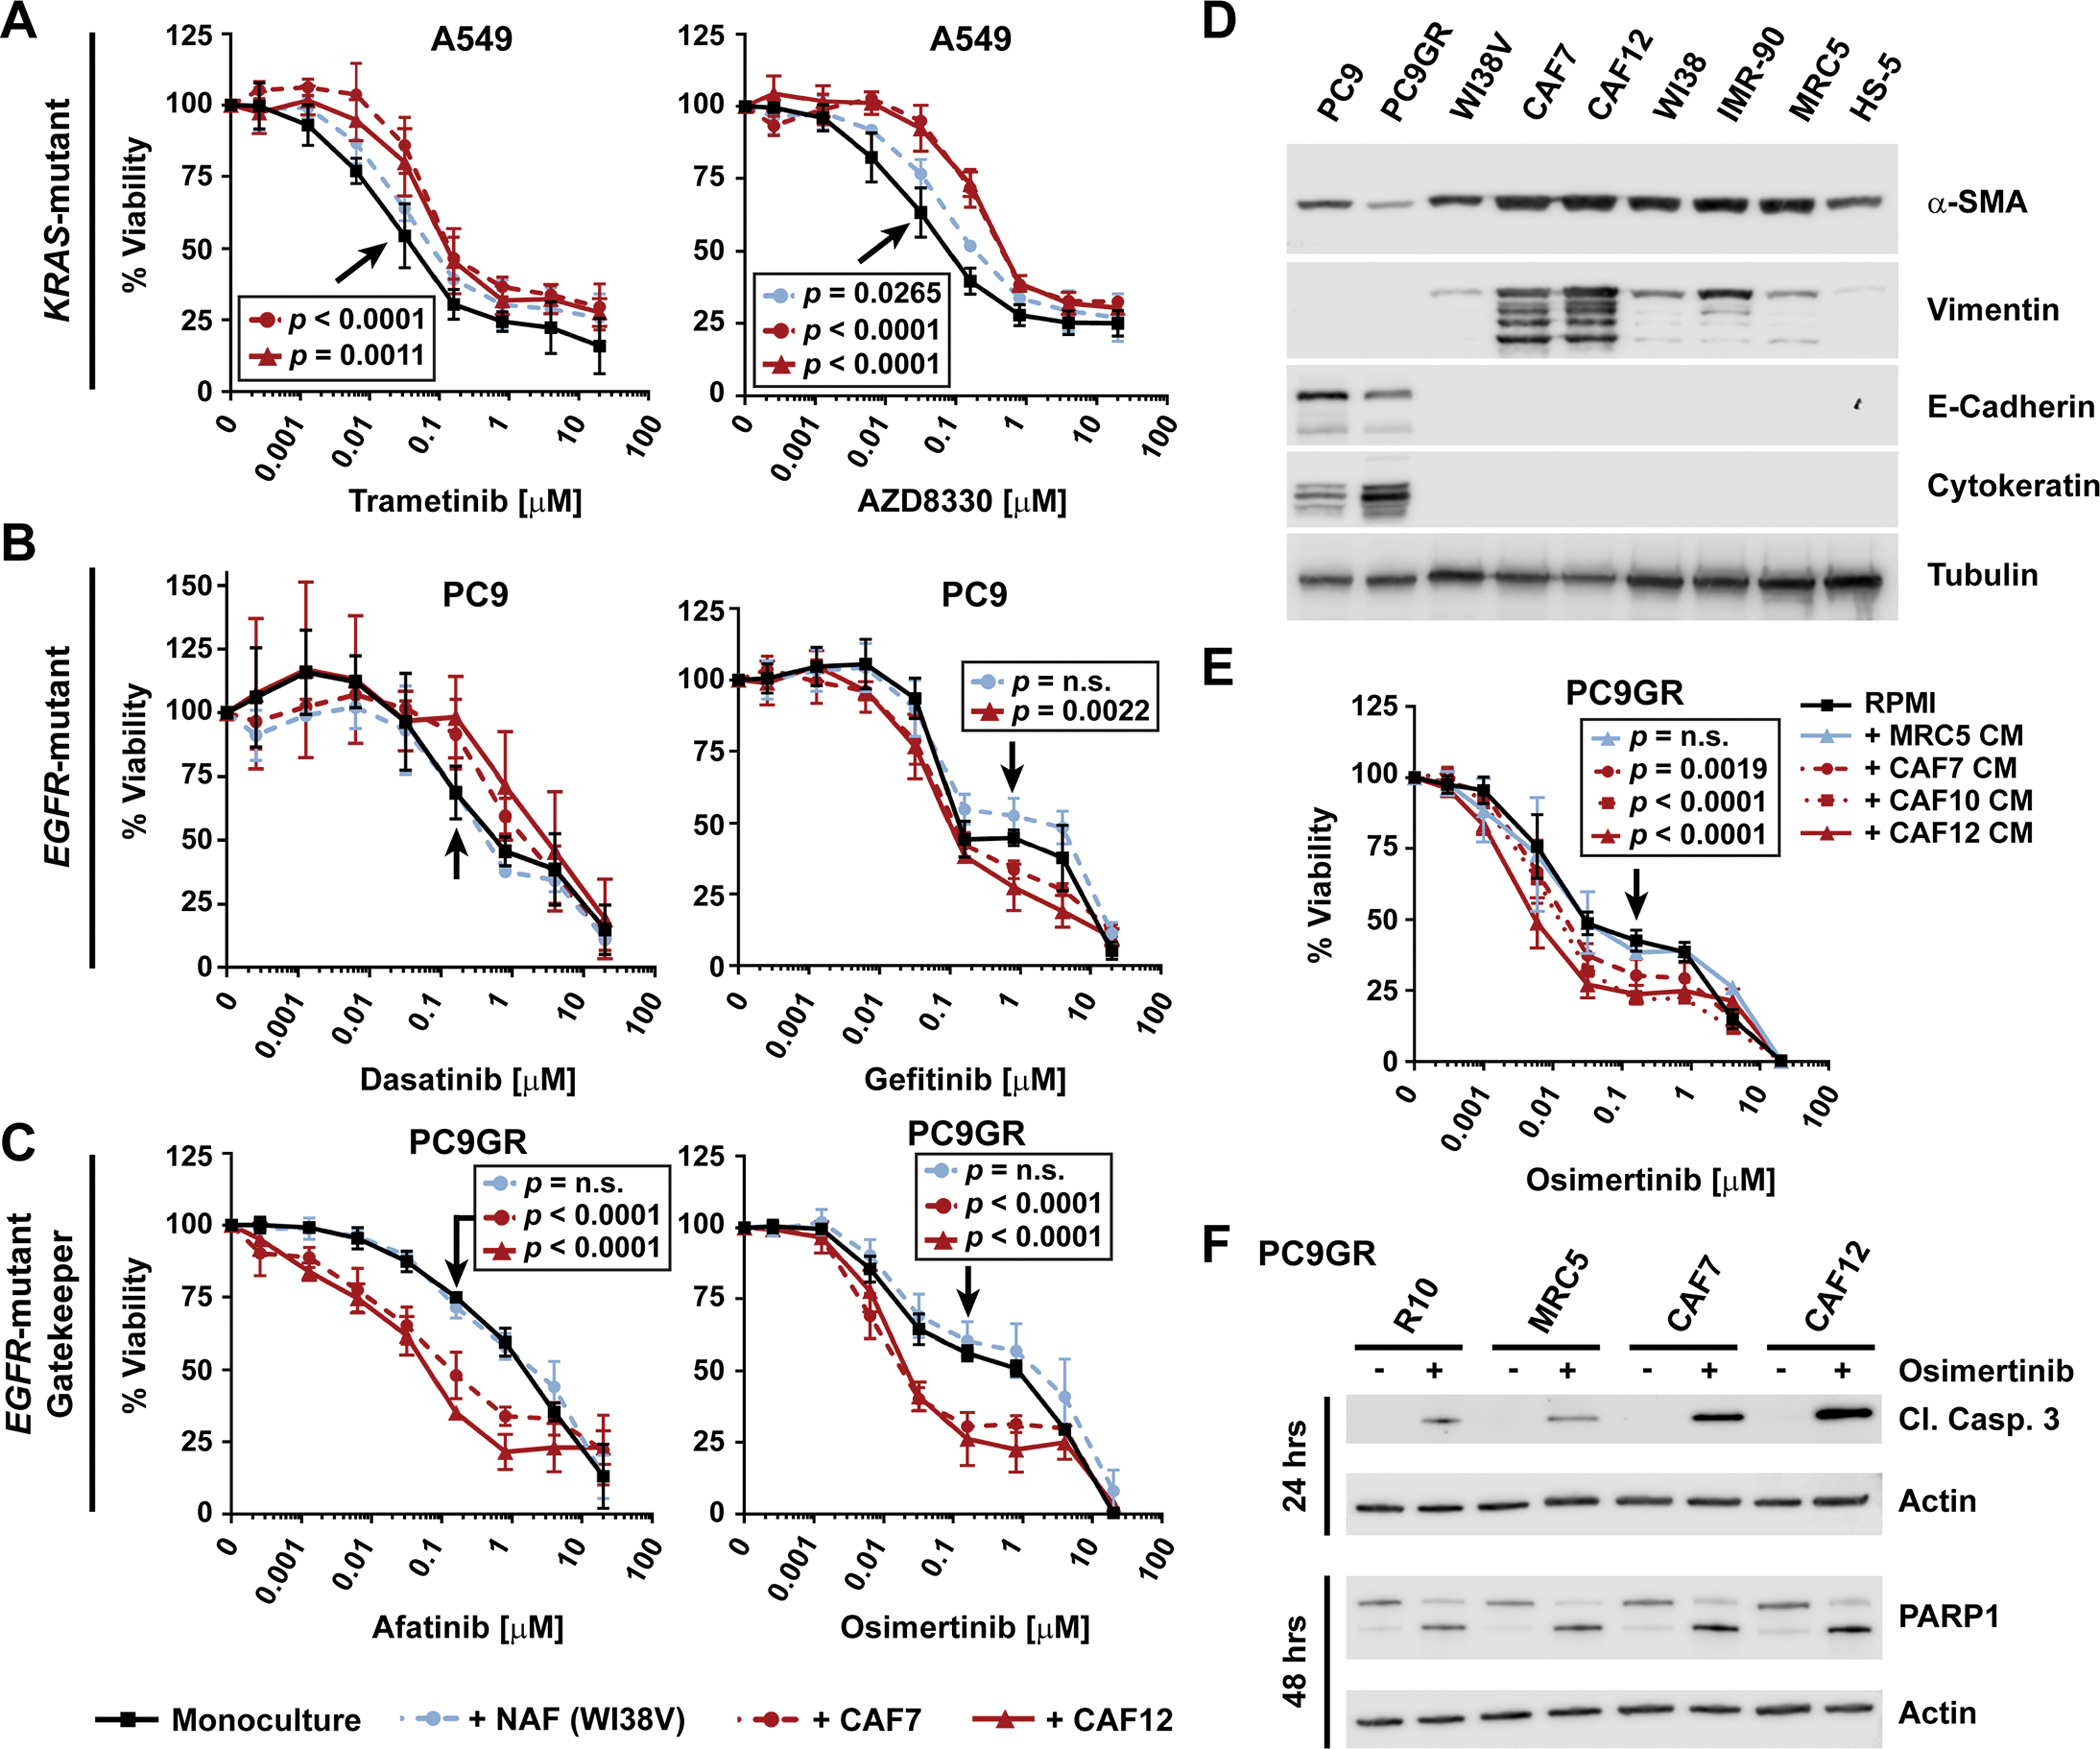
(A to C) Sensitivity in the presence or absence of CAFs or NAFs of (A) KRAS-mutant A549 cells to MEK inhibition, (B) EGFR-mutant PC9 cells to multi-kinase or EGFR inhibition, and (C) gefitinib-resistant T790M EGFR-mutant PC9GR cells to EGFR inhibition. 100% viability was set to the number of red-fluorescent cells detected by live cell imaging in the respective DMSO-treated mono-culture wells. A549, PC9, PC9GR and WI38V cells were plated at 500 cells/well, CAFs at 1000 cells/well. Data points represent the mean ± SD of at least three biological replicates performed as technical triplicates, except for PC9 cells co-cultured with CAF7 and WI38V cells and treated with dasatinib, which are from n=2 biological replicates. (D) Western blot analysis of fibroblast/mesenchymal and epithelial cell markers. Tubulin, loading control. Blot shown is representative of two biological replicates. (E) Sensitivity of PC9GR cells to osimertinib in the presence of RPMI10 or MRC5- or CAF-conditioned media (CM), as measured by CellTiter-Glo. 100% viability was set to total luminescence in DMSO-treated cells plated in RPMI10. Data are mean ± SD of at least three biological replicates each performed as technical triplicates. (F) Western blot analysis of the apoptosis markers cleaved caspase 3 and PARP1 in PC9GR cells plated in RPMI10 or CM 24 hours prior to the addition of DMSO or osimertinib (500 nM). Actin was used as loading control. Blot shown is representative of three biological replicates. For (A-C) and (E), technical replicates within each experiment were averaged before determining the mean ± SD and significance across biological replicates. Statistical significance was determined between control- and treated samples using the unpaired t test with single pooled variance and Holm-Sidak’s multiple comparison test (P<0.05; n.s., not significant). Black arrows point to the specific concentration of the respective control curve (in black) compared in each experiment.
Secreted IGF1R pathway components are differentially expressed in CAFs compared to NAFs
As drug sensitization was only observed with CAFs, we aimed to determine the differences between CAFs and NAFs in an unbiased way. Global gene expression analysis of 5 fibroblast (IMR-90, WI38, MRC5, CAF7 and CAF12) and 3 NSCLC (H3122, PC9 and PC9GR) cell lines reflected the general differences between NSCLC cells and fibroblasts (fig. S2A), between lung CAFs and NAFs (Fig. 2A and fig. S2B), and between PC9 parental and PC9GR cells (fig. S2C) (see also data file S1). As expected, epithelial cancer cells displayed higher expression than fibroblasts of genes that encode cytokeratin epithelial markers, but lower expression of genes that encode the common fibroblast markers α-SMA, FAP-α, and vimentin, which were similarly highly expressed across all fibroblasts (fig. S2D). Despite the similarities among fibroblasts, there were also notable differences between MRC5 NAFs and the two CAF cell lines (Fig. 2A and data file S1). Within the 172 genes that encode secreted proteins, multiple insulin growth factor binding proteins (IGFBPs), such as IGFBP5, 6 and 7, were found to be significantly increased in CAFs, whereas insulin growth factor 2 (IGF2) was decreased (Fig. 2B). Notably, several IGFBPs were also decreased in PC9GR versus PC9 cells, a feature that has been reported for IGFBP3 to promote drug-resistance in wild-type EGFR-driven A431 skin carcinoma cells (Fig. 2C and data file S1)(26).
Fig. 2. Differential fibroblast gene expression and secreted protein analysis.
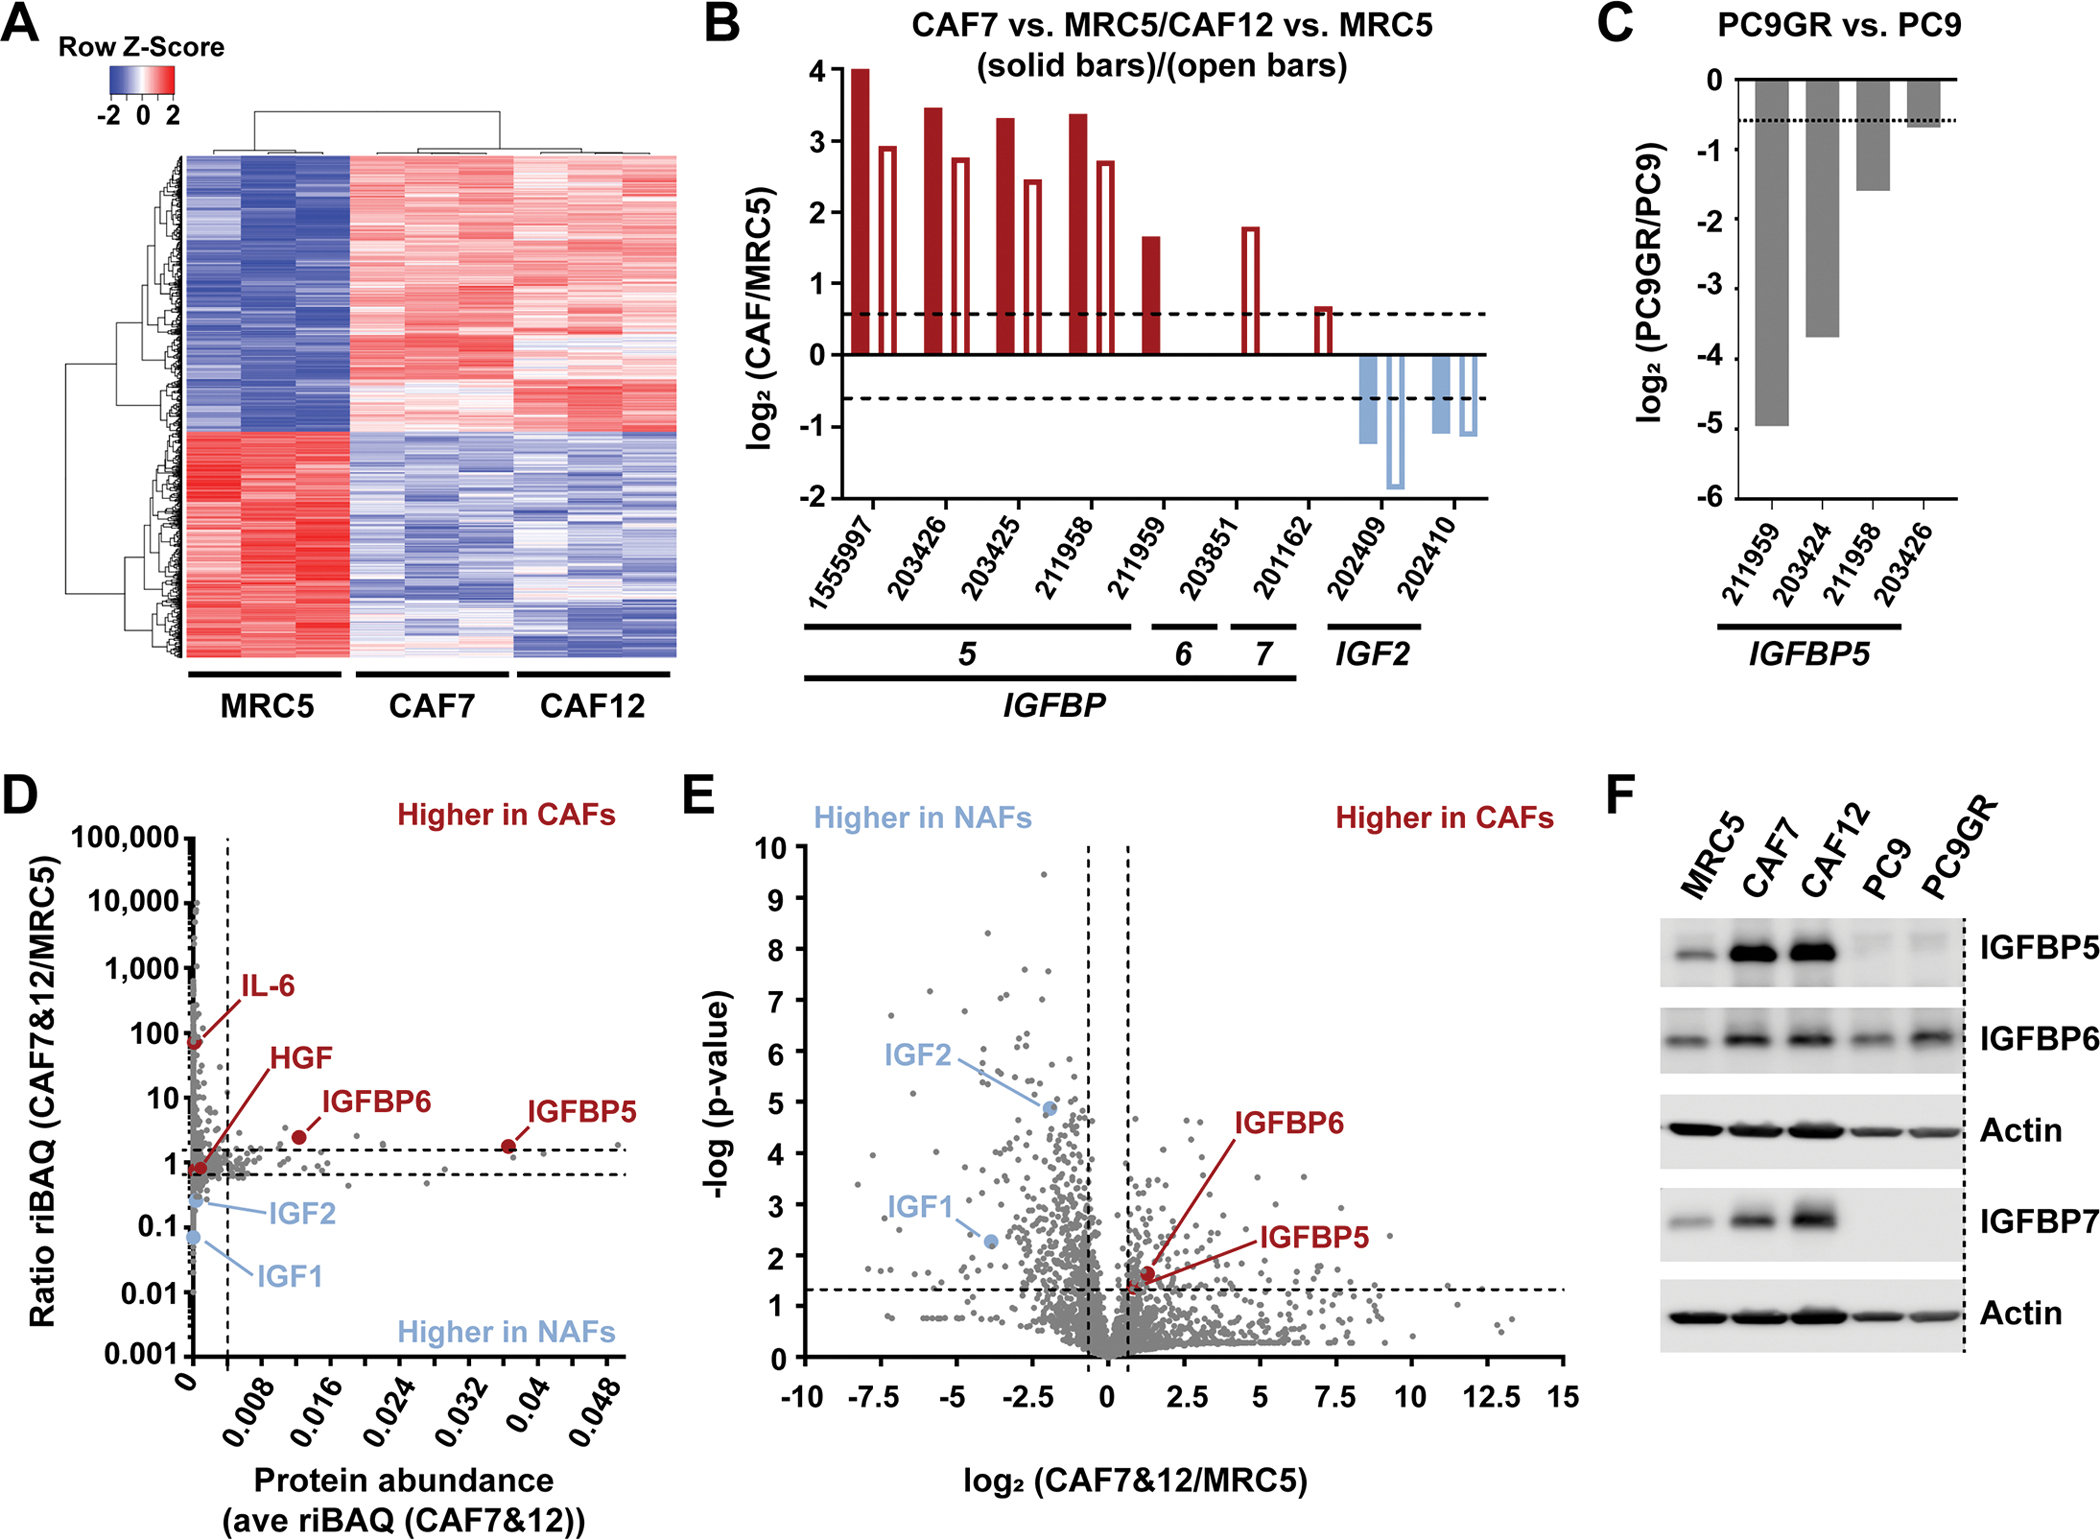
(A) Hierarchical clustering of 1948 differentially expressed gene probes in MRC5, CAF7 and CAF12 (A; see Methods for scoring procedure). (B and C) IGF1R pathway components that were significantly (P<0.05 by two-tailed, two-sample unequal variance t tests) differentially expressed in either CAF7 or CAF12 compared to MRC5 (each n=3 biological replicates; B), and in PC9GR compared to PC9 cells (n=3; C). (D) Comparison of 2,330 proteins identified by secretome analysis based on the average abundance (ave riBAQ) of each protein in CAF7 and CAF12 (n=6) and the ratio of each protein identified in CAF7 and CAF12 compared to MRC5 (n=3). Dashed lines indicate the top 2.5% most-abundant secreted proteins and a ratio of 1.5-fold increased or decreased. (E) Log2 ratio of each secreted protein identified in CAF7 and CAF12 compared to MRC5 and significance of these differences. Dashed lines indicate a log2 ratio of ± 0.58 (1.5-fold increased or decreased) and −log(p-value) greater than 1.3 (P<0.05 by a two-tailed, two-sample equal variance t test), comparing the riBAQ values for CAF7 and CAF12 to the riBAQ values for MRC5 from (D). (F) Western blot analysis of total protein levels of IGFBP5, IGFBP6 and IGFBP7 in the indicated cell lines. Actin, loading control (LI-COR scans in fig. S9). Dashed line indicates removed lanes. Blot shown is representative of two biological replicates.
Considering that CM caused similar effects as physical co-culture, we next investigated the differences between CAFs and NAFs regarding secreted proteins. Examination of CAF7 and MRC5 CM using cytokine array revealed the expected increased CAF secretion of cytokines associated with resistance, such as HGF and IL-6, but did not provide obvious candidates for sensitizing factors (fig. S3A). Therefore, we employed an unbiased mass spectrometry (MS)-based secretomics approach. To prevent background signals from serum proteins, serum-free conditioned media (SFCM) was collected from CAFs and NAFs. Subsequent high-resolution LC-MS/MS analysis revealed multiple differences between the two cell types (data file S2). For example, consistent with the cytokine array results, IL-6 was secreted more from CAFs than MRC5 NAFs, albeit only at overall low levels (Fig. 2D). Some of the most abundant differentially secreted proteins by CAFs versus MRC5 were IGFBP5 and IGFBP6 (Fig. 2, D and E and fig. S3B), corroborating the transcriptome analysis. IGFBPs are known to regulate IGF-mediated activation of IGF1R signaling, a pathway linked to EGFR inhibitor resistance that was also significantly enriched among the most abundant secreted proteins (top 2.5% of identified proteins), along with well-known extracellular matrix (ECM) pathways containing collagen, collagen binding proteins (for example, fibronectin, SPARC, biglycan) and proteoglycans such as lumican and decorin (fig. S3C and data file S3). Western blot analysis validated higher expression of several IGFBPs in CAFs than in MRC5 or cancer cells (Fig. 2F and fig. S9). In addition, although generally low in abundance relative to the IGFBPs, the stimulatory IGF1R ligands IGF1 and IGF2 were significantly less expressed in the CAF than in the NAF secretome (Fig. 2, D and E and fig. S3B). Together, the above work shows that CAFs express and secrete higher levels of several IGFBPs, while at the same time expressing less IGFs suggesting an overall inhibitory effect on IGF1R signaling in NSCLC cells.
Functional modulation of secreted IGF1R pathway components recapitulates CAF effects on EGFR-mutant NSCLC cells
Next, we evaluated the functional role of IGF1R pathway components that were differentially expressed between CAFs and NAFs regarding the sensitization effects seen with CAF CM. As IGFBP5, IGFBP6 or IGFBP7 were expressed at higher levels in CAFs than in NAFs, we first treated PC9GR cells with osimertinib in the presence of recombinant human (rh) IGFBP5, IGFBP6 or IGFBP7. All three IGFBPs significantly enhanced the response of PC9GR cells to osimertinib (Fig. 3, A to C). In contrast, the addition of exogenous growth factors IGF1 or IGF2, which we had observed to be secreted from CAFs at lower levels than from NAFs and which would be expected to cause the opposite effects from IGFBPs, resulted in significantly increased cell viability in the presence of osimertinib (Fig. 3D). Finally, we collected CM from CAFs, in which IGFBP5 had been silenced by either a siRNA pool or two individual siRNAs. Consistent with the results from treatment with recombinant IGFBP5, compared to non-targeting siRNA controls all three CM preparations from CAFs, in which IGFBP5 was knocked down, caused a small, but significant reduction in sensitization of PC9GR cells to osimertinib treatment (Fig. 3E). This was similarly the case upon IGFBP6 silencing (fig. S3D). These results suggest that the cumulative differences between multiple tumor-suppressive IGFBPs and tumor-promoting IGFs are critical for driving CAF CM-induced drug sensitization.
Fig. 3. Effect of modulation of IGF1R pathway components on EGFR-mutant NSCLC cells.
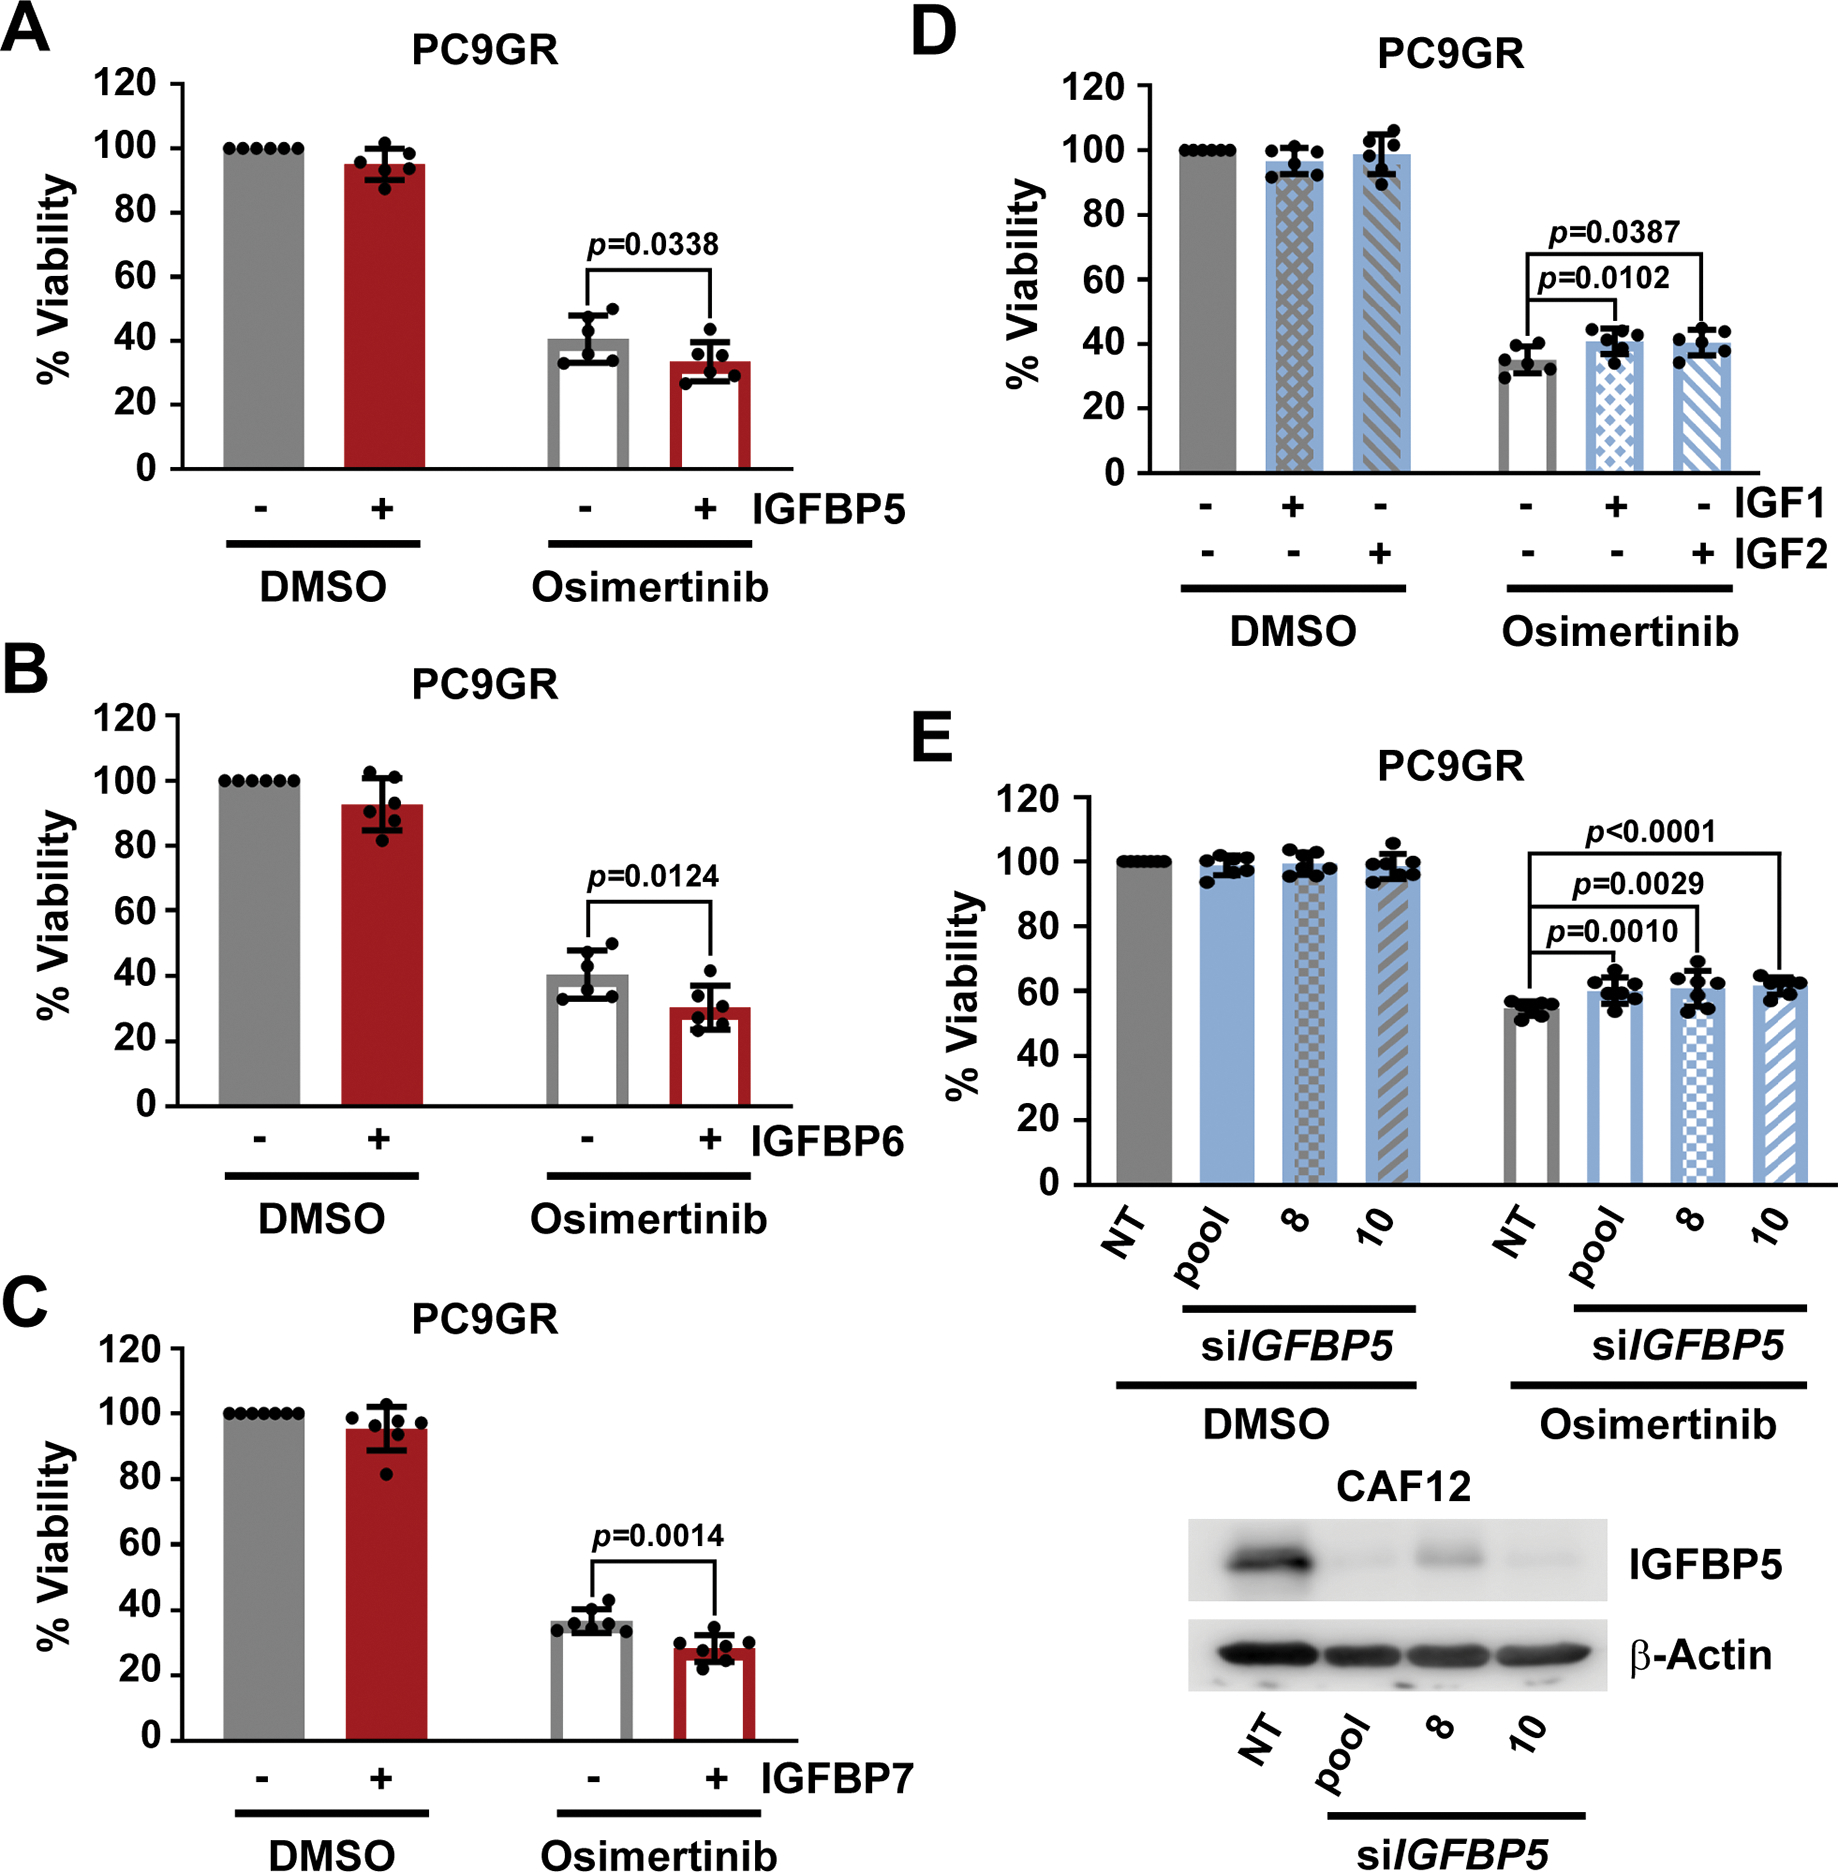
Viability as determined by CTG of PC9GR cells plated in RPMI10 containing 10 μg/mL (A) rhIGFBP5 (n=6), (B) rhIGFBP6 (n=6) or (C) rhIGFBP7 (n=7) and treated after 24 hours with 100 nM osimertinib for 72 hours. 100% viability is set to total luminescence in DMSO-treated cells plated in RPMI10 containing PBS. PBS treatments (DMSO and osimertinib) in panels A and B are the same as IGFBP5 and 6 experiments were performed in parallel. (D) Viability as determined by CTG of PC9GR cells plated in RPMI10 containing 100 ng/mL IGF1 or IGF2 and treated 24 hours later with osimertinib (100 nM for 72 hours). 100% viability was set to total luminescence in DMSO-treated cells plated in RPMI10 containing 0.1%BSA/PBS as buffer control. n=6 experiments. (E) Viability as determined by CTG of PC9GR cells plated in 1:1 RPMI10:siCM (from CAF12 cells in which IGFBP5 was silenced) and treated 24 hours later with osimertinib (100 nM for 72 hours). 100% viability is set to total luminescence in DMSO-treated cells plated in 1:1 RPMI10:si-NT CM. n=7 experiments. A representative Western blot confirming knockdown efficiency is shown. Technical replicates within each experiment in (A-E) were averaged before determining the mean ± SD and significance across all biological replicates (n). P<0.05 by unpaired t test with single pooled variance.
CAFs reduce IGF1R survival signaling in EGFR-mutant NSCLC cells
Given that gene expression and secretome analysis of CAFs versus NAFs identified differential expression of IGF1R signaling components, that is IGFBPs and IGF1/2, and that we were able to show that the relative expression of these components plays a role for CAF-induced drug sensitization, we next sought to identify the downstream signaling pathways in PC9GR cells that are affected by CAF and NAF CM. We first examined receptor tyrosine kinase (RTK) phosphorylation using phospho(p)-RTK arrays as RTKs are direct effectors of paracrine growth factor signaling. As expected, pEGFR was strongly reduced by osimertinib regardless of CM present (Fig. 4A and fig. S4, A and B). Consistent with the expected effects of IGFBPs, also pIGF1R was decreased by CAF7 or CAF12 CM compared to MRC5 CM (Fig. 4A and fig. S4, A and C). To interrogate proteome-wide phosphotyrosine signaling in DMSO or osimertinib treated PC9GR cells grown in MRC5 or CAF7 CM, we undertook an unbiased tyrosine phosphoproteomics approach (data file S4). EGFR autophosphorylation sites including Tyr1092, Tyr1172 and Tyr1197, as well as canonical downstream phosphosites (for example, SHC1 Tyr427; GAB1 Tyr627; CBL Tyr700) were similarly decreased upon osimertinib treatment in both NAF and CAF CM (Fig. 4B and fig. S5, A and B) suggesting that the sensitization to osimertinib was not due to changes in direct EGFR signaling. Consistent with higher levels of IL-6 in the CAF7 secretome, STAT3 phosphorylation (Tyr705) was higher in cells treated with CAF7 CM than MRC5 CM, which as a pro-survival signal, though, was unlikely to account for any drug sensitization effect (Fig. 4, B and C and fig. S5C). However, although osimertinib treatment caused significantly increased phosphorylation of the IGF1R adaptor and substrate protein IRS2 by both CM (Fig. 4B and fig. S5B), there was a tendency toward a lower degree of upregulation by CAF7 CM compared to MRC5 CM (data file S4). IRS2 Tyr632 was furthermore less phosphorylated with CAF7 CM under DMSO treatment (fig. S5C). Notably, several of the identified IRS2 phosphotyrosine sites have been shown to be crucial for PI3K/AKT signaling(27) implying a CAF7-dependent dampening of IGF1R signaling through AKT downstream of IRS2. Further comparison of the altered phosphosites revealed that also ERK1/2 (Tyr204/187) and FAK1 (Tyr397) phosphorylation were reduced by CAF7 CM compared to MRC5 CM upon osimertinib treatment (Fig. 4, C and D). Reduction of FAK (Tyr397) phosphorylation by CAF CM was also discernible by immunoblot (fig. S5D). This is in line with reports of IGFBP interaction with integrins leading to subsequent dephosphorylation of FAK, which can signal through both ERK and AKT (28–30). In support of these findings, pathway analysis of phosphoproteins significantly altered by osimertinib with either CM, showed enrichment of the ErbB, insulin and focal adhesion pathways (fig. S5E and data file S5). Consistently, immunoblot analysis of early signaling effects showed that although pEGFR was similarly decreased upon cell culture with all CM, pAKT and pERK1/2 were both further decreased in the presence of CAF CM compared to MRC5 CM (Fig. 4E and fig. S10). This concurs with a CAF-dependent decrease of both proliferation and survival signals, especially upon osimertinib treatment. Moreover, stimulation with IGF1 rescued AKT phosphorylation, but not ERK phosphorylation, supporting the idea that although AKT is downstream of IGF1R, the CAF-induced change in ERK signaling is neither EGFR- nor IGF1R-driven, but possibly rather due to suppression of FAK signaling through integrin-IGFBP interactions. Collectively, these data suggest that compensatory survival signaling in PC9GR cells in response to osimertinib treatment is reduced by CAF CM through inhibition of IGF1R and FAK signaling.
Fig. 4. Conditioned media affects signaling in EGFR-mutant NSCLC cells.
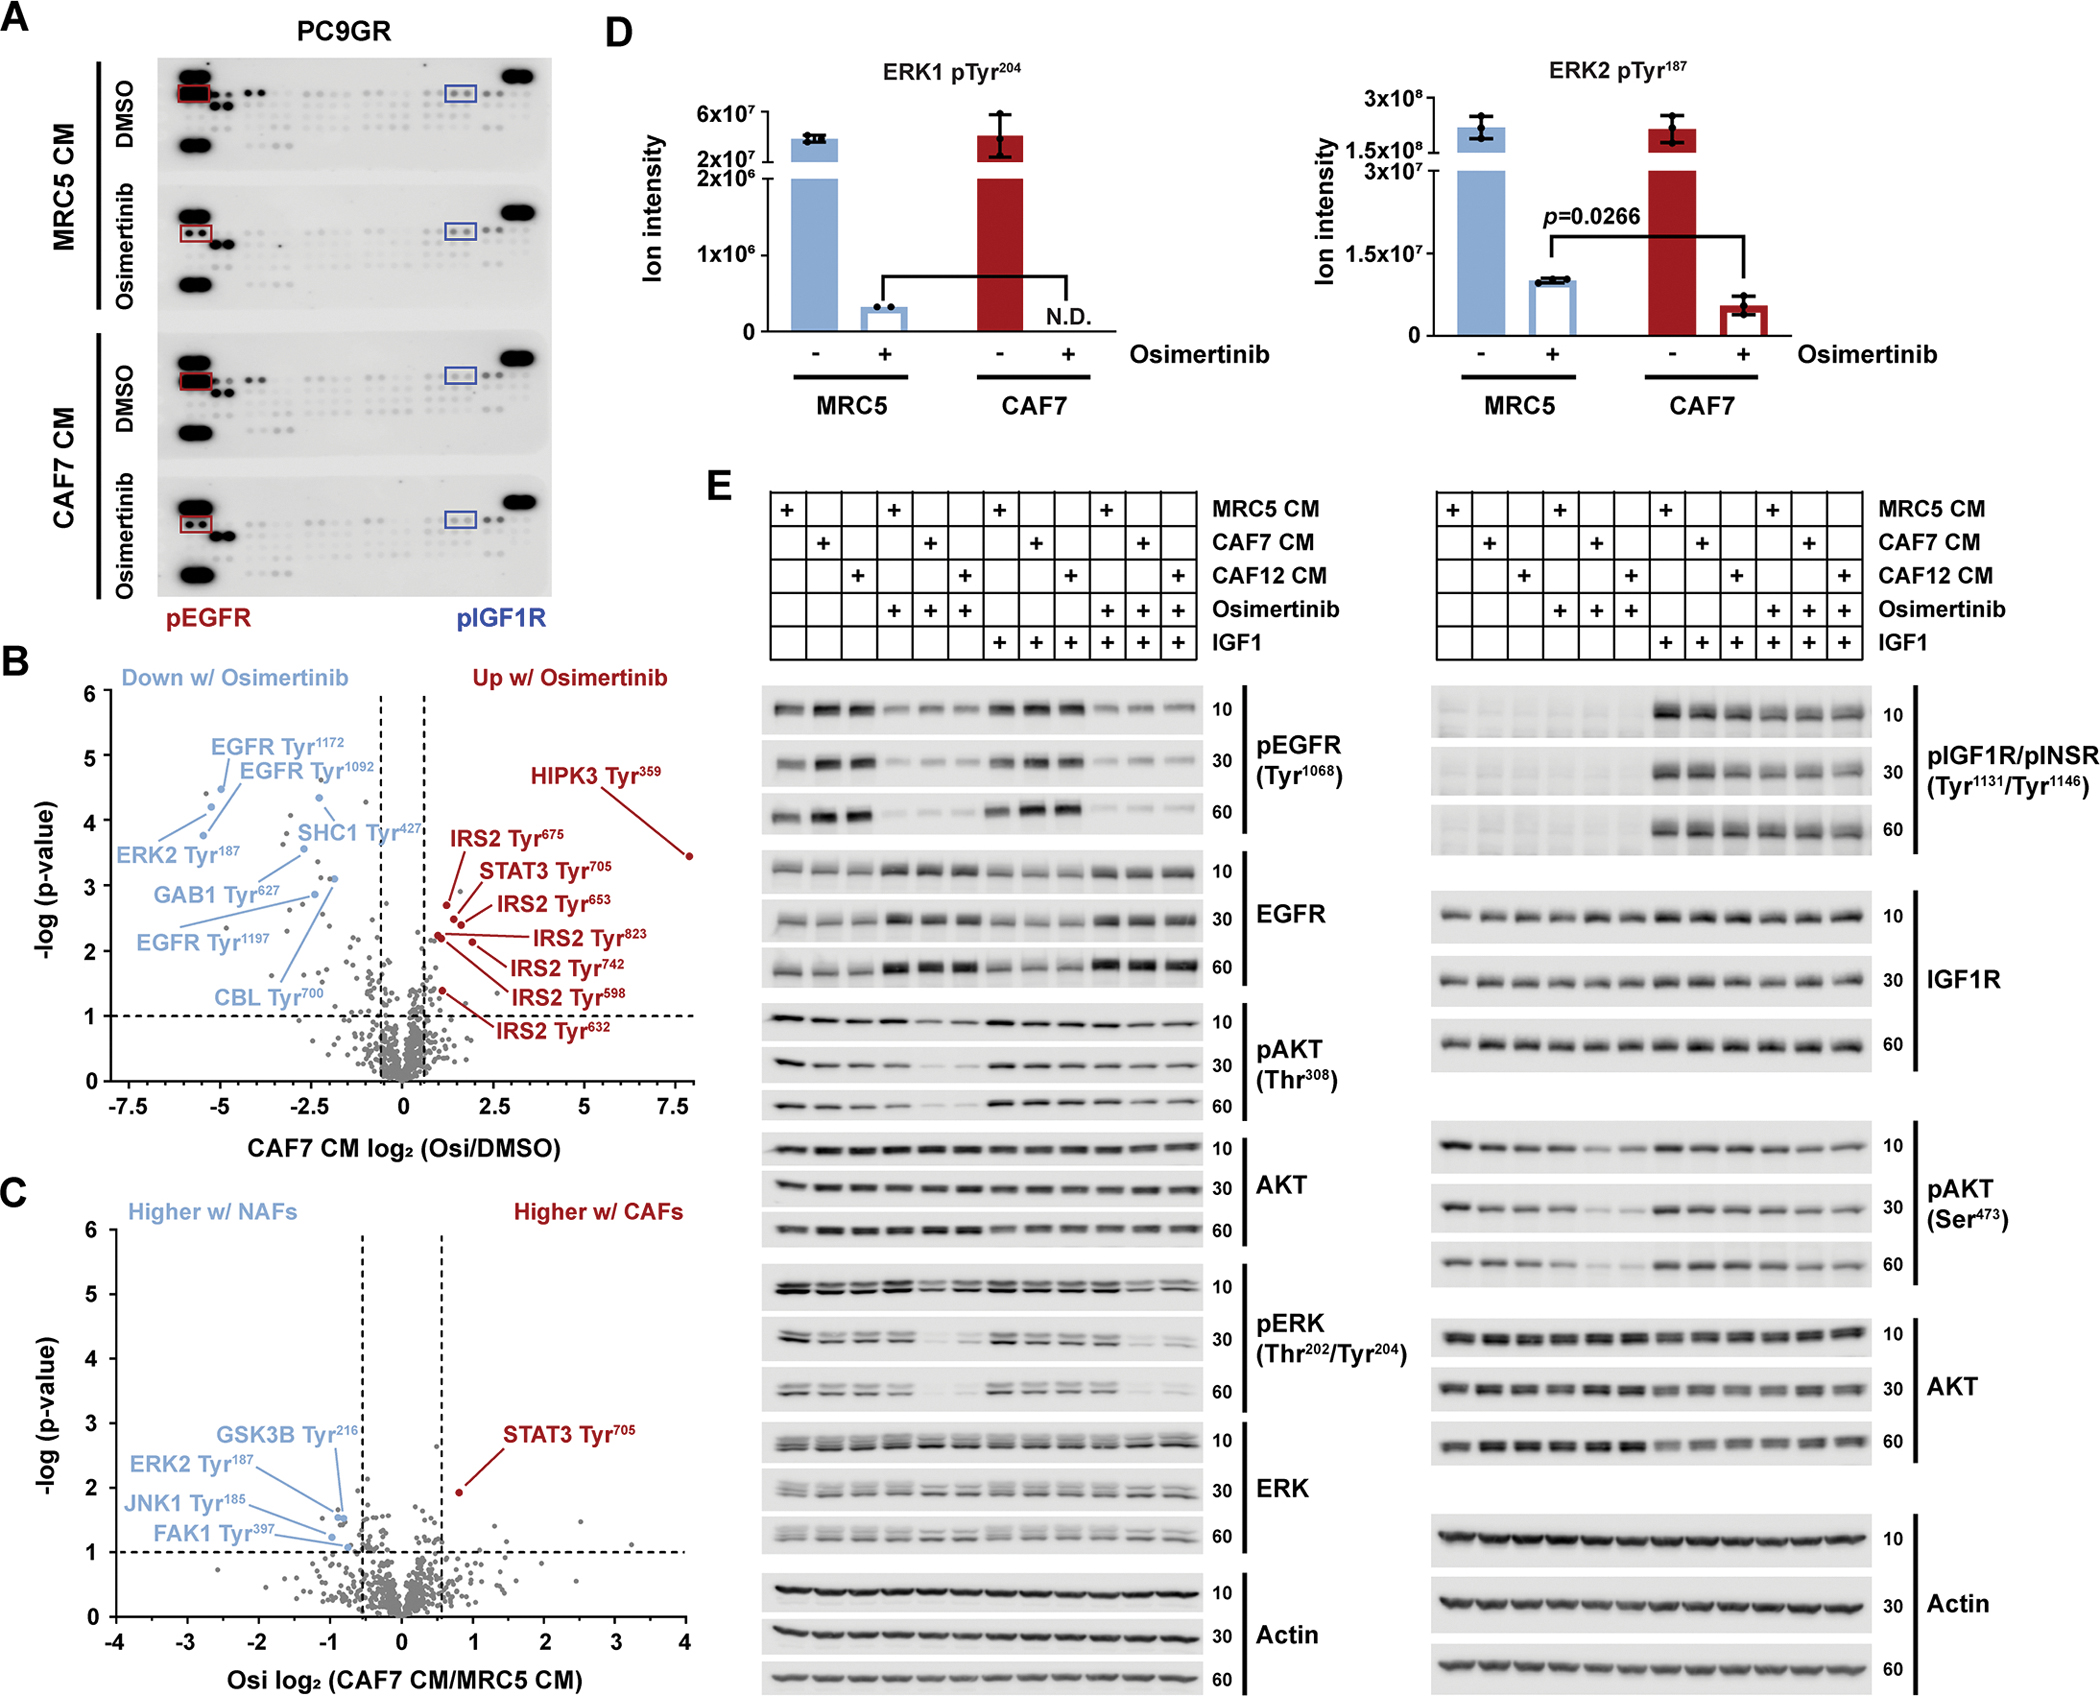
(A) Representative phospho-RTK arrays from PC9GR cell lysates. Cells were plated in 1:1 RPMI10:CM (MRC5-CM or CAF7-CM) and treated the next day with 500 nM osimertinib or vehicle control (DMSO) for 3 hours before harvesting the cells for lysis. n= two biological replicates. Red boxes, pEGFR signals; blue boxes, pIGF1R signals. (B) Volcano plot showing the phosphorylated peptides from (A) that were significantly increased or decreased by osimertinib versus DMSO in the presence of CAF7-CM. Dashed lines indicate −log(p-value)>1 (P<0.1) and log2(osimertinib/DMSO) ± 0.58 (1.5-fold change). (C) Volcano plot showing phosphotyrosine sites that were significantly increased or decreased by incubation in CAF7-CM versus MRC5-CM in the presence of osimertinib. Dashed lines as described in (B), for CAF7-CM/MRC5-CM. (D) Changes in signal intensity of phosphotyrosine sites on ERK1/2 upon osimertinib treatment in cells cultured in MRC5-CM or CAF7-CM. N.D.= not determined due to no signal present upon osimertinib treatment. Significance in (B to D) by two-tailed, two-sample equal variance t-tests; each n=3 biological replicates. (E) Western blot analysis of the indicated phospho- and total proteins at 10, 30, or 60 min after addition of media. PC9GR cells were plated in RPMI10, and media were changed the next day to 1:1 RPMI10:CM (MRC5-, CAF7- or CAF12-CM) containing DMSO or osimertinib (100 nM), with or without IGF1 (50 ng/mL) or its vehicle (0.1% BSA/PBS), as indicated. Actin, loading control. Blots are representative of three biological replicates; LI-COR scans shown in fig. S10.
Dual targeting of compensatory IGF1R and FAK signaling with small molecules recapitulates CAF effects
To examine if inhibition of IGF1R signaling using small molecules phenocopied CAF sensitization effects, we treated PC9GR cells with two different IGF1R tyrosine kinase inhibitors (TKIs), namely GSK1838705A and linsitinib. Similar to CAF CM (Fig. 1E), the combination with either IGF1R TKI enhanced osimertinib activity (Fig. 5A and fig. S6A). Next, we tested the combination of osimertinib, linsitinib and defactinib, a specific FAK inhibitor, for activity in PC9GR cells. We found that both defactinib and linsitinib increased osimertinib sensitivity, but that the combination of all three had the strongest effect (Fig. 5B). Considering that the FDA-approved ALK inhibitor ceritinib also inhibits IGF1R and FAK1 in the low and mid-nanomolar range, respectively (31, 32), we tested the combination of ceritinib and osimertinib on PC9GR cells. This combination closely resembled the linsitinib, defactinib and osimertinib combination, showing an even stronger effect on cell viability than IGF1R inhibition alone (Fig. 5C). We hypothesized that ceritinib’s polypharmacology targeting both IGF1R and FAK may explain this additional effect and found reduced FAK and ERK phosphorylation upon treatment of PC9GR cells with ceritinib versus linsitinib, whereas both drugs inhibited phosphorylation of IGF1R and AKT similarly (Fig. 5D and figs. S6, B to E, and S11). Likewise, combination of ceritinib with an alternate EGFR inhibitor, nazartinib, decreased PC9GR cell viability (fig. S6F), confirming that this effect is not limited to osimertinib. The ceritinib and osimertinib combination also decreased cell viability in multiple other EGFR-driven cell lines suggesting broader applicability (fig. S6, G to I). Long-term clonogenic growth assays furthermore revealed strong synergy leading to almost complete elimination of PC9GR cells (Fig. 5E). Together, these data show that IGF1R and FAK inhibitors, by targeting the mechanisms modulated by CAFs, can sensitize EGFR-driven cancer cells to EGFR TKIs.
Fig. 5. Dual IGF1R and FAK inhibition affects viability and signaling in EGFR-mutant NSCLC cells.
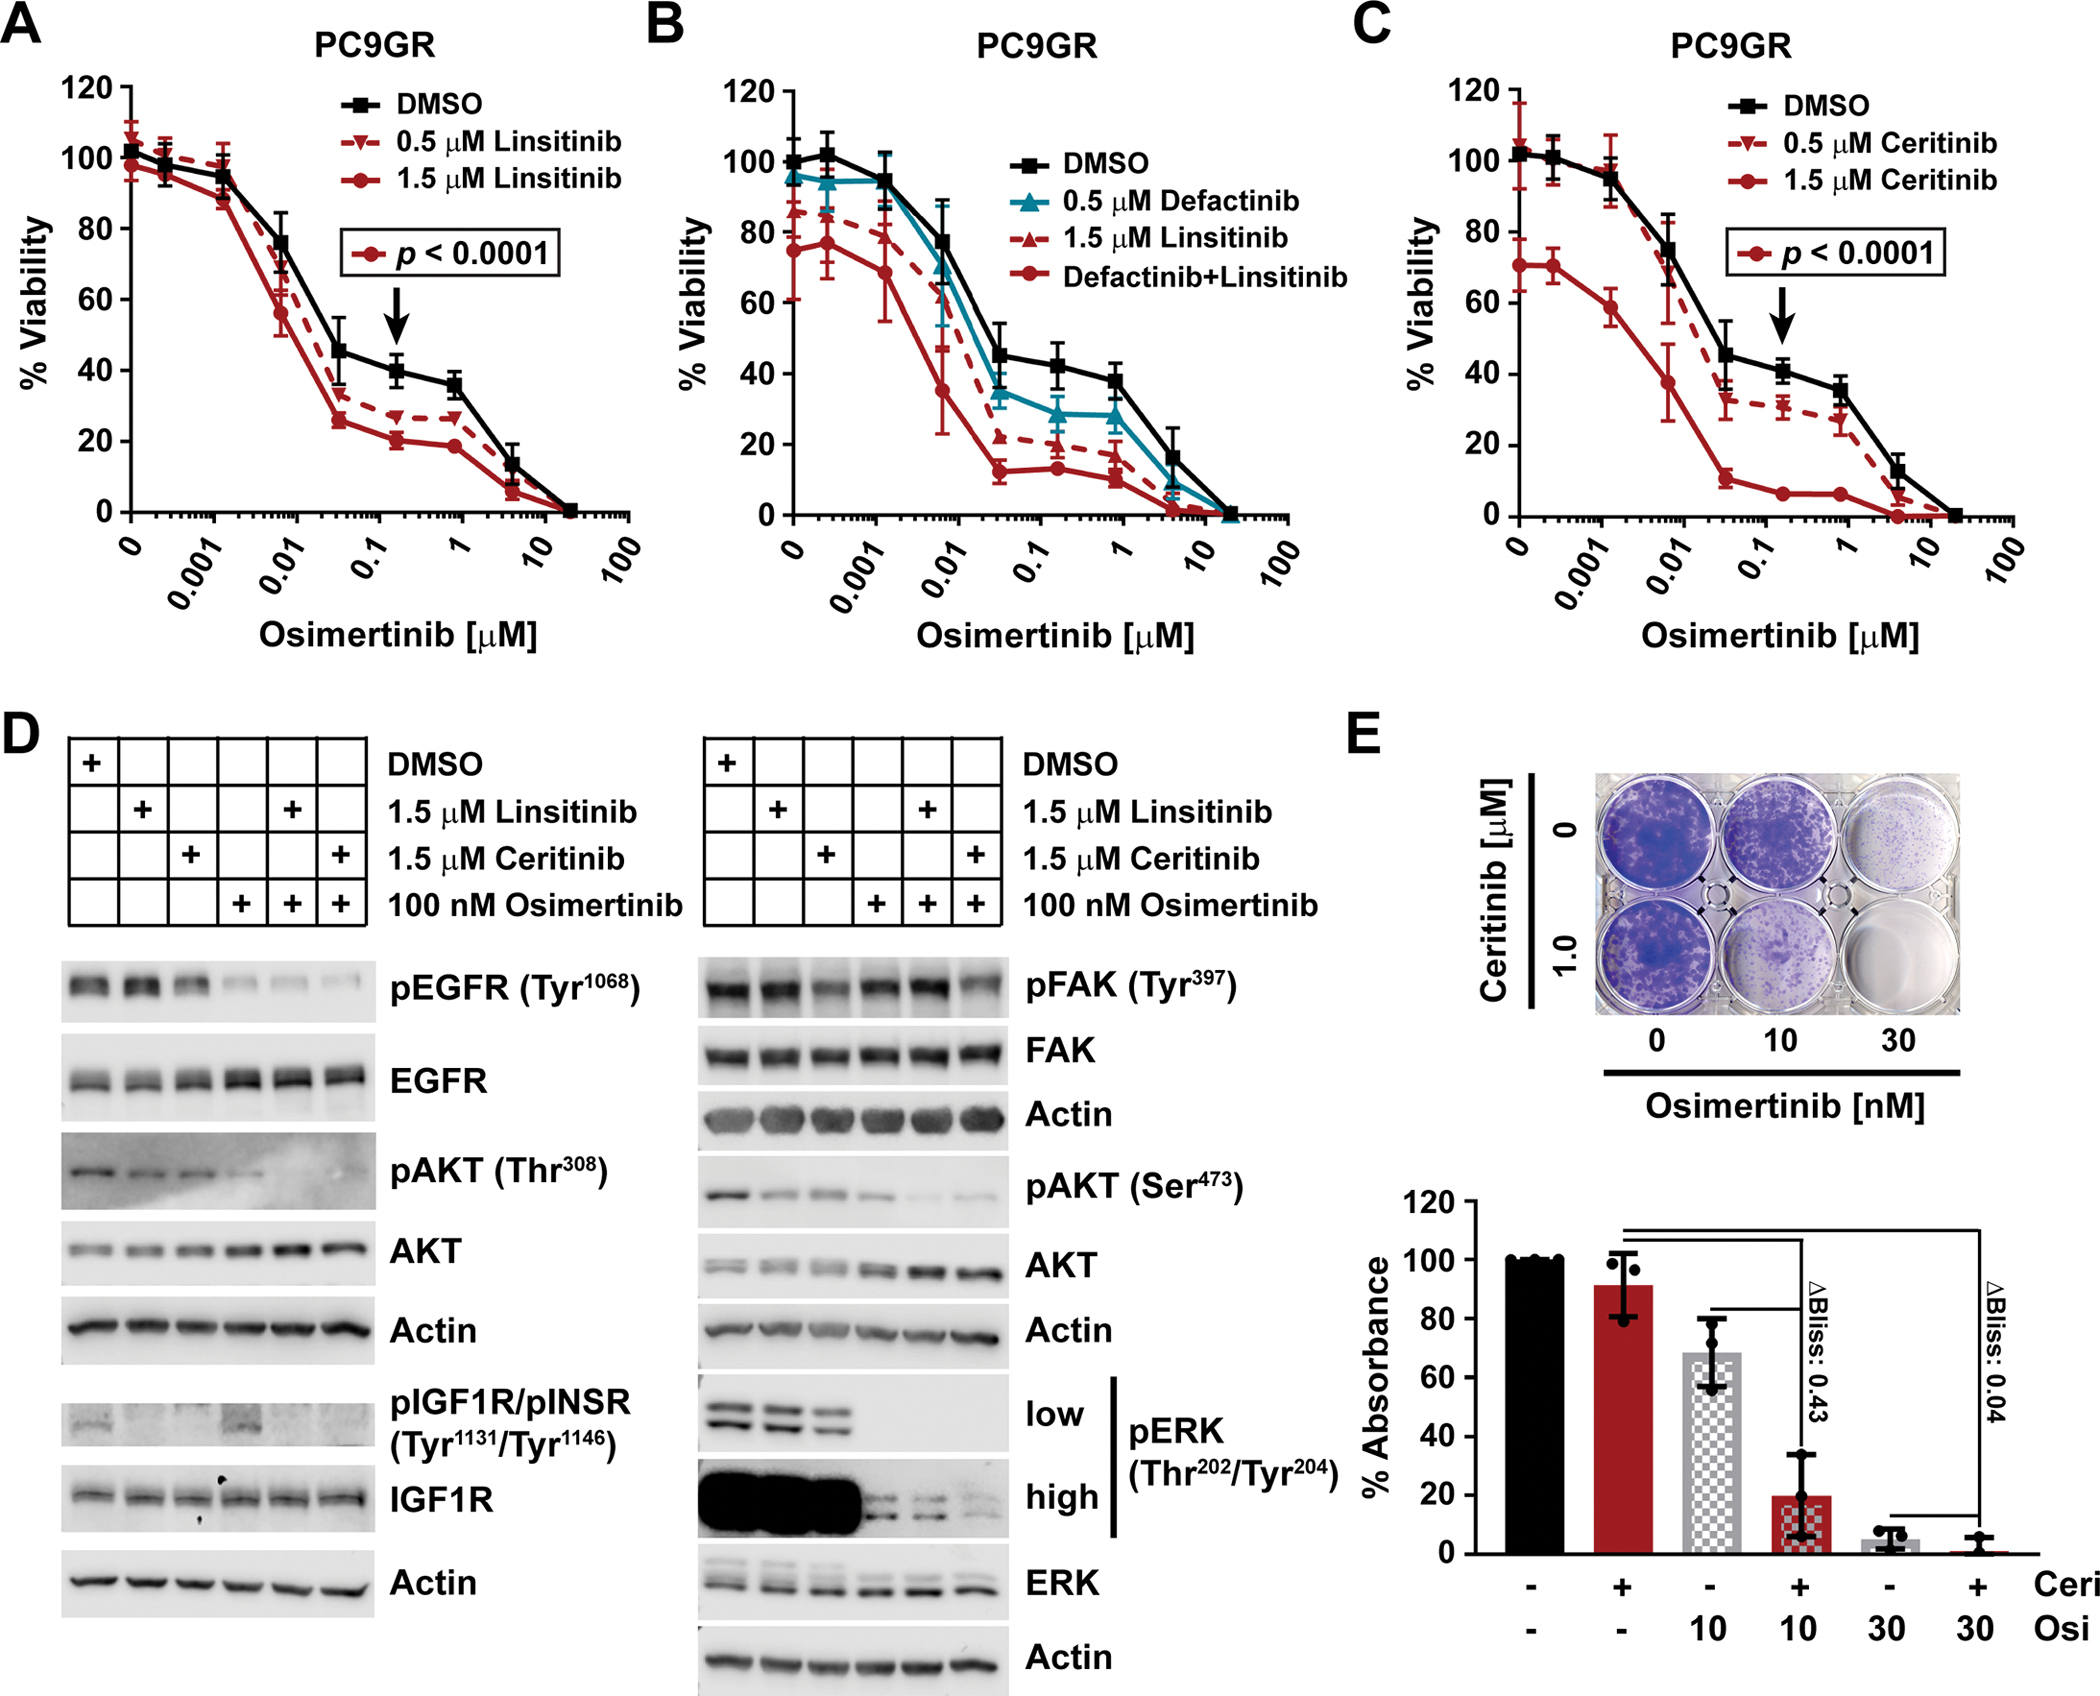
(A to C) Viability as determined by CTG of PC9GR cells plated in RPMI10 and treated after 24 hours with osimertinib in combination with stated concentrations of linsitinib (A; n=3 experiments), defactinib, linsitinib, or both (B; n=2), or ceritinib (C; n=3) for 72 hours. 100% viability was set to total luminescence in DMSO-only treated cells. Each experiment (n) was performed as technical triplicates, which were averaged before determining the mean ± SD and significance across biological replicates, by unpaired t test with single pooled variance and Holm-Sidak’s multiple comparison test for (A) and (C). Black arrows mark the specific concentration of the respective control curve (in black) compared in each experiment. (D) Western blot analysis of the phosphorylated and total fractions of the indicated proteins at 30 min after drug application. PC9GR cells were plated in RPMI10 and the media was changed the next day to RPMI10 containing DMSO, linsitinib, ceritinib, osimertinib, or combinations thereof as indicated. Actin, loading control. Blots are representative of at least three biological replicates. Quantifications are in fig. S6, and LI-COR scans in fig. S11. (E) Representative clonogenic viability assay for PC9GR cells (1500 cells/well) treated with osimertinib and/or ceritinib at the indicated concentrations at day 1 and incubated for 10 days. Data are quantification of extracted crystal violet absorbance, mean ± SD of three biological replicates.
CAF-imitating pharmacological targeting of survival pathways enhances first-line TKI efficacy in EGFR-mutant NSCLC
Osimertinib has been recently approved for the treatment of naïve EGFR-mutant lung cancer. We therefore aimed to determine the efficacy of combined targeting of EGFR, IGF1R and FAK, the latter two of which we observed to mimic CAF effects, in such a first-line setting. Parental PC9 cells were treated with the combination of EGFR TKIs and various IGFBPs. Although PC9 cells are inherently more sensitive to EGFR inhibition by osimertinib and gefitinib, significant sensitization was observed by the addition of IGFBPs for multiple combinations (Fig. 6A). Furthermore, combination of osimertinib or nazartinib with ceritinib was synergistic in PC9 cells and pushed the viability curves both to the left and down to baseline (Fig. 6, B and C), which suggested the elimination of persister cells that could give rise to bona fide resistant clones in the future. To test this, we set up long-term, high-plating density live-cell imaging assays with final crystal violet readouts at either 14 or 28 days (Fig. 6D and fig. S7, A to C). Although 1 μM ceritinib alone had no effect, PC9 cell confluence initially decreased as expected with both EGFR inhibitors alone. Consistent with our short-term viability data, however, combination with ceritinib was significantly more pronounced. Moreover, the single drug treated cells began to recover and grow out at approximately 21 days, while the EGFR TKI combinations with ceritinib eliminated essentially all cells through 28 days. Furthermore, in PC9 3D spheroids, osimertinib strongly reduced spheroid size and viability, but the ceritinib combination was strongly synergistic in decreasing spheroid cell viability (ΔBliss = 0.14) (fig. S7D). Finally, although the individual contributions of the various involved CAF proteins remain to be determined, the combination of ceritinib with osimertinib more effectively inhibited tumor growth as determined by tumor volume than single drug treatment in vivo using PC9 mouse xenografts (Fig. 6E). Consistently, the size and weight of excised tumors were significantly reduced by the drug combination compared to osimertinib treatment alone (Fig. 6, F and G). Mouse body weight, as a measure of toxicity, stabilized at 2 weeks after an initial slight reduction indicating general tolerability of this drug combination (fig. S7E). Together, this work shows that imitating tumor-suppressive CAF effects on survival pathways, such as IGF1R and FAK signaling, with small molecule drugs can also enhance first-line TKI efficacy in EGFR-mutant NSCLC.
Fig. 6. First line targeting of CAF-regulated pathways in NSCLC cells.
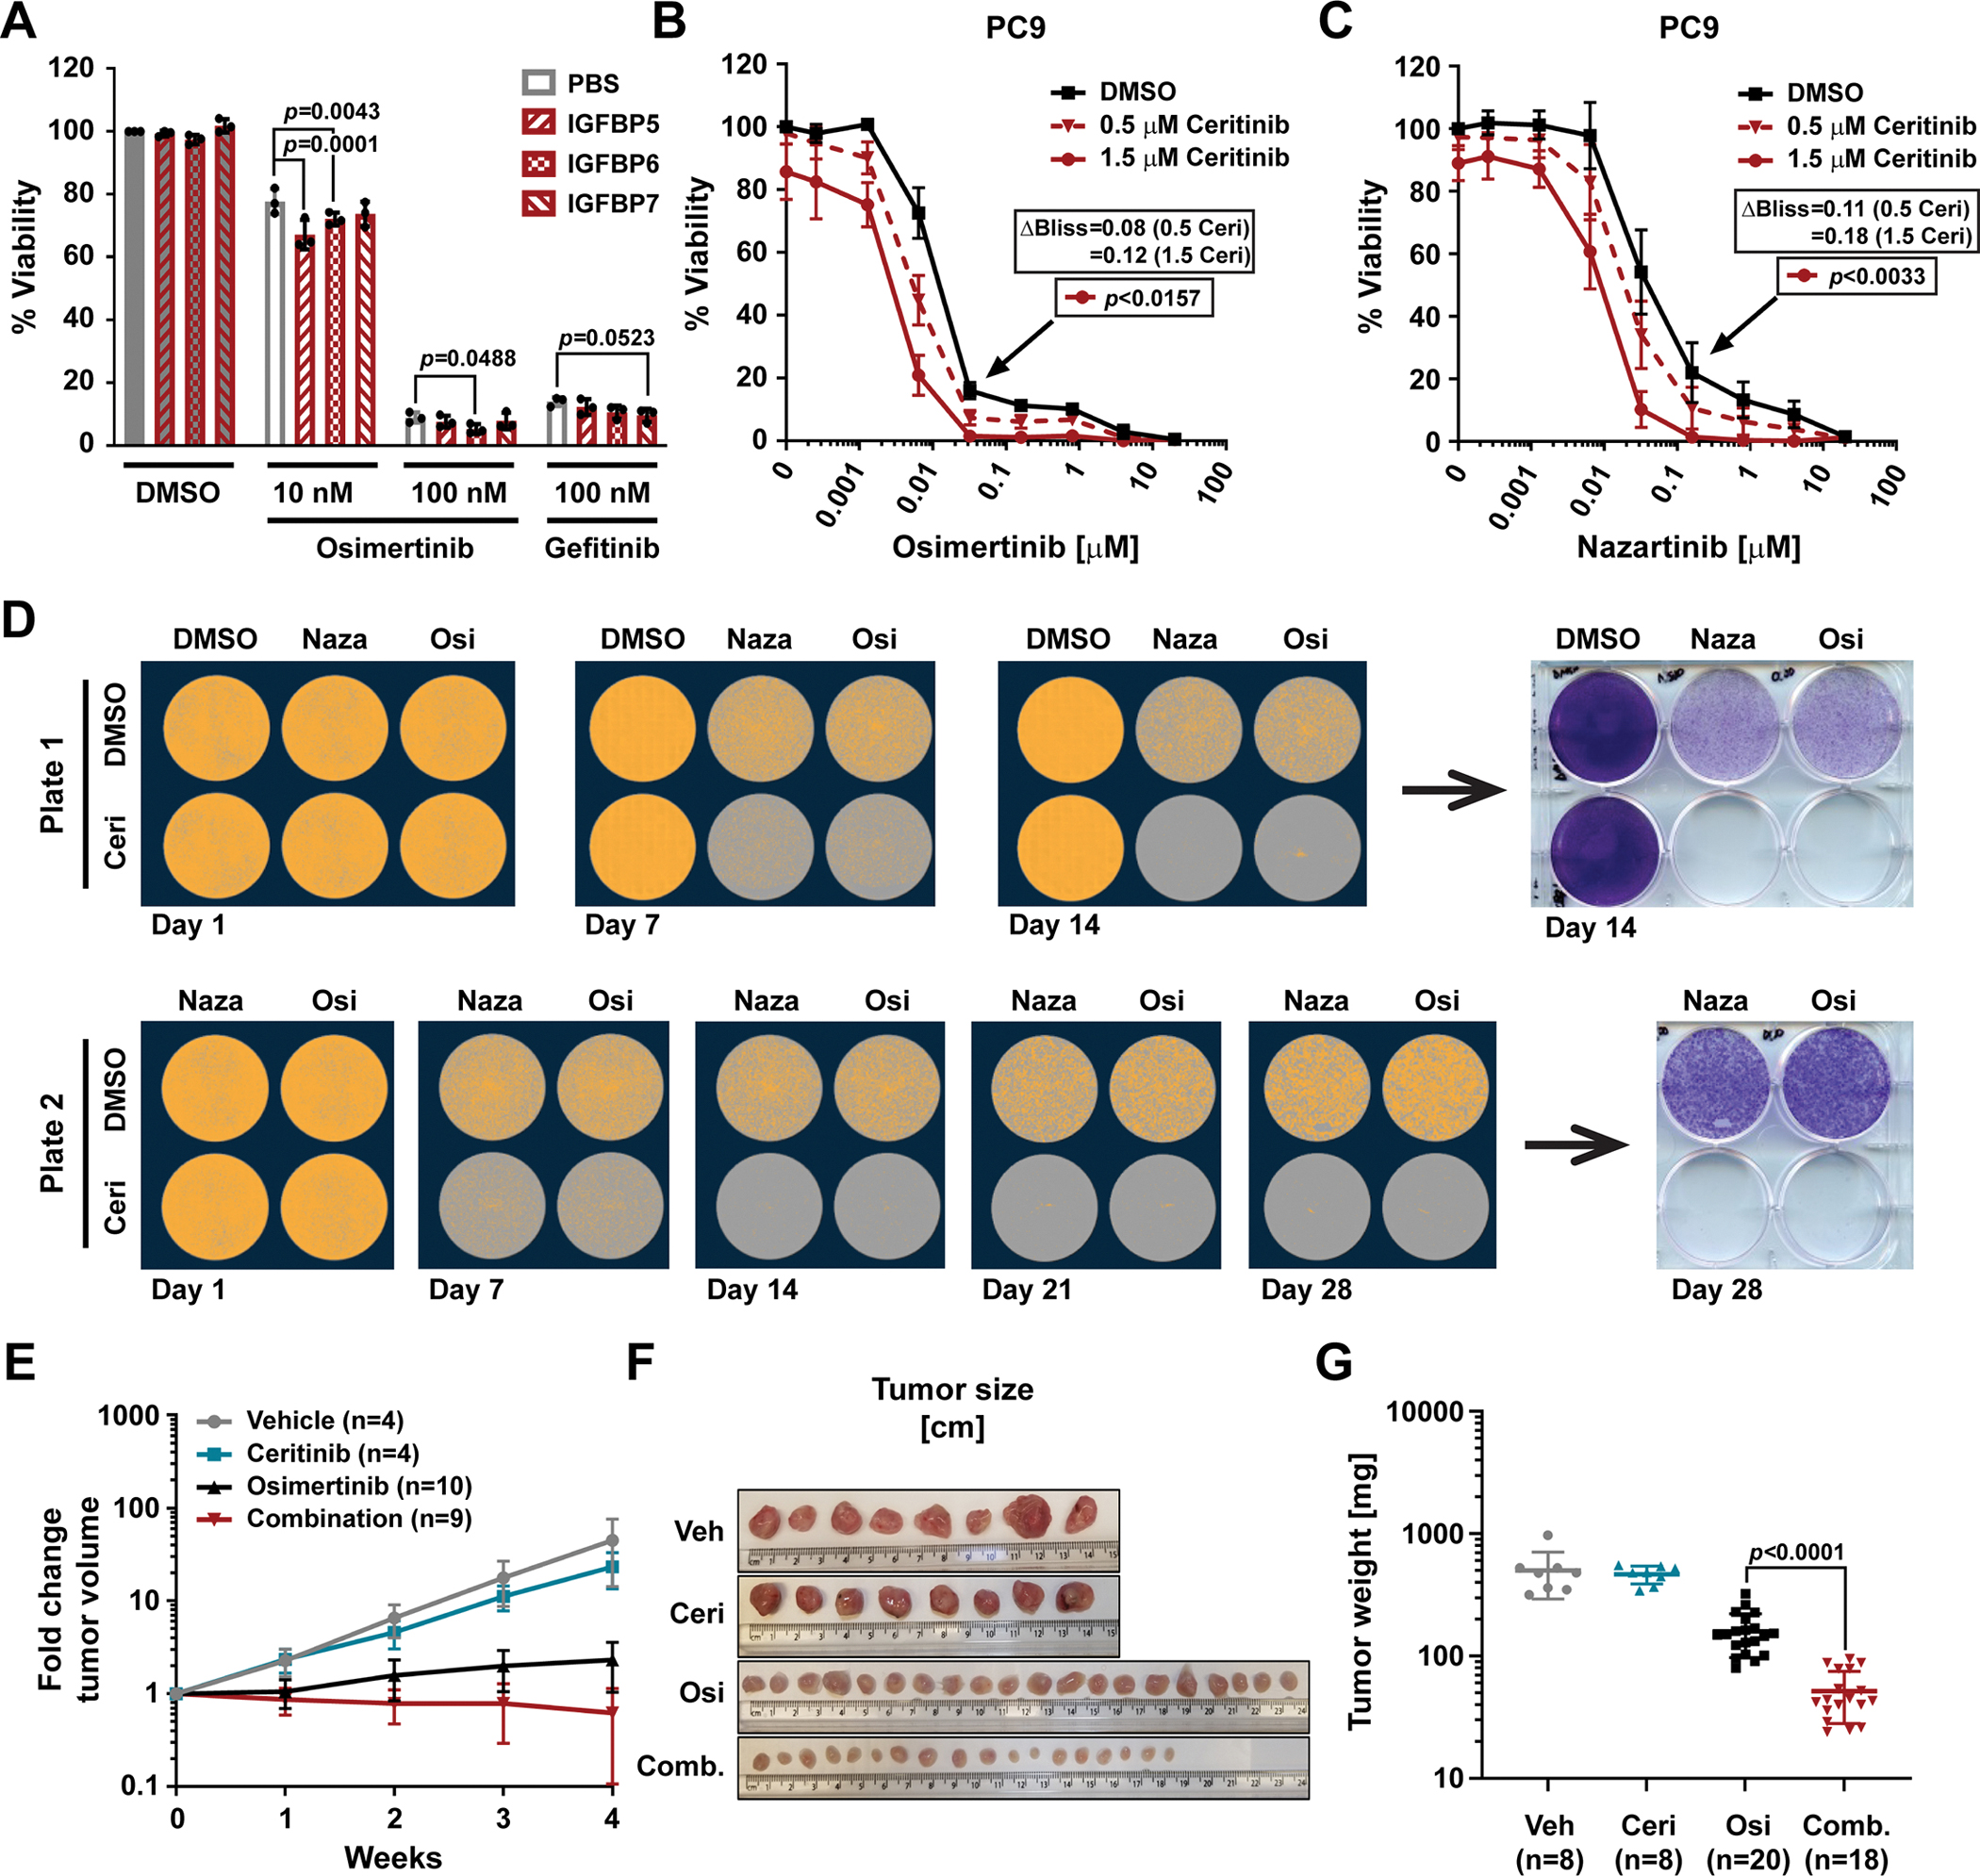
(A) Viability as determined by CTG of PC9 cells plated in RPMI10 containing 10 μg/mL rhIGFBP5, rhIGFBP6 or rhIGFBP7 and treated 24 hours later with osimertinib or gefitinib at the indicated doses for 72 hours. 100% viability was set to total luminescence in DMSO-treated cells plated in RPMI10 containing PBS. Technical replicates within each experiment were averaged before determining the mean ± SD, and significance across all biological replicates (n=3), determined by unpaired t test with single pooled variance. (B and C) Viability as determined by CTG of PC9 cells plated in RPMI10 and treated 24 hours later with osimertinib (B; n=4 experiments) or nazartinib (C; n=3) in combination with DMSO or the stated concentrations of ceritinib for 72 hours. 100% viability was set to total luminescence in DMSO-only treated cells. Data are mean ± SD of at least three biological replicates performed as technical triplicates. Significance determined by unpaired t test with single pooled variance and Holm-Sidak’s multiple comparison test for (B) and (C). Black arrows mark the specific concentration of the respective control curve (in black) compared in each experiment. (D) Clonogenic assay of PC9 cells (0.5×10⁶ cells plated per well) treated with nazartinib (Naza; 500 nM), osimertinib (Osi; 100 nM), and/or ceritinib (Ceri; 1 μM) at day 1 and every 3 to 4 days thereafter for 14 days (Plate 1) or 28 days (Plate 2). Representative images of confluence (orange mask) as determined by live-cell imaging microscopy (quantification in fig. S7B) and crystal violet staining at days 14 and 28 (quantification in fig. S7C). n=4 experiments. (E and F) Tumor volume fold change (E) and width (F) of PC9 mouse xenografts treated with vehicle control (Veh.; 0.5% methyl cellulose/0.5% Tween 80), osimertinib (Osi; 2 mg/kg), ceritinib (Ceri; 25 mg/kg) or the combination of both (Comb.). Data in (E) are mean ± SD of the given number of mice (n). (G) Scatter plot of tumor weight with mean ± SD. n=number of tumors. Significance was determined by two-tailed, unpaired, non-parametric Mann Whitney test.
EGFR-mutant NSCLC cells simultaneously harbor multiple mechanisms of TKI resistance
Considering that targeting of IGF1R and FAK signaling enhanced osimertinib efficacy in gefitinib-resistant EGFR-mutant PC9GR lung cancer cells, which as their dominant mechanism of resistance feature the EGFR gatekeeper mutation, this suggested that multiple adaptive signaling and genetic mechanisms can cooperate to mediate overall drug resistance in these cells. To further explore this concept, we evaluated the effects of IGFBPs on EGFR-mutant cell lines, which have developed resistance to EGFR TKIs through other primary mechanisms than the EGFR gatekeeper. Notably, rhIGFBPs also increased osimertinib sensitivity of two osimertinib-resistant cell lines, namely, HCC827AZR, which has undergone EMT as shown by increased expression of N-cadherin and vimentin, and PC9AZR, which has an unknown mechanism of resistance (Fig. 7, A and B, and figs. S8A and S12). This suggests that IGF1R and/or FAK signaling is contributing to some extent also to resistance to third-generation EGFR TKIs. Similarly, A431GR epidermoid skin carcinoma cells that express high levels of EGFR and are reportedly resistant to gefitinib due to loss of IGFBP3 expression are sensitive to combined EGFR TKI and IGFBP treatment (fig. S8B) (26), but addition of HGF led to significant osimertinib resistance in these cells. The EGFR-mutant lung cancer cell line HCC827ER4 exhibits resistance to erlotinib due to MET amplification, the expression of which we confirmed by Western blot (fig. S8A) (33). Indeed, these cells showed sensitivity to the combination of osimertinib with the ALK/MET inhibitor crizotinib (Fig. 7, C and D). In addition, treatment of HCC827ER4 cells with osimertinib and crizotinib in the presence of IGFBPs led to significant inhibition of viability over osimertinib when combined only with crizotinib (Fig. 7C). Consistently, treatment with either an IGF1R TKI (linsitinib or ceritinib), crizotinib, or combinations thereof led to reduced viability compared to osimertinib alone (Fig. 7D). Osimertinib in combination with crizotinib was more potent than osimertinib combined with either of the IGF1R inhibitors, which is in line with MET amplification being the main resistance mechanism in these cells. However, the triple combination was yet more potent than the dual MET/EGFR TKI combination, indicating that IGF1R signaling also contributes to drug resistance in these cells. Collectively, these data show that even in the presence of dominant resistance mechanisms, such as cancer cell-intrinsic gatekeeper mutations and MET amplification, additional, less obvious or less strong mechanisms, some of which are modulated by CAFs, can contribute to overall drug resistance (Fig. 7E).
Fig. 7. Multiple mechanisms of TKI resistance in EGFR-mutant NSCLC cells.
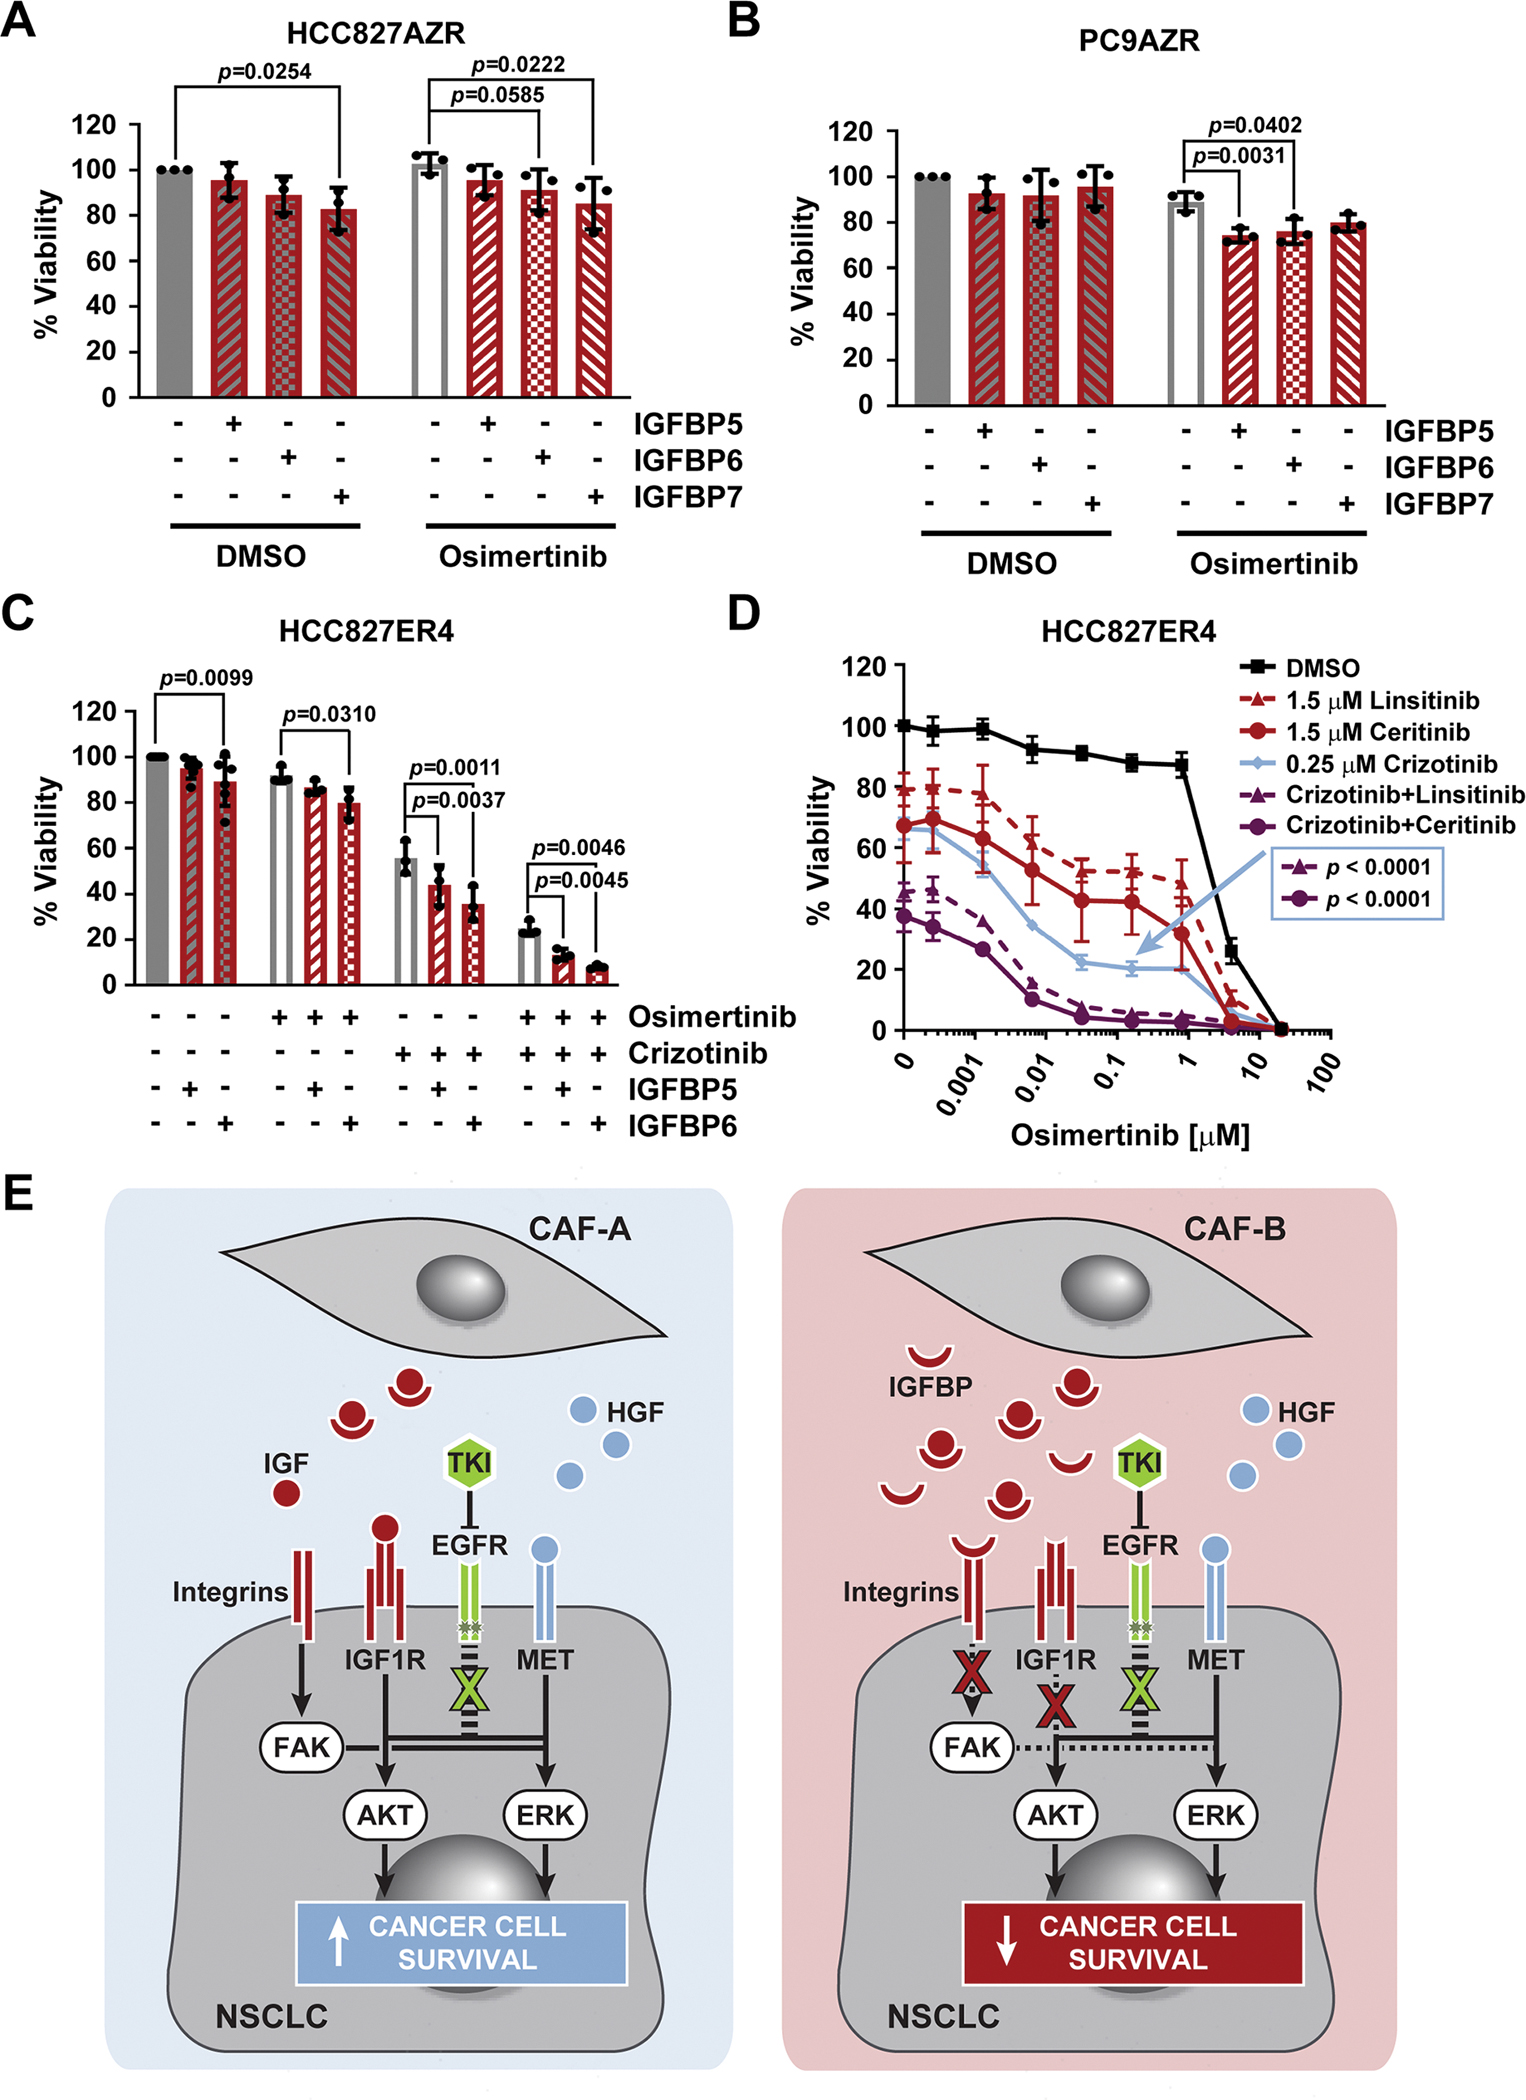
(A and B) Viability as determined by CTG of osimertinib-resistant HCC827AZR (A) or PC9AZR (B) cells plated in RPMI10 containing 10 μg/mL rhIGFBP5, rhIGFBP6, or rhIGFBP7 and treated 24 hours later with 100 nM osimertinib for 72 hours. n=3 experiments. (C) Viability as determined by CTG of erlotinib-resistant HCC827ER4 cells plated in RPMI10 containing 10 μg/mL rhIGFBP5 or rhIGFBP6 and treated 24 hours later with DMSO (n=6 experiments), 100 nM osimertinib, 250 nM crizotinib, or both (each n=3 experiments) for 72 hours. 100% viability was set to total luminescence in DMSO-treated cells plated in RPMI10 containing PBS as buffer control. Each experiment (n) was performed as technical triplicates, which were averaged before determining the mean ± SD and significance across all biological replicates, determined by unpaired t test with single pooled variance. (D) Viability as determined by CTG of HCC827ER4 cells plated in RPMI10 and treated 24 hours later with osimertinib in combination with DMSO or the stated concentrations of linsitinib, ceritinib, crizotinib, or a combinations thereof for 72 hours. 100% viability was set to total luminescence in DMSO-only treated cells. Data are mean ± SD of at least three biological replicates, each performed as technical triplicates. Significance of comparison of the triple-combination curves (purple) to the crizotinib curve (blue; concentration marked by the arrow), was determined by unpaired t test with single pooled variance and Holm-Sidak’s multiple comparison test. (E) Cartoon depicting the effects that different CAF subsets (generically labelled CAF-A and CAF-B) secreting varying relative amounts of pro- (HGF, IGF) and anti- (IGFBP) tumorigenic proteins may have on cancer cell survival upon TKI treatment.
DISCUSSION
CAFs constitute an important component of the tumor microenvironment, often implicated with metastasis and drug resistance (11, 13). However, several studies suggest substantial phenotypic and functional CAF heterogeneity (14, 22, 34, 35). Accordingly, some CAFs can also sensitize cancer cells to anticancer drugs (23, 24, 36–38). In NSCLC, CAFs are implicated with enhanced stemness, migration and tumor growth of KRAS-mutant cells and resistance of EGFR-mutant cells to first-generation EGFR TKIs (39–43), the latter being associated with specific CAFs expressing high levels of podoplanin (42). In contrast, CAFs that express CD200 sensitize EGFR-mutant NSCLC cells to TKIs and indicate longer progression-free survival (37). In this study, we similarly found that lung CAFs caused drug resistance in KRAS-mutant NSCLC cells. However, we also observed that these CAFs enhanced drug efficacy in other NSCLC cells such as EGFR-mutant PC9 and PC9GR cells. These divergent effects were caused by the very same CAFs, suggesting that the ability of certain, although probably not all, CAFs to cause either drug resistance or sensitization not only depended on the CAF subtype, but also on the specific signaling network context of the recipient cancer cell. Furthermore, the observation that these CAFs sensitized PC9 cells to the EGFR inhibitor gefitinib, but not the multitargeted SRC/ABL inhibitor dasatinib, indicated that this was additionally dependent on the chosen drug and the cancer cell vulnerability targeted by that drug. This is likely due to diverse adaptive signaling mechanisms that are utilized by the cells to compensate for the different drug challenges, each of which can be differentially affected by CAFs. The CAFs in our study expressed high levels of IL-6, CCL2, and—notably—IGFBP5, similar to lung CAFs (named “induced” or “iCAFs”) that promote growth of KRAS-mutant NSCLC cells (40). In addition, gene expression analysis showed that our CAFs were negative for podoplanin, consistent with them not causing gefitinib resistance in PC9 cells (42). However, our CAFs were also negative for CD200 (37) but expressed substantial levels of HGF, which has been shown to cause EGFR TKI resistance (41). This suggested that additional, so far unknown factors were overriding the HGF-mediated rescue signal in these cells.
Unbiased interrogation of the proteome and transcriptome of CAF-secreted factors and their effects on the cancer cell signaling network elucidated the underlying mechanism of drug sensitization in specific EGFR-mutant lung cancer cells, which involved not a single, but multiple CAF proteins that together impinged on IGF1R and FAK signaling. These pathways are implicated in adaptive drug resistance in various cancers (44–49), including different lung cancer subtypes (50), such as EGFR-, EML4-ALK- or DDR2-positive NSCLC (16, 26, 51–54). Specifically, we found that compared to NAFs, which did not cause drug sensitization, these CAFs secreted lower levels of the growth factors IGF1 and IGF2, which stimulate IGF1R signaling, whereas they expressed a greater amount of several IGFBPs, particularly IGFBP5 and IGFBP6, which attenuate IGF1/2 signaling (55–57). Notably, IGFBP5 inhibits IGF1R signaling also in small cell lung cancer (58, 59). Furthermore, IGFBPs interact with integrins and decrease FAK signaling (28–30). Cumulatively, this divergent expression of IGFs and IGFBPs by CAFs led to potent abrogation of IGF1R- and FAK-mediated adaptive survival signaling of lung cancer cells in response to EGFR TKIs and enhanced osimertinib efficacy (Fig. 7E). It is possible that additional proteins, such as adhesion molecules, decorin, which reduces IGF1R and EGFR signaling (60, 61), or meflin, which suppresses pancreatic cancer cell growth and which was expressed at low levels also by lung CAFs (38), further contributed to the overall drug sensitization effect. The role of IGFBP5 in this context is also in strong agreement with low levels of IGFBP5 associating with disease recurrence and poor progression-free survival in lung cancer (62). Conversely, high levels of the IGF1R adaptor protein IRS2 are prognostic for poor patient outcomes in aggressive NSCLC (63). Although most fibroblasts express IGFBPs, there may exist specific thresholds that could be utilized as biomarkers. IGFBPs can be detected in blood by ELISA, Luminex, or proteomics and in tumor tissue by transcriptomics or immunohistochemistry (59, 62, 64, 65). However, determining IGFBP expression alone may not be sufficient, as it also depends on the oncogenic signaling network within cancer cells; that is, if IGFBP-mediated sensitization outweighs the effects of other, pro-tumorigenic proteins that are concurrently secreted by CAFs (Fig. 7E).
IGF1R signaling is also implicated in maintaining survival of EGFR-mutant, drug-tolerant persister NSCLC cells upon treatment with the first-generation EGFR TKIs erlotinib or gefitinib (10). Consistent with our observation, ceritinib, an FDA-approved ALK TKI that also potently inhibits IGF1R and FAK (31, 32), strongly synergized with the third-generation EGFR TKI osimertinib to inhibit short-term and long-term cell survival of EGFR-mutant PC9 NSCLC cells and prevent cancer cell re-growth after initial drug challenge. Notably, some features of the persister state may be retained even after subsequent acquisition of genetic mechanisms of resistance (8). This finding is in agreement with our observation that NSCLC cells that have developed TKI resistance through either acquisition of the EGFR T790M gatekeeper mutation, MET gene amplification, or through EMT, which is known to involve IGF2-IGF1R signaling (66), still displayed partial or residual sensitivity to IGF1R inhibition. Thus, combined targeting of primary, often genetic resistance mechanisms together with targeting the adaptive survival signaling (such as that mediated by IGF1R) led to pronounced synergy in some cells. This also indicated that multiple resistance mechanisms can co-exist in the same cancer cell, not just in different cancer cell clones within a tumor, which is consistent with the observation that resistance can evolve gradually (67). In addition, co-occurring gatekeeper mutations in EGFR and amplification of MET or ERBB2 in patients with EGFR-mutant NSCLC have been described (68, 69).
In summary, we here describe a mechanism of paracrine drug sensitization of lung cancer cells by specific lung CAFs through—compared to normal fibroblasts—divergent secretion of several pro- and anti-tumor proteins, such as IGF1/2 and IGFBPs, respectively. Cumulatively, this led to pronounced inhibition of compensatory IGF1R and FAK signaling in response to EGFR TKIs and thus improved EGFR inhibitor efficacy. We also found that different NSCLC cells responded in distinctive ways and that the same CAFs could cause both drug resistance and drug sensitivity in a context-dependent manner suggesting a functional balance between pro- and anti-tumor components not just within the complex stroma in general, but also depending on the specific signaling vulnerabilities and adaptations of the recipient cancer cells, which can harbor multiple resistance mechanisms at the same time. These results highlighted tumor suppressive effects competing with otherwise tumor promoting effects of CAFs and add to the growing evidence that eliminating CAFs in an undifferentiated way may be detrimental to cancer therapy. Rather, we show that mechanistic understanding not just of CAF-mediated resistance, but also of their tumor suppressive pathways, can lead to rational design of improved therapeutic approaches that mimic these effects and may delay the onset of drug resistance.
MATERIALS AND METHODS
Cell culture and reagents
A549, PC9, PC9GR, H3122, H2228, STE1, H1975, A431, A431GR, HCC827ER4 and WI38 VA13 subline 2RA (WI38V; human lung fibroblast, SV40-transformed) cells were obtained from the Moffitt Lung Cancer Center of Excellence Cell Line Core. HCC827 (CRL-2868) cells were purchased from ATCC. PC9AZR were generated as described previously (51). The normal lung-associated fibroblast (NAF) cell lines MRC5 (CCL-171), WI38 (CCL-75) and IMR-90 (CCL-186), as well as the bone marrow fibroblast cell line HS-5 (CRL-11882) were purchased from ATCC. Frozen aliquots of lung cancer-associated fibroblasts (CAF7, CAF12, CAF10), generated with patient consent as previously described (70), were thawed, expanded and refrozen at low passage to have ample cells for completing the project. Cells were cultured in RPMI 1640 media containing 10% FBS (Fetal bovine serum, RPMI10) at 37°C and 5% CO2. All cell lines tested negative for mycoplasma contamination and have been authenticated by short tandem repeat (STR) analysis. Nuclear mKate2-labeled cells were made according to the manufacturer’s directions with the following modifications: IncuCyte NucLight Red Lentivirus Reagent (Essen BioScience, #4476) was added to the cells at an MOI of 1.5 TU/cell in the presence of 4 μg/mL polybrene (Millipore, #TR-1003-G). Virus was removed after 48 hours and the cells were allowed to recover 24 hours in fresh media before the addition of puromycin (Invivogen, #ant-pr) to select stably transduced cells.
To generate conditioned media (CM) for viability assays, phosphoproteomics and cytokine analysis, fibroblasts were plated in RPMI10 at 0.8×10⁶ cells in a 15 cm dish and allowed to grow for 4 days (~60–70% confluence). The serum-containing RPMI was then collected, clarified by centrifugation (10 min at 1000 g), aliquoted and stored frozen at −80°C until needed.
AZD8330, trametinib, crizotinib, osimertinib, linsitinib, ceritinib, and defactinib were purchased from Chemietek. Dasatinib and afatinib were from LC Labs. Gefitinib, GSK1838705A, and nazartinib were from SelleckChem. All drugs were dissolved in DMSO (10 mM), aliquoted and stored at −20°C. Growth factors IGF1, IGF2, and HGF (Peprotech; #AF100–11, #AF100–12 and #100–39H, respectively) were reconstituted at 100 μg/mL in sterile 0.1% BSA/PBS, aliquoted and stored at −80°C. Recombinant human (rh) IGFBP5, IGFBP6 and IGFBP7 (R&D Systems, #875-B5, #876-B6, #1334-B7, respectively) were reconstituted at 100 μg/mL in sterile PBS, aliquoted and stored at −80°C.
Derivation of osimertinib-resistant HCC827 (HCC827AZR) cell line
To create resistant lines, drug sensitive “parental” HCC827 cells were cultured with increasing concentrations of osimertinib, starting at the IC30. At 80–90% confluence, cells were trypsinized and divided into two tubes. Half were frozen and the rest were reseeded into a new dish at a 20 to 30% higher dose of osimertinib. Fresh drug was added every 72 to 96 hours.
Cell viability
Cell viability assays were conducted using the following techniques: For short term assays, cells were seeded in RPMI10 in a 384-well microtiter plate (Corning, #3764) and treated after 24 hours. Drugs were diluted in RPMI10 and added to the cells at the indicated concentrations. Following 72 hours drug treatment, CellTiter-Glo (CTG) reagent was added according to the manufacturer’s instructions for the CTG Luminescent Cell Viability Assay (Promega, #G7573) and the resulting luminescence was read on an M5 Spectramax plate reader (SoftMaxPro Software 6.2.1, Molecular Devices). Cell viability was determined relative to DMSO treated cells. For cell viability assays in conditioned media, the cells were plated in a 1:1 mixture of normal growth media (RPMI10) and CM. Cell viability in co-culture was determined using the IncuCyte ZOOM live-cell analysis system (Software versions 2016A/B, Essen BioScience). Fluorescently nuclear-labeled NSCLC cells were plated with unlabeled fibroblasts in either a 1:1 or 1:2 ratio (500:500, 500:1000, or 1000:1000 cells), as indicated. For mono-culture controls, labeled NSCLC cells were plated to match their cell number in co-culture (500 or 1000 cells, respectively). Following 72 hours drug treatment, cell viability was measured as the red object count (red-labeled NSCLC nuclei) per well relative to the DMSO treated mono-culture wells. Long term cell viability assays were quantified using crystal violet staining. Cells were plated in 6-well dishes and treated after 24 hours with the indicated drug concentrations. For low density plated cells, drug was added once and then the plates were incubated for 10 to 14 days. For high density plated cells, drug was replenished in fresh RPMI10 every 3 to 4 days for the duration of the assay out to 28 days. At the end of the incubation, the cells were washed once with ice cold PBS, fixed for 10 min on ice with ice cold methanol, and then incubated while rocking for 30 min at room temperature (RT) in diluted crystal violet solution (Sigma, #HT90132; 1:10 in PBS). Following extensive rinsing with water to remove excess dye, the plates were dried overnight and then scanned on a flat-bed scanner. To quantify the stained cells, RT methanol was added to each well, the plate was rocked for 30 to 60 min at RT, and then the extracted crystal violet was measured by reading absorbance at 540 nm on an M5 Spectramax plate reader (Molecular Devices). For spheroid assays, PC9 cells were plated at 6,400 cells per well in 96-well ultra-low attachment (ULA) plates (Sigma, #CLS4520), centrifuged 200 × g for 10 min and allowed to form spheroids over 72 hours. Cells were then drug treated and incubated for an additional 72 hours before addition of CellTiter-Glo 3D Cell Viability Assay reagent (Promega, #G9682) and processed as described above. Raw data were analyzed using GraphPad Prism 7. One unpaired t-test per row was determined without (except for dose-response curves) correction for multiple comparisons, alpha=0.05% and assuming all rows are sampled from populations with the same scatter. Drug combination effects were evaluated using the Bliss method.
Western blot analyses
Cells were lysed using a 0.2% NP-40, 50 mM Tris pH 7.5, 5% glycerol, 1.5 mM MgCl2, 100 mM NaCl lysis buffer containing phosphatase (Sigma, #P5726) and protease (Roche, #11873580001) inhibitors. Proteins were resolved on SDS-PAGE gels, transferred to activated PVDF membranes using the BioRad TransBlot Turbo system and incubated with primary antibodies. Antibodies were from Abcam: α-SMA (ab32575, RRID:AB_722538, 1:1,000); from BD Pharmingen: vimentin (550513, RRID:AB_393716, 1:1,000); from Cell Signaling Technology: E-cadherin (3195, RRID:AB_2291471, 1:1,000), p-EGFR Tyr1068 (aka Tyr1092) (2234, RRID:AB_331701, 1:1,000), EGFR (4267, RRID:AB_2246311, 1:1,000), p-AKT Ser473 (9271, RRID:AB_329825, 1:500), p-AKT Thr308 (13038, RRID:AB_2629447, 1:1,000), AKT (9272, RRID:AB_329827, 1:1,000), p-p44/42 MAPK (ERK1/2) Thr202/Tyr204 (4370, RRID:AB_2315112, 1:2,000), p-IGF1R β Tyr1131/InsR β Tyr1146 (3021, RRID:AB_331578, 1:500), IGF1R β (9750, RRID:AB_10950969, 1:1,000), p-FAK Tyr397 (8556, RRID:AB_10891442, 1:1000), FAK (13009, RRID:AB_2798086, 1:1000), PARP1 (9542, RRID:AB_2160739, 1:1,000), cleaved caspase-3 (9661, RRID:AB_2341188, 1:1,000), and α-tubulin (2125, RRID:AB_2619646, 1:1,000); from R&D Systems: IGFBP5 (AF875, RRID:AB_355678, 1:2,000), IGFBP6 (AF876, RRID:AB_355679, 1:2,000), and IGFBP7 (AF1334, RRID:AB_2264436, 1:400); from Sigma-Aldrich: β-Actin (A5441, RRID:AB_476744, 1:15,000) and MAPK (ERK1/2) (M5670, RRID:AB_477216, 1:10,000); and from ThermoFisher: pan-cytokeratin (MA5–12231, RRID:AB_10980711, 1:50). Secondary IgG antibodies were HRP-conjugated anti-goat (R&D Systems, HAF109, RRID:AB_357236), anti-mouse (GE Healthcare, NA931, RRID:AB_772210) or anti-rabbit (GE Healthcare, NA934, RRID:AB_772206). Following the addition of HRP-detection reagent (Clarity (BioRad, #1705061), VisiGlo Select (VWR, #89424–018) or SuperSignal West Femto (ThermoScientific, #34095), the membranes were imaged on an Odyssey Fc LI-COR Dual-Mode Imaging System. Images were visualized and, where indicated, quantified using LI-COR’s Image Studio Lite (Ver 5.2) software.
Flow cytometry
To quantify fibroblast activation protein (FAP)-α expression, adhered cells were detached in the presence of Accutase cell detachment solution (Innovative Cell Technologies, #AT104), centrifuged (500 g/5 min) and rinsed and resuspended with BD Pharmingen Stain Buffer (FBS) (#554656). FAP-α-positive cells were detected with FAP-α PE-conjugated antibody (R&D Systems, #FAB3715P) in the presence of DAPI as a viability dye. Cells were analyzed using a LSRII SORP (BD Biosciences) with DIVA software. The data were analyzed with FlowJo (v9.9.3/4.; BD Biosciences)
Gene expression analysis
For RNA extraction, each cell line was grown in a 10 cm dish to 80–90% confluence. RNA was extracted from cell pellets using the Qiagen RNeasy Mini Kit (#74106) according to the manufacturer’s protocol and RNA quality was assessed on the Agilent TapeStation RNA ScreenTape. One hundred nanograms of total RNA was amplified and labeled with biotin using the Ambion Message Amp Premier RNA Amplification Kit (ThermoFisher) following the manufacturer’s protocol and as described elsewhere (71). Hybridization, staining, and scanning of the chips followed the procedure outlined in the Affymetrix technical manual, as previously described(72). The Human Genome U133 Plus 2.0 Arrays used contain over 54,000 probe sets representing over 47,000 transcripts. The array output files were visually inspected for hybridization artifacts and then analyzed using Affymetrix Expression Console v 1.4 with the MAS 5.0 algorithm, scaling probe sets to an average intensity of 500. Lysates for each cell line were collected from three sequential early passages of the respective cells.
CEL files were normalized against the median sample (MRC5_2) using IRON. 54,675 probes were reported across 9 cell lines. Two-group comparisons used the following criteria for filtering to determine a “Score” for significance: Probe set must not be anti-sense to the annotated gene, max of the two averages must be > 5, log2 ratio ≥ ~0.585 [log2(1.5-fold)], t-test p value < 0.05 (two-tailed, two-sample unequal variance) and Hellinger distance > 0.25. Fibroblast versus NSCLC (CAF + NAF vs. NSCLC) required additional filtering to avoid being led astray by large differences between CAFs and NAFs, since we were looking for genes that are differentially expressed in both CAF and NAF vs. NSCLC. Therefore, the following filters were set: pass CAF + NAF vs. NSCLC filter, pass CAF vs. NSCLC filter and sign of CAF vs. NSCLC agrees with sign of NAF vs. NSCLC. To select differential probes, “unknown” probes, as well as probes not passing the “Score” criteria for each respective comparison were removed. Heatmaps were created using Heatmapper (73). Values were scaled across rows and clustering was performed across rows and columns using complete linkage and the Pearson distance measuring method. Genes that were significantly increased or decreased between CAF7 and CAF12 versus MRC5 were selected for DAVID pathway analysis (74). The DAVID “UP_KEYWORDS – SECRETED” term was used to determine secreted proteins.
Cytokine array
The RayBio C-Series Human Cytokine Antibody Array C5 (RayBiotech, #AAH-CYT-5–4,) was used to determine relative levels of secreted cytokines in fibroblast conditioned media and was performed according to manufacturer’s instructions. Briefly, after blocking the membrane for 30 min at RT, 1 mL of undiluted CM was added to each respective membrane and allowed to incubate for 5 hours at RT. The membranes were then washed before incubating with Biotinylated Antibody Cocktail overnight at 4°C. A second wash was performed and then the membranes were incubated with HRP-Streptavidin for 2 hours at RT. Following the final wash step, HRP-Detection reagent (either provided by the kit or a more sensitive HRP-reagent, such as VisiGlo Select (VWR) or SuperSignal West Femto (ThermoScientific)) was added and the membranes were imaged on an Odyssey Fc LI-COR Dual-Mode Imaging System. Images were quantified using LI-COR’s Image Studio Lite (Ver 5.2) software. The Cytokine Array was performed in duplicate.
Secretomics LC-MS/MS
To generate serum-free conditioned media (SFCM) for secretomics analysis, fibroblasts were plated in RPMI10 at 0.8 × 10⁶ cells in a 15 cm dish and allowed to grow for 4 days (~60 to 70% confluence). The serum-containing RPMI10 was aspirated and the plates were rinsed with PBS and then incubated with serum-free RPMI (SF-RPMI) for 20 min at 37°C and 5% CO2 to allow serum-derived proteins to detach from the cells and plate surface. Following aspiration and a further quick rinse with SF-RPMI, 18 mL SF-RPMI was added to the plate and the cells were incubated at 37°C and 5% CO2 for 48 hours. The SFCM was then collected, clarified by centrifugation (10 min, 1,000 × g) followed by filtration (0.45 μm; GE Healthcare Puradisc 25 AS, #6780–2504), aliquoted and stored at −80°C until needed. Samples were prepared as biological triplicates; 3 fibroblast types × 3 replicates = 9 samples.
SFCM was lyophilized and then re-dissolved in urea buffer (aqueous 8M urea, 20 mM HEPES (pH 8), 1 mM sodium orthovanadate, 2.5 mM sodium pyrophosphate and 1 mM β-glycerophosphate). A Bradford assay was carried out to determine the protein concentration. The proteins were reduced with 4.5 mM dithiothreitol (DTT) and alkylated with 10 mM iodoacetamide. Trypsin digestion was carried out at room temperature overnight, and tryptic peptides were then acidified with 1% trifluoroacetic acid (TFA) and desalted with C18 Sep-Pak cartridges according to the manufacturer’s procedure. After lyophilization, the peptides were re-dissolved in 400 μL of aqueous 20 mM ammonium formate (pH 10), which was used as peptide fractionation solvent A. To build a comprehensive peptide library, a portion from each sample was pooled and fractionated using a high pH reversed phase separation on an XBridge 4.6 mm ID × 100 mm long column packed with BEH C18 resin (3.5 μm particle size, 130 Å pore size, Waters). The peptides were eluted as follows: 5% B (5 mM ammonium formate, 90% acetonitrile, pH 10) for 10 min, 5% - 15% B in 5 min, 15–40% B in 47 min, 40–100% B in 5 min and 100% B held for 10 min, followed by re-equilibration at 1% B. The flow rate was 0.6 mL/min and 12 concatenated fractions were collected. All final peptides (individual samples and the fractioned pool samples) were dried via SpeedVac and redissolved in 20 μL aqueous 2% acetonitrile with 0.1% formic acid spiked with Pierce peptide retention time calibration mixture (PRTC) standards (20 fmol total). For LC-MS/MS analysis, 5 μL was injected once for each pooled fraction (x12 runs) or in technical duplicates for the individual samples (9 samples × 2 runs = 18 runs).
A nanoflow ultra-high performance liquid chromatograph (RSLC; Dionex, Sunnyvale, CA) interfaced with an electrospray bench top orbitrap mass spectrometer (Q-Exactive Plus; Thermo, San Jose, CA) was used for tandem mass spectrometry peptide sequencing. The sample was first loaded onto a pre-column (100 μm ID × 2 cm packed with C18 reversed-phase resin, 5 μm particle size, 100 Å pore size) and washed for 8 min with aqueous 2% acetonitrile and 0.04% trifluoroacetic acid. The trapped peptides were eluted onto the analytical column, (C18, 75 μm ID × 25 cm length, 2 μm particle size, 100 Å pore size; Dionex). The 90-min gradient was programmed as: 95% solvent A (aqueous 2% acetonitrile + 0.1% formic acid) for 8 min, solvent B (90% acetonitrile + 0.1% formic acid) from 5% to 38.5% in 60 min, then solvent B from 50% to 90% B in 7 min and held at 90% for 5 min, followed by solvent B from 90% to 5% in 1 min and re-equilibration for 10 min. The flow rate on the analytical column was 300 nL/min. Sixteen tandem mass spectra were collected in a data-dependent manner following each survey scan. MS/MS scans were performed using a 15-sec exclusion for previously sampled peptide peaks.
MaxQuant (75) with match between runs selected was used to quantify the intensities. Following iterative rank order normalization (IRON) (76), the resulting log2 iBAQ (intensity-based absolute quantification) values were converted back to their respective intensities (77, 78). Missing values, having been converted to 1, were then imputed to the minimum whole number intensity in each respective sample. From the total 2,632 proteins identified, three types of entries were deleted: those proteins that were detected only in the pool, non-human (for example, Bos taurus) proteins, and unnamed and/or contaminating proteins, resulting in a final 2,330 proteins (data file S1). Each iBAQ intensity was then divided by the sum of the iBAQ intensities for that run (x18 runs) resulting in a relative iBAQ (riBAQ) for each protein in each run. Technical replicates (2x MS injections) were averaged and the remaining values (x9) were subjected to the t-test (two-tailed, two-sample equal variance) comparing the 6x riBAQ values for CAF7 and CAF12 to the 3x riBAQ values for MRC5 to determine p-values for significant differences between proteins in CAF versus NAF SFCM. The biological replicates (6x or 3x) were then averaged into two single final values (riBAQave), which, as a measure of relative abundance for each protein in either the CAF or NAF SFCM samples, was used to determine protein ratios (CAF/NAF) between samples. Even though the relative ratio for some lesser expressed proteins may be larger, in absolute terms, selecting highly abundant proteins with a reasonable relative ratio accounts for more active molecules, which is likely to have a higher impact on cell viability. Therefore, we selected the top 2.5% (based on riBAQ values) of all identified proteins (2330 proteins total × 2.5% = 58 proteins). These proteins were subsequently subjected to DAVID pathway analysis(74). Because we observed not just the absence of resistance but actual sensitization, we focused on pathways and proteins with anticancer activity.
RNA Interference
CAF12 cells were transfected by reverse transfection using Lipofectamine RNAiMAX Transfection Reagent (Thermo Fisher Scientific, #13778150) according to the manufacturer’s instructions. In brief, 20 nM final concentration siRNA (Dharmacon, IGFBP5 ON-TARGETplus SMARTpool (#L-010897–00-0005), IGFBP6 ON-TARGETplus SMARTpool (L-006625–00-0005), individual IGFBP5 siRNAs (si-IGFBP5-8 and si-IGFBP5-10, #LQ-010897–00-0002) or the control non-targeting pool (si-NT, #D-001810–10-20)) were incubated for 20 minutes in a 6-well dish containing 5 μL Lipofectamine RNAiMAX in 500 μL Opti-MEM (Gibco, #31985062) media. Subsequently, 1.5 × 10⁵ CAF12 cells were added in 2 mL RPMI10 bringing the final volume to 2.5 mL. Following 24 hours at 37°C and 5% CO2, the media was exchanged for 3 mL fresh RPMI10. The resulting CM following siRNA-mediated gene silencing (siCM) was harvested at 96 hours and processed as described above. The cells were also collected to confirm knockdown efficiency by Western blot analysis.
Phosphoarray
PC9GR cells were plated in 1:1 RPMI10:CM overnight and then treated with DMSO or 500 nM osimertinib for 3 hours prior to harvesting. To collect the cells, the cells were rinsed twice with ice cold PBS and then scraped off the plate and collected in ice cold PBS. Cells were centrifuged at 500 × g for 10 min, the PBS was aspirated, and the cell pellet was immediately lysed according to the manufacturer’s instructions for the Proteome Profiler Human Phospho-RTK Array Kit (R&D Systems, ARY001B). A Bradford assay was carried out to determine the protein concentration. Continuing with the provided protocol, the membranes were blocked for 1 hour prior to addition of 250 μg protein diluted to 1.5 mL in array buffer followed by an overnight incubation at 4°C. The membranes were then washed before incubating with phospho-tyrosine HRP antibody for 2 hours at RT. A second wash was performed and then HRP reagent—either that provided by the kit or a more sensitive HRP-reagent, such as VisiGlo Select (VWR) or SuperSignal West Femto (ThermoScientific)—was added and the membranes were imaged on an Odyssey Fc LI-COR Dual-Mode Imaging System. Images were quantified using LI-COR’s Image Studio Lite (Ver 5.2) software. Data were normalized using the following equation: X(Ny) = X(y) * P1/P(y), where P1 is the mean signal density of positive control spots on the reference (MRC5) array, P(y) is the mean signal density of positive control spots on array “y” (CAF7 or CAF12), and X(Ny) is the normalized signal intensity for X(y) [spot “X” on array “y” (CAF7 or CAF12)]. The Phospho-RTK Array was performed in duplicate. Data were analyzed using GraphPad Prism 7.
Phosphoproteomics
For each condition, PC9GR cells were plated in ten 15 cm dishes at 7 × 10⁶ cells/dish in a 1:1 mixture of RPMI10 and (serum-containing) CM from CAF or NAF cells and allowed to adhere for 24 hours before a 3-hour treatment with 500 nM osimertinib or DMSO, as control. To collect the cells, the media was decanted, the cells rinsed twice with ice-cold PBS containing sodium vanadate and then scraped off the plate and collected in ice-cold PBS containing sodium vanadate. Cells were centrifuged at 500 × g for 10 min, the PBS was aspirated, and the cell pellet was shock-frozen in liquid nitrogen and stored at −80°C until further processing. Samples were prepared as biological triplicates. Cells were lysed in denaturing lysis buffer containing 8 M urea, 20 mM HEPES (pH 8), 1 mM sodium orthovanadate, 2.5 mM sodium pyrophosphate and 1 mM β-glycerophosphate. A Bradford assay was carried out to determine the protein concentration and samples were denatured, digested, and desalted as described above. Following lyophilization, the dried peptide pellet was re-dissolved in immunoaffinity purification buffer containing 50 mM MOPS pH 7.2, 10 mM sodium phosphate and 50 mM sodium chloride. Phosphotyrosine-containing peptides were immunoprecipitated with immobilized anti-phosphotyrosine antibody p-Tyr-1000 (Cell Signaling Technology). After 2 hours incubation, the antibody beads were washed twice with IAP buffer, followed by 3 washes with H2O. The phosphotyrosine peptides were eluted twice with aqueous 0.15% TFA, and the volume was reduced to 20 μl via vacuum centrifugation prior to LC-MS/MS as described above. Samples were injected as technical duplicates resulting in 6 values (3 biological × 2 technical) per sample (24 total injections).
MaxQuant was used to quantify the intensities(75). 907 Tyr-phosphorylated peptides were identified with a PEP score less than 0.05. After log2 conversion of the peptide intensities, the technical replicates were averaged and peptides with 0 or 1 value only per treatment triplicate across all treatments were deleted resulting in 847 peptides corresponding to 484 proteins. The samples were subjected to the t-test (two-tailed, two-sample equal variance) comparing the 4 conditions (3 biological replicates each) to determine p-values for significant differences between them (for example, CAF CM + DMSO vs CAF CM + osimertinib, or CAF CM + DMSO vs NAF CM + DMSO, and so on). Biological triplicates were then averaged and the log2 ratio was determined between the samples. Data were analyzed using GraphPad Prism 7 and DAVID pathway analysis (74). Phosphopeptides were manually confirmed by extracted ion chromatograms.
Mouse xenografts
PC9 cells were subcutaneously injected into 4- to 6-week-old NOD-scid IL2Rgnull (NSG) recipient mice, produced from in-house breeding colony, with breeders purchased from Jackson Laboratories. Each animal received two contralateral injections, containing 106 tumor cells, suspended in 100 μL of 1:1 mix of RPMI/BME type 3 (R&D Systems). Three weeks after injections, animals were randomized into treatment and control groups, and subjected to daily oral gavage with 2 mg/kg osimertinib (ChemieTek, #CT-A9291), 25 mg/kg ceritinib (ChemieTek, #CT-LDK378), combination of the two drugs, or vehicle control (0.5% methyl cellulose/0.5% Tween 80). Tumor diameters, measured by electronic calipers, and animal weights were measured weekly. For tumor volume calculations, spherical shape of tumors was assumed. After four weeks of treatment, animals were euthanized, and tumors were weighted. The results were reproduced in two independent experiments, in both males and females. Xenograft studies were performed in accordance with the guidelines of the Institutional Animal Care and Use Committee (IACUC) of the H. Lee Moffitt Cancer Center. Animals were maintained under AAALAC-accredited specific pathogen-free housing vivarium and care and veterinary supervision following the standard guidelines for temperature and humidity, with 12-hour/12-hour light/dark cycle.
Supplementary Material
Acknowledgements:
We would like to thank Yi Liao (Moffitt Cancer Center) for his assistance with the 3D culture experiments. The current affiliation of A.T.B. is the University of Notre Dame, Indiana.
Funding:
This work was supported by the NIH/NCI R01 CA219347 (to U.R./E.B.H.), the Florida Department of Health Bankhead-Coley Cancer Research Program, award # 30–20450-9901 (to A.M.), NIH/NCI F99 CA212456 (to B.M.K.), Miles for Moffitt and the H. Lee Moffitt Cancer Center and Research Institute. We further wish to acknowledge the Moffitt Lung Cancer Center of Excellence and the Moffitt Proteomics & Metabolomics, Analytic Microscopy, Molecular Genomics, and Flow Cytometry Core Facilities, as well as the Biostatistics and Bioinformatics Shared Resource, which are supported in part by the National Cancer Institute (Award No. P30-CA076292) as a Cancer Center Support Grant. The Proteomics and Metabolomics Core is also supported by the Moffitt Foundation.
Footnotes
Competing interests: CML is a consultant/advisory board member for Pfizer, Novartis, AstraZeneca, Genoptix, Sequenom, Ariad, Takeda, Blueprints Medicine, Cepheid, Foundation Medicine, Roche, Achilles Therapeutics, Genentech, Syros, Amgen, EMD-Serono, and Eli Lilly and reports receiving commercial research grants from Xcovery, AstraZeneca, and Novartis. SJA reports other advisory/consulting activities with Bristol-Myers Squibb, Merck, Cellular Biomedicine Group (CBMG), AstraZeneca, Memgen, RAPT Therapeutics, Glympse Bio, Shoreline Biosciences, InterVenn Biosciences, Achilles Therapeutics, Celsius Therapeutics, Samyang Biopharma, Glaxo SmithKline, and Amgen during the conduct of the study, and the prior receipt of grants from Novartis. These COIs cover the years 2012 to present. All other authors declare that they have no competing financial interests.
Data and Materials Availability:
All transcriptomics data that support the findings of this study have been deposited in the NCBI’s Gene Expression Omnibus (GEO) (79) and are accessible through the GEO Series accession number GSE164750 (https://www.ncbi.nlm.nih.gov/geo/query/acc.cgi?acc=GSE164750). The mass spectrometry proteomics data have been deposited to the ProteomeXchange Consortium via the PRIDE (80) partner repository with the dataset identifiers PXD023626 and 10.6019/PXD023626 (secretome), and PXD023692 and 10.6019/PXD023692 (phosphotyrosine). All other data needed to evaluate the conclusions in the paper are present in the paper or the Supplementary Materials and are available from the corresponding author upon reasonable request.
References and Notes
- 1.Chin L, Andersen JN, Futreal PA, Cancer genomics: from discovery science to personalized medicine. Nat Med 17, 297–303 (2011). [DOI] [PubMed] [Google Scholar]
- 2.Bedard PL, Hyman DM, Davids MS, Siu LL, Small molecules, big impact: 20 years of targeted therapy in oncology. Lancet 395, 1078–1088 (2020). [DOI] [PubMed] [Google Scholar]
- 3.Jordan EJ et al. , Prospective Comprehensive Molecular Characterization of Lung Adenocarcinomas for Efficient Patient Matching to Approved and Emerging Therapies. Cancer Discov 7, 596–609 (2017). [DOI] [PMC free article] [PubMed] [Google Scholar]
- 4.Politi K, Herbst RS, Lung cancer in the era of precision medicine. Clin Cancer Res 21, 2213–2220 (2015). [DOI] [PMC free article] [PubMed] [Google Scholar]
- 5.Engelman JA, Settleman J, Acquired resistance to tyrosine kinase inhibitors during cancer therapy. Curr Opin Genet Dev 18, 73–79 (2008). [DOI] [PubMed] [Google Scholar]
- 6.Lovly CM, Shaw AT, Molecular pathways: resistance to kinase inhibitors and implications for therapeutic strategies. Clin Cancer Res 20, 2249–2256 (2014). [DOI] [PMC free article] [PubMed] [Google Scholar]
- 7.Rotow J, Bivona TG, Understanding and targeting resistance mechanisms in NSCLC. Nat Rev Cancer 17, 637–658 (2017). [DOI] [PubMed] [Google Scholar]
- 8.Hata AN et al. , Tumor cells can follow distinct evolutionary paths to become resistant to epidermal growth factor receptor inhibition. Nat Med 22, 262–269 (2016). [DOI] [PMC free article] [PubMed] [Google Scholar]
- 9.Ramirez M et al. , Diverse drug-resistance mechanisms can emerge from drug-tolerant cancer persister cells. Nat Commun 7, 10690 (2016). [DOI] [PMC free article] [PubMed] [Google Scholar]
- 10.Sharma SV et al. , A chromatin-mediated reversible drug-tolerant state in cancer cell subpopulations. Cell 141, 69–80 (2010). [DOI] [PMC free article] [PubMed] [Google Scholar]
- 11.Bhowmick NA, Neilson EG, Moses HL, Stromal fibroblasts in cancer initiation and progression. Nature 432, 332–337 (2004). [DOI] [PMC free article] [PubMed] [Google Scholar]
- 12.Fang H, Declerck YA, Targeting the tumor microenvironment: from understanding pathways to effective clinical trials. Cancer Res 73, 4965–4977 (2013). [DOI] [PMC free article] [PubMed] [Google Scholar]
- 13.Kalluri R, The biology and function of fibroblasts in cancer. Nat Rev Cancer 16, 582–598 (2016). [DOI] [PubMed] [Google Scholar]
- 14.Ohlund D, Elyada E, Tuveson D, Fibroblast heterogeneity in the cancer wound. J Exp Med 211, 1503–1523 (2014). [DOI] [PMC free article] [PubMed] [Google Scholar]
- 15.Ostman A, Augsten M, Cancer-associated fibroblasts and tumor growth--bystanders turning into key players. Curr Opin Genet Dev 19, 67–73 (2009). [DOI] [PubMed] [Google Scholar]
- 16.Bai Y et al. , Adaptive responses to dasatinib-treated lung squamous cell cancer cells harboring DDR2 mutations. Cancer Res 74, 7217–7228 (2014). [DOI] [PMC free article] [PubMed] [Google Scholar]
- 17.Harbinski F et al. , Rescue screens with secreted proteins reveal compensatory potential of receptor tyrosine kinases in driving cancer growth. Cancer discovery 2, 948–959 (2012). [DOI] [PubMed] [Google Scholar]
- 18.Straussman R et al. , Tumour micro-environment elicits innate resistance to RAF inhibitors through HGF secretion. Nature 487, 500–504 (2012). [DOI] [PMC free article] [PubMed] [Google Scholar]
- 19.Wilson TR et al. , Widespread potential for growth-factor-driven resistance to anticancer kinase inhibitors. Nature 487, 505–509 (2012). [DOI] [PMC free article] [PubMed] [Google Scholar]
- 20.Pietras K, Pahler J, Bergers G, Hanahan D, Functions of paracrine PDGF signaling in the proangiogenic tumor stroma revealed by pharmacological targeting. PLoS medicine 5, e19 (2008). [DOI] [PMC free article] [PubMed] [Google Scholar]
- 21.Kato M et al. , Heterogeneous cancer-associated fibroblast population potentiates neuroendocrine differentiation and castrate resistance in a CD105-dependent manner. Oncogene 38, 716–730 (2019). [DOI] [PMC free article] [PubMed] [Google Scholar]
- 22.Ohlund D et al. , Distinct populations of inflammatory fibroblasts and myofibroblasts in pancreatic cancer. J Exp Med 214, 579–596 (2017). [DOI] [PMC free article] [PubMed] [Google Scholar]
- 23.Landry BD et al. , Tumor-stroma interactions differentially alter drug sensitivity based on the origin of stromal cells. Mol Syst Biol 14, e8322 (2018). [DOI] [PMC free article] [PubMed] [Google Scholar]
- 24.McMillin DW et al. , Tumor cell-specific bioluminescence platform to identify stroma-induced changes to anticancer drug activity. Nature medicine 16, 483–489 (2010). [DOI] [PMC free article] [PubMed] [Google Scholar]
- 25.McMillin DW, Negri JM, Mitsiades CS, The role of tumour-stromal interactions in modifying drug response: challenges and opportunities. Nat Rev Drug Discov 12, 217–228 (2013). [DOI] [PubMed] [Google Scholar]
- 26.Guix M et al. , Acquired resistance to EGFR tyrosine kinase inhibitors in cancer cells is mediated by loss of IGF-binding proteins. J Clin Invest 118, 2609–2619 (2008). [DOI] [PMC free article] [PubMed] [Google Scholar]
- 27.Landis J, Shaw LM, Insulin receptor substrate 2-mediated phosphatidylinositol 3-kinase signaling selectively inhibits glycogen synthase kinase 3beta to regulate aerobic glycolysis. J Biol Chem 289, 18603–18613 (2014). [DOI] [PMC free article] [PubMed] [Google Scholar]
- 28.Jia Y et al. , Dysregulated DNA Methyltransferase 3A Upregulates IGFBP5 to Suppress Trophoblast Cell Migration and Invasion in Preeclampsia. Hypertension 69, 356–366 (2017). [DOI] [PubMed] [Google Scholar]
- 29.Perks CM, Newcomb PV, Norman MR, Holly JM, Effect of insulin-like growth factor binding protein-1 on integrin signalling and the induction of apoptosis in human breast cancer cells. J Mol Endocrinol 22, 141–150 (1999). [DOI] [PubMed] [Google Scholar]
- 30.Sureshbabu A et al. , IGFBP5 induces cell adhesion, increases cell survival and inhibits cell migration in MCF-7 human breast cancer cells. J Cell Sci 125, 1693–1705 (2012). [DOI] [PubMed] [Google Scholar]
- 31.Kuenzi BM et al. , Polypharmacology-based ceritinib repurposing using integrated functional proteomics. Nat Chem Biol 13, 1222–1231 (2017). [DOI] [PMC free article] [PubMed] [Google Scholar]
- 32.Marsilje TH et al. , Synthesis, structure-activity relationships, and in vivo efficacy of the novel potent and selective anaplastic lymphoma kinase (ALK) inhibitor 5-chloro-N2-(2-isopropoxy-5-methyl-4-(piperidin-4-yl)phenyl)-N4-(2-(isopropylsulf onyl)phenyl)pyrimidine-2,4-diamine (LDK378) currently in phase 1 and phase 2 clinical trials. J Med Chem 56, 5675–5690 (2013). [DOI] [PubMed] [Google Scholar]
- 33.Suda K et al. , Reciprocal and complementary role of MET amplification and EGFR T790M mutation in acquired resistance to kinase inhibitors in lung cancer. Clin Cancer Res 16, 5489–5498 (2010). [DOI] [PubMed] [Google Scholar]
- 34.Lambrechts D et al. , Phenotype molding of stromal cells in the lung tumor microenvironment. Nat Med 24, 1277–1289 (2018). [DOI] [PubMed] [Google Scholar]
- 35.Sahai E et al. , A framework for advancing our understanding of cancer-associated fibroblasts. Nat Rev Cancer 20, 174–186 (2020). [DOI] [PMC free article] [PubMed] [Google Scholar]
- 36.Bu L et al. , Biological heterogeneity and versatility of cancer-associated fibroblasts in the tumor microenvironment. Oncogene 38, 4887–4901 (2019). [DOI] [PubMed] [Google Scholar]
- 37.Ishibashi M et al. , CD200-positive cancer associated fibroblasts augment the sensitivity of Epidermal Growth Factor Receptor mutation-positive lung adenocarcinomas to EGFR Tyrosine kinase inhibitors. Sci Rep 7, 46662 (2017). [DOI] [PMC free article] [PubMed] [Google Scholar]
- 38.Mizutani Y et al. , Meflin-Positive Cancer-Associated Fibroblasts Inhibit Pancreatic Carcinogenesis. Cancer Res 79, 5367–5381 (2019). [DOI] [PubMed] [Google Scholar]
- 39.Chen WJ et al. , Cancer-associated fibroblasts regulate the plasticity of lung cancer stemness via paracrine signalling. Nat Commun 5, 3472 (2014). [DOI] [PubMed] [Google Scholar]
- 40.Vicent S et al. , Cross-species functional analysis of cancer-associated fibroblasts identifies a critical role for CLCF1 and IL-6 in non-small cell lung cancer in vivo. Cancer Res 72, 5744–5756 (2012). [DOI] [PMC free article] [PubMed] [Google Scholar]
- 41.Wang W et al. , Crosstalk to stromal fibroblasts induces resistance of lung cancer to epidermal growth factor receptor tyrosine kinase inhibitors. Clinical cancer research : an official journal of the American Association for Cancer Research 15, 6630–6638 (2009). [DOI] [PubMed] [Google Scholar]
- 42.Yoshida T et al. , Podoplanin-positive cancer-associated fibroblasts in the tumor microenvironment induce primary resistance to EGFR-TKIs in lung adenocarcinoma with EGFR mutation. Clin Cancer Res 21, 642–651 (2015). [DOI] [PubMed] [Google Scholar]
- 43.Zhong L et al. , Identification of secreted proteins that mediate cell-cell interactions in an in vitro model of the lung cancer microenvironment. Cancer Res 68, 7237–7245 (2008). [DOI] [PMC free article] [PubMed] [Google Scholar]
- 44.Halder J et al. , Focal adhesion kinase silencing augments docetaxel-mediated apoptosis in ovarian cancer cells. Clin Cancer Res 11, 8829–8836 (2005). [DOI] [PMC free article] [PubMed] [Google Scholar]
- 45.Hirata E et al. , Intravital imaging reveals how BRAF inhibition generates drug-tolerant microenvironments with high integrin beta1/FAK signaling. Cancer Cell 27, 574–588 (2015). [DOI] [PMC free article] [PubMed] [Google Scholar]
- 46.Ma Y et al. , InsR/IGF1R Pathway Mediates Resistance to EGFR Inhibitors in Glioblastoma. Clin Cancer Res 22, 1767–1776 (2016). [DOI] [PMC free article] [PubMed] [Google Scholar]
- 47.Muranen T et al. , Inhibition of PI3K/mTOR leads to adaptive resistance in matrix-attached cancer cells. Cancer Cell 21, 227–239 (2012). [DOI] [PMC free article] [PubMed] [Google Scholar]
- 48.Vaquero J et al. , The IGF2/IR/IGF1R Pathway in Tumor Cells and Myofibroblasts Mediates Resistance to EGFR Inhibition in Cholangiocarcinoma. Clin Cancer Res 24, 4282–4296 (2018). [DOI] [PubMed] [Google Scholar]
- 49.Zanella ER et al. , IGF2 is an actionable target that identifies a distinct subpopulation of colorectal cancer patients with marginal response to anti-EGFR therapies. Sci Transl Med 7, 272ra212 (2015). [DOI] [PubMed] [Google Scholar]
- 50.Dziadziuszko R, Camidge DR, Hirsch FR, The insulin-like growth factor pathway in lung cancer. J Thorac Oncol 3, 815–818 (2008). [DOI] [PubMed] [Google Scholar]
- 51.Ichihara E et al. , SFK/FAK Signaling Attenuates Osimertinib Efficacy in Both Drug-Sensitive and Drug-Resistant Models of EGFR-Mutant Lung Cancer. Cancer Res 77, 2990–3000 (2017). [DOI] [PMC free article] [PubMed] [Google Scholar]
- 52.Lovly CM et al. , Rationale for co-targeting IGF-1R and ALK in ALK fusion-positive lung cancer. Nat Med 20, 1027–1034 (2014). [DOI] [PMC free article] [PubMed] [Google Scholar]
- 53.Wang R et al. , Transient IGF-1R inhibition combined with osimertinib eradicates AXL-low expressing EGFR mutated lung cancer. Nat Commun 11, 4607 (2020). [DOI] [PMC free article] [PubMed] [Google Scholar]
- 54.Yoshida T et al. , Tyrosine phosphoproteomics identifies both codrivers and cotargeting strategies for T790M-related EGFR-TKI resistance in non-small cell lung cancer. Clin Cancer Res 20, 4059–4074 (2014). [DOI] [PMC free article] [PubMed] [Google Scholar]
- 55.Ding M, Bruick RK, Yu Y, Secreted IGFBP5 mediates mTORC1-dependent feedback inhibition of IGF-1 signalling. Nat Cell Biol 18, 319–327 (2016). [DOI] [PMC free article] [PubMed] [Google Scholar]
- 56.Oliva CR et al. , IGFBP6 controls the expansion of chemoresistant glioblastoma through paracrine IGF2/IGF-1R signaling. Cell Commun Signal 16, 61 (2018). [DOI] [PMC free article] [PubMed] [Google Scholar]
- 57.Wang J et al. , Insulin-like growth factor binding protein 5 (IGFBP5) functions as a tumor suppressor in human melanoma cells. Oncotarget 6, 20636–20649 (2015). [DOI] [PMC free article] [PubMed] [Google Scholar]
- 58.Huang YH et al. , POU2F3 is a master regulator of a tuft cell-like variant of small cell lung cancer. Genes Dev 32, 915–928 (2018). [DOI] [PMC free article] [PubMed] [Google Scholar]
- 59.Wang XD et al. , Subtype-specific secretomic characterization of pulmonary neuroendocrine tumor cells. Nat Commun 10, 3201 (2019). [DOI] [PMC free article] [PubMed] [Google Scholar]
- 60.Iozzo RV et al. , Decorin antagonizes IGF receptor I (IGF-IR) function by interfering with IGF-IR activity and attenuating downstream signaling. J Biol Chem 286, 34712–34721 (2011). [DOI] [PMC free article] [PubMed] [Google Scholar]
- 61.Zhu JX et al. , Decorin evokes protracted internalization and degradation of the epidermal growth factor receptor via caveolar endocytosis. J Biol Chem 280, 32468–32479 (2005). [DOI] [PubMed] [Google Scholar]
- 62.Shersher DD et al. , Biomarkers of the insulin-like growth factor pathway predict progression and outcome in lung cancer. Ann Thorac Surg 92, 1805–1811; discussion 1811 (2011). [DOI] [PubMed] [Google Scholar]
- 63.Piper AJ et al. , Insulin Receptor Substrate-1 (IRS-1) and IRS-2 expression levels are associated with prognosis in non-small cell lung cancer (NSCLC). PLoS One 14, e0220567 (2019). [DOI] [PMC free article] [PubMed] [Google Scholar]
- 64.Akhtar S, Meeran SM, Katiyar N, Katiyar SK, Grape seed proanthocyanidins inhibit the growth of human non-small cell lung cancer xenografts by targeting insulin-like growth factor binding protein-3, tumor cell proliferation, and angiogenic factors. Clin Cancer Res 15, 821–831 (2009). [DOI] [PubMed] [Google Scholar]
- 65.Santosh V et al. , Grade-specific expression of insulin-like growth factor-binding proteins-2, -3, and -5 in astrocytomas: IGFBP-3 emerges as a strong predictor of survival in patients with newly diagnosed glioblastoma. Cancer Epidemiol Biomarkers Prev 19, 1399–1408 (2010). [DOI] [PubMed] [Google Scholar]
- 66.Morali OG et al. , IGF-II induces rapid beta-catenin relocation to the nucleus during epithelium to mesenchyme transition. Oncogene 20, 4942–4950 (2001). [DOI] [PubMed] [Google Scholar]
- 67.Vander Velde R et al. , Resistance to targeted therapies as a multifactorial, gradual adaptation to inhibitor specific selective pressures. Nat Commun 11, 2393 (2020). [DOI] [PMC free article] [PubMed] [Google Scholar]
- 68.Bean J et al. , MET amplification occurs with or without T790M mutations in EGFR mutant lung tumors with acquired resistance to gefitinib or erlotinib. Proc Natl Acad Sci U S A 104, 20932–20937 (2007). [DOI] [PMC free article] [PubMed] [Google Scholar]
- 69.Ortiz-Cuaran S et al. , Heterogeneous Mechanisms of Primary and Acquired Resistance to Third-Generation EGFR Inhibitors. Clin Cancer Res 22, 4837–4847 (2016). [DOI] [PubMed] [Google Scholar]
- 70.Mediavilla-Varela M, Boateng K, Noyes D, Antonia SJ, The anti-fibrotic agent pirfenidone synergizes with cisplatin in killing tumor cells and cancer-associated fibroblasts. BMC Cancer 16, 176 (2016). [DOI] [PMC free article] [PubMed] [Google Scholar]
- 71.Van Gelder RN et al. , Amplified RNA synthesized from limited quantities of heterogeneous cDNA. Proc Natl Acad Sci U S A 87, 1663–1667 (1990). [DOI] [PMC free article] [PubMed] [Google Scholar]
- 72.Warrington JA, Nair A, Mahadevappa M, Tsyganskaya M, Comparison of human adult and fetal expression and identification of 535 housekeeping/maintenance genes. Physiol Genomics 2, 143–147 (2000). [DOI] [PubMed] [Google Scholar]
- 73.Babicki S et al. , Heatmapper: web-enabled heat mapping for all. Nucleic Acids Res 44, W147–153 (2016). [DOI] [PMC free article] [PubMed] [Google Scholar]
- 74.Dennis G Jr. et al. , DAVID: Database for Annotation, Visualization, and Integrated Discovery. Genome biology 4, P3 (2003). [PubMed] [Google Scholar]
- 75.Cox J, Mann M, MaxQuant enables high peptide identification rates, individualized p.p.b.-range mass accuracies and proteome-wide protein quantification. Nature biotechnology 26, 1367–1372 (2008). [DOI] [PubMed] [Google Scholar]
- 76.Welsh EA, Eschrich SA, Berglund AE, Fenstermacher DA, Iterative rank-order normalization of gene expression microarray data. BMC Bioinformatics 14, 153 (2013). [DOI] [PMC free article] [PubMed] [Google Scholar]
- 77.Krey JF et al. , Accurate label-free protein quantitation with high- and low-resolution mass spectrometers. J Proteome Res 13, 1034–1044 (2014). [DOI] [PMC free article] [PubMed] [Google Scholar]
- 78.Schwanhausser B et al. , Global quantification of mammalian gene expression control. Nature 473, 337–342 (2011). [DOI] [PubMed] [Google Scholar]
- 79.Edgar R, Domrachev M, Lash AE, Gene Expression Omnibus: NCBI gene expression and hybridization array data repository. Nucleic Acids Res 30, 207–210 (2002). [DOI] [PMC free article] [PubMed] [Google Scholar]
- 80.Perez-Riverol Y et al. , The PRIDE database and related tools and resources in 2019: improving support for quantification data. Nucleic Acids Res 47, D442–D450 (2019). [DOI] [PMC free article] [PubMed] [Google Scholar]
Associated Data
This section collects any data citations, data availability statements, or supplementary materials included in this article.
Supplementary Materials
Data Availability Statement
All transcriptomics data that support the findings of this study have been deposited in the NCBI’s Gene Expression Omnibus (GEO) (79) and are accessible through the GEO Series accession number GSE164750 (https://www.ncbi.nlm.nih.gov/geo/query/acc.cgi?acc=GSE164750). The mass spectrometry proteomics data have been deposited to the ProteomeXchange Consortium via the PRIDE (80) partner repository with the dataset identifiers PXD023626 and 10.6019/PXD023626 (secretome), and PXD023692 and 10.6019/PXD023692 (phosphotyrosine). All other data needed to evaluate the conclusions in the paper are present in the paper or the Supplementary Materials and are available from the corresponding author upon reasonable request.