

Abstract
Objectives
Frequent emergency department users represent a small proportion of users while cumulating many visits. Previously identified factors of frequent use include high physical comorbidity, mental health disorders, poor socioeconomic status and substance abuse. However, frequent users do not necessarily exhibit all these characteristics and they constitute a heterogeneous population. This study aims to establish profiles of frequent emergency department users in an adult population with chronic conditions.
Design
This is a retrospective cohort study using administrative databases.
Setting
All adults who visited the emergency department between 2012 and 2013 (index date) in the province of Quebec (Canada), diagnosed with at least one chronic condition, and without dementia were included. Patients living in remote areas and who died in the year following their index date were excluded. We used latent class analysis, a probability-based model to establish profiles of frequent emergency department users. Frequent use was defined as having five visits or more during 1 year. Patient characteristics included sociodemographic characteristics, physical and mental comorbidities and prior healthcare utilisation.
Results
Out of 4 51 775 patients who visited emergency departments at least once in 2012–2013, 13 676 (3.03%) were frequent users. Four groups were identified: (1) ‘low morbidity’ (n=5501, 40.2%), (2) ‘high physical comorbidity’ (n=3202, 23.4%), (3) ‘injury or chronic non-cancer pain’ (n=2313, 19.5%) and (4) ‘mental health or alcohol/substance abuse’ (n=2660, 16.9%).
Conclusions
The four profiles have distinct medical and socioeconomic characteristics. These profiles provide useful information for developing tailored interventions that would address the specific needs of each type of frequent emergency department users.
Keywords: ACCIDENT & EMERGENCY MEDICINE, STATISTICS & RESEARCH METHODS, PUBLIC HEALTH, HEALTH SERVICES ADMINISTRATION & MANAGEMENT
Strengths and limitations of this study.
Frequent user classes were built with latent class analysis, an objective and person-centred statistical model.
Use of an exhaustive medicoadministrative database with relevant variables to perform classification.
Self-reported variables, such as psychological distress and self-rating of health, were not available.
Introduction
Emergency department (ED) users who present to the ED at least five times per year are qualified as ‘frequent users’.1 Previously identified factors of frequent ED use include poor socioeconomic status, high physical illness burden, mental health disorders and alcohol and/or drug abuse,2 leading to complex needs for these users. Specifically, frequent users with chronic conditions3 4 could benefit from more adequate care outside of ED. Prevalence of chronic conditions is higher in frequent users compared with the rest of the population3 and timely interventions in primary care could help avoid unplanned care such as ED visits or hospitalisation.5
Frequent ED use is a major challenge in health facility management. This use is often associated with adverse health outcomes, such as increased hospitalisations or mortality.6 It is considered suboptimal in contrast to healthcare that could be administered in primary care. Furthermore, though frequent users represent 4.5% to 8% of the ED population, they cumulate up to 28% of ED visits.1 This in turn results in higher healthcare costs and can contribute to overcrowding in ED.7 8 Therefore, it is essential to understand the characteristics of these users in order to adapt interventions to their profiles and better address their needs. However, this is a complex task: frequent ED users are a heterogeneous population and many subgroups exist.8 9 The issue is multidimensional in nature and required interventions are, therefore, diverse (eg, severe asthma should be treated differently by age at onset, early onset vs late onset). Some authors have concluded that this heterogeneity needs to be taken into account in studies.1 9
This study aims to establish and characterise the profiles of frequent ED users in an adult population with chronic diseases.
Methods
Study setting
This is a population-based retrospective cohort study, reported in accordance with Strengthening the Reporting of Observational Studies in Epidemiology (STROBE) guidelines (see the STROBE checklist). The following information was extracted from the Québec provincial health insurance board (RAMQ) databases from 2010 to 2014 (each patient, therefore, had a medical history of at least 2 years and a follow-up time of at least 1 year):
Patient: sex, date of birth, date of death and place of residence.
Medical services: date and place of service, physician specialty, diagnosis (International Classification of Diseases, ninth revision ICD-9) and the medical procedure.
Hospitalisation: principal diagnosis and up to 25 secondary diagnoses (ICD-10), dates of admission and release from hospital and all medical procedures performed.
Study sample
We included all patients 18 years and older living in the province of Québec (Canada), with at least one ED visit between 1 January 2012 and 31 December 2013 (index date chosen randomly during this period), diagnosed with at least one chronic disease and without dementia. Patients with dementia may exhibit behaviours that pose challenges for the medical staff (eg, agitation, aggression, resistance to care), thus complicating treatment.10 They were specifically analysed in another study focusing on older adults with the same database.11
We used a threshold of five visits or more during the year following the index date (excluding the index visit) to define frequent ED use.2 12 This threshold was appropriate as it yielded a patient subpopulation cumulating approximately a fourth of all ED visits,13 thus representing a balance between expenditure of resources for interventions and clinical interest.13 This threshold resulted in a population of frequent ED users cumulating 25.77% of all ED visits (95 876 out of a total of 372 083 ED visits).
Regarding chronic diseases, we considered asthma, chronic obstructive pulmonary disease, congestive heart failure (CHF), coronary artery disease (CAD), diabetes, epilepsy and high blood pressure (HBP) (see S1Table in the online supplemental file 1; Supplemental Digital Content for ICD codes). ED visits or hospitalisations due to those diseases could be avoided through disease management in a primary care setting14 15; in particular, they are used as indicators for monitoring healthcare systems.16
bmjopen-2021-055297supp001.pdf (55.9KB, pdf)
There were two exclusion criteria (figure 1). First, patients living in remote areas were excluded, as ED use can be different between urban and remote areas (eg, remote EDs tend to be used as primary care providers).17 Using the definition of Statistics Canada,18 remote areas are defined as municipalities with fewer than 10 000 inhabitants where the percentage of residents who commute to urban areas for work is less than 5%. Second, patients who died during the year after their index date were excluded as they tend to require highly specialised healthcare such as intensive care unit visits, multiple hospitalisations or alternate level of-care.19
Figure 1.

Flowchart of the study cohort selection. ED, emergency department.
Primary and secondary outcome measures
The following variables were selected as they have been linked to frequent use in the literature1–3 13 :
Sociodemographic variables: sex, age, type of residential area (metropolitan: ≥1 00 000 inhabitants; small town: 10 000–1 00 000; rural: <10 000), Pampalon material and social deprivation indices,20 having a family physician and public prescription drug insurance plan (PPDIP) status. There are four different PPDIP statuses: ‘not admissible’ (individuals with a private insurance plan, nPPDIP), ‘“admissible and aged ≥65 years with guaranteed income supplement’, ‘admissible and recipient of last-resort financial assistance’ (LRFA) and ‘regular recipient’. The Pampalon material and social deprivation indices are validated proxies for socioeconomic status. They use information about the smallest spatial units in Canada (dissemination area) and are respectively constructed with education level, employment status and income; marital state, living alone and being a member of a single-parent family. Both indices range from 1 to 5 (most privileged to most deprived).21
Medical variables: having been hospitalised in the 2 years before the index date, the number of ED visits during the year before and after the index date and the Charlson comorbidity index.22 We also considered diagnoses for each of the following: chronic conditions (the seven aforementioned conditions), chronic non-cancer pain (CNCP), injury, common mental disorders (CMD), serious mental disorders (SMD), alcohol abuse, drug abuse and chronic frequent use (CU). The latter was defined as frequent use during 3 consecutive years after the index date.23 SMD included schizophrenia and schizoaffective disorders, bipolar and manic disorders, and other psychotic disorders while CMD included all other diagnoses.24
Patient involvement
This is secondary use of patient data; therefore, no patient was involved in the design, management and conduct of the study. However, this study is part of a larger research project that aims at improving health services for patients with complex needs, lead by Dr Hudon and Dr Chouinard. They colead a research team that includes multiple patient investigators and stakeholders (V1SAGES team) https://v1sages.recherche.usherbrooke.ca/.
Analysis
We used latent class analysis (LCA) to build profiles of frequent ED users. LCA is an objective model-based approach that identifies population subgroups, or classes. Estimation is based on observed individual characteristics known as indicators.25 It enables identification of classes that are homogeneous (individuals are similar in a given class while being different from individuals from other classes). LCA is probabilistic in nature, which makes it possible to compare solutions with statistical criteria and allows for mixed variables.
Among the variables described in the Primary and secondary outcome measures subsection, multiple indicators were evaluated. The most relevant indicators for detecting the group structure in the data were retained for the final model while variables with no group information (or that carried redundant information) were discarded in a trial-and-error approach. Thus, final indicators were selected based on scientific literature and on clinical expertise of the authors (including ED physicians, general practitioners and nurses). Choosing only relevant indicators ensured interpretability of the resulting profiles.
Concurrent with the indicator selection process, statistical criteria were computed for models ranging from one to seven classes. Each model was run 100 times in order to ensure that a global solution was reached rather than a local maximum. Entropy, likelihood-ratio statistic (G2), log-likelihood, Akaike information criterion, Bayes information criterion and Pearson χ2 statistic were used to compare models. The final solution was, thus chosen as a balance between optimal statistical criteria and clinical significance.
After choosing an LCA model, the item-response probabilities were investigated, which represent how likely patients in one given class are to provide different values on indicators. The LCA model also estimates membership probabilities for each patient, that is, probability of belonging to a class. Other observed variables (the ones that were not used to build the profiles) distributed across classes were compared by assigning each patient to the class for which their membership probability was the highest. Differences between observed variables were investigated using χ2 tests with α=0.001. There were 3.5% missing data in the deprivation indices. Those latter were used only for description, thus missing data were kept in the sample.
Sensitivity analyses were also run by evaluating classification with random split sets (50–50) and by adding or subtracting one class to the chosen model. All results were obtained with SAS V.9.4 (SAS Institute, Cary, North Carolina) and the package poLCA in R V.4.0.0 (R Core Team 2020).
Results
Out of 4 51 775 patients, 13 676 (3.0%) were frequent users (table 1). Among these, there were higher proportions of patients with LRFA, diagnosed with physical or mental comorbidities, and with higher health service use when compared with the cohort.
Table 1.
Descriptive statistics for the total and for frequent users
| Variable | Total (%) | Frequent users (%) |
| Total | 451 775 (100) | 13 676 (100) |
| Female | 234 320 (51.9) | 7352 (53.8) |
| Age | ||
| 18–34 | 23 723 (5.3) | 948 (6.9) |
| 35–54 | 83 393 (18.5) | 2416 (17.7) |
| 55–64 | 99 136 (21.9) | 2518 (18.4) |
| 65–74 | 116 323 (25.7) | 3125 (22.9) |
| 75–84 | 93 091 (20.6) | 3204 (23.4) |
| ≥ 85 | 36 109 (8.0) | 1465 (10.7) |
| PPDIP admissibility | ||
| Regular | 170 044 (37.6) | 4190 (30.6) |
| ≥65 years with guaranteed income supplement | 118 313 (26.2) | 4695 (34.3) |
| Not admissible | 129 608 (28.7) | 2354 (17.2) |
| Recipients of last-resort financial assistance | 33 810 (7.5) | 2437 (17.8) |
| Residential area | ||
| Metropolitan | 302 097 (66.9) | 8496 (62.1) |
| Small town | 67 685 (15.0) | 2354 (17.2) |
| Rural | 81 993 (18.1) | 2826 (20.7) |
| Number of ED visits (1 year before the index date) | ||
| ≤1 | 350 197 (79.9) | 4268 (31.2) |
| 2 | 46 556 (10.6) | 2114 (15.5) |
| 3 | 20 951 (4.8) | 1785 (13.0) |
| 4 | 9888 (2.3) | 1394 (10.2) |
| ≥5 | 10 507 (2.4) | 4115 (30.1) |
| Previous hospitalisation in the last 2 years | 191 862 (42.5) | 9498 (69.5) |
| Material deprivation | ||
| Missing | 15 928 (3.5) | 686 (5.0) |
| 1—less deprived | 70 303 (15.6) | 1572 (11.5) |
| 2 | 82 729 (18.3) | 2151 (15.7) |
| 3 | 87 736 (19.4) | 2498 (18.8) |
| 4 | 96 514 (21.4) | 3115 (22.8) |
| 5—most deprived | 98 565 (21.8) | 3654 (26.7) |
| Social deprivation | ||
| Missing | 15 928 (3.5) | 686 (5.0) |
| 1—less deprived | 73 218 (16.2) | 1783 (13.0) |
| 2 | 77 968 (17.3) | 1971 (14.4) |
| 3 | 87 542 (19.4) | 2415 (17.7) |
| 4 | 93 164 (20.6) | 2925 (21.4) |
| 5—most deprived | 103 955 (23.0) | 3896 (28.5) |
| Comorbidity index | ||
| 0 | 277 798 (61.5) | 4879 (35.7) |
| 1–2 | 98 228 (21.7) | 3670 (26.8) |
| 3–4 | 34 395 (7.6) | 2147 (15.7) |
| ≥ 5 | 41 354 (9.2) | 2980 (21.8) |
| Asthma | 47 514 (10.5) | 2304 (16.8) |
| Chronic obstructive pulmonary disease | 62 975 (13.9) | 4281 (31.3) |
| Congestive heart failure | 27 945 (6.2) | 2152 (15.7) |
| Coronary artery disease | 113 141 (25.0) | 5079 (37.1) |
| Diabetes | 151 951 (33.6) | 5626 (41.1) |
| Epilepsy | 11 538 (2.6) | 674 (4.9) |
| High blood pressure | 245 449 (54.3) | 8061 (58.9) |
| Alcohol abuse | 10 678 (2.4) | 1234 (9.0) |
| Chronic non-cancer pain | 75 263 (16.7) | 3404 (24.9) |
| Common mental disorders | 102 540 (22.7) | 5829 (42.6) |
| Drug abuse | 6908 (1.5) | 1081 (7.9) |
| Injury | 160 577 (35.5) | 7177 (52.5) |
| Serious mental disorders | 15 778 (3.5) | 1497 (10.9) |
Percentages in brackets are relative to the column total.
ED, emergency department; PPDIP, public prescription drug insurance plan.
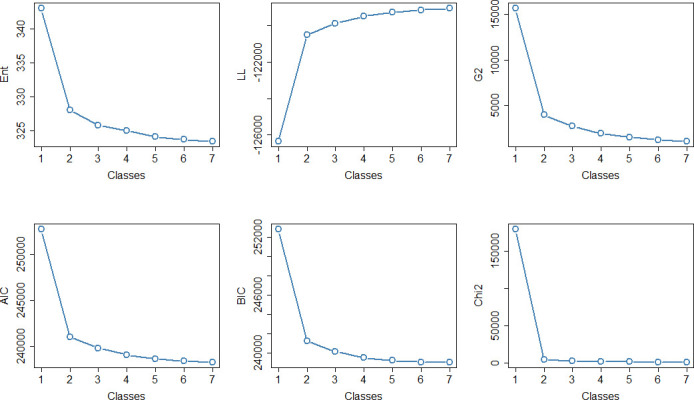
Indicators selected for LCA construction were alcohol, drugs, CNCP, injury, SMD, CMD, PPDIP status and comorbidity index. Those were chosen as they allowed for significant class separation (based on the indicators distribution) and clinical interpretability. Models with more than three classes seemed to improve fit only marginally (figure 2). We chose a final model with four classes based on clinical significance and statistical parsimony, as selecting a relatively small number of class limits overfitting. Classes are described here in decreasing order of size. The corresponding item-response probabilities for the indicators are shown in figure 3. Patients in class 1 had low probabilities for the physical and mental health indicators and the class was named ‘low morbidity’ (n=5501, 40.2%). In contrast, patients in class 2 had high physical comorbidity (73.0% of patients had more than three comorbidities), the class was, thus, labelled ‘high physical comorbidity’ (n=3202, 23.4%). There were 99.8% of patients in class 3 diagnosed with CMD and 42.4% with alcohol/substance abuse; therefore, the class was named ‘mental health or alcohol/substance abuse’ (n=2660, 19.5%). Finally, 80.1% and 41.6% of patients were diagnosed with injury and CNCP, respectively, in Class 4, which was labelled ‘injury or CNCP’ (n=2313, 16.9%).
Figure 2.

Fit criteria depending on the number of classes. AIC, Akaike Information Criterion, BIC, Bayes Information Criterion, Chi2, Pearson Chi-square statistic; ENT, entropy; G2, likelihood–ratio statistic, LL, log likelihood.
Figure 3.
Item-response probabilities for each class. CNCP, chronic non-cancer pain; CMD, common mental disorders; GIS, guaranteed income supplement; LRFA, last-resort financial assistance; PPDIP, public prescription drug insurance plan; SMD, serious mental disorders. Reg, GIS, nPPDIP and LRFA refer to PPDIP status while 0, 1 2, 3 4, and 5+ refer to the comorbidity index.
Differences between classes for each observed variable were significant (table 2). ‘Low morbidity’ (class 1) patients had the lowest level of ED use; 16.7% were frequent users 1 year before the index date. Class 1 also had the lowest proportion of chronic frequent users (10.7%). The ‘high physical comorbidity’ class (class 2) had a high prevalence of physical comorbidities. Specifically, CAD, HBP and CHF diagnoses were the highest in this class. It also had the highest proportion of older adults with 88% older than 65. Patients in ‘mental health or alcohol/substance abuse’ (class 3) were relatively young (half of the class is under 55). Compared with the other classes, they were the most deprived users, both socially and materially. They had the highest prevalence of hospitalisation in the past 2 years: 87%, which is similar to the ‘high physical comorbidity’ class (compared with 56% in the two other classes). Furthermore, this class had the highest number of chronic frequent users (32.1%) and the highest level of ED use. Finally, ‘Injury or CNCP’ (class 4) was the smallest class. Patients in this class were relatively young and were more likely to be women (similar proportion to the ‘high physical comorbidity’ class, 57%). Their indicators showed low comorbidity indices and apart from asthma, they had the lowest prevalence of chronic conditions.
Table 2.
Frequent users’ characteristics by class
| Variable | Class 1 (%) | Class 2 (%) | Class 3 (%) | Class 4 (%) |
| Total | 5501 | 3202 | 2660 | 2313 |
| Female | 2870 (52.2) | 1837 (57.4) | 1322 (49.7) | 1323 (57.2) |
| Age | ||||
| 18–34 | 283 (5.1) | 38 (1.2) | 359 (13.5) | 268 (11.6) |
| 35–54 | 682 (12.4) | 92 (2.9) | 1010 (38) | 632 (27.3) |
| 55–64 | 915 (16.6) | 251 (7.8) | 763 (28.7) | 589 (25.5) |
| 65–74 | 1414 (25.7) | 1008 (31.5) | 335 (12.6) | 368 (15.9) |
| 75–84 | 1535 (27.9) | 1220 (38.1) | 142 (5.3) | 307 (13.3) |
| ≥ 85 | 672 (12.2) | 593 (18.5) | 51 (1.9) | 149 (6.4) |
| Residential area | ||||
| Metropolitan | 3332 (60.6) | 2013 (62.9) | 1817 (68.3) | 1334 (57.6) |
| Small town | 924 (16.8) | 560 (17.5) | 450 (16.9) | 420 (18.2) |
| Rural | 1245 (22.6) | 629 (19.6) | 393 (14.8) | 559 (24.2) |
| Number of ED visits (1 year before the index date) | ||||
| ≤1 | 2491 (45.3) | 685 (21.4) | 352 (13.2) | 740 (32.0) |
| 2 | 926 (16.8) | 535 (16.7) | 318 (11.9) | 335 (14.5) |
| 3 | 676 (12.3) | 483 (15.1) | 313 (11.8) | 313 (13.5) |
| 4 | 487 (8.9) | 400 (12.5) | 257 (9.7) | 250 (10.8) |
| ≥ 5 | 921 (16.7) | 1099 (34.3) | 1420 (53.4) | 675 (29.2) |
| Number of ED visits (1 year after the index date) | ||||
| 5–6 | 3715 (67.5) | 2009 (62.7) | 1243 (46.7) | 1457 (63.0) |
| 7–8 | 1111 (20.2) | 690 (21.6) | 584 (22.0) | 488 (21.1) |
| 9–10 | 389 (7.1) | 261 (8.1) | 301 (11.3) | 189 (8.2) |
| 11–12 | 145 (2.6) | 122 (3.8) | 168 (6.3) | 84 (3.6) |
| ≥ 13 | 141 (2.6) | 120 (3.8) | 364 (13.7) | 95 (4.1) |
| Previous hospitalisation in the last 2 years | 3084 (56.1) | 2809 (87.7) | 2312 (86.9) | 1293 (55.9) |
| Material deprivation | ||||
| Missing | 239 (4.3) | 189 (5.9) | 169 (6.4) | 89 (3.8) |
| 1—less deprived | 639 (11.6) | 373 (11.6) | 282 (10.6) | 278 (12.0) |
| 2 | 882 (16.0) | 514 (16.1) | 374 (14.1) | 381 (16.5) |
| 3 | 989 (18.0) | 628 (19.6) | 427 (16.1) | 454 (19.6) |
| 4 | 1277 (23.2) | 697 (21.8) | 617 (23.2) | 524 (22.7) |
| 5—most deprived | 1475 (26.8) | 801 (25.0) | 791 (29.7) | 587 (25.4) |
| Social deprivation | ||||
| Missing | 239 (4.3) | 189 (5.9) | 169 (6.4) | 89 (3.8) |
| 1—less deprived | 795 (14.5) | 397 (12.4) | 216 (8.1) | 375 (16.2) |
| 2 | 847 (15.4) | 449 (14.0) | 295 (11.1) | 380 (16.4) |
| 3 | 1068 (19.4) | 534 (16.7) | 350 (13.2) | 463 (20.0) |
| 4 | 1162 (21.1) | 679 (21.2) | 616 (23.2) | 468 (20.2) |
| 5—most deprived | 1390 (25.3) | 954 (29.8) | 1014 (38.1) | 538 (23.3) |
| Asthma | 684 (12.4) | 463 (14.5) | 693 (26.1) | 464 (20.1) |
| Chronic obstructive pulmonary disease | 1408 (25.6) | 1449 (45.3) | 960 (36.1) | 464 (20.1) |
| Congestive heart failure | 759 (13.8) | 937 (29.3) | 285 (10.7) | 171 (7.4) |
| Coronary artery disease | 1956 (35.6) | 1765 (55.1) | 740 (27.8) | 618 (26.7) |
| Diabetes | 2265 (41.2) | 1411 (44.1) | 1064 (40.0) | 886 (38.3) |
| Epilepsy | 127 (2.3) | 154 (4.8) | 331 (12.4) | 62 (2.7) |
| High blood pressure | 3030 (55.1) | 2486 (77.6) | 1409 (53) | 1136 (49.1) |
| Chronic frequent use | 588 (10.7) | 592 (18.5) | 855 (32.1) | 376 (16.3) |
Percentages in brackets are relative to the column total. Class 1: ‘low morbidity frequent use’, Class 2: ‘high physical comorbidity’, Class 3: ‘mental health or alcohol/substance abuse’, Class 4: ‘injury or chronic non-cancer pain’.
ED, emergency department.
Sensitivity analyses lead to no significant change in the interpretation of classes using the 50–50 random split. Furthermore, models with three and five classes also resulted in the presence of the ‘high physical comorbidity’ and ‘mental health or alcohol/substance abuse’ classes. For the selected model, the mean membership probability was 75%, suggesting a good class separation.
Discussion
This study focused on developing and characterising profiles of frequent ED users with chronic conditions using an objective statistical model. Our findings highlighted the fact that frequent ED users, though all classified as ‘frequent’ based on their number of visits each year, have heterogeneous profiles. The profiles developed in this study are clinically relevant and can be useful for developing tailored interventions.
Four different profiles were established: ‘low morbidity’, ‘high physical comorbidity’, ‘mental health or alcohol/substance abuse’ and ‘injury or CNCP’. Other studies have investigated LCA for classification of ED users in different contexts such as drinking habits in an adolescent population26 or health service use of older adults.11 27 Those studies mentioned that profiles are of interest for developing tailored interventions. Particularly, one recent study used LCA with frequent ED users.9 Although they used different indicators from ours, they also selected a four-group solution with similarities to our results (eg, one younger group with higher ED use). However, our findings could be easier to generalise as we used a larger data set (n=4 51 775 from 135 EDs vs n=70 959 from 1 ED). Small samples may lead to an unbalanced classification (classes less than 10% of the cohort, which was not the case in our study) and biased results. Besides, the philosophy behind their classification was different from ours as they mainly investigated the reasons for ED visit, resulting in a classification centred on patient visits rather than patient profiles. Our classification incorporated not only medical considerations but also socioeconomic, mental and behavioural dimensions for establishing classes that are more general, as frequent ED use is multidimensional and extends beyond ED setting only.
‘Low morbidity’ class showed the lowest prevalence of chronic frequent users. This high attrition rate would suggest that patients from this class face temporary needs, supported by the fact that their hospitalisation rate and ED use were the lowest. In fact, previous works have found that the majority of frequent users stop their frequent use without intervention within a year.1 23 This is consistent with the fact that in our study, class 1 contains 40.2% of all frequent users. Furthermore, some patients may return to the ED for a physician follow-up, which would be considered ‘appropriate’ ED use in this context.28 Targeting those ‘low morbidity’ users would result in the lowest cost–benefit ratio from a hospital perspective.9 Thus, it may be more relevant to focus intensive interventions on other profiles, such as ‘mental health or alcohol/substance abuse’ users. A more detailed characterisation of the ‘low morbidity users’ is needed since they still represent the largest group. Other variables may be useful for understanding their use as this class may reflect the challenges facing the healthcare system, including lack of access to primary care.29
‘High physical comorbidity’ was the class in which patients were the oldest, presenting with conditions that are strongly correlated with age.30 Thus, they had the highest rates of chronic conditions and, in particular, heart conditions. Some ED visits for these patients may be unavoidable, since they are likely to have higher emergency levels, such as the occurrence of acute problems.31 It may be necessary for these patients to establish a more rigorous follow-up in primary care or in-home care. Though we did not investigate medications, polypharmacy and potentially inappropriate medications, both associated with multimorbidity, may lead to more ED visits through adverse drug events.32 33 Chronic disease management approaches in primary and community care are, therefore essential for this class.34
‘Mental health or alcohol/substance abuse’ patients were the youngest, but they had the highest ED use. The importance of substance abuse or mental disorders in frequent ED use has been highlighted in a previous work with the same databases focusing on CU.23 It also showed that chronic frequent users constitute 19% of frequent users, whereas in the ‘mental health or alcohol/substance abuse’ class, nearly one out of every three patients was a chronic frequent user. Other studies found that alcohol/substance abuse or mental disorders play a major role in frequent ED use.35 36 The important prevalence of mental disorders in this class suggests that addressing the physical disease burden should be coordinated with mental health resources to alleviate ED use in this class. This coordination of services would also avoid stigmatisation.37 Moreover, those users were living in the most socially and materially deprived areas. Deprivation (both socially and materially) has been associated with increased ED use and with increased chance of not having any contact with the healthcare system outside of EDs.38 39 Since patients in this class are more likely to keep on using ED frequently with a higher intensity, they constitute priority targets for intensive interventions, such as case management or community services. Both types of interventions may reduce ED visits and have been used with users who present lower socioeconomic status.40 41
With regards to the last class, CNCP has been associated with frequent ED use.42 Patients with CNCP, particularly those suffering from disabilities, are more likely to use the ED.43 However, EDs may not be the appropriate context of care for such patients as psychosocial, behavioural, and cognitive factors play a large role in CNCP.44 Outside of EDs, opioid prescription is a common strategy for CNCP with severe disabilities.45 In this case, directing vulnerable patients with opioid use to community-based providers has shown efficacy in reducing ED visits.46 Regarding injuries, studies found that they were associated with frequent ED use, but this result mainly concerns senior adults.47 In a more general population, significant accidents (ie, serious enough to limit normal activities) were also associated with a higher ED use.48 Pain management programmes with interdisciplinary teams integrating biopsychosocial aspects have been shown to be effective in helping patients with CNCP, especially in reducing ED use.49 50
Future research may include a cost analysis by profile. Although five visits or more is a common threshold in the literature to define frequent use,2 12 future work could investigate how the classes vary using alternative definitions, such as 10 visits or more. We expect that the higher the threshold is set, the less heterogeneous the frequent user population becomes. However, a higher threshold also means a smaller population, which results in less statistical power.
Our study has some limitations. Self-reported variables, such as psychological distress and self-rating of health, are known to be associated with frequent ED use.51 These variables were not available in our databases but may be considered in future work by matching these databases with the Canadian Community Health Survey for instance. Specifically, studies from multiple databases including self-reported outcomes could help understand why ‘low morbidity frequent use’ patients were frequent users. In Canada, such databases (Canadian Community Health Survey and on-site questionnaires) have already been successfully paired to study ED use, though the focus was not on frequent use.52 Another limit is the follow-up regarding residential areas and deprivation indices. If individuals move during a financial year, they still appear with their initial information until the next year. Finally, data used in this study are representative of the province of Québec; profiles may not be generalisable to other countries. They are also representative of frequent ED users with the ‘less severe’ profiles, as we excluded those who died in the year following their index date (those users are usually of advanced age and with a significant number of comorbidities). This specific aspect was examined in a previous study.11
Supplementary Material
Acknowledgments
The authors would like to thank Bonita Von Doorn for revising the text.
Footnotes
Twitter: @MaudCChouinard
Contributors: CH, AV, M-CC, M-FD, ND, NE and YMC acquired the funding. YMC, CH and JC contributed to the concept and design of the study. YMC performed the analyses with the help of JC and ID. All authors helped with the interpretation of results. YMC and CH drafted the manuscript. All authors contributed substantially to its revision and approved of the submitted version. YMC acts as the guarantor for this study.
Funding: This work was supported by the Fonds de recherche du Québec—Santé (grant number 318327) and the Centre de recherche du Centre hospitalier de l’Université de Sherbrooke (local grant).
Competing interests: None declared.
Patient and public involvement: Patients and/or the public were not involved in the design, or conduct, or reporting, or dissemination plans of this research.
Provenance and peer review: Not commissioned; externally peer reviewed.
Supplemental material: This content has been supplied by the author(s). It has not been vetted by BMJ Publishing Group Limited (BMJ) and may not have been peer-reviewed. Any opinions or recommendations discussed are solely those of the author(s) and are not endorsed by BMJ. BMJ disclaims all liability and responsibility arising from any reliance placed on the content. Where the content includes any translated material, BMJ does not warrant the accuracy and reliability of the translations (including but not limited to local regulations, clinical guidelines, terminology, drug names and drug dosages), and is not responsible for any error and/or omissions arising from translation and adaptation or otherwise.
Data availability statement
No data are available. The research team is bound by legal reasons to not divulge any part of the data due to individual privacy issues. The Commission de l’accès à l’information du Québec (CAI) is the provincial organism that reviews research projects and allows researchers to access health databases. It is also responsible for ensuring their privacy as those databases contain sensitive patient information and it does not legally allow for making any part of the public. All data used in this study were fully anonymised.
Ethics statements
Patient consent for publication
Not applicable.
Ethics approval
Not applicable.
References
- 1.LaCalle E, Rabin E. Frequent users of emergency departments: the myths, the data, and the policy implications. Ann Emerg Med 2010;56:42–8. 10.1016/j.annemergmed.2010.01.032 [DOI] [PubMed] [Google Scholar]
- 2.Krieg C, Hudon C, Chouinard M-C, et al. Individual predictors of frequent emergency department use: a scoping review. BMC Health Serv Res 2016;16:594. 10.1186/s12913-016-1852-1 [DOI] [PMC free article] [PubMed] [Google Scholar]
- 3.Billings J, Raven MC. Dispelling an urban legend: frequent emergency department users have substantial burden of disease. Health Aff 2013;32:2099–108. 10.1377/hlthaff.2012.1276 [DOI] [PMC free article] [PubMed] [Google Scholar]
- 4.Chukmaitov AS, Tang A, Carretta HJ, et al. Characteristics of all, occasional, and frequent emergency department visits due to ambulatory care-sensitive conditions in Florida. J Ambul Care Manage 2012;35:149–58. 10.1097/JAC.0b013e318244d222 [DOI] [PubMed] [Google Scholar]
- 5.Gibson OR, Segal L, McDermott RA. A systematic review of evidence on the association between hospitalisation for chronic disease related ambulatory care sensitive conditions and primary health care resourcing. BMC Health Serv Res 2013;13:336. 10.1186/1472-6963-13-336 [DOI] [PMC free article] [PubMed] [Google Scholar]
- 6.Miller JB, Brauer E, Rao H, et al. The most frequent ED patients carry insurance and a significant burden of disease. Am J Emerg Med 2013;31:16–19. 10.1016/j.ajem.2012.05.001 [DOI] [PubMed] [Google Scholar]
- 7.Kumar GS, Klein R. Effectiveness of case management strategies in reducing emergency department visits in frequent user patient populations: a systematic review. J Emerg Med 2013;44:717–29. 10.1016/j.jemermed.2012.08.035 [DOI] [PubMed] [Google Scholar]
- 8.Ruger JP, Richter CJ, Spitznagel EL, et al. Analysis of costs, length of stay, and utilization of emergency department services by frequent users: implications for health policy. Acad Emerg Med 2004;11:1311–7. 10.1197/j.aem.2004.07.008 [DOI] [PubMed] [Google Scholar]
- 9.Birmingham LE, Cheruvu VK, Frey JA, et al. Distinct subgroups of emergency department frequent users: a latent class analysis. Am J Emerg Med 2020;38:83–8. 10.1016/j.ajem.2019.04.029 [DOI] [PubMed] [Google Scholar]
- 10.Dewing J, Dijk S. What is the current state of care for older people with dementia in general hospitals? A literature review. Dementia 2016;15:106–24. 10.1177/1471301213520172 [DOI] [PubMed] [Google Scholar]
- 11.Dufour I, Dubuc N, Chouinard M-C, et al. Profiles of frequent geriatric users of emergency departments: a latent class analysis. J Am Geriatr Soc 2021;69:753–61. 10.1111/jgs.16921 [DOI] [PubMed] [Google Scholar]
- 12.Doupe MB, Palatnick W, Day S, et al. Frequent users of emergency departments: developing standard definitions and defining prominent risk factors. Ann Emerg Med 2012;60:24–32. 10.1016/j.annemergmed.2011.11.036 [DOI] [PubMed] [Google Scholar]
- 13.Hunt KA, Weber EJ, Showstack JA, et al. Characteristics of frequent users of emergency departments. Ann Emerg Med 2006;48:1–8. 10.1016/j.annemergmed.2005.12.030 [DOI] [PubMed] [Google Scholar]
- 14.Hsieh VC-R, Hsieh M-L, Chiang J-H, et al. Emergency department visits and disease burden attributable to ambulatory care sensitive conditions in elderly adults. Sci Rep 2019;9:3811. 10.1038/s41598-019-40206-4 [DOI] [PMC free article] [PubMed] [Google Scholar]
- 15.Muench U, Simon M, Guerbaai R-A, et al. Preventable hospitalizations from ambulatory care sensitive conditions in nursing homes: evidence from Switzerland. Int J Public Health 2019;64:1273–81. 10.1007/s00038-019-01294-1 [DOI] [PMC free article] [PubMed] [Google Scholar]
- 16.Canadian Institute for Health Information . Ambulatory care sensitive conditions, 2021. Available: https://www.cihi.ca/en/indicators/ambulatory-care-sensitive-conditions
- 17.Haggerty J, Roberge D, Pineault R, et al. Features of Primary Healthcare Clinics Associated with Patients’ Utilization of Emergency Rooms: Urban-Rural Differences. Hcpol 2007;3:72–85. 10.12927/hcpol.2007.19394 [DOI] [PMC free article] [PubMed] [Google Scholar]
- 18.Canada S. Census metropolitan area (CMA) and census agglomeration (Ca) Ottawa (on): Minister of industry, 2016. Available: https://www12.statcan.gc.ca/census-recensement/2016/ref/dict/geo009-eng.cfm
- 19.Qureshi D, Isenberg S, Tanuseputro P, et al. Describing the characteristics and healthcare use of high-cost acute care users at the end of life: a pan-Canadian population-based study. BMC Health Serv Res 2020;20:1–9. 10.1186/s12913-020-05837-8 [DOI] [PMC free article] [PubMed] [Google Scholar]
- 20.Pampalon R, Hamel D, Gamache P. The Quebec index of material and social deprivation: methodological follow-up. 1991 through 2006: Institut national de santé publique du Québec 2011. 10.1007/BF03403824 [DOI] [Google Scholar]
- 21.Pampalon R, Hamel D, Gamache P, et al. A deprivation index for health planning in Canada. Chronic Dis Can 2009;29:178–91. 10.24095/hpcdp.29.4.05 [DOI] [PubMed] [Google Scholar]
- 22.Simard M, Sirois C, Candas B. Validation of the combined comorbidity index of Charlson and Elixhauser to predict 30-day mortality across ICD-9 and ICD-10. Med Care 2018;56:441–7. 10.1097/MLR.0000000000000905 [DOI] [PubMed] [Google Scholar]
- 23.Chiu YM, Vanasse A, Courteau J, et al. Persistent frequent emergency department users with chronic conditions: a population-based cohort study. PLoS One 2020;15:e0229022. 10.1371/journal.pone.0229022 [DOI] [PMC free article] [PubMed] [Google Scholar]
- 24.Gaulin M, Simard M, Candas B, et al. Combined impacts of multimorbidity and mental disorders on frequent emergency department visits: a retrospective cohort study in Quebec, Canada. CMAJ 2019;191:E724–32. 10.1503/cmaj.181712 [DOI] [PMC free article] [PubMed] [Google Scholar]
- 25.Collins LM, Lanza ST. Latent class and latent transition analysis: with applications in the social, behavioral, and health sciences. John Wiley & Sons, 2009. [Google Scholar]
- 26.Diestelkamp S, Kriston L, Arnaud N, et al. Drinking patterns of alcohol intoxicated adolescents in the emergency department: a latent class analysis. Addict Behav 2015;50:51–9. 10.1016/j.addbeh.2015.06.009 [DOI] [PubMed] [Google Scholar]
- 27.Hastings SN, Whitson HE, Sloane R, et al. Using the past to predict the future: latent class analysis of patterns of health service use of older adults in the emergency department. J Am Geriatr Soc 2014;62:711–5. 10.1111/jgs.12746 [DOI] [PMC free article] [PubMed] [Google Scholar]
- 28.Institut canadien d'information sur la santé. Réadmission en soins de courte durée et retour au service d’urgence, toutes causes confondues. Ottawa 2012. [Google Scholar]
- 29.Kiran T, O'Brien P. Challenge of same-day access in primary care. Can Fam Physician 2015;61:399. [PMC free article] [PubMed] [Google Scholar]
- 30.Mackay J, Mensah GA. The atlas of heart disease and stroke: World Health organization 2004.
- 31.Dufour I, Chiu Y, Courteau J, et al. Frequent emergency department use by older adults with ambulatory care sensitive conditions: a population-based cohort study. Geriatr Gerontol Int 2020;20:317–23. 10.1111/ggi.13875 [DOI] [PMC free article] [PubMed] [Google Scholar]
- 32.Hamilton H, Gallagher P, Ryan C, et al. Potentially inappropriate medications defined by STOPP criteria and the risk of adverse drug events in older hospitalized patients. Arch Intern Med 2011;171:1013–9. 10.1001/archinternmed.2011.215 [DOI] [PubMed] [Google Scholar]
- 33.Meurer WJ, Potti TA, Kerber KA, et al. Potentially inappropriate medication utilization in the emergency department visits by older adults: analysis from a nationally representative sample. Acad Emerg Med 2010;17:231–7. 10.1111/j.1553-2712.2010.00667.x [DOI] [PubMed] [Google Scholar]
- 34.Reynolds R, Dennis S, Hasan I, et al. A systematic review of chronic disease management interventions in primary care. BMC Fam Pract 2018;19:11. 10.1186/s12875-017-0692-3 [DOI] [PMC free article] [PubMed] [Google Scholar]
- 35.Liu SW, Nagurney JT, Chang Y, et al. Frequent ED users: are most visits for mental health, alcohol, and drug-related complaints? Am J Emerg Med 2013;31:1512–5. 10.1016/j.ajem.2013.08.006 [DOI] [PubMed] [Google Scholar]
- 36.Soril LJJ, Leggett LE, Lorenzetti DL, et al. Characteristics of frequent users of the emergency department in the general adult population: a systematic review of international healthcare systems. Health Policy 2016;120:452–61. 10.1016/j.healthpol.2016.02.006 [DOI] [PubMed] [Google Scholar]
- 37.Wise-Harris D, Pauly D, Kahan D, et al. "Hospital was the Only Option": Experiences of Frequent Emergency Department Users in Mental Health. Adm Policy Ment Health 2017;44:405–12. 10.1007/s10488-016-0728-3 [DOI] [PubMed] [Google Scholar]
- 38.Vanstone NA, Belanger P, Moore K, et al. Socioeconomic composition of low-acuity emergency department users in Ontario. Can Fam Physician 2014;60:355–62. [PMC free article] [PubMed] [Google Scholar]
- 39.Tozer AP, Belanger P, Moore K, et al. Socioeconomic status of emergency department users in Ontario, 2003 to 2009. CJEM 2014;16:220–5. 10.2310/8000.2013.131048 [DOI] [PubMed] [Google Scholar]
- 40.Moe J, Kirkland S, Ospina MB, et al. Mortality, admission rates and outpatient use among frequent users of emergency departments: a systematic review. Emerg Med J 2016;33:230–6. 10.1136/emermed-2014-204496 [DOI] [PubMed] [Google Scholar]
- 41.Raven MC, Doran KM, Kostrowski S, et al. An intervention to improve care and reduce costs for high-risk patients with frequent hospital admissions: a pilot study. BMC Health Serv Res 2011;11:270. 10.1186/1472-6963-11-270 [DOI] [PMC free article] [PubMed] [Google Scholar]
- 42.Dépelteau A, Racine-Hemmings F, Lagueux Émilie, et al. Chronic pain and frequent use of emergency department: a systematic review. Am J Emerg Med 2020;38:358–63. 10.1016/j.ajem.2019.158492 [DOI] [PubMed] [Google Scholar]
- 43.Friedman BW, Serrano D, Reed M, et al. Use of the emergency department for severe headache. A population-based study. Headache 2009;49:21–30. 10.1111/j.1526-4610.2008.01282.x [DOI] [PMC free article] [PubMed] [Google Scholar]
- 44.Olsen JC, Ogarek JL, Goldenberg EJ, et al. Impact of a chronic pain protocol on emergency department utilization. Acad Emerg Med 2016;23:424–32. 10.1111/acem.12942 [DOI] [PubMed] [Google Scholar]
- 45.Dowell D, Haegerich TM, Chou R. CDC Guideline for Prescribing Opioids for Chronic Pain--United States, 2016. JAMA 2016;315:1624–45. 10.1001/jama.2016.1464 [DOI] [PMC free article] [PubMed] [Google Scholar]
- 46.Ringwalt C, Shanahan M, Wodarski S, et al. A randomized controlled trial of an emergency department intervention for patients with chronic noncancer pain. J Emerg Med 2015;49:974–83. 10.1016/j.jemermed.2015.03.004 [DOI] [PMC free article] [PubMed] [Google Scholar]
- 47.Castillo EM, Brennan JJ, Howard J, et al. Factors associated with geriatric frequent users of emergency departments. Ann Emerg Med 2019;74:270–5. 10.1016/j.annemergmed.2018.12.013 [DOI] [PubMed] [Google Scholar]
- 48.Brown EM, Goel V. Factors related to emergency department use: results from the Ontario health survey 1990. Ann Emerg Med 1994;24:1083–91. 10.1016/S0196-0644(94)70237-3 [DOI] [PubMed] [Google Scholar]
- 49.Rash JA, Poulin PA, Shergill Y, et al. Chronic pain in the emergency department: a pilot interdisciplinary program demonstrates improvements in disability, psychosocial function, and healthcare utilization. Pain Res Manag 2018;2018:1–10. 10.1155/2018/1875967 [DOI] [PMC free article] [PubMed] [Google Scholar]
- 50.Gatchel RJ, McGeary DD, McGeary CA, et al. Interdisciplinary chronic pain management: past, present, and future. Am Psychol 2014;69:119–30. 10.1037/a0035514 [DOI] [PubMed] [Google Scholar]
- 51.Blyth FM, March LM, Brnabic AJM, et al. Chronic pain and frequent use of health care. Pain 2004;111:51–8. 10.1016/j.pain.2004.05.020 [DOI] [PubMed] [Google Scholar]
- 52.Fleury M-J, Grenier G, Farand L, et al. Reasons for emergency department use among patients with mental disorders. Psychiatr Q 2019;90:703–16. 10.1007/s11126-019-09657-w [DOI] [PubMed] [Google Scholar]
Associated Data
This section collects any data citations, data availability statements, or supplementary materials included in this article.
Supplementary Materials
bmjopen-2021-055297supp001.pdf (55.9KB, pdf)
Data Availability Statement
No data are available. The research team is bound by legal reasons to not divulge any part of the data due to individual privacy issues. The Commission de l’accès à l’information du Québec (CAI) is the provincial organism that reviews research projects and allows researchers to access health databases. It is also responsible for ensuring their privacy as those databases contain sensitive patient information and it does not legally allow for making any part of the public. All data used in this study were fully anonymised.