Abstract
RORγt is a lineage-specifying transcription factor expressed by immune cells that are enriched in the gastrointestinal tract and orchestrate immunity, inflammation, and tissue homeostasis1–15. However, fundamental questions remain regarding the cellular heterogeneity among these cell types, the mechanisms controlling protective versus inflammatory properties, and their functional redundancy. Here, we define all RORγt+ immune cells in the intestine at single cell resolution and unexpectedly identify a subset of group 3 innate lymphoid cells (ILC3s) expressing Zbtb46, a transcription factor that specifies conventional dendritic cells (cDCs)16–20. Zbtb46 is robustly expressed by CCR6+ lymphoid tissue inducer (LTi)-like ILC3s that are developmentally and phenotypically distinct from cDCs, and expression is imprinted by RORγt, fine-tuned by microbiota-derived signals, and increased by pro-inflammatory cytokines. Zbtb46 uniquely functions to restrain inflammatory properties of ILC3s, including OX40L-dependent expansion of Th17 cells and exacerbated intestinal inflammation following enteric infection. Finally, Zbtb46+ ILC3s are a dominant source of IL-22, and selective depletion of this population renders mice susceptible to enteric infection and associated intestinal inflammation. These results define an unexpected transcription factor shared between cDCs and ILC3s, a cell-intrinsic function for Zbtb46 in restraining pro-inflammatory properties of ILC3s, and a non-redundant role for Zbtb46+ ILC3s in orchestrating intestinal health.
RORγt is a lineage-specifying transcription factor for immune cell populations that are enriched in the intestine, including T helper (Th)17 cells, regulatory T (Treg) cells, γδ T cell subsets, and group 3 innate lymphoid cells (ILC3s)1–15. Fundamental research has defined that these RORγt+ lymphocytes are critical to maintain intestinal homeostasis and mediate essential immunity against infections1–15. However, dysregulation of these cells drives pathogenic intestinal inflammation and other chronic inflammatory diseases. Translational studies have found dysregulated cell numbers and cytokine profiles of RORγt+ immune cells in the intestine of patients with inflammatory bowel disease (IBD) and colorectal cancer21–24. Despite these advances, the full spectrum of cellular heterogeneity, regulatory pathways, and potential functional redundancy of RORγt+ immune cells in the intestine remains poorly defined.
CCR6+ ILC3s robustly express Zbtb46
To address these fundamental gaps in knowledge, we performed single-cell RNA sequencing (scRNA-seq) on all RORγt expressing immune cells in the large intestine of healthy mice. RORγt+ immune cells were sorted from RORγtEGFP mice and mixed at a 1:1 ratio of TCRβ+ cells to TCRβ− cells, permitting dual analysis of conventional T cells and non-T cells (Extended data Fig. 1a). Ten distinct cell clusters of RORγt expressing cells were identified, and one was excluded due to a lack of Rorc transcripts (Fig. 1a, b). Based on the expression of Cd3e, clusters 0, 1, 2, 6, 8 and 9 represent T cells, while clusters 3, 4, 5 and 7 represent non-T cells (Fig. 1b). We analyzed signature genes expressed by each cluster and identified that T cell clusters contain RORγt+ Treg (Trac+ Foxp3+), Th17 cell (Trac+ Il17a+) and γδ T cell (Trdc+) subsets (Fig. 1c). Non-T cell clusters were all ILC subsets based on high expression of Thy1 and Il7r, including T-bet+ ILC3s (NKp46+ ILC3s), CCR6+ ILC3s (lymphoid tissue-inducer (LTi)-like ILC3s), CCR6− T-bet− ILC3s (double negative or DN ILC3s) and a minor population of group 2 ILCs (ILC2s, Gata3+ Klrg1+) (Fig. 1c). These data provide a comprehensive single cell atlas of all RORγt+ immune cells in the healthy mammalian intestine.
Figure 1. A single cell atlas of RORγt+ immune cells identifies Zbtb46 expression in ILC3s.
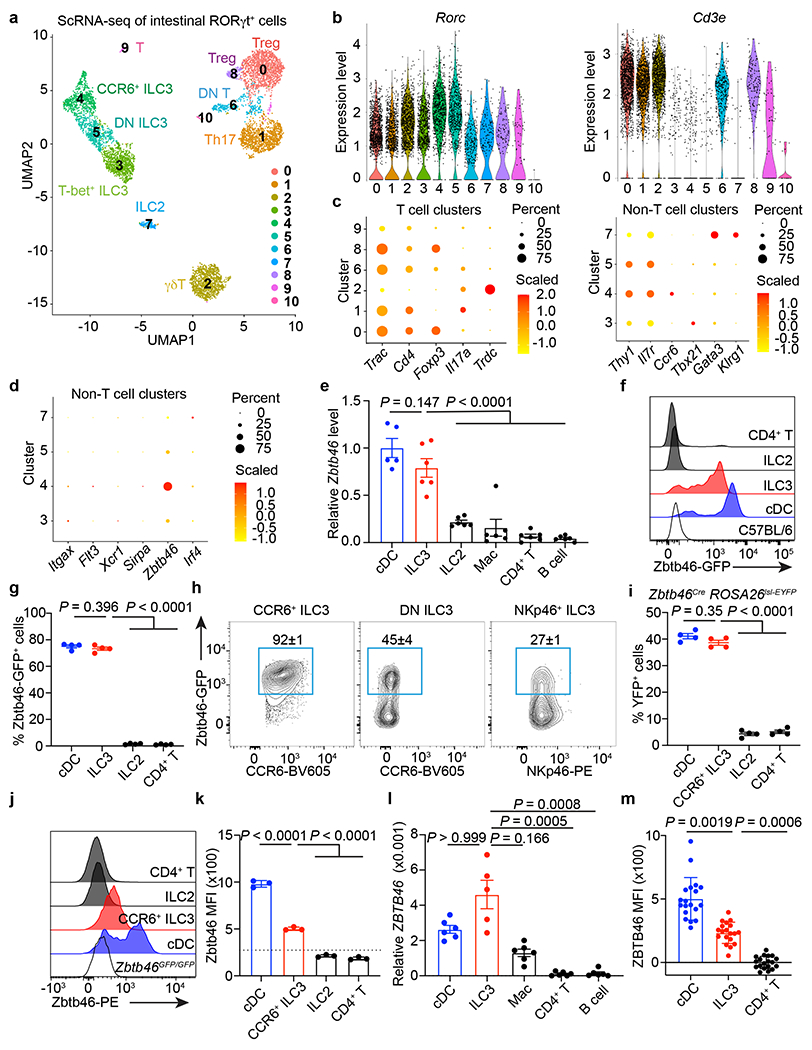
a. scRNA-seq UMAP projection of RORγt+ immune cells from the large intestine of RORγtEGFP mice. b. Violin plots of selected genes. c. Dot plot of selected gene. d. Dot plot of cDC markers. e. Zbtb46 mRNA relative to Hprt in indicated cells from the large intestine of C57BL/6 mice (n = 5 mice for cDCs or 6 for all others). f, g. Histogram of GFP (f), GFP+ cell frequency (g) (n = 4 mice), of indicated cells in the large intestine of Zbtb46GFP/+ mice. h. Flow cytometry plots of indicated ILC3 subsets in the large intestine of Zbtb46GFP/+ mice (n = 4 mice). i. Quantification of YFP+ cells of indicated cells in the large intestine of Zbtb46CreROSA26lsl-EYFP mice (n = 4 mice). j,k. Flow cytometry histogram (j) of Zbtb46 staining and quantification of geometric mean fluorescence intensity (MFI) in indicated cells (k) (n = 3 mice). The dash line indicates Zbtb46 MFI in CCR6+ ILC3s from Zbtb46GFP/GFP mice. l. ZBTB46 mRNA relative to ACTB in indicated cells sorted from the non-inflamed human intestine (n = 5 individual donors for ILC3s or 6 for all others). m. Quantification of ZBTB46 MFI in indicated cells from the healthy human intestine (n = 19 individual donors). MFI in CD4+ T cells was normalized to 0. Data in e are pooled from two independent experiments; data in f, g, h, i, j, and k are representative of two or three independent experiments. Data are shown as the means ± S.E.M in e, g, i, k, l, m, and means ± S.D. in h. Statistics are calculated by one-way ANOVA with Dunnett’s multiple comparisons in e, g, i, and k; one-way ANOVA Kruskal-Wallis test with Dunn’s multiple comparisons in l, and m.
Beyond these well-described innate and adaptive lymphocytes, it was recently suggested that a subset of conventional dendritic cells (cDCs) in the spleen express RORγt25. However, examination of non-T cell clusters revealed an absence of cDC-specific transcripts, including Itgax, Flt3, Xcr1, and Sirpa (Fig. 1d) and experiments with RORγt reporter mice, fate mapping mice, and protein staining revealed that intestinal cDCs do not express RORγt (Extended data Fig. 1b, 1c, 2a, b, c). Surprisingly, in the analysis of cDC-specific markers, we unexpectedly observed that the cluster of CCR6+ ILC3s expresses Zbtb46 (Fig. 1d), a transcription factor identified by two independent groups as a specific marker for cDCs and their progenitors16,17. We confirmed Zbtb46 expression in ILC3s by examining Zbtb46 mRNA levels among different immune cells in the intestine. As expected, cDCs have the highest expression level of Zbtb46, but significant expression is also observed in ILC3s, whereas other immune cell types like ILC2s, macrophages (Mac), CD4+ T cells and B cells showed negligible expression levels (Fig. 1e). This was further confirmed using Zbtb46GFP/+ reporter mice, which revealed that ILC3s abundantly express Zbtb46-GFP in the large intestine (Fig. 1f). The frequency of Zbtb46-GFP+ cells in ILC3s is comparable to that of cDCs and is notably enriched in the CCR6+ ILC3 subset, while minor proportion of DN ILC3s and NKp46+ ILC3s express Zbtb46-GFP (Fig. 1g, h, and Extended data Fig. 3a–d). Minimal Zbtb46-GFP+ cells are observed in ILC2s, CD4+ T cells, or γδT cells (Fig. 1f, g, and Extended data Fig. 4a). Zbtb46 is also expressed in CCR6+ ILC3s, but not in other ILC subsets or CD4+ T cells, across multiple mucosal and lymphoid tissues, including the small intestine, skin, lung, adipose tissues, salivary glands, spleen, and peripheral lymph nodes (Extended data Fig. 4c). The expression of Zbtb46 in CCR6+ ILC3s, but not in T cell subsets, is further confirmed by fate mapping with Zbtb46creROSA26lsl-EYFP mice and protein staining in both the small and large intestine (Fig. 1i–k and Extended data Fig. 1c, 3e, 3f, 4b). ILC3s from the human intestine also abundantly express ZBTB46 transcripts and protein relative to other immune cell subsets (Fig. 1l, m, and Extended Data Fig. 5). These data demonstrate that in addition to cDCs, Zbtb46 is robustly expressed by the CCR6+ LTi-like subset of ILC3s.
Zbtb46+ ILC3s are distinct from cDCs
The expression of Zbtb46 among the CCR6+ subset of ILC3s provokes questions related to their phenotype, ontogeny, and function relative to cDCs. This subset of ILC3s in the intestine exhibited low staining for cDC-specific markers Xcr1, CD172a, Irf8 and Irf4 (Fig. 2a). Further, fate-mapping analyses showed that intestinal cDCs were efficiently marked by Csf1rCre, ItgaxCre, Clec9aCre, and Zbtb46Cre, but not by Il7rCre, RorcCre, and Il22Cre (Fig. 2b, Extended data Fig. 2c, 6a). In contrast, Il7rCre, RorcCre, Il22Cre, and Zbtb46Cre, but not Csf1rCre, ItgaxCre, and Clec9aCre, marked the majority of CCR6+ ILC3s (Fig. 2b, Extended data Fig. 2c, 6a). As Zbtb46 and Clec9a are markers for cDC progenitors16,17,26, we examined for expression of Zbtb46 in ILC3 progenitor cells in the bone marrow. However, Zbtb46 was not detected in conventional ILC progenitors, including common helper ILC progenitors (CHILP), ILC progenitors (ILCP), or LTi cell progenitors (LTip) (Fig. 2c). Further, well-defined cDC precursors (pre-DC) or CHILP were sorted from the bone marrow of Zbtb46GFP/+ reporter mice and transferred into lymphopenic Rag2−/−Il2rg−/− recipient mice (Extended data Fig. 6b). Zbtb46+ ILC3s differentiated only from Zbtb46-negative CHILPs but not Zbtb46+ pre-DCs (Fig. 2d, Extended data Fig. 6c), suggesting that ILC3s acquire Zbtb46 upon maturation. These data demonstrate that Zbtb46+ ILC3s are phenotypically and developmentally distinct from cDCs.
Figure 2. Zbtb46+ ILC3s are distinct from cDCs and modulated by RORγt, microbes, and cytokines.
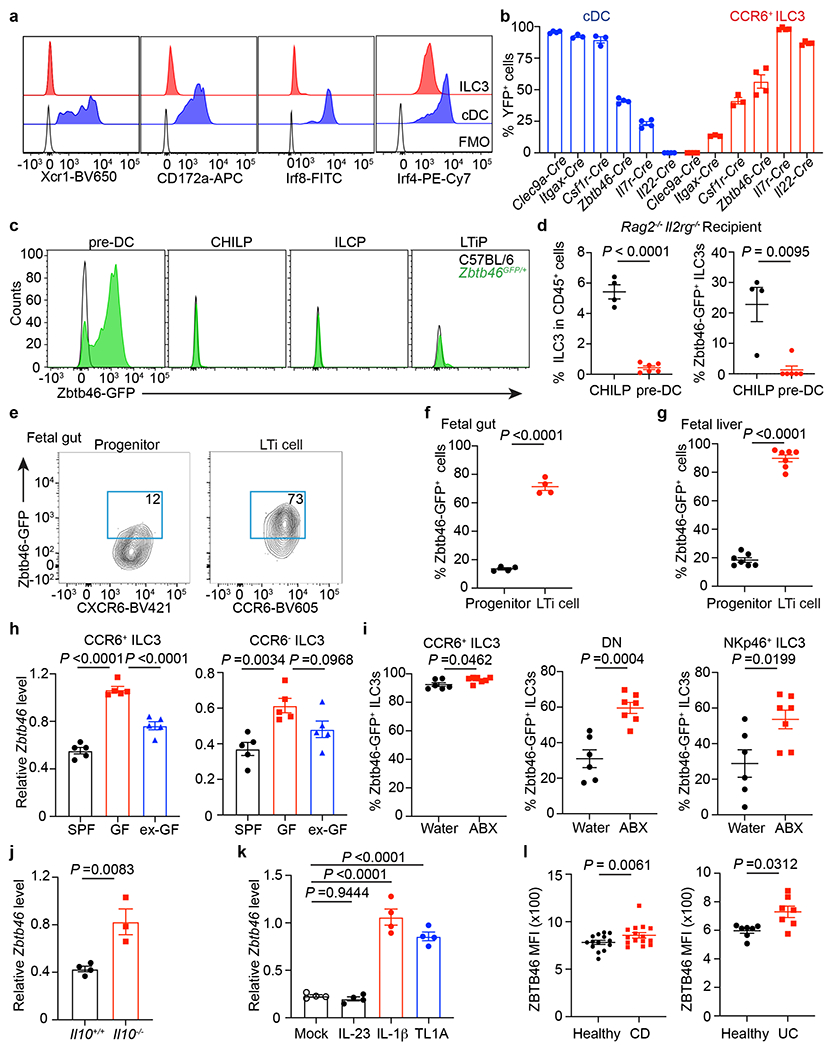
a. Histogram of indicated markers. FMO: full staining minus one. b. Quantification of YFP+ cells in the large intestine of indicated fate-mapping mice (n = 3 or 4 mice). c. Representative histograms for indicated cells from the bone marrow. d. ILC3 frequency (left, n = 4 or 6 mice) and Zbtb46-GFP+ ILC3s (right, n = 4 or 6 mice) from the intestine of Rag2−/−Il2rg−/− recipient mice. e,f. Representative plots and quantification from fetal gut of Zbtb46GFP/+ mouse embryos at E14.5 (each dot represents 2 pooled embryos, n = 8 embryos). g. Quantification of frequencies of cells from fetal liver of Zbtb46GFP/+ mouse embryos at E14.5 (n = 7 embryos). h. Zbtb46 mRNA relative to Hprt in cells sorted from the large intestine by qPCR (n = 5 mice). i. Quantification of cells from the large intestine of Zbtb46GFP/+ mice (n = 6 or 7 mice). j. Zbtb46 mRNA relative to Hprt in cells from the large intestine (n = 4 or 3 mice). k. Zbtb46 mRNA relative to Hprt of ex vivo stimulated CCR6+ ILC3s (n = 4 mice). l. Quantification of ZBTB46 MFI in ILC3s from the intestine of CD, UC, or matched healthy donors (n = 14 individual healthy donors versus 15 CD donors; n = 7 individual healthy versus UC donors). Data in a, b, c, e-k are representative of two or three independent experiments; data in d are pooled from two independent experiments. Data are shown as the means ± S.E.M. Statistics are calculated by two-tailed unpaired Student’s t-test in d (left panel), f, g, i, and j; two-tailed Mann-Whitney test in d (right panel); one-way ANOVA with Dunnett’s multiple comparisons in h and k; two-tailed Wilcoxon test in l.
Factors regulating Zbtb46 in ILC3s
We next sought to understand what regulates Zbtb46 expression in ILC3s. We found that fetal LTi cells express Zbtb46 in both the fetal gut and liver, while their immediate progenitors are predominantly negative, indicating that Zbtb46 expression is imprinted early in LTi cell ontogeny and upon maturation (Fig. 2e–g, Extended data Fig. 6d). Using previously published assay for transposase-accessible chromatin using sequencing (ATAC-seq) data27, we found a RORγt (RORE) motif binding site in the Zbtb46 locus of CCR6+ ILC3s and that ex vivo culture of CCR6+ ILC3s with a small molecule inhibitor of RORγt was sufficient to reduce Zbtb46 expression (Extended data Fig. 6e,f). We were unable to identify T-bet binding motifs in the Zbtb46 locus and no impact of T-bet deletion on Zbtb46 expression in ILC3s was observed (Extended data Fig. 6g). These data indicate that RORγt supports Zbtb46 expression in ILC3s upon maturation.
Due to the importance of the microbiota in ILC3 function28, we also examined the expression of Zbtb46 in ILC3s from the intestine of germ-free (GF) mice and conventional specific pathogen free (SPF) mice. CCR6+ ILC3s sorted from GF mice express significantly higher levels of Zbtb46 relative to those from SPF mice and the colonization of GF mice with conventional microbiota (ex-GF) was sufficient to reduce Zbtb46 expression (Fig. 2h). Consistently, Zbtb46GFP/+ reporter mice treated with broad-spectrum antibiotics (ABX) displayed significantly increased frequencies of Zbtb46+ CCR6+ ILC3s in the large intestine (Fig. 2i). This effect was also observed in double negative ILC3s and NKp46+ ILC3s (Fig. 2h, i, Extended data Fig. 6h). These data suggest that the expression of Zbtb46 in ILC3s is modulated following colonization with microbiota. Of note, sex hormones can also impact Zbtb46 expression29, and slightly higher Zbtb46 expression levels were observed in ILC3 subsets from female mice relative to male mice (Extended data Fig. 4d).
A previous study identified that the genomic loci harboring ZBTB46 is associated with pediatric IBD and that the expression of ZBTB46 is significantly increased in total colonic tissue biopsies from IBD patients30. We therefore tested whether ILC3-intrinsic Zbtb46 expression is altered during intestinal inflammation. We first observed that Zbtb46 is significantly elevated in CCR6+ ILC3s from the large intestine of Il10−/− mice which exhibit spontaneous intestinal inflammation relative to co-housed controls (Fig. 2j). Furthermore, the inflammatory cytokines, IL-1β and TL1A, are sufficient to significantly increase Zbtb46 expression in ex vivo CCR6+ ILC3 cultures (Fig. 2k). Further, we investigated a cohort of pediatric IBD patients, including both Ulcerative colitis (UC) and Crohn’s disease (CD) patients (Supplemental Table 1), and observed a significant increase in ZBTB46 protein among ILC3s relative to those from sex- and age-matched healthy controls (Fig. 2l). A significant correlation between ZBTB46 levels in ILC3s and UC disease activity scores was also observed (Extended data Fig. 6i). These data demonstrate that expression of Zbtb46 is imprinted at late stages of differentiation, modulated by microbial stimuli or inflammatory cytokines, and altered in human IBD.
Zbtb46 limits ILC3-mediated inflammation
We next examined the functional significance of Zbtb46 in ILC3s, as it has previously been found to regulate the activation of cDCs31. This was accomplished by crossing Zbtb46-floxed mice with RorcCre mice to generate a conditional Zbtb46 deficiency. Zbtb46 expression was significantly reduced in CCR6+ ILC3s in RorcCreZbtb46f/f mice, while no impacts on Zbtb46 expression were observed in cDCs or T cells (Fig. 3a, Extended data Fig. 7a–d). Comparable frequencies, subset distribution, cytokine production, MHCII expression, and lymphoid organogenesis functions of ILC3s were detected in mice with a lineage-specific deletion of Zbtb46 (Fig. 3b, c, Extended data Fig. 7e–m). However, transcriptome comparison revealed a selective upregulation of proinflammatory pathways in Zbtb46-deficient ILC3s relative to those from littermate controls (Extended data Fig. 7n). Interestingly, Zbtb46-deficient CCR6+ ILC3s exhibited a notable increase in Tnfsf4, Ptgs2 and Il6 transcripts, which were confirmed by transcript quantification or protein staining (Fig. 3d–g, Extended data Fig. 7o, Supplementary Table 2). Moreover, re-analysis of existing ATAC-seq data from intestinal CCR6+ ILC3s27 showed putative Zbtb46 binding sites in the Tnfsf4 and Ptgs2 loci (Extended data Fig. 7p). We then sought to interrogate the biological significance of the enhanced proinflammatory properties of ILC3s in the intestine of RorcCreZbtb46f/f mice. Since OX40L (encoded by Tnfsf4)32,33 and COX-2 (encoded by Ptgs2)34,35 are associated with promoting the activation and function of T effector cells, we examined adaptive immunity in the large intestine of RorcCreZbtb46f/f mice and observed a significantly increased frequency of Th17 cells and associated IL-17A production relative to littermate controls (Fig. 3h, i). We generated a mixed bone marrow chimera between wild type and Zbtb46-deficient mice and observed a striking increased expansion of Zbtb46-deficient ILC3s relative to Zbtb46-sufficient ILC3s, while T cell responses were comparable in the intestine between the two genotypes (Extended data Fig. 8a–g). No phenotype was observed in CD4CreZbtb46f/f mice (Extended data Fig 8h–j). These data demonstrate a cell-intrinsic role for Zbtb46 in ILC3s but not T cells. Furthermore, transient in vivo blockade of OX40L with a neutralization antibody is sufficient to prevent the upregulated Th17 cell response in the intestine of RorcCreZbtb46f/f mice relative to littermate controls (Fig. 3j, k), indicating that Zbtb46 restrains the pro-inflammatory functions of CCR6+ ILC3s in part by controlling the expression of the co-stimulatory molecule OX40L. Next, we tested whether ILC3-specific Zbtb46 impacts intestinal inflammation by infecting RorcCreZbtb46f/f mice and their littermate controls with the enteric pathogen, Citrobacter rodentium. No alterations in Zbtb46 expression among cDCs or T cells occurred in this context, and comparable ILC3 subset composition, proliferation, and cytokine production (including IL-22 levels) was observed after C. rodentium infection (Extended data Fig. 8k–s). However, significantly increased Th17 cells and associated IL-17A production were observed in the large intestine of RorcCreZbtb46f/f mice (Fig. 3l, m). Further, RorcCreZbtb46f/f mice also displayed significantly increased bacterial burdens, shorter colon length, and more severe inflammation-associated pathology, including increased immune cell infiltration, elongated colonic crypts, and disrupted epithelial structures, relative to littermate controls (Fig. 3n–p). Taken together, these data demonstrate that Zbtb46 functions to restrain the proinflammatory properties of CCR6+ ILC3s and protect from intestinal inflammation.
Figure 3. Zbtb46 restrains ILC3s and limits intestinal inflammation.
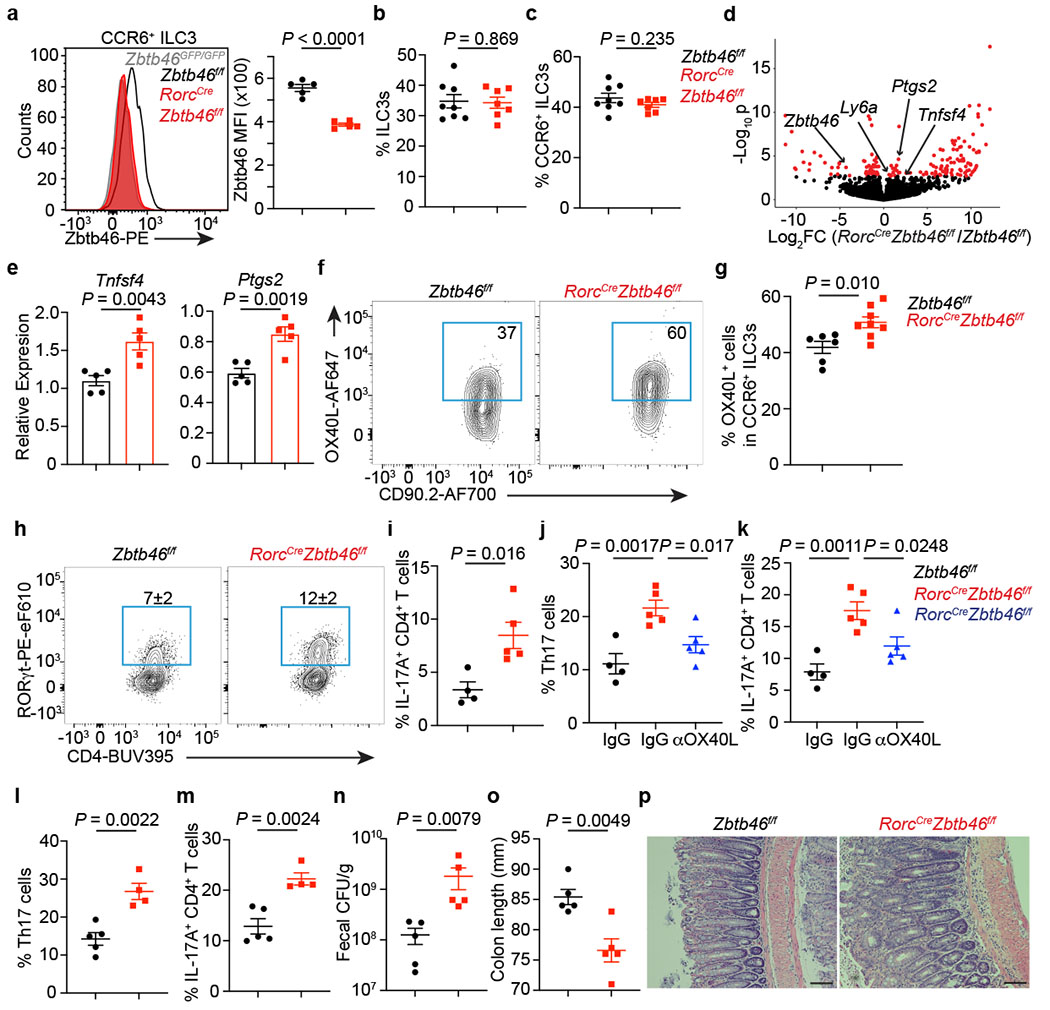
a. Quantification of Zbtb46 MFI among cells (n = 5 mice). b. Frequency of ILC3s among Lin−CD90+CD127+ cells (n = 8 or 7 mice). c. Quantification of CCR6+ ILC3s (n = 8 or 7 mice). d. Differential gene expression in CCR6+ ILC3s. Red points are significantly different. e. qPCR of indicated genes (n = 5 mice). f,g. Quantification of OX40L+CCR6+ ILC3s (n = 6 or 8 mice). h. Quantification of Th17 cells gated on FoxP3−CD4+ T cells (n = 4 or 5 mice). i. Quantification of IL-17A+CD4+ T cells (n = 4 or 5 mice). j. Quantification of Th17 cells (n = 4, 5, or 5 mice). k. Quantification of IL-17A+CD4+ T cells (n = 4, 5, or 5 mice). l-p. Mice were orally infected with C. rodentium. l. Quantification of Th17 cells at day 13 post infection (dpi) gated on FoxP3−CD4+ T cells (n = 5 or 4 mice). m. Quantification of IL-17A+CD4+ T cells from infected mice (n = 5 or 4 mice). n. Quantification of fecal colony-forming units (CFU) at 8 dpi (n = 5 mice). o. Colon length (n = 5 mice) at 13 dpi. p. H&E staining of the distal colon at 13 dpi. All data are on cells isolated from the large intestine unless otherwise noted. Data in a, e, h, i, j, k, l-p are representative of 3 or 4 independent experiments. Data are pooled from two independent experiments in b, c, and g. Data are shown as the means ± S.E.M in a-c, e, g, i-o, and means ± S.D. in h. Statistics are calculated by two-tailed unpaired Student’s t-test in a-c, e, g, i, l-o; one-way ANOVA with Dunnett’s multiple comparisons in j and k. Scale bar: 100 μm.
Zbtb46+ ILC3s protect the intestine
Prior reports suggest functional redundancy among RORγt+ lymphocytes36–38. Our discovery of Zbtb46+ ILC3s allows new opportunities to determine their functional significance and potential redundancy with other RORγt+ immune cells. To further investigate the function of Zbtb46+ ILC3s, we examined our single-cell RNA sequencing data and identified that Il22 is specifically and highly enriched among Zbtb46+ ILC3s over other RORγt+ immune cells (Fig. 4a, Extended data Fig. 9a). Using IL-22 protein staining, Il22-eGFP reporter mice, and Il22Cre fate-mapping mice, we further confirmed that IL-22 is dominantly produced by Zbtb46+ CCR6+ ILC3s in the large intestine (Fig. 4b, c, Extended data Fig. 9b–d). Zbtb46 is specifically expressed by cDCs and ILC3s, and RORγt is not expressed by Zbtb46+ cDCs or endothelial cells in the intestine (Extended data Fig. 2). Therefore, we crossed RORγt-floxed mice with Zbtb46Cre mice to generate an exclusive deletion of RORγt in Zbtb46+ ILC3s and to define the functional role of Zbtb46+ ILC3s in intestinal health and disease. ILC3 frequency, particularly among the CCR6+ ILC3 subset, was significantly reduced in the large intestine of Zbtb46CreRorcf/f mice relative to the littermate controls at steady state, while the frequencies of cDCs and other immune cells were not affected (Fig. 4d–h, Extended data 9e–k). As expected, the innate source of IL-22 was significantly decreased in Zbtb46CreRorcf/f mice relative to littermate controls, while T cell-derived IL-22 was not impacted (Extended data Fig. 9l–n). We also observed that loss of RORγt significantly reduced Zbtb46 expression in ILC3s (Extended data Fig. 10a–f), further indicating that RORγt modulates Zbtb46 expression in ILC3s.
Figure 4. Zbtb46+ ILC3s are non-redundant in controlling intestinal inflammation.
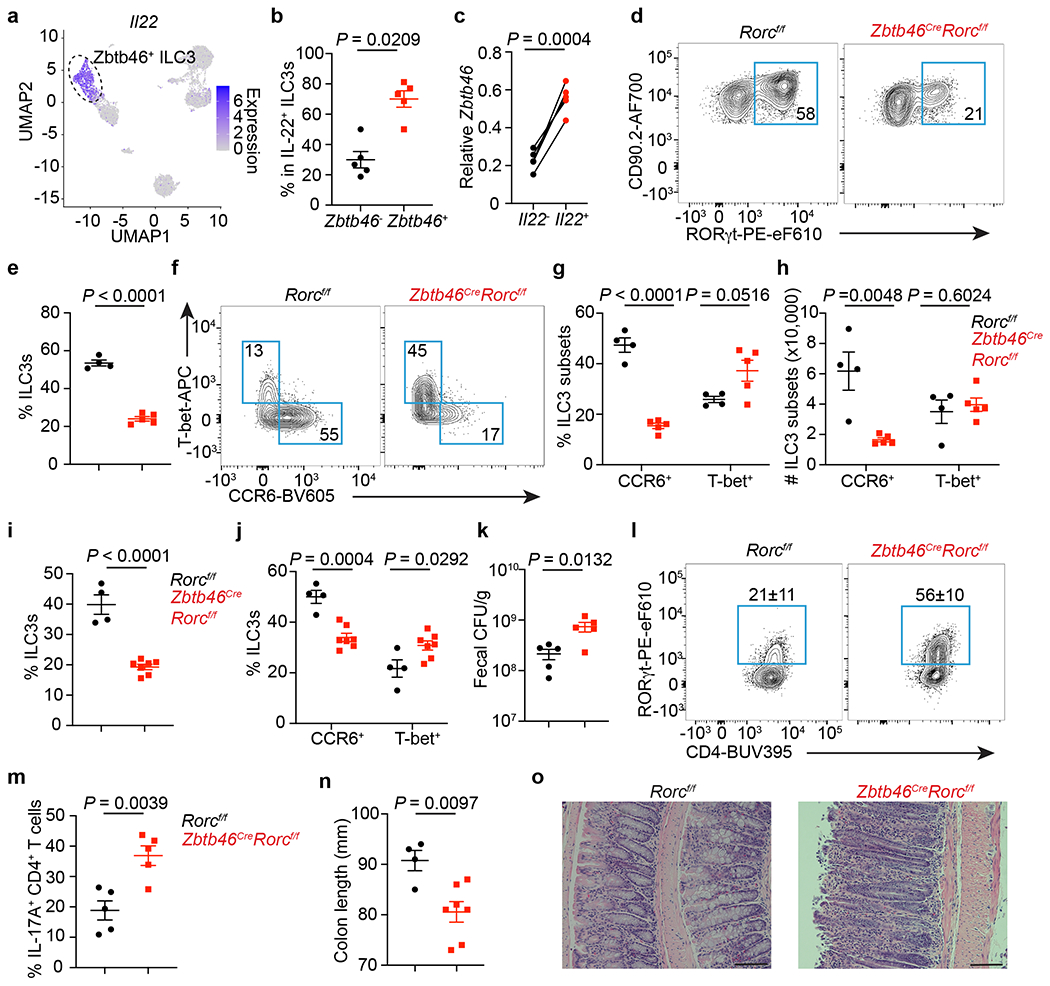
a. UMAP of Il22 expression among RORγt+ immune cells from the large intestine. Dash circle indicates Zbtb46+ ILC3s. b. Quantification of IL-22+ cells among Zbtb46+ versus Zbtb46− ILC3s (n = 5 mice). c. Zbtb46 mRNA relative to Hprt in ILC3s sorted from the large intestine of Il22-eGFP reporter mice (n = 5 mice). d,e. Flow plots and the frequency of ILC3s in Lin−CD90+CD127+ cells from the large intestine (n = 4 or 5 mice). f,g. Flow plots and quantification of ILC3 subsets in the large intestine (n = 4 or 5 mice). h, Cell numbers of ILC3 subsets in the large intestine (n = 4 or 5 mice). i-o. Mice were orally infected with C. rodentium. i. The frequency of ILC3s in Lin−CD90+CD127+ cells from the large intestine at 14 dpi (n = 4 or 7 mice). j. Quantification of ILC3 subsets in the large intestine at 14 dpi (n = 4 or 7 mice). k. Fecal CFU at 10 dpi (n = 5 mice). l. Flow plots and quantification of Th17 cells gated on FoxP3−CD4+ T cells from the large intestine at 14 dpi (n = 5 mice). m. Quantification of IL-17A+ cells in CD4+ T cells from the large intestine at 14 dpi (n = 5 mice). n. Colon length at 14 dpi (n = 4 or 7 mice). o. H&E staining of the distal colon at 14 dpi. Data in b-n are representative of two or three independent experiments. Data are shown as the means ± S.E.M in b, c, e, g-k, m, n, and means ± S.D. in l. Statistics are calculated by two-tailed unpaired Student’s t-test in b, e, g-k, m, n, and two-tailed paired t-test in c. Scale bar: 100 μm.
We next investigated whether Zbtb46+ ILC3s play a unique role in regulating intestinal immunity or inflammation by infecting mice with C. rodentium. The frequency of ILC3s and CCR6+ ILC3s remained decreased in the large intestine of Zbtb46CreRorcf/f mice after infection (Fig. 4i, j, Extended data Fig. 9o) and a significant increase in bacterial burden was observed in the feces (Fig. 4k). Despite the essential role of IL-22 in immunity to C. rodentium39–41 and the dominant role of Zbtb46+ ILC3s in producing IL-22 in the healthy intestine, Zbtb46CreRorcf/f mice exhibited only a modest reduction in survival following infection (Extended data Fig. 9p). This may result from the remaining IL-22 produced by RORγt-negative ILCs or residual CCR6+ LTi-like ILC3s in Zbtb46CreRorcf/f mice (Extended data Fig. 9l–m), or a potential compensation by other IL-22-producing cell types42,43. In support of the latter, Th17 cells, but not γδT cells, were significantly increased in Zbtb46CreRorcf/f mice following C. rodentium infection (Fig. 4l, m, Extended data Fig. 9q). While compensating for impaired innate immunity, this elevated local Th17 cell response could exacerbate intestinal inflammation44. Indeed, severe inflammation-associated pathology, including enhanced leukocyte infiltration and elongated colonic crypts, as well as a significant reduction in colon length, was observed in mice lacking Zbtb46+ ILC3s after C. rodentium infection (Fig. 4n, o). These data collectively demonstrate that Zbtb46+ ILC3s have an essential and non-redundant role in controlling intestinal inflammation induced by bacterial infection.
RORγt expressing immune cells are critical to maintain intestinal health and homeostasis but, when dysregulated, are major drivers of intestinal inflammation1–15. Our results provide a comprehensive single cell atlas of the complete cellular heterogeneity among RORγt expressing immune cells in the intestine. We identify an absence of RORγt+ cDCs, and rather that the CCR6+ or LTi-like ILC3 subset expresses Zbtb46, a transcriptional regulator employed by cDCs. This further elaborates on the transcriptional networks in the ILC3 family and represents a fundamental advance as Zbtb46 was previously thought to be restricted to cDCs in the mammalian immune system and is widely utilized to probe the function of cDCs in immunity, inflammation, and tolerance16–20. Further, Zbtb46 functionally restricts the pro-inflammatory properties of CCR6+ ILC3s in mice, and this repressive transcription factor critically limits the ability of these ILC3s to contribute to tissue inflammation (Extended data Fig. 10g). While multiple pro-inflammatory pathways become overexpressed upon loss of Zbtb46 in ILC3s, it is notable that several are associated with co-stimulation such as OX40L, suggesting potential overlap for Zbtb46 in restraining the inflammatory potential of both cDCs and ILC3s as it relates to antigen presentation and interactions with adaptive immunity. However, further investigations are required to determine whether Zbtb46 regulates the chromatin landscape and pathways shared by cDCs and ILC3s. Zbtb46 is also overexpressed in the inflamed intestine of IBD patients, which could contribute to the overall reduction of ILC3s observed in IBD22,45, since in some contexts overexpression of Zbtb46 reduces cell proliferation46. Thus, Zbtb46 could represent a novel therapeutic target for the development of small molecules geared towards treating inflammatory diseases. Finally, our findings define that the Zbtb46+ subset of ILC3s are essential and non-redundant in controlling intestinal inflammation, demonstrating functional dichotomy of RORγt+ lymphocytes in the context of intestinal health, enteric infections and IBD.
Materials and methods
No statistical methods were used to predetermine sample size. The experiments were not randomized. The investigators were not blinded to allocation during experiments and outcome assessment.
Mice.
C57BL/6 mice were obtained from Jackson Laboratories and used at 6-12 weeks of age. Both female and male mice were used in this study. All transgenic mice were bred and maintained in specific pathogen-free facilities with 12-hour light/dark cycle, an average ambient temperature of 21°C, and an average humidity of 48% at Weill Cornell Medicine and littermates were used as controls in all experiments. RORγt-EGFP and RorcCre mice on C57BL/6 background were provided by G.E. Zbtb46GFP/GFP (JAX no. 027618)16, Csf1rCre (JAX no. 029206)47, CD11cCre (JAX no. 008068)48, Clec9aCre (JAX no. 025523)26, Il22Cre (JAX no. 027524)49, ROSA26lsl-EYFP (JAX no. 006148)50, Rorcf/f (JAX no. 008771)51, IL22-eGFP reporter (JAX no. 035005)23, Tbx21−/− (JAX no. 004648)52, Il10−/− (JAX no. 002251)53, CD4Cre (JAX no. 022071)54, Zbtb46Cre (JAX no. 028538)55 and Zbtb46f/f (JAX no. 026850)31 were purchased from Jackson Laboratories. Rag2−/−Il2rg−/− mice (TAC no. 4111) were purchased from Taconic. Il7rCre mice56 were kindly provided by Dr. Artis (Weill Cornell Medicine) with permission from H.R. Rodewald. C57BL/6 germ-free mice were maintained at the gnotobiotic facility at Weill Cornell Medicine. Sex- and age-matched mice were used for all experiments. All experiments were approved and performed according to the Institutional Animal Care and Use Committee guidelines at Weill Cornell Medicine.
Isolation of lamina propria immune cells from the intestine of mice and humans.
Whole large intestine or small intestine were dissected from mice. Mesenteric fat tissue and Peyer’s patches on the small intestine were carefully removed. Intestines were opened longitudinally and extensively cleaned with cold DPBS (Corning). Intestine tissue was cut into approximately 0.5-cm sections. To dissociate epithelial cells, intestine tissue was incubated in HBSS with 5 mM EDTA (Thermo Fisher Scientific), 1 mM DTT (Sigma Aldrich), and 2% FBS twice at 37°C for 20 minutes. After incubation, the tissue was vortexed, transferred to digestion buffer containing dispase (0.4 U/ml; Thermo Fisher Scientific), collagenase III (1 mg/ml; Worthington), DNase I (20 μg/ml; Sigma-Aldrich), and 10% FBS in RPMI 1640 (Corning), and incubated in a shaker with 200 rpm for 1 hour at 37°C. Leukocytes were enriched by a 40/80% Percoll (GE Healthcare) gradient centrifugation.
To quantify ZBTB46 protein levels, intestinal biopsies from the colon of pediatric individuals with Ulcerative colitis or Crohn’s disease and sex- and age-matched controls with no inflammatory bowel disease were obtained following Institutional-Review-Board-approved protocols from the JRI IBD Live Cell Bank Consortium at Weill Cornell Medicine (protocol number 1503015958). Informed consent was obtained from all subjects. Biopsies were cryopreserved in 90% FBS and 10% DMSO for future side-by-side comparisons. Following thawing, biopsy tissues were digested in RPMI 1640 with Collagenase D (0.5 mg/ml; Roche), DNase I (20 μg/ml), and 5% FBS for 1 hour at 37°C with shaking. After digestion, remaining tissues were further dissociated mechanically by a syringe plugger. Cells were filtered through a 70 μm cell strainer and used directly for staining.
For human tonsils and intestinal resections, samples were provided by the Cooperative Human Tissue Network (CHTN), which is funded by the National Cancer Institute. Other investigators may have received specimens from the same subjects. Samples were provided as entirely de-identified human specimens with diagnoses confirmed by medical records and trained pathologists. This protocol was reviewed by the Weill Cornell Medicine IRB and determined to meet the Exemption Category 4 of HHS 45 CFR 46.104(d). Additional oversight of the CHTN is outlined at www.chtn.org. Tonsils were dissociated mechanically by a syringe plunger and cells were filtered through 70 μm cell strainer and cryopreserved in 90% FBS and 10% DMSO for a future side-by-side comparison. Following thawing, cells were used directly for staining.
To quantify ZBTB46 expression in human intestinal immune cells, surgical-resection samples from either the non-inflamed small intestine or the colon were provided by the CHTN. Other investigators may have received specimens from the same subjects. Intestinal resections were first incubated in stripping buffer (1 mM EDTA, 1 mM DTT, and 5% FBS in RPMI 1640) at 37°C with shaking for 30 minutes to remove epithelial layer. Intestinal tissues were then minced by sterile scalpel and digested in RPMI 1640 with Collagenase D (0.5 mg/ml), DNase I (20 μg/ml), and 5% FBS for 1 hour at 37°C with shaking. After digestion, remaining tissues were further dissociated mechanically by a syringe plugger. Cells were filtered through a 70 μm cell strainer and cryopreserved in 90% FBS and 10% DMSO for future side-by-side comparisons. Following thawing, cells were used directly for surface staining and sorting.
Cell isolation from the lung, adipose tissue, skin, and salivary gland.
Lungs were chopped and incubated in RPMI medium supplemented with Liberase™ (50 μg/ml; Roche) and DNaseI (20 μg/ml) for 1 hour at 37°C. The remaining tissues were mashed with a syringe plunger, and single-cell suspensions were filtered through a 40μm cell strainer. Leukocytes were then further enriched by 40% Percoll gradient centrifugation, and red blood cells were lysed with TheraPEAKTM ACK lysis buffer (Lonza). For adipose tissue, perigonadal white adipose tissues were harvested and digested in collagenase type II (1 mg/ml; collagenase from Clostridium histolyticum, Sigma-Aldrich, C6885-5G) in Dulbecco’s modified Eagle’s medium (DMEM) (Gibco) at 37°C with shaking at 200 rpm for 45 min. Digested tissues were filtered through a 70 μm strainer and centrifuged at 600g for 10 min. Floating adipocytes were removed, and red blood cells were lysed with TheraPEAKTM ACK lysis buffer (Lonza). To isolate cells from the skin, ears were cut, minced, and digested in 400 μg/ml Liberase™ (Sigma 5401119001) and 60 μg/ml DNaseI (Sigma) in 10% FBS for 90 min at 37°C under agitation. After digestion, the cell suspension was passed through a 70 μm cell strainer and used for directly staining. For salivary gland, submandibular and sublingual glands were isolated, cut into small pieces, and digested with 1 mM collagenase D, 5 mM CaCl2 in 10% FBS RPMI 1640 buffer for 1 hour at 37°C with shaking. Cells were passed through a 70 μm cell strainer, and immune cells were enriched by 40/80% Percoll (GE Healthcare) gradient centrifugation.
Cell isolation from fetal gut and fetal liver.
Fetal gut was isolated from embryos at E14.5 under a dissecting microscope. Tissue was cut into small pieces and digested with 25 μg/ml Liberase™ (Sigma 5401119001) and 50 μg/ml DNaseI (Sigma) in 10% FBS for 1 hour at 37°C under agitation. After digestion, remaining tissues were further dissociated mechanically by a syringe plunger. Cells were filtered through a 70 μm cell strainer and used directly for staining. Intestine from 2 embryos were pooled together as one sample. For fetal liver, tissue from E14.5 embryos was dissociated by vigorously pipetting using a 1,000 ul pipette. Cell suspension was then filtered through 70 μm strainer, washed with FACS buffer followed by red blood cell lysis using TheraPEAKTM ACK lysis buffer (Lonza).
Flow cytometry and cell sorting.
Single cell suspensions were first blocked with anti-CD16/32 antibody (BD Biosciences, 2.4G2) and then incubated on ice with conjugated antibodies in PBS containing 1% FBS and 0.25mM EDTA. Dead cells were excluded by Fixable Aqua Dead Cell Stain (Thermo Fisher Scientific). The flow cytometry antibodies were purchased from Thermo Fisher Scientific, Biolegend or BD Biosciences. Antibodies targeting TCRβ (H57-597), B220 (RA3-6B2), CCR6 (29-2L17), CD3ε (145-2C11), CD4 (RM4-5), CD5 (53-7.3), CD8α (53-6.7), CD11b (M1/70), CD11c (N418), CD19 (eBio1D3), Ly6G (1AB-Ly6G), TCRγδ (GL3), CD45 (30-F11), CD64 (X54-5/7.1), CD90.2 (30-H12), CD127 (A7R34), F4/80 (BM8), MHC-II (M5/114.15.2), NK1.1 (PK136), NKp46 (29A1.4), Xcr1 (ZET), CD172a (P84), CD132 (TUGm2), CD135 (A2F10), CD117 (ACK2), CD25 (PC61.5), α4β7 (DATK32), Klrg1 (2F1/KLRG1), ST2 (DIH4), CXCR6 (SA051D1), OX40L (RM134L) were used for surface staining in mouse. Zbtb46 (U4-1374), Foxp3 (FJK-16S), Gata3 (L50-823), IL-17A (eBio 17B7), IL-22 (IL22JOP), IFN-γ (XMG1.2), Ki-67 (SolA15), RORγt (B2D), PLZF (9E12), Irf4 (IRF4.3E4), Irf8 (V3GYWCH), COX-2 (EPR18377-106), anti-rabbit IgG (Poly 4064), rat IgG1 isotype control (R3-34) and T-bet (eBio4B10) were used for intracellular staining. Lineage markers for mouse are: CD3ε, CD5, CD8α, NK1.1, TCRγδ, Ly6G, CD11b, CD11c, B220, F4/80. All mouse antibodies were used at 1:200 dilution, except for CCR6, CD64, OX40L, Zbtb46, which were used at 1:100 dilution, and MHCII, Ki67, COX-2 used at 1:300 dilution. For human cells staining, antibodies against CD3ε (UCHT1), CD11c (3.9), CD14 (TuK4), CD19 (HIB19), CD34 (581), CD45 (HI30), CD94 (DX22), CD117 (104D2), CD123 (6H6), CD127 (A019D5), FcεR1 (AER-37), CD64 (10.1), and MHCII (L243) were used for surface staining. Antibodies targeting RORγt (Q21-559) and Zbtb46 (U4-1374) were used for intracellular staining. Human ILC3s were gated as CD45+CD3−CD11c−CD14−CD19−CD34−CD94−CD123−FcεR1−CD127+CD117+ for sorting; macrophages were gated as CD45+CD3−CD19−CD64+MHCII+; cDCs were gated as CD45+CD3−CD19−CD64−CD11chi MHCIIhi; T cells were gated as CD45+CD3+CD4+, and B cells were gated as CD45+CD3−CD19+. For analysis, human ILC3s were gated as CD45+CD3−CD11c−CD14−CD19−CD34−CD94−CD123−FcεR1−CD127+CD117+ RORγt+. All human antibodies were used at 1:200, except for RORγt and Zbtb46 which were used at 1:50.
For transcription factors, cells were first stained for surface markers, followed by fixation and permeabilization according to the manufacturer’s protocol (FoxP3 staining buffer set from Thermo Fisher Scientific, cat# 00-5123-43). For cytokines, cells were stimulated in RPMI 1640 with 10% FBS, phorbol 12-myristate 13-acetate (PMA) 50 ng/ml (Sigma Aldrich), ionomycin 750 ng/ml (Sigma Aldrich) and brefeldin A 10 μg/ml (Sigma Aldrich) for 4 hours. All flow cytometry experiments were performed by a Fortessa flow cytometer and the FACS Diva software (BD Biosciences) and analyzed by FlowJo v. 10 software. FACSAria II cell sorter (BD Biosciences) was used for cell sorting.
Single cell RNA-Sequencing and bulk RNA-Sequencing.
For single cell RNA-sequencing, two populations CD45+TCRβ+GFP+ (T cells) and CD45+TCRβ−GFP+ (non-T cells) were sorted from the large intestine of RORγt-EGFP mice and mixed equally at 1:1 ratio to enrich the non-T cell populations. Cells were pooled from 3 individual mice. scRNA-Seq libraries were generated using the 10X Genomics Chromium system with 3’ version 3 chemistry. Libraries were sequenced on an Illumina NovaSeq instrument. Reads were processed by 10X’s Cell Ranger version 3.1.0 using the mm10 reference genome, resulting in a filtered HDF5 file. scRNA-Seq data were further processed and analyzed using R version 3.6.3 (R Core Team 2020) and the Seurat package version 3.2.357. Specifically, Cell Ranger output was imported using the Read10X_h5 function. Seurat objects were created using only genes appearing in at least 3 cells. Cells were further filtered to exclude those with fewer than 600 genes detected, more than 5000 genes detected, or more than 10 percent mitochondrial reads. Read counts were then normalized using the NormalizeData function. The graph representing cells with similar expression patterns was generated with the FindNeighbors function using the 20 largest principal components. Cell clusters were generated using the Louvain algorithm implemented by the FindClusters function with resolution parameter equal to 0.4. Marker genes for each cluster were determined using the Wilcoxon test on the raw counts, implemented by the function FindAllMarkers, and including only positive marker genes with log fold changes greater than 0.25 and Bonferroni-corrected p values less than 0.01. Cluster names were determined by manual inspection of the lists of cluster marker genes. Dimensionality reduction by Uniform Manifold Approximation and Projection was performed using the RunUMAP function with the 20 largest principal components. All visualizations of scRNA-Seq data were generated using the Seurat package as well as ggplot2 version 3.3.358.
For bulk RNA-Sequencing, ILC3s (CD45dimLin−CD90.2hiCD127+CCR6+) were sort-purified from the large intestine of Zbtb46f/f and RorcCreZbtb46f/f mice. Each group includes 4 biological replicates. RNA sequencing libraries were generated by the Epigenomics Core at Weill Cornell Medicine using the Clontech SMARTer Ultra Low Input RNA Kit V4 (Clontech Laboratories). An Illumina NextSeq instrument was used to generate 50-bp single-end reads. Raw sequencing reads were demultiplexed with Illumina CASAVA (v.1.8.2). Adapters were trimmed from reads using FLEXBAR59 and reads were aligned to the NCBI GRCm38/mm10 mouse genome using the STAR aligner (v.2.3.0)60 with default settings. Reads per gene were counted using the featureCounts function of the Rsubread R package61. Differential expression was assessed using DESeq262 version 1.26.0 with default parameters and with a false discovery rate of 0.1.
Progenitor cells transfer.
Bone marrow from both femur and tibia of hind legs of Zbtb46GFP/+ was collected, lysed with TheraPEAKTM ACK lysis buffer (Lonza) to remove red blood cells, and then passed through 70 μm cell strainer. Cell suspensions were directly stained with antibodies. Pre-DC was gated as CD45+Lin−CD127−MHCII−CD135+CD11c+CD117−CD16/32−GFP+; CHILP was gated as CD45+Lin−CD11c−CD127+CD135−α4β7+CD117+CD25−; Lineage markers included Ter119, B220, CD19, CD3, CD5, NK1.1, and Ly6G. Rag2−/−Il2rg−/− mice were used as the recipient mice. 20,000 cells of pre-DC or 800-1000 cells of CHILP were transferred into recipient mouse by intravenous injection. The intestine of recipient mice was analyzed 6 weeks later. For Zbtb46-GFP expression analysis in different progenitors from the bone marrow: ILCP was gated as Lin−CD45+CD127+α4β7+CD117+Flt3−PLZF+RORγt−. LTiP was gated as Lin−CD45+CD127+α4β7+CD117+Flt3−PLZF−RORγt+.
Quantitative PCR.
Sort-purified cells were lysed using Buffer RLT plus lysis buffer (QIAGEN). RNA was purified using RNeasy plus mini kits (QIAGEN) according to the manufacturer’s instructions. First-strand cDNA was generated using Maxima First Strand cDNA synthesis kit according to the protocol provided by the manufacturer (Thermo Fisher Scientific, cat# K1642). Power SYBR green PCR Master Mix (Thermo Fisher Scientific, cat# 4367660) was used for Real-time qPCR with ABI7500 (Applied Biosystems). Gene expression was normalized to internal controls Hprt or Actb for mouse samples or ACTB for human samples.
C. rodentium infection.
C. rodentium were cultured in LB broth overnight at 37°C with constant shaking and 1-2x10⁹ bacteria were used to infect mice by oral gavage. Fecal pellets were collected at day 8 or day 10 to count the fecal CFU of C. rodentium. Mice were sacrificed at 13-16 days post infection for analysis. The colon length was measured, and distal colon was used for histological analysis.
Antibiotics administration and ex-GF mice generation.
Zbtb46GFP/+ mice were used. A cocktail of antibiotics (0.25 mg/ml vancomycin, 0.5 mg/ml ampicillin, 0.5 mg/ml neomycin, 0.5 mg/ml gentamycin, and 0.5 mg/ml metronidazole) was continuously administered through drinking water for 2 weeks. To generate ex-GF mice, cecum contents from C57BL/6J mice were collected and resuspended in PBS supplemented with 10% glycerol. 200 μl fresh fecal suspension was administered to recipient germ-free mice by oral gavage. Inoculated animals were subsequently maintained in a sterile isocage with autoclaved food and water for two weeks before analyzing.
Neutralization antibody in vivo blockade.
Anti-OX40L (clone RM134L) antibody was purchased from BioXCell and administered intraperitoneally twice every week at a dose of 500 μg/mouse for two weeks. IgG (Sigma-Aldrich, I4131) was used as a control.
Ex vivo cytokine stimulation.
CCR6+ ILC3s were sort-purified from the small intestine of C57BL/6 mice and stimulated with 10 ng/ml IL-23, 10 ng/ml IL-1β, or 50 ng/ml TL1A for 4 hours.
ATAC-seq analysis.
Four CCR6+ ILC3 ATAC-seq data (GSM3208782, GSM3208785, GSM3208763, GSM3208764) from a previous study27 were downloaded from the SRA database. The raw data were processed with the ENCODE ATAC-seq pipeline (https://github.com/ENCODE-DCC/atac-seq-pipeline). The reads were trimmed, filtered and aligned against NCBI GRCm38/mm10 mouse genome using Bowtie263. PCR duplicates and reads mapped to the mitochondrial chromosome or repeated regions were removed. The Integrative Genomics Viewer was used for data visualization64.
Histological staining.
Large intestinal swiss rolls were fixed in 4% paraformaldehyde and embedded in paraffin. 5-μm sections were stained with hematoxylin and eosin. Images were taken using a Nikon Eclipse Ti microscope and NIS-Elements 4.30.02 software (Nikon).
Statistical analysis.
All statistical analyses were performed by Graph Pad Prism V9 software. Paired or unpaired two-tailed Student’s t-test, Mann-Whitney test (for data set not normally distributed), or One-way ANOVA with 95% confidence interval followed by Dunnett’s multiple comparison, was used to determine the P value of each data set generated from mice. One-way ANOVA Kruskal-Wallis test with Dunn’s multiple comparisons, or two-tailed Wilcoxon test was used to analyze data sets generated from humans. P values less than 0.05 were considered as significant. Simple linear regression was used to determine the P value of correlation. Log-rank (Mantel-Cox) test was used to determine the P value of survival rate.
Data availability.
All data necessary to understand and evaluate the conclusions of this paper are provided. Bulk RNA-Seq data have been deposited in the Gene Expression Omnibus database under the accession number GSE181865, scRNA-Seq data are under the accession number GSE181864.
Extended Data
Extended Data Figure 1. Gating of immune cells from the large intestine of mice.
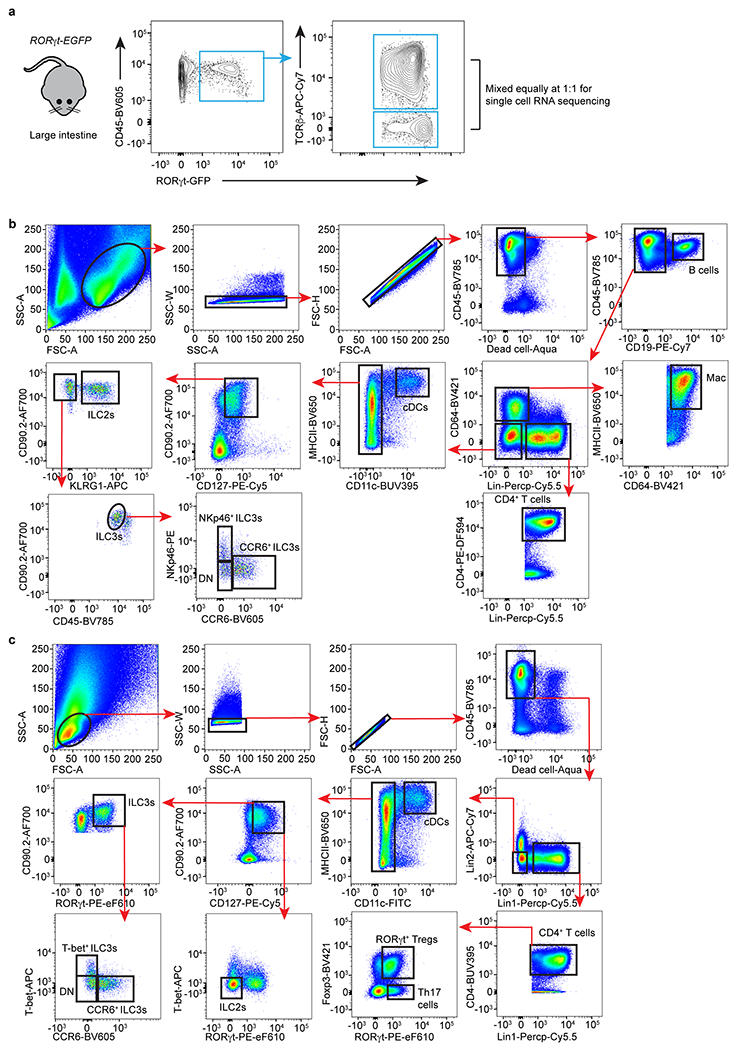
a. Cells were isolated from the large intestine lamina propria of RORγt-EGFP reporter mice. Two populations, TCRβ+ cells and TCRβ− cells, of RORγt+ immune cells were sorted separately and equally mixed at a 1:1 ratio, permitting enrichment of non-T lymphocytes populations. b. Gating strategy for different immune cells with surface markers. Lineage markers included: CD3, CD5, NK1.1, TCRγδ, Ly6G. B cells were gated as CD45+CD19+; Macrophages (Mac) were gated as CD45+CD64+MHCII+; cDCs were gated as CD45+Lin−CD64−CD11hiMHCIIhi. CD4+ T cells were gated as CD45+Lin+CD4+; ILC2s were gated as CD45+Lin−CD64−CD11c−CD127+CD90+KLRG1+; ILC3s were gated as CD45dimLin−CD64−CD11c−CD127+CD90hiKLRG1−; ILC3s were further gated as CCR6+, NKp46+ or DN subset. c. Gating strategy for different immune cells with transcription factors. Lineage 1: CD3, CD5, NK1.1, TCRγδ, Ly6G. Lineage 2: F4/80 and B220. cDCs were gated as CD45+Lin−CD11hiMHCIIhi; Th17 cells were gated as CD45+Lin+CD4+FoxP3−RORγt+; ILC3s were gated as CD45+Lin−CD11c−CD127+CD90+RORγt+, and further gated as CCR6+, T-bet+, or DN; ILC2s were gated as CD45+Lin−CD11c−CD127+CD90+RORγt−T-bet−.
Extended Data Figure 2. RORγt expression among ILCs and cDCs.
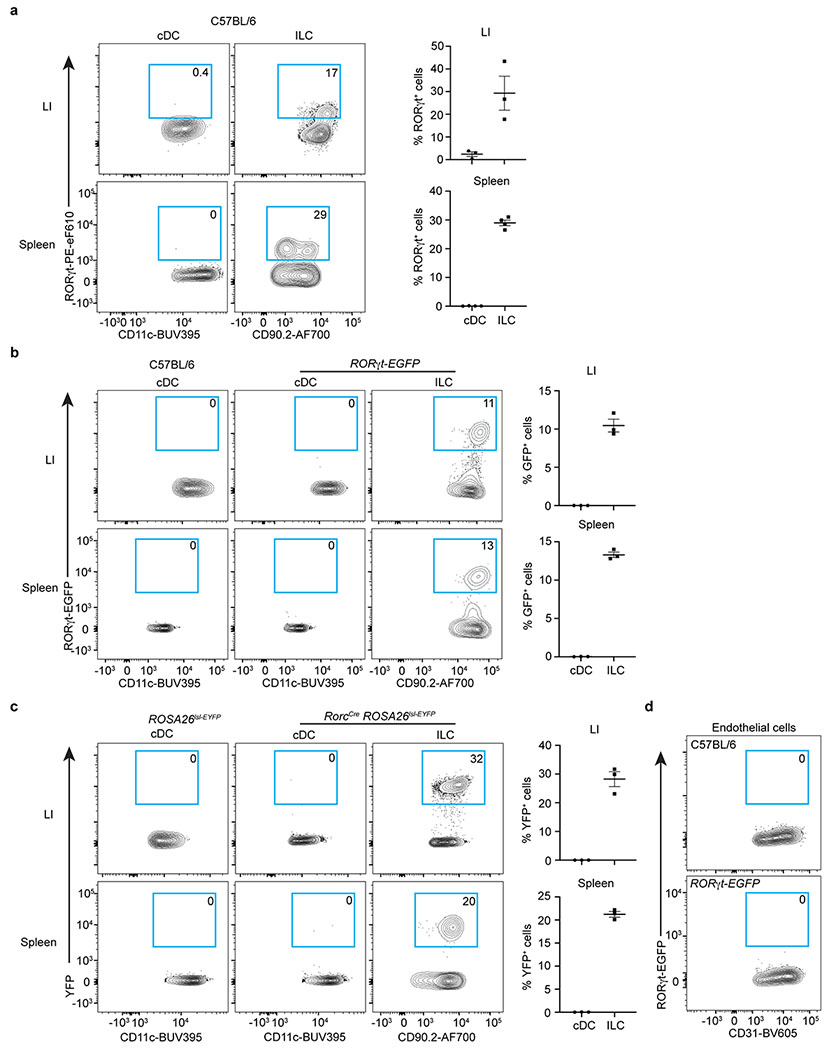
a. Representative flow cytometry plots and quantifications of RORγt+ cells in cDCs and ILCs in the large intestine (LI) (n = 3 mice) or spleen of C57BL/6 mice by protein staining (n = 4 mice). ILCs were gated as CD45+Lin−CD11c−CD127+CD90.2+. b. Representative flow cytometry plots and quantifications of RORγt-GFP+ cells in cDCs and ILCs in RORγt-EGFP reporter mice (n = 3 mice). c. Representative flow cytometry plots and quantifications of YFP+ cells in cDCs and ILCs in RorcCreROSA26lsl-EYFP fate mapping mice (n = 3 mice). d. Representative flow cytometry plots of RORγt-GFP+ cells in endothelial cells in RORγt-EGFP reporter mice. Data are representative of two or three independent experiments and shown as the means ± S.E.M in a-d.
Extended Data Figure 3. Zbtb46 is significantly enriched in CCR6+ LTi-like ILC3s from the intestine.
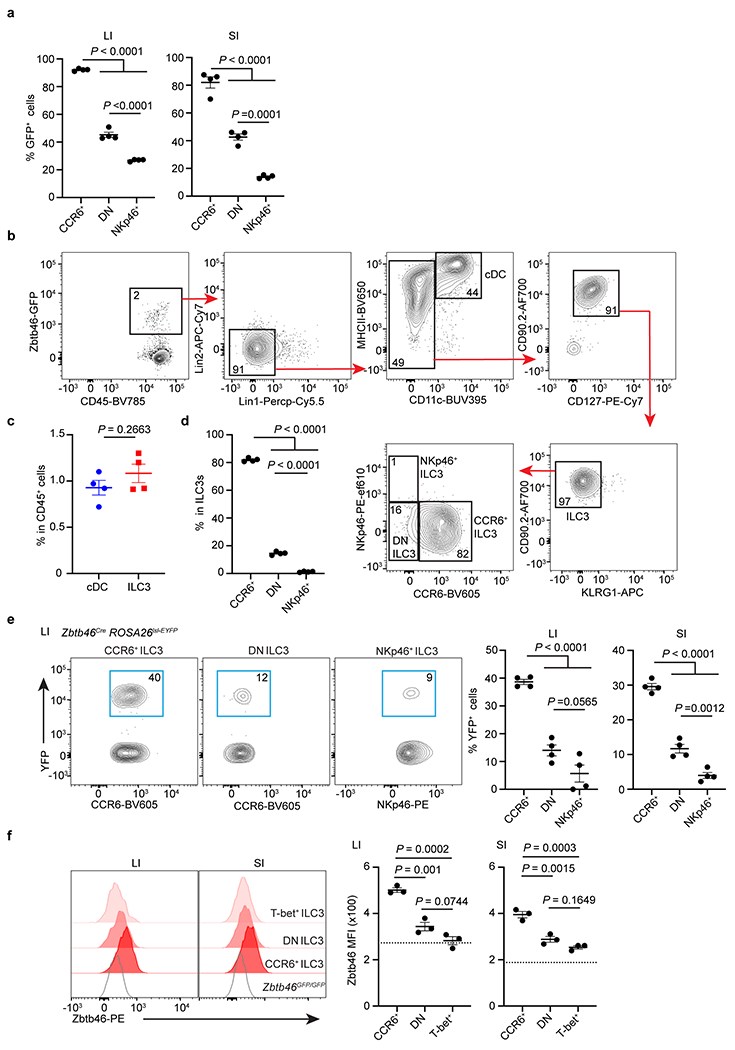
a. Quantifications of frequencies of Zbtb46-GFP+ cells in indicated ILC3 subsets in the large intestine (LI) or small intestine (SI) of Zbtb46GFP/+ mice (n = 4 mice for both LI and SI). b-d. Unbiased gating for Zbtb46-GFP+ cells from the large intestine of Zbtb46GFP/+ mice. c. Quantification of the frequency of Zbtb46-GFP+ cDCs or ILC3s in total CD45+ immune cells from the large intestine of Zbtb46GFP/+ mice (n = 4 mice). d. Quantification of the frequency of Zbtb46-GFP+ ILC3 subsets from the large intestine of Zbtb46GFP/+ mice (n = 4 mice). e. Representative flow plots and quantifications of frequencies of Zbtb46Cre fate-mapped cells in indicated ILC3 subsets in the large intestine (LI) or small intestine (SI) of Zbtb46CreROSA26lsl-EYFP mice (n = 4 for both LI and SI). f. Representative flow histograms and quantifications of Zbtb46 MFI in indicated ILC3 subsets from the large intestine (LI) or small intestine (SI) of C57BL/6 or Zbtb46GFP/GFP mice (n = 3 for both LI and SI). The dash line indicates Zbtb46 MFI in CCR6+ ILC3s from Zbtb46GFP/GFP. Data are representative of two or three independent experiments and shown as the means ± S.E.M.. Statistics are calculated by One-way ANOVA with Dunnett’s multiple comparisons in a, d, e, and f, two-tailed unpaired Student’s t-test in c.
Extended Data Figure 4. Zbtb46 is expressed by ILC3s in mucosal and lymphoid tissues.
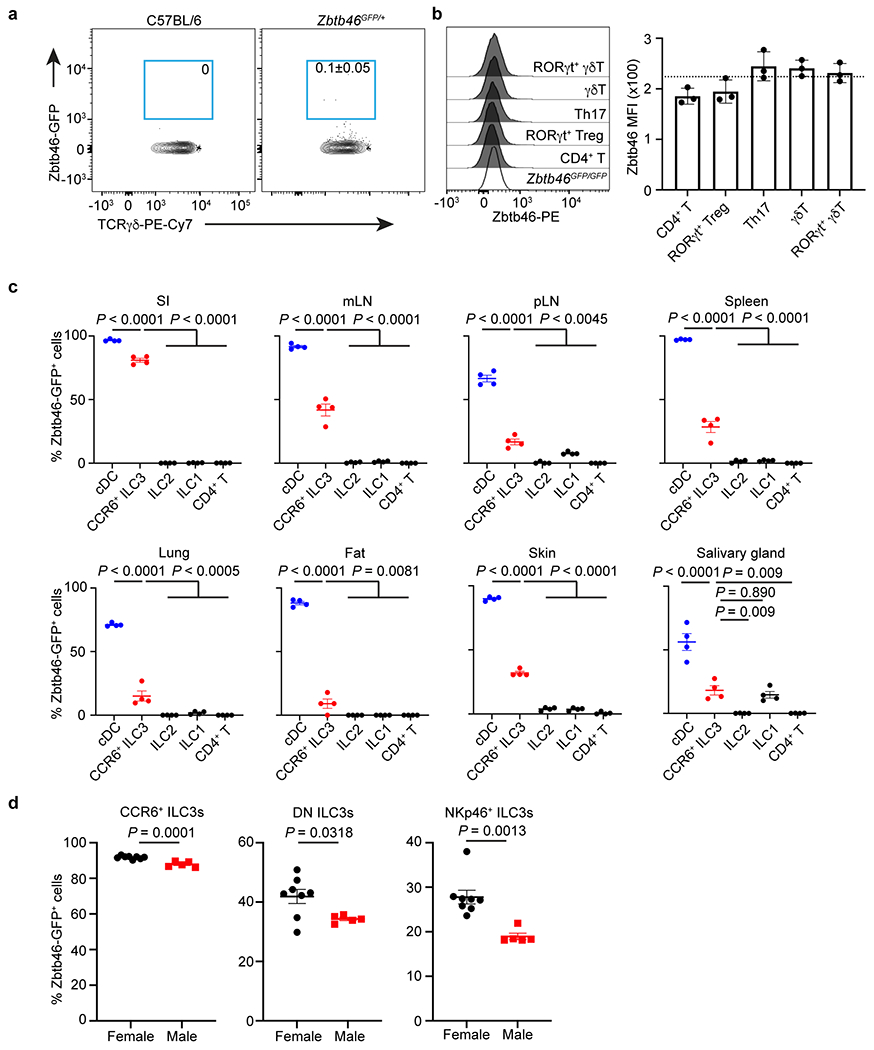
a. Representative flow plots of Zbtb46-GFP+ cells in γδT cells in the large intestine of C57BL/6 or Zbtb46GFP/+ mice (n = 4 mice). b. Representative flow cytometry histogram and quantification of Zbtb46 MFI in indicated T cell subsets from the large intestine of C57BL/6 or Zbtb46GFP/GFP mice (n = 3 mice). The dash line indicates Zbtb46 MFI in CD4+ T cells from Zbtb46GFP/GFP. c. Quantification of Zbtb46-GFP+ cell frequencies of indicated cells in the small intestine (SI), mesenteric lymph nodes (mLN), periphery lymph nodes (pLN), Spleen, Lung, Fat, Skin, and salivary gland of Zbtb46GFP/+ mice (n = 4 mice for all tissues). d. Quantification of Zbtb46-GFP+ cell frequencies of ILC3 subsets in the large intestine of Zbtb46GFP/+ female or male mice (n = 8 or 5 mice per group for all subsets). Data are representative of two independent experiments a-c, and data are pooled from 2 individual experiments in d. Data are shown as the means ± S.E.M. in b-d, means ± S.D. in a. Statistics are calculated by One-way ANOVA with Dunnett’s multiple comparisons in c and by two-tailed unpaired Student’s t-test in d.
Extended Data Figure 5. Gating strategy for different immune cells in human intestine.
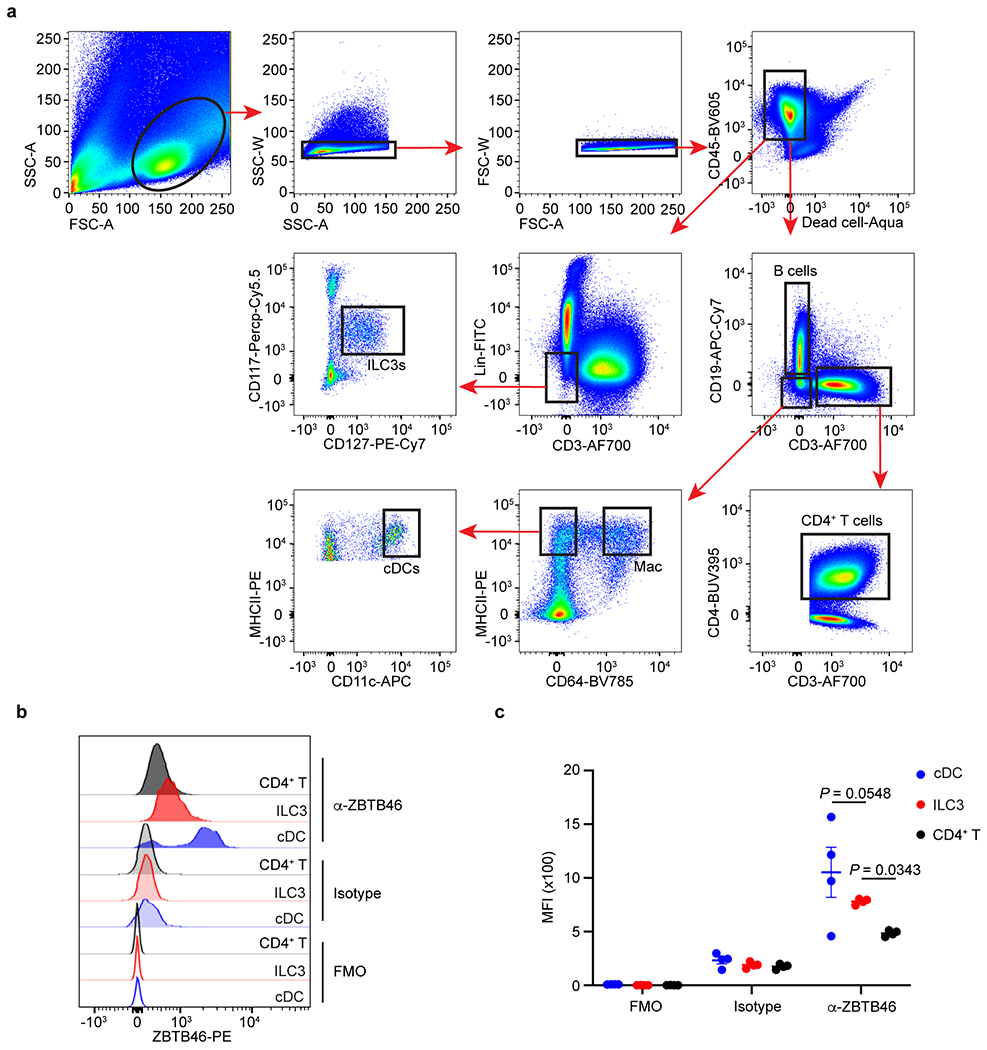
a. Lineage markers included: CD19, CD94, CD14, CD123, FcεR1a, CD34. B cells were gated as CD45+CD19+CD3−; Macrophages (Mac) were gated as CD45+CD19−CD3−CD64+MHCII+; cDCs were gated as CD45+CD19−CD3−CD64−CD11hiMHCIIhi. CD4+ T cells were gated as CD45+CD3+CD4+; ILC3s were gated as CD45+Lin−CD3−CD127+CD117+. b,c. Representative flow cytometry histogram of ZBTB46 staining and quantification of ZBTB46 MFI in indicated cells from human tonsils (n = 4 individual donors per group). FMO: full staining minus one; Isotype: Isotype control. Data are representative of two independent experiments in b,c, and shown as the means ± S.E.M. Statistics are calculated by One-way ANOVA with Dunnett’s multiple comparisons.
Extended Data Figure 6. Zbtb46+ ILC3s and cDCs are distinct cell lineages.
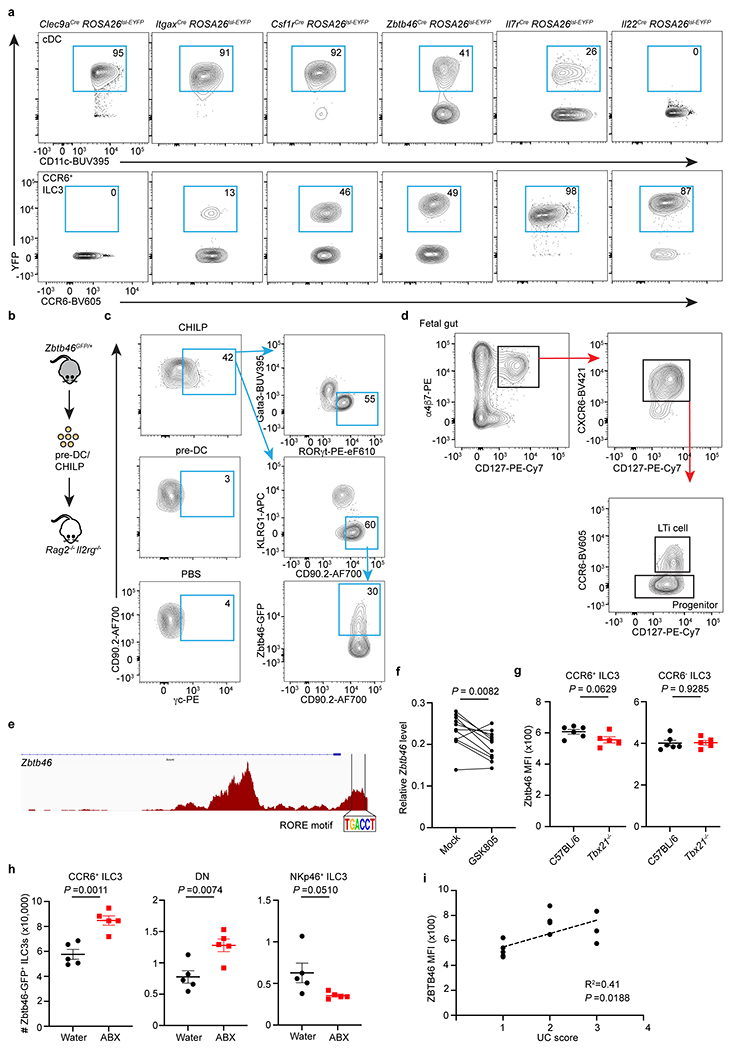
a. Representative flow cytometry plots showing the YFP+ cells in cDCs and CCR6+ ILC3s from the large intestine of indicated fate-mapping mice. b. Schematic of progenitor cell transfer. pre-DC or CHILP were sort-purified from the bone marrow of Zbtb46GFP/+ and transferred into Rag2−/− Il2rg−/− recipient mice. Six weeks later, ILC3s and Zbtb46-GFP expression were analyzed in the intestine of recipient mice. PBS injection was used as a negative control. pre-DCs were gated as: (Ter119, CD19, B220, CD3, CD5, NK1.1, Ly6G, CD11b)−CD127−MHCII−CD117−CD16/32−CD11c+Flt3+GFP+; CHILP were gated as (Ter119, B220, CD19, NK1.1, CD3, CD5, CD11b, CD11c, Ly6G)−CD45+CD127+α4β7+Flt3−CD25−CD117+. c. Representative flow plots of recipient mice injected with indicated progenitor cells. γc staining was used to differentiate the host-derived and recipient-derived ILCs. d. Gating strategies for progenitors and LTi cells from the fetal tissue. e. RORγt (RORE) motif analysis of the Zbtb46 locus in ATAC-seq data from CCR6+ ILC3s. f. Zbtb46 expression relative to Hprt in sort purified CCR6+ ILC3s with or without exposure to the RORγt inhibitor GSK805 (n = 11 mice). g. Quantification of Zbtb46 MFI in CCR6+ or CCR6− ILC3s from the large intestine of indicated mice (n = 6 or 5 mice per group for both subsets). h. Quantification of cell numbers of Zbtb46-GFP+ cells in indicated ILC3 subsets from the large intestine of water or ABX-treated Zbtb46GFP/+ mice (n = 5 mice for all subsets). i. Correlation analysis of ZBTB46 expression and disease scores in Ulcerative colitis patients. Data are pooled from three or two individual experiments in f and g, data are representative of two independent experiments in h. Data are shown as means ± S.E.M in g and h. Statistics are calculated by two-tailed paired Student’s t-test in f, two-tailed unpaired Student’s t-test in g and h, and the correlation is determined by simple linear regression in i.
Extended Data Figure 7. Comparison of naïve RorcCreZbtb46f/f mice relative to littermates.
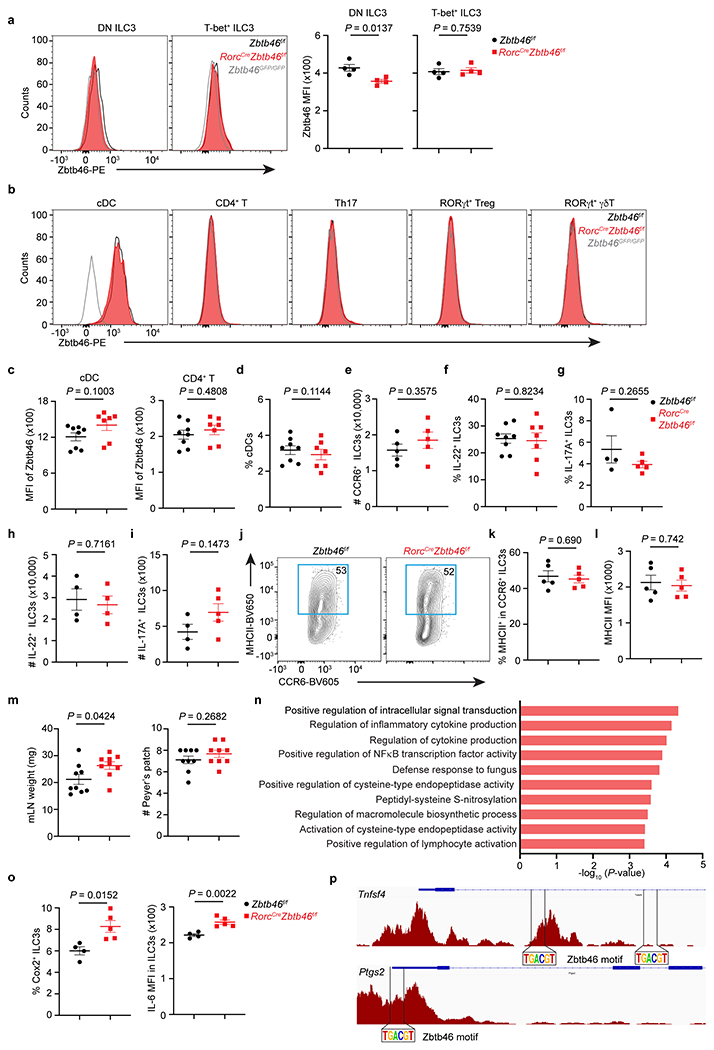
a. Representative flow cytometry histograms and quantification of Zbtb46 MFI in double-negative (DN) or T-bet+ ILC3s from the large intestine of indicated mice (n = 4 mice per group for both subsets). b. Representative flow cytometry histograms of Zbtb46 in cDCs and different T cell subsets in the large intestine of indicated mice. c. Quantification of geometric MFI of Zbtb46 in cDCs and CD4+ T cells (n = 8 or 7 mice per group for both cell types). d. The frequency of cDCs in the large intestine of indicated mice (n = 8 or 7 mice per group). e. Quantification of CCR6+ ILC3 cell numbers in the large intestine of indicated mice (n = 5 mice per group). f. Quantification of the frequencies of IL-22+ ILC3s in indicated mice (n = 8 or 7 mice per group). g. Quantification of the frequencies of IL-17A+ ILC3s in indicated mice (n = 4 or 5 mice per group). h. Quantification of the cell numbers of IL-22+ ILC3s in indicated mice (n = 4 mice per group). i. Quantification of the cell numbers of IL-17A+ ILC3s (n = 4 or 5 mice per group) in indicated mice. j,k. Representative flow plots and quantification of the frequencies of MHCII+ CCR6+ ILC3s in the large intestine of indicated mice (n = 5 mice per group). l. Quantification of MHCII MFI in CCR6+ ILC3s in indicated mice (n = 5 mice per group). m. Quantification of mLN weight and the numbers of Peyer’s patches in indicated mice (n = 9 mice per group). n. Go pathway analysis of the upregulated genes in the RorcCreZbtb46f/f mice compared to Zbtb46f/f mice. o. Quantification of the frequencies of COX-2+ (n = 4 or 5 mice per group) or IL-6 MFI (n = 4 or 5 mice per group) in ILC3s in the large intestine of indicated mice. p. Zbtb46 motif analysis of the Tnfsf4 and Ptgs2 loci in ATAC-seq data from CCR6+ ILC3s. Data are representative of three independent experiments in a, b, e, g-l, o. Data are pooled from two independent experiments in c, d, f, m. Data are shown as the means ± S.E.M. Statistics are calculated by two-tailed unpaired Student’s t-test.
Extended Data Figure 8. Zbtb46 regulates ILC3s in a cell-intrinsic manner.
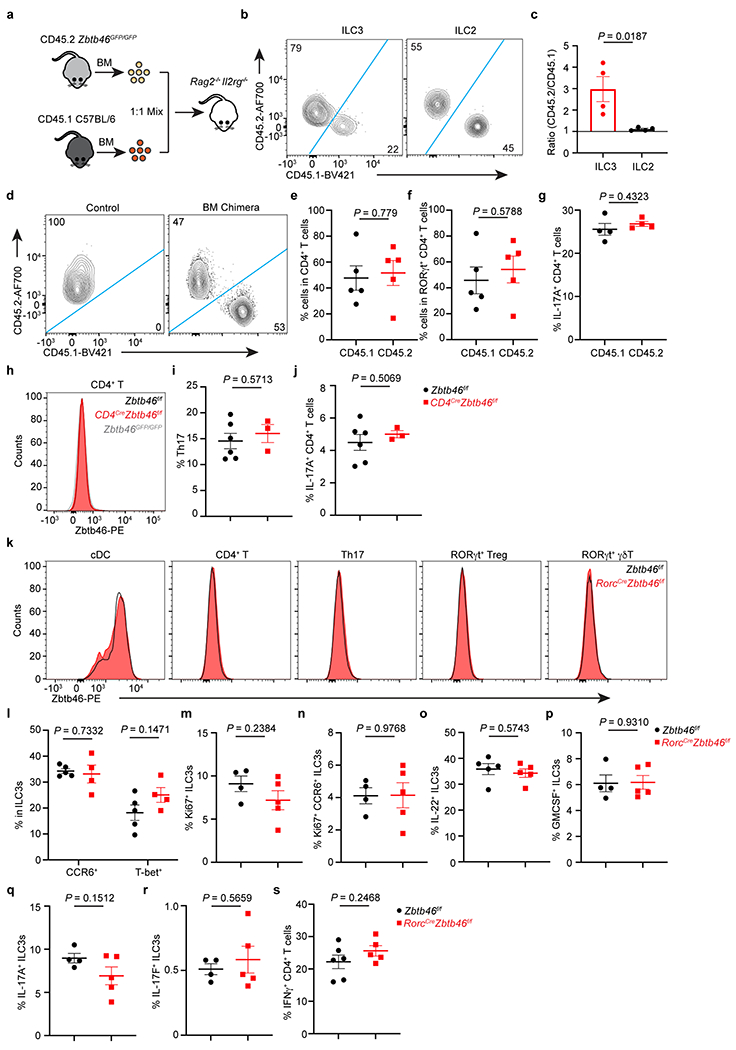
a. Schematic of mixed bone marrow (BM) chimera. The BM of CD45.2 Zbtb46GFP/GFP and CD45.1 C57BL/6 mice was equally mixed and transferred into Rag2−/−Il2rg−/− recipient mice. Mice were analyzed 6-8 weeks after transplantation. b,c. Representative flow plots of the composition of ILC3s or ILC2s, and quantification of the ratio of CD45.2 to CD45.1 cells in ILC3s or ILC2s in the large intestine of recipient mice (n = 4 mice). d. Representative flow plots of the composition of CD4+ T cells in non-transplanted (control) or BM chimera mice. e. Quantification of the frequencies of indicated CD4+ T cells in the large intestine of BM chimera mice (n = 5 mice). f. Quantification of the frequencies of indicated RORγt+ CD4+ T cells in the large intestine of BM chimera mice (n = 5 mice). g. Quantification of the frequencies of IL-17A+ CD4+ T cells in indicated congenic T cells of BM chimera mice (n = 4 mice). h. Representative flow cytometry histograms of Zbtb46 in CD4+ T cells in the large intestine of indicated mice. i. Quantification of the frequencies of Th17 cells in indicated mice (n = 6 or 3 mice per group). j. Quantification of the frequencies of IL-17A+ CD4+ T cells in indicated mice (n = 6 or 3 mice per group). k-s, Mice were orally infected with C. rodentium for two weeks prior to analysis. k. Representative flow cytometry histograms of Zbtb46 in cDCs and different T cell subsets. l. Quantification of the frequencies of ILC3 subsets in the large intestine of indicated mice (n = 5 or 4 mice per group for both subsets). m,n. Quantification of the frequencies of Ki67+ ILC3 (n = 4 or 5 mice per group) and Ki67+ CCR6+ ILC3s (n = 4 or 5 mice per group) in the large intestine of indicated mice. o-r, Quantification of the frequencies of IL-22+ (n = 5 mice per group), GMCSF+ (n = 4 or 5 mice per group), IL-17A+ (n = 4 or 5 mice per group), and IL-17F+ (n = 4 or 5 mice per group) ILC3s in the large intestine of indicated mice. s. Quantification of the frequencies of IFNγ+ CD4+ T cells in the large intestine of indicated mice (n = 6 or 5 mice per group). Data are representative of two or three independent experiments in b-s. Data are shown as the means ± S.E.M. Statistics are calculated by two-tailed unpaired Student’s t-test.
Extended Data Figure 9. Zbtb46+ ILC3s are a dominant source of tissue protective IL-22.
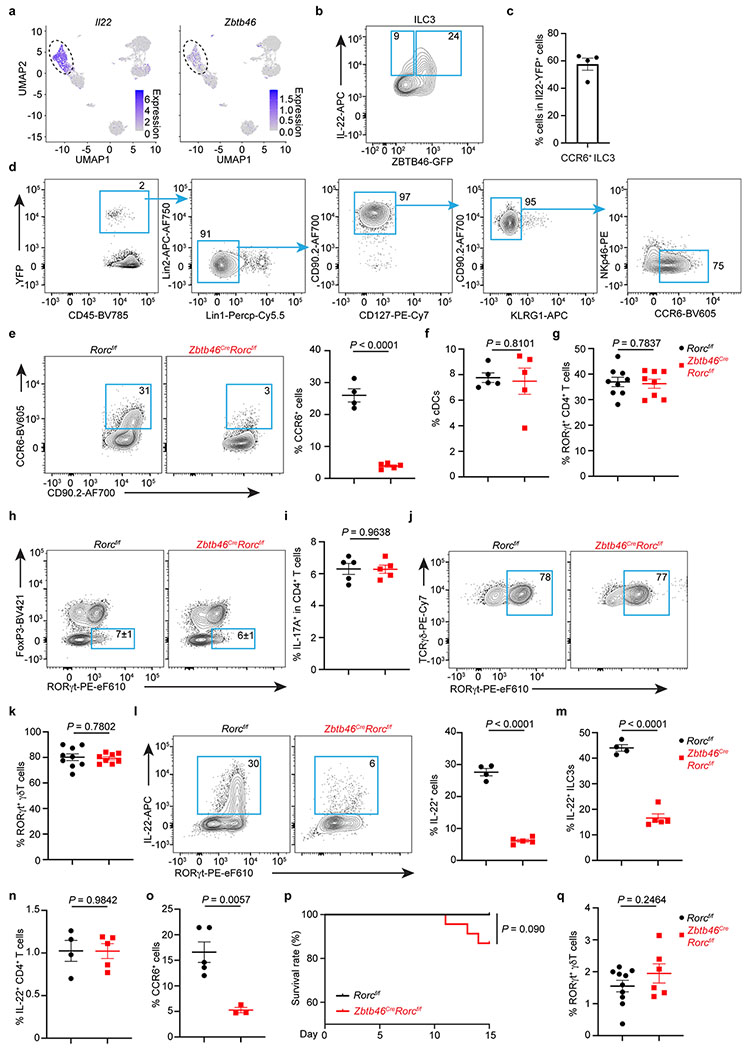
a. UMAPs show the expression of Il22 or Zbtb46 in all clusters of RORγt+ immune cells from the large intestine of RORγtEGFP mice. The dash circle indicates IL-22+ ILC3s. b. Representative flow plot of IL-22 and Zbtb46 expression in the large intestine of Zbtb46GFP/+ mice. c. Quantification of CCR6+ ILC3s in total Il22-YFP+ cells from the large intestine of Il22CreROSA26lsl-YFP mice (n = 4 mice). d. Representative flow plots presenting unbiased gating for Il22-YFP+ cells in the large intestine of Il22CreROSA26lsl-EYFP fate-mapping mice. Lineage 1: CD3, CD5, NK1.1, TCRγδ, Ly6G. Lineage 2: F4/80 and B220. e. Representative flow plots and quantification of CCR6+ cells in the large intestine of indicated mice. Cells were gated from Lineage−CD90.2+CD127+ cells (n = 4 or 5 mice per group). f. Quantification of the frequencies of cDCs in the large intestine of indicated mice (n = 5 mice per group). g. Quantification of the frequencies of RORγt+ CD4+ T Cells in the large intestine of indicated mice (n = 9 or 8 mice per group). h, i. Representative flow plots and quantification of Th17 or IL-17A+ CD4+ T cells in the large intestine of indicated mice (n = 5 mice per group). j,k. Representative flow plots and quantification of the frequencies of RORγt+ γδ T cells in the large intestine of indicated mice (n = 9 or 8 mice per group). l. Representative flow plots and quantification of the frequencies of IL-22+ cells in the large intestine of indicated mice (n = 4 or 5 mice per group). Cells were gated from Lineage−CD90.2+CD127+ cells. m. Quantification of the frequencies IL-22+ ILC3s in the large intestine of indicated mice (n = 4 or 5 mice per group). Cells were gated from Lineage−CD90.2+CD127+RORγt+ ILC3s. n. Quantification of the frequencies IL-22+ CD4+ T cells in the large intestine of indicated mice (n = 4 or 5 mice per group). o-q. Mice were orally infected with C. rodentium for two weeks prior to analysis. o. Quantification of the frequencies of CCR6+ ILCs in the large intestine of indicated mice (n = 5 or 3 mice per group). Cells were gated from Lineage−CD90.2+CD127+ cells. p. Quantification of survival rate of indicated mice following C. rodentium infection (n = 21 or 23 mice per group). q. Quantification of the frequencies of RORγt+ γδ T cells out of total CD45+ cells in the large intestine of indicated mice (n = 10 or 6 mice per group). Data are representative of two independent experiments in b-d, and three independent experiments in e,f, h, i, l-o. Data are pooled from two independent experiments in g, k, and q. Data are pooled from four independent experiments in p. Data are shown as the means ± S.E.M. in c, e, f, g, i, k-o, q, and means ± S.D. in h. Statistics are calculated by two-tailed unpaired Student’s t-test in e-g, i, k-o, q, and by Log-rank (Mantel-Cox) test in p.
Extended Data Figure 10. Regulation and function of Zbtb46+ ILC3s.
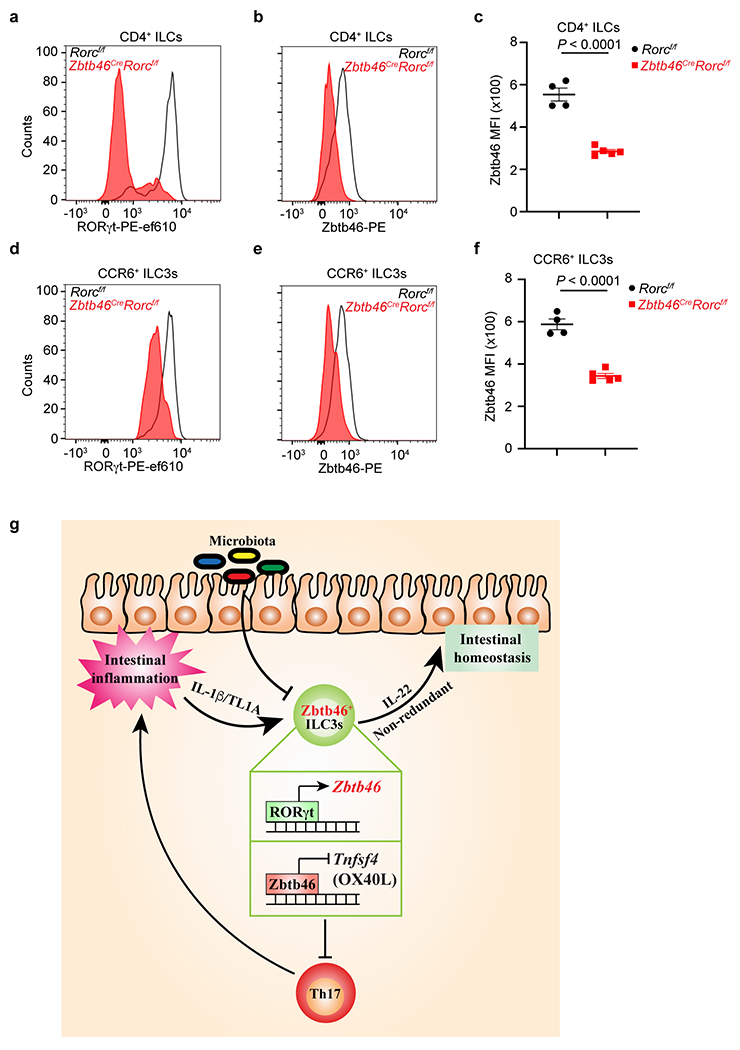
a. Representative flow cytometry histogram of RORγt expression in CD4+ ILCs from the large intestine of indicated mice. Cells were gated from Lineage−CD90.2+CD127+CD4+ cells. b,c. Representative flow cytometry histogram of Zbtb46 expression and quantification of Zbtb46 MFI in CD4+ ILCs from the large intestine of indicated mice (n = 4 or 5 mice per group). Cells were gated from Lineage−CD90.2+CD127+CD4+ cells. d. Representative flow cytometry histogram of RORγt expression in CCR6+ ILC3s from the large intestine of indicated mice. Cells were gated from Lineage−CD90.2+CD127+RORγt+CCR6+ cells. e,f. Representative flow cytometry histogram of Zbtb46 expression and quantification of Zbtb46 MFI in CCR6+ ILC3s from the large intestine of indicated mice (n = 4 or 5 mice per group). Cells were gated from Lineage−CD90.2+CD127+RORγt+CCR6+ cells. Data are representative of two independent experiments in a-f. Data are shown as the means ± S.E.M. Statistics are calculated by two-tailed unpaired Student’s t-test. g. Zbtb46 defines and regulates group 3 innate lymphoid cells that protect the intestine.
Supplementary Material
Acknowledgements
We thank members of the Sonnenberg Laboratory for discussions and critical reading of the manuscript. Research in the Sonnenberg Laboratory is supported by the National Institutes of Health (R01AI143842, R01AI123368, R01AI145989, U01AI095608, R21CA249274, R01AI162936, and R01CA274534), an Investigators in the Pathogenesis of Infectious Disease Award from the Burroughs Wellcome Fund, the Meyer Cancer Center Collaborative Research Initiative, The Dalton Family Foundation, and Linda and Glenn Greenberg. W.Z. is supported by fellowship from the Crohn’s and Colitis Foundation (831404). L.Z. is supported by fellowship from the Crohn’s and Colitis Foundation (608975). G.F.S. is a CRI Lloyd J. Old STAR. We would like to thank the Epigenomics Cores of Weill Cornell Medicine, Gregory Putzel, and all contributing members of the JRI IBD Live Cell Bank, which is supported by the JRI, Jill Roberts Center for IBD, Cure for IBD, the Rosanne H. Silbermann Foundation, the Sanders Family and Weill Cornell Medicine Division of Pediatric Gastroenterology and Nutrition.
Appendix
JRI Live Cell Bank consortium members:
David Artis3, Randy Longman3, Gregory Sonnenberg3, Ellen Scherl3, Robbyn Sockolow3, Dana Lukin3, Robert Battat3, Thomas Ciecierega3, Aliza Solomon3, Elaine Barfield3, Kimberley Chien3, Johanna Ferriera3, Jasmin Williams3, Shaira Khan3, Peik Sean Chong3, Samah Mozumder3, Lance Chou3, Wenqing Zhou3, Mohd Ahmed3, Connie Zhong3, Ann Joseph3, Sanchita Kashyap3, Joseph Gladstone3, and Samantha Jensen3.
Footnotes
The authors declare no competing interests.
References
- 1.Eberl G et al. An essential function for the nuclear receptor RORgamma(t) in the generation of fetal lymphoid tissue inducer cells. Nat Immunol 5, 64–73, doi: 10.1038/ni1022 (2004). [DOI] [PubMed] [Google Scholar]
- 2.Eberl G & Littman DR Thymic origin of intestinal alphabeta T cells revealed by fate mapping of RORgammat+ cells. Science 305, 248–251, doi: 10.1126/science.1096472 (2004). [DOI] [PubMed] [Google Scholar]
- 3.Ivanov II et al. The orphan nuclear receptor RORgammat directs the differentiation program of proinflammatory IL-17+ T helper cells. Cell 126, 1121–1133, doi: 10.1016/j.cell.2006.07.035 (2006). [DOI] [PubMed] [Google Scholar]
- 4.Ivanov II, Zhou L & Littman DR Transcriptional regulation of Th17 cell differentiation. Semin Immunol 19, 409–417, doi: 10.1016/j.smim.2007.10.011 (2007). [DOI] [PMC free article] [PubMed] [Google Scholar]
- 5.Luci C et al. Influence of the transcription factor RORgammat on the development of NKp46+ cell populations in gut and skin. Nat Immunol 10, 75–82, doi: 10.1038/ni.1681 (2009). [DOI] [PubMed] [Google Scholar]
- 6.Zhou L & Littman DR Transcriptional regulatory networks in Th17 cell differentiation. Curr Opin Immunol 21, 146–152, doi: 10.1016/j.coi.2009.03.001 (2009). [DOI] [PMC free article] [PubMed] [Google Scholar]
- 7.Sanos SL et al. RORgammat and commensal microflora are required for the differentiation of mucosal interleukin 22-producing NKp46+ cells. Nat Immunol 10, 83–91, doi: 10.1038/ni.1684 (2009). [DOI] [PMC free article] [PubMed] [Google Scholar]
- 8.Cella M et al. A human natural killer cell subset provides an innate source of IL-22 for mucosal immunity. Nature 457, 722–725, doi: 10.1038/nature07537 (2009). [DOI] [PMC free article] [PubMed] [Google Scholar]
- 9.Martin B, Hirota K, Cua DJ, Stockinger B & Veldhoen M Interleukin-17-producing gammadelta T cells selectively expand in response to pathogen products and environmental signals. Immunity 31, 321–330, doi: 10.1016/j.immuni.2009.06.020 (2009). [DOI] [PubMed] [Google Scholar]
- 10.Sutton CE et al. Interleukin-1 and IL-23 induce innate IL-17 production from gammadelta T cells, amplifying Th17 responses and autoimmunity. Immunity 31, 331–341, doi: 10.1016/j.immuni.2009.08.001 (2009). [DOI] [PubMed] [Google Scholar]
- 11.Buonocore S et al. Innate lymphoid cells drive interleukin-23-dependent innate intestinal pathology. Nature 464, 1371–1375, doi: 10.1038/nature08949 (2010). [DOI] [PMC free article] [PubMed] [Google Scholar]
- 12.Sawa S et al. Lineage relationship analysis of RORgammat+ innate lymphoid cells. Science 330, 665–669, doi: 10.1126/science.1194597 (2010). [DOI] [PubMed] [Google Scholar]
- 13.Ohnmacht C et al. MUCOSAL IMMUNOLOGY. The microbiota regulates type 2 immunity through RORγt+ T cells. Science 349, 989–993, doi: 10.1126/science.aac4263 (2015). [DOI] [PubMed] [Google Scholar]
- 14.Sefik E et al. MUCOSAL IMMUNOLOGY. Individual intestinal symbionts induce a distinct population of RORγ+ regulatory T cells. Science 349, 993–997, doi: 10.1126/science.aaa9420 (2015). [DOI] [PMC free article] [PubMed] [Google Scholar]
- 15.Eberl G RORγt, a multitask nuclear receptor at mucosal surfaces. Mucosal Immunol 10, 27–34, doi: 10.1038/mi.2016.86 (2017). [DOI] [PubMed] [Google Scholar]
- 16.Satpathy AT et al. Zbtb46 expression distinguishes classical dendritic cells and their committed progenitors from other immune lineages. J Exp Med 209, 1135–1152, doi: 10.1084/jem.20120030 (2012). [DOI] [PMC free article] [PubMed] [Google Scholar]
- 17.Meredith MM et al. Expression of the zinc finger transcription factor zDC (Zbtb46, Btbd4) defines the classical dendritic cell lineage. J Exp Med 209, 1153–1165, doi: 10.1084/jem.20112675 (2012). [DOI] [PMC free article] [PubMed] [Google Scholar]
- 18.Satpathy AT, Wu X, Albring JC & Murphy KM Re(de)fining the dendritic cell lineage. Nat Immunol 13, 1145–1154, doi: 10.1038/ni.2467 (2012). [DOI] [PMC free article] [PubMed] [Google Scholar]
- 19.Merad M, Sathe P, Helft J, Miller J & Mortha A The dendritic cell lineage: ontogeny and function of dendritic cells and their subsets in the steady state and the inflamed setting. Annu Rev Immunol 31, 563–604, doi: 10.1146/annurev-immunol-020711-074950 (2013). [DOI] [PMC free article] [PubMed] [Google Scholar]
- 20.Cabeza-Cabrerizo M, Cardoso A, Minutti CM, Pereira da Costa M & Reis E Sousa C Dendritic Cells Revisited. Annu Rev Immunol 39, 131–166, doi: 10.1146/annurev-immunol-061020-053707 (2021). [DOI] [PubMed] [Google Scholar]
- 21.Hepworth MR et al. Immune tolerance. Group 3 innate lymphoid cells mediate intestinal selection of commensal bacteria-specific CD4+ T cells. Science 348, 1031–1035, doi: 10.1126/science.aaa4812 (2015). [DOI] [PMC free article] [PubMed] [Google Scholar]
- 22.Zhou L et al. Innate lymphoid cells support regulatory T cells in the intestine through interleukin-2. Nature 568, 405–+, doi: 10.1038/s41586-019-1082-x (2019). [DOI] [PMC free article] [PubMed] [Google Scholar]
- 23.Teng F et al. A circadian clock is essential for homeostasis of group 3 innate lymphoid cells in the gut. Sci Immunol 4, doi: 10.1126/sciimmunol.aax1215 (2019). [DOI] [PMC free article] [PubMed] [Google Scholar]
- 24.Fujino S et al. Increased expression of interleukin 17 in inflammatory bowel disease. Gut 52, 65–70, doi: 10.1136/gut.52.1.65 (2003). [DOI] [PMC free article] [PubMed] [Google Scholar]
- 25.Brown CC et al. Transcriptional Basis of Mouse and Human Dendritic Cell Heterogeneity. Cell 179, 846–863.e824, doi: 10.1016/j.cell.2019.09.035 (2019). [DOI] [PMC free article] [PubMed] [Google Scholar]
- 26.Schraml BU et al. Genetic tracing via DNGR-1 expression history defines dendritic cells as a hematopoietic lineage. Cell 154, 843–858, doi: 10.1016/j.cell.2013.07.014 (2013). [DOI] [PubMed] [Google Scholar]
- 27.Pokrovskii M et al. Characterization of Transcriptional Regulatory Networks that Promote and Restrict Identities and Functions of Intestinal Innate Lymphoid Cells. Immunity 51, 185–197.e186, doi: 10.1016/j.immuni.2019.06.001 (2019). [DOI] [PMC free article] [PubMed] [Google Scholar]
- 28.Britanova L & Diefenbach A Interplay of innate lymphoid cells and the microbiota. Immunol Rev 279, 36–51, doi: 10.1111/imr.12580 (2017). [DOI] [PubMed] [Google Scholar]
- 29.Chen WY et al. Inhibition of the androgen receptor induces a novel tumor promoter, ZBTB46, for prostate cancer metastasis. Oncogene 36, 6213–6224, doi: 10.1038/onc.2017.226 (2017). [DOI] [PubMed] [Google Scholar]
- 30.Kugathasan S et al. Loci on 20q13 and 21q22 are associated with pediatric-onset inflammatory bowel disease. Nat Genet 40, 1211–1215, doi: 10.1038/ng.203 (2008). [DOI] [PMC free article] [PubMed] [Google Scholar]
- 31.Meredith MM et al. Zinc finger transcription factor zDC is a negative regulator required to prevent activation of classical dendritic cells in the steady state. J Exp Med 209, 1583–1593, doi: 10.1084/jem.20121003 (2012). [DOI] [PMC free article] [PubMed] [Google Scholar]
- 32.Castellanos JG et al. Microbiota-Induced TNF-like Ligand 1A Drives Group 3 Innate Lymphoid Cell-Mediated Barrier Protection and Intestinal T Cell Activation during Colitis. Immunity 49, 1077–1089.e1075, doi: 10.1016/j.immuni.2018.10.014 (2018). [DOI] [PMC free article] [PubMed] [Google Scholar]
- 33.Gajdasik DW et al. Th1 responses in vivo require cell-specific provision of OX40L dictated by environmental cues. Nat Commun 11, 3421, doi: 10.1038/s41467-020-17293-3 (2020). [DOI] [PMC free article] [PubMed] [Google Scholar]
- 34.Yao C et al. Prostaglandin E2-EP4 signaling promotes immune inflammation through Th1 cell differentiation and Th17 cell expansion. Nat Med 15, 633–640, doi: 10.1038/nm.1968 (2009). [DOI] [PubMed] [Google Scholar]
- 35.Napolitani G, Acosta-Rodriguez EV, Lanzavecchia A & Sallusto F Prostaglandin E2 enhances Th17 responses via modulation of IL-17 and IFN-gamma production by memory CD4+ T cells. Eur J Immunol 39, 1301–1312, doi: 10.1002/eji.200838969 (2009). [DOI] [PubMed] [Google Scholar]
- 36.Vély F et al. Evidence of innate lymphoid cell redundancy in humans. Nat Immunol 17, 1291–1299, doi: 10.1038/ni.3553 (2016). [DOI] [PMC free article] [PubMed] [Google Scholar]
- 37.Rankin LC et al. Complementarity and redundancy of IL-22-producing innate lymphoid cells. Nat Immunol 17, 179–186, doi: 10.1038/ni.3332 (2016). [DOI] [PMC free article] [PubMed] [Google Scholar]
- 38.Song C et al. Unique and redundant functions of NKp46(+) ILC3s in models of intestinal inflammation. Journal of Experimental Medicine 212, 1869–1882, doi: 10.1084/jem.20151403 (2015). [DOI] [PMC free article] [PubMed] [Google Scholar]
- 39.Zheng Y et al. Interleukin-22 mediates early host defense against attaching and effacing bacterial pathogens. Nature Medicine 14, 282–289, doi: 10.1038/nm1720 (2008). [DOI] [PubMed] [Google Scholar]
- 40.Sonnenberg G, Monticelli L, Elloso M, Fouser L & Artis D CD4(+) Lymphoid Tissue-Inducer Cells Promote Innate Immunity in the Gut. Immunity 34, 122–134, doi: 10.1016/j.immuni.2010.12.009 (2011). [DOI] [PMC free article] [PubMed] [Google Scholar]
- 41.Ota N et al. IL-22 bridges the lymphotoxin pathway with the maintenance of colonic lymphoid structures during infection with Citrobacter rodentium. Nat Immunol 12, 941–948, doi: 10.1038/ni.2089 (2011). [DOI] [PubMed] [Google Scholar]
- 42.Dudakov JA, Hanash AM & van den Brink MR Interleukin-22: immunobiology and pathology. Annu Rev Immunol 33, 747–785, doi: 10.1146/annurev-immunol-032414-112123 (2015). [DOI] [PMC free article] [PubMed] [Google Scholar]
- 43.Basu R et al. Th22 cells are an important source of IL-22 for host protection against enteropathogenic bacteria. Immunity 37, 1061–1075, doi: 10.1016/j.immuni.2012.08.024 (2012). [DOI] [PMC free article] [PubMed] [Google Scholar]
- 44.Leppkes M et al. RORgamma-expressing Th17 cells induce murine chronic intestinal inflammation via redundant effects of IL-17A and IL-17F. Gastroenterology 136, 257–267, doi: 10.1053/j.gastro.2008.10.018 (2009). [DOI] [PubMed] [Google Scholar]
- 45.Bernink JH et al. Human type 1 innate lymphoid cells accumulate in inflamed mucosal tissues. Nat Immunol 14, 221–229, doi: 10.1038/ni.2534 (2013). [DOI] [PubMed] [Google Scholar]
- 46.Wang Y et al. ZBTB46 is a shear-sensitive transcription factor inhibiting endothelial cell proliferation via gene expression regulation of cell cycle proteins. Lab Invest 99, 305–318, doi: 10.1038/s41374-018-0060-5 (2019). [DOI] [PMC free article] [PubMed] [Google Scholar]
- 47.Loschko J et al. Inducible targeting of cDCs and their subsets in vivo. J Immunol Methods 434, 32–38, doi: 10.1016/j.jim.2016.04.004 (2016). [DOI] [PMC free article] [PubMed] [Google Scholar]
- 48.Caton ML, Smith-Raska MR & Reizis B Notch-RBP-J signaling controls the homeostasis of CD8- dendritic cells in the spleen. J Exp Med 204, 1653–1664, doi: 10.1084/jem.20062648 (2007). [DOI] [PMC free article] [PubMed] [Google Scholar]
- 49.Ahlfors H et al. IL-22 fate reporter reveals origin and control of IL-22 production in homeostasis and infection. J Immunol 193, 4602–4613, doi: 10.4049/jimmunol.1401244 (2014). [DOI] [PMC free article] [PubMed] [Google Scholar]
- 50.Srinivas S et al. Cre reporter strains produced by targeted insertion of EYFP and ECFP into the ROSA26 locus. BMC Dev Biol 1, 4, doi: 10.1186/1471-213x-1-4 (2001). [DOI] [PMC free article] [PubMed] [Google Scholar]
- 51.Choi GB et al. The maternal interleukin-17a pathway in mice promotes autism-like phenotypes in offspring. Science 351, 933–939, doi: 10.1126/science.aad0314 (2016). [DOI] [PMC free article] [PubMed] [Google Scholar]
- 52.Finotto S et al. Development of spontaneous airway changes consistent with human asthma in mice lacking T-bet. Science 295, 336–338, doi: 10.1126/science.1065544 (2002). [DOI] [PubMed] [Google Scholar]
- 53.Kühn R, Löhler J, Rennick D, Rajewsky K & Müller W Interleukin-10-deficient mice develop chronic enterocolitis. Cell 75, 263–274, doi: 10.1016/0092-8674(93)80068-p (1993). [DOI] [PubMed] [Google Scholar]
- 54.Lee PP et al. A critical role for Dnmt1 and DNA methylation in T cell development, function, and survival. Immunity 15, 763–774, doi: 10.1016/s1074-7613(01)00227-8 (2001). [DOI] [PubMed] [Google Scholar]
- 55.Loschko J et al. Absence of MHC class II on cDCs results in microbial-dependent intestinal inflammation. J Exp Med 213, 517–534, doi: 10.1084/jem.20160062 (2016). [DOI] [PMC free article] [PubMed] [Google Scholar]
- 56.Schlenner SM et al. Fate mapping reveals separate origins of T cells and myeloid lineages in the thymus. Immunity 32, 426–436, doi: 10.1016/j.immuni.2010.03.005 (2010). [DOI] [PubMed] [Google Scholar]
- 57.Butler A, Hoffman P, Smibert P, Papalexi E & Satija R Integrating single-cell transcriptomic data across different conditions, technologies, and species. Nat Biotechnol 36, 411–420, doi: 10.1038/nbt.4096 (2018). [DOI] [PMC free article] [PubMed] [Google Scholar]
- 58.Hadley W ggplot2:Elegant Graphics for Data Analysis. (Springer-Verlag; New York, 2016). [Google Scholar]
- 59.Dodt M, Roehr JT, Ahmed R & Dieterich C FLEXBAR-Flexible Barcode and Adapter Processing for Next-Generation Sequencing Platforms. Biology (Basel) 1, 895–905, doi: 10.3390/biology1030895 (2012). [DOI] [PMC free article] [PubMed] [Google Scholar]
- 60.Dobin A et al. STAR: ultrafast universal RNA-seq aligner. Bioinformatics 29, 15–21, doi: 10.1093/bioinformatics/bts635 (2013). [DOI] [PMC free article] [PubMed] [Google Scholar]
- 61.Liao Y, Smyth GK & Shi W The R package Rsubread is easier, faster, cheaper and better for alignment and quantification of RNA sequencing reads. Nucleic Acids Res 47, e47, doi: 10.1093/nar/gkz114 (2019). [DOI] [PMC free article] [PubMed] [Google Scholar]
- 62.Love MI, Huber W & Anders S Moderated estimation of fold change and dispersion for RNA-seq data with DESeq2. Genome Biol 15, 550, doi: 10.1186/s13059-014-0550-8 (2014). [DOI] [PMC free article] [PubMed] [Google Scholar]
- 63.Langmead B & Salzberg SL Fast gapped-read alignment with Bowtie 2. Nat Methods 9, 357–359, doi: 10.1038/nmeth.1923 (2012). [DOI] [PMC free article] [PubMed] [Google Scholar]
- 64.Robinson JT, Thorvaldsdóttir H, Wenger AM, Zehir A & Mesirov JP Variant Review with the Integrative Genomics Viewer. Cancer Res 77, e31–e34, doi: 10.1158/0008-5472.CAN-17-0337 (2017). [DOI] [PMC free article] [PubMed] [Google Scholar]
Associated Data
This section collects any data citations, data availability statements, or supplementary materials included in this article.
Supplementary Materials
Data Availability Statement
All data necessary to understand and evaluate the conclusions of this paper are provided. Bulk RNA-Seq data have been deposited in the Gene Expression Omnibus database under the accession number GSE181865, scRNA-Seq data are under the accession number GSE181864.


