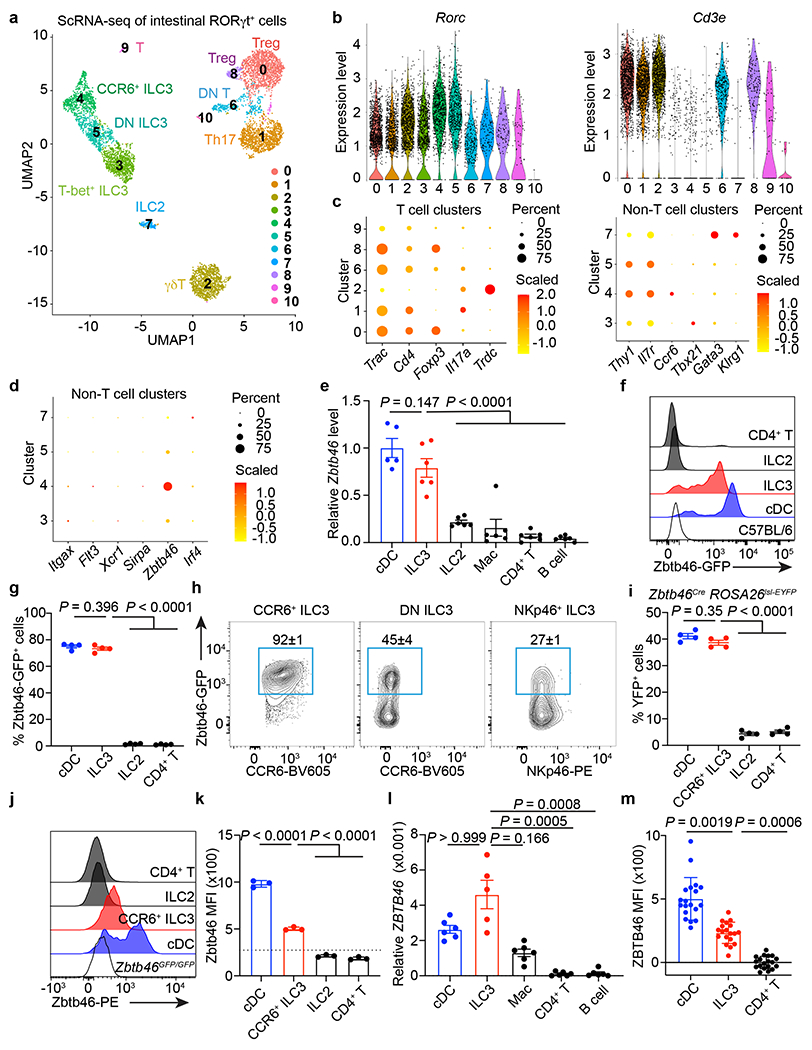
Figure 1. A single cell atlas of RORγt+ immune cells identifies Zbtb46 expression in ILC3s.

a. scRNA-seq UMAP projection of RORγt+ immune cells from the large intestine of RORγtEGFP mice. b. Violin plots of selected genes. c. Dot plot of selected gene. d. Dot plot of cDC markers. e. Zbtb46 mRNA relative to Hprt in indicated cells from the large intestine of C57BL/6 mice (n = 5 mice for cDCs or 6 for all others). f, g. Histogram of GFP (f), GFP+ cell frequency (g) (n = 4 mice), of indicated cells in the large intestine of Zbtb46GFP/+ mice. h. Flow cytometry plots of indicated ILC3 subsets in the large intestine of Zbtb46GFP/+ mice (n = 4 mice). i. Quantification of YFP+ cells of indicated cells in the large intestine of Zbtb46CreROSA26lsl-EYFP mice (n = 4 mice). j,k. Flow cytometry histogram (j) of Zbtb46 staining and quantification of geometric mean fluorescence intensity (MFI) in indicated cells (k) (n = 3 mice). The dash line indicates Zbtb46 MFI in CCR6+ ILC3s from Zbtb46GFP/GFP mice. l. ZBTB46 mRNA relative to ACTB in indicated cells sorted from the non-inflamed human intestine (n = 5 individual donors for ILC3s or 6 for all others). m. Quantification of ZBTB46 MFI in indicated cells from the healthy human intestine (n = 19 individual donors). MFI in CD4+ T cells was normalized to 0. Data in e are pooled from two independent experiments; data in f, g, h, i, j, and k are representative of two or three independent experiments. Data are shown as the means ± S.E.M in e, g, i, k, l, m, and means ± S.D. in h. Statistics are calculated by one-way ANOVA with Dunnett’s multiple comparisons in e, g, i, and k; one-way ANOVA Kruskal-Wallis test with Dunn’s multiple comparisons in l, and m.
