Abstract
Purpose.
To assess the optimal number and orientation of anterior segment optical coherence tomography (AS-OCT) images for accurately measuring ocular biometric parameters in angle closure eyes.
Methods.
Subjects with angle closure, defined as ≥3 quadrants of non-visible pigmented trabecular meshwork on static gonioscopy, were selected from the Chinese American Eye Study (CHES). Mean angle opening distance (AOD500) was calculated using four images (0°-180°, 45°-225°, 90°-270° and 135°-315° meridians) from one eye per subject. Ten eyes from each quartile of AOD500 measurements were randomly selected for detailed 32-image analysis of 10 biometric parameters, including AOD500, iris curvature (IC), anterior chamber depth (ACD), lens vault (LV), and anterior chamber area (ACA). Mean and range of measurements from 1, 2, 4, 8, or 16 images were compared to 32-image values for all parameters.
Results.
40 out of 335 eyes with angle closure were selected for 32-image analysis. Deviation from the 32-image mean was between 0.44% and 19.31% with one image, decreasing to 0.08% to 4.21% with two images for all parameters. Deviation from the 32-image range of measurements was between 54.67% to 88.94% with one image, decreasing to <7.00% with eight images for all parameters except ACD and ACA. Orienting the first image analyzed along the 25°-205° meridian better approximated the range of measurements when four or fewer images were analyzed.
Conclusions.
Sectoral anatomical variations in angle closure eyes are easily misrepresented based on current AS-OCT imaging conventions. A revised multi-image approach can better capture the mean and range of biometric measurements.
INTRODUCTION
Primary angle closure glaucoma (PACG), the most severe form of primary angle closure disease (PACD), is a leading cause of permanent vision loss and blindness worldwide.1 Iridotrabecular contact can impede outflow of aqueous humor, which leads to elevated intraocular pressure (IOP) and glaucomatous optic neuropathy if not diagnosed and treated.2 Gonioscopy is the current clinical standard for assessing anterior chamber angle structures and detecting angle closure. However, gonioscopy is subjective and a weak predictor of PACD progression.3 Therefore, there is a need for more objective and precise methods to assess and risk-stratify patients with angle closure.
Anterior segment OCT (AS-OCT) is a non-contact, non-invasive imaging method that supports quantitative analysis of biometric parameters describing anterior segment structures and their configurations.4-6 Over the past two decades, rapid development of OCT technology has included the transition from time-domain to faster swept-source Fourier-domain OCT devices.7 These advances have improved image quality and acquisition speed, which enhances the potential of AS-OCT as both a clinical and research tool.8 However, quantitative analysis of AS-OCT images remains time- and labor-intensive. Therefore, it is desirable to minimize the number of images analyzed while still accurately characterizing the biometric properties of the anterior segment.
Early AS-OCT studies represented the anterior segment using a single cross-sectional image acquired along the horizontal nasal-temporal meridian. Studies of predominantly open angle eyes have revealed substantial variation of biometric measurements among angle sectors, and multiple AS-OCT images are required to accurately quantify these sectoral variations.7,9,10 In open angle eyes, this variation was most noticeable among parameters that measured angle width (e.g. angle opening distance, AOD; trabecular iris space area, TISA); on average, angles were most narrow superiorly and inferiorly and most open temporally and nasally. There were also sectoral variations among other biometric parameters associated with angle closure, such as iris area (IA) and lens vault (LV). While sectoral anatomical variations in open angle eyes can be captured using as few as eight AS-OCT images, it is unclear if this approach is generalizable to angle closure eyes.11 The effect of rotating the meridian of image analysis away from the 0°-180° meridian is also unclear.
In this study, we examine the optimal number and orientation of AS-OCT images to approximate the mean and range of measurements for AS-OCT parameters in angle closure eyes. Accurate quantification of mean and range could have important clinical implications as narrower mean angle width is associated with higher IOP in angle closure eyes and the range of angle width measurements may reflect anatomical changes related to chronic angle closure.11,12
METHODS
Subject Recruitment
Subjects with angle closure were recruited from the Chinese American Eye Study (CHES). CHES was a population-based, cross-sectional study consisting of 4,582 Chinese participants from the city of Monterey Park, CA, USA, aged 50 years or older.13 Angle closure was defined as ≥3 quadrants in which pigmented trabecular meshwork (TM) could not be visualized on static gonioscopy. Patients with a history of eye procedures, including laser peripheral iridotomy and cataract surgery, that could affect the configuration of anterior segment structures were excluded from this study. All study processes adhered to the tenets of the Declaration of Helsinki and was previously approved by the University of Southern California Medical Center Institutional Review Board.
At the time of CHES, each subject underwent a complete ocular examination with an experienced ophthalmologist. The exam included, in order, Goldmann applanation tonometry (GAT), gonioscopy, and AS-OCT imaging. GAT was performed with room lights on (27 cd/m2) and averaged over three consecutive IOP measurements. Gonioscopy utilized Posner-type 4-mirror lens (Model ODPSG; Ocular Instruments, Inc. Bellevue, WA, USA) and was performed under dark ambient lighting (0.1 cd/m2) using a 1-mm narrow slit light beam by two ophthalmologists masked to other examination findings. Care was taken to avoid indenting the cornea and shining the light beam through the pupil. While eyes were kept in the primary position during gonioscopy, lens tilting was allowed to overcome iris convexity. The angle in each quadrant was graded using the modified Shaffer system: grade 0 = no structures visualized; grade 1 = non-pigmented trabecular meshwork (TM) visible, grade 2 = pigmented TM visible; grade 3 = scleral spur (SS) visible; grade 4 = ciliary body (CB) visible.
Image Acquisition and Processing
Two-dimensional OCT images were acquired using the Tomey CASIA SS-1000 swept-source Fourier-domain OCT device (Tomey Corporation, Nagoya, Japan). Both eyes of study subjects were imaged under standardized dark-room conditions (0.1 cd/m2). One eye from each subject was randomly selected for analysis in MATLAB (Mathworks, Natick, MA, USA). Each image was processed using the SS OCT viewer software (version 3.0; Tomey Corp), which automatically identified the anterior segment structures and generated measurements of the anterior segment parameters upon manual identification of the scleral spur by an experienced grader (A.A.P) masked to the identities and other findings of the subjects.14 The grader also verified the structure segmentations automatically performed by the software. Four images per eye were analyzed, with the first image oriented along the 0°-180° meridian. Additional OCT images were evenly spaced 45° apart from the horizontal meridian. Eyes with missing or corrupt images or an unidentifiable scleral spur in one or more images were excluded from the analysis. Intra-observer repeatability of measurements was calculated in the form of intraclass correlation coefficients (ICCs) for each parameter based on images from 20 angle closure eyes graded three months apart. These images were randomly selected from the pool of all images from eyes with angle closure. A detailed analysis of intra-observer and intra-device repeatability of biometric measurements from horizontal images of open and angle closure eyes by the current study grader has previously been reported.15
Among CHES subjects who received AS-OCT imaging, those with history of medications or procedures that could affect angle width or had at least one unidentifiable scleral spur in one or more images were excluded. In order to study angle closure eyes with a broad full range of angle widths, the remaining subjects were stratified into quartiles based on angle opening distance measured at 500 μm from the scleral spur (AOD500) averaged over 4 images. The 1st quartile contained the eyes with the narrowest angles based on AOD500 measurements and the 4th quartile contained the eyes with the widest angles. Ten eyes were randomly selected from each of the 4 quartiles to represent the spectrum of anatomical angle narrowing.
The SS OCT viewer could save data for up to 32 of 128 images acquired, leading to the analysis of a maximum of 32 images per eye. The first image analyzed was oriented along the nasal (0°) – temporal (180°) meridian, with the remaining images spaced evenly throughout the angle: 90° apart for 2 images, 45° apart for 4 images, 22.5° apart for 8 images, 11.3° apart for 16 images and 5.6° apart for 32 images (Supplementary Figure 1).
Data Analysis
Ten AS-OCT parameters were measured per image. Four parameters characterized the angle: angle open distance (AOD), trabecular iris space area (TISA), both measured at 500 μm and 750 μm from the scleral spur. The remaining six parameters described the anterior chamber: iris area (IA), iris curvature (IC), anterior chamber area (ACA), anterior chamber depth (ACD), anterior chamber width (ACW), and lens vault (LV). Individual measurements from each of the 10 subjects were pooled within each quartile and averaged across up to 32 cross-sectional images. These data were then plotted along the angle from the nasal to superior to temporal to inferior and back to nasal sector to assess sectoral anatomical variations within each quartile of angle closure. Mean and range of measurements from 1, 2, 4, 8 or 16 images were compared with values from 32 images through the following calculations:
The effect of image orientation on mean and range of AOD750 measurements was assessed by rotating the meridian of image analysis in 5.6° increments (evenly spaced between 32 images), starting with the 0°-180° meridian. The total number of images analyzed was 1, 2, 4, 8, or 16, and images remained evenly spaced. The rotation of the meridian was always from the nasal to superior sector, i.e. in the counterclockwise direction for right eyes and in the clockwise direction for left eyes.
RESULTS
Among the 599 CHES subjects who fit the definition of angle closure, 335 (55.9%) underwent AS-OCT imaging. Among these subjects, 27 were excluded due to history of medications or procedures that could affect angle width (N = 76, 8.1%) and 10 (3.0%) were excluded due to at least one unidentifiable scleral spur on preliminary analysis of 4 images per eye. Among the remaining 298 subjects, 40 eyes of 40 subjects with angle closure underwent 32-image analysis grouped together and by quartile of AOD500. The mean AOD500 measurements for quartiles 1 through 4 were, respectively, 0.08, 0.09, 0.13, and 0.18 mm. Mean age was 64.55 ± 8.43 years. Among all subjects, 32 (80%) were female and 8 (20%) were male. A total of 1280 (40 x 32) AS-OCT images were analyzed. The scleral spur was identifiable in all 1280 images. Intra-observer ICC values for the grader reflected excellent repeatability for all parameters ranging between 0.89 (TISA500) to 0.98 (ACD).
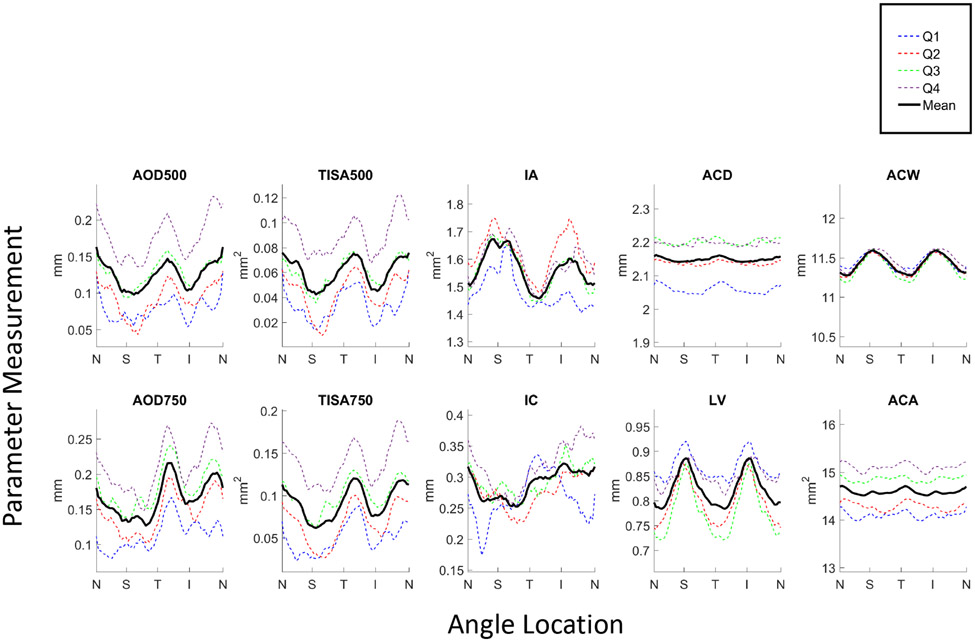
Angle parameters measured across 32 images and plotted by angle location for each of the 4 quartiles demonstrated substantial sectoral variations (Figure 1). Some anterior chamber parameters (IA, IC, LV, ACW) also varied with respect to angle location, although some did not (ACD, ACA). Overall, superior and inferior sectors of the angle were more narrow than temporal and nasal sectors, although these differences were smaller in eyes from the narrowest (1st) quartile. Mean angle parameter measurements increased with quartile of AOD500 measurements (Supplementary Table 1). While this also applied to some mean anterior chamber parameter measurements (ACA, IC), it did not apply to others (IA, ACD, ACW, LV).
Figure 1.
Angle parameter measurements averaged over 32 images plotted by angle location (N = nasal, S = superior, T = temporal, I = inferior) for each of the 4 quartiles, Q1 (narrowest angles; blue dotted line) through Q4 (widest angles; purple dotted line), and averaged across all quartiles (black solid line).
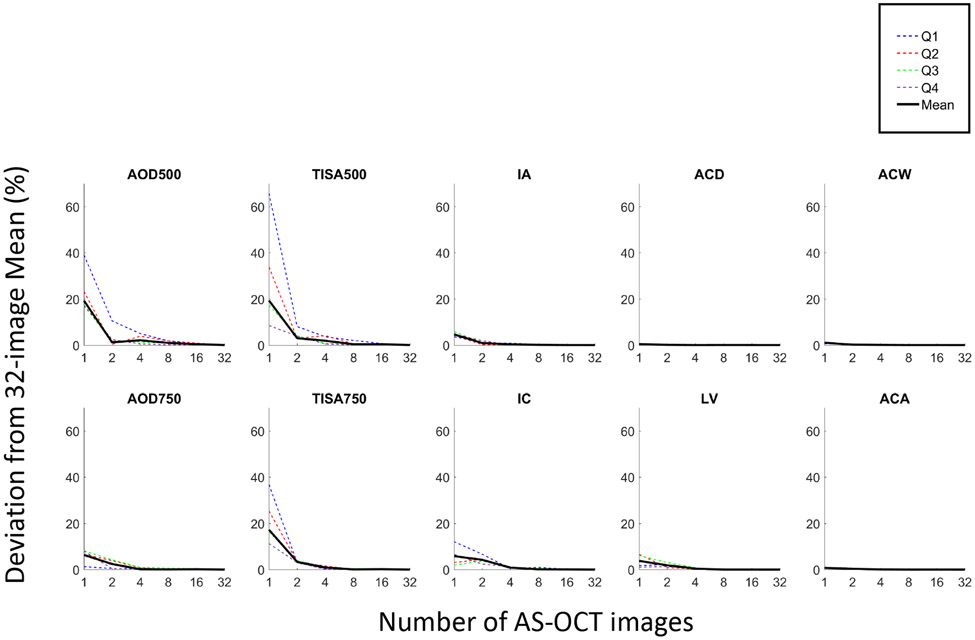
The mean measurements for 6 of the AS-OCT parameters (AOD500, AOD750, TISA500, TISA750, IC, LV) deviated substantially from 32-image values when characterized with fewer images (Figures 2 and 3). This contrasted with ACA, ACD, ACW and IA, which showed minimal deviations from their 32-image means with fewer images. Deviations with 1 image ranged between 0.44% (ACD) and 19.31% (TISA500). With an increase to 2 images, the deviations decreased to between 0.08% (ACD) and 4.21% (IC). With 4, 8, and 16 images, the deviations decreased to between 0.01% (ACD) and 2.09% (AOD500), 0.00% (ACA) and 0.95% (AOD500), and 0.00% (LV) and 0.41% (AOD500) respectively. This pattern was relatively consistent across all quartiles (Figure 3).
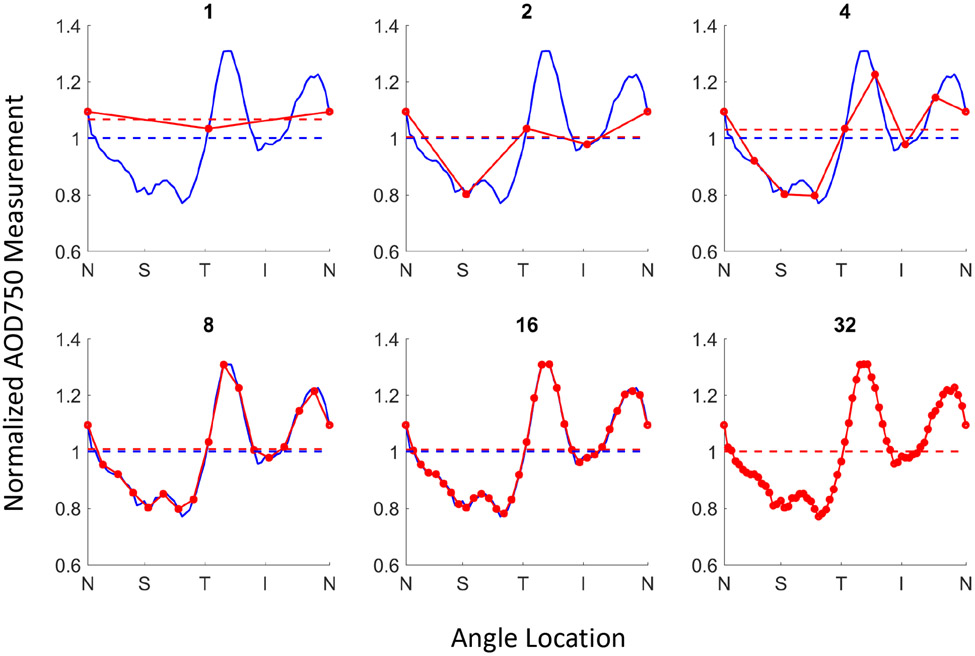
Figure 2.
Sectoral variation of AOD750 measured with 1,2, 4, 8, or 16 AS-OCT images (red solid line) compared to 32 images (blue solid line) with corresponding mean measurements (dotted lines).
Figure 3.
Deviations of mean measurements from 32-image reference values for Q1 through Q4 (dotted lines) and overall (black solid line).
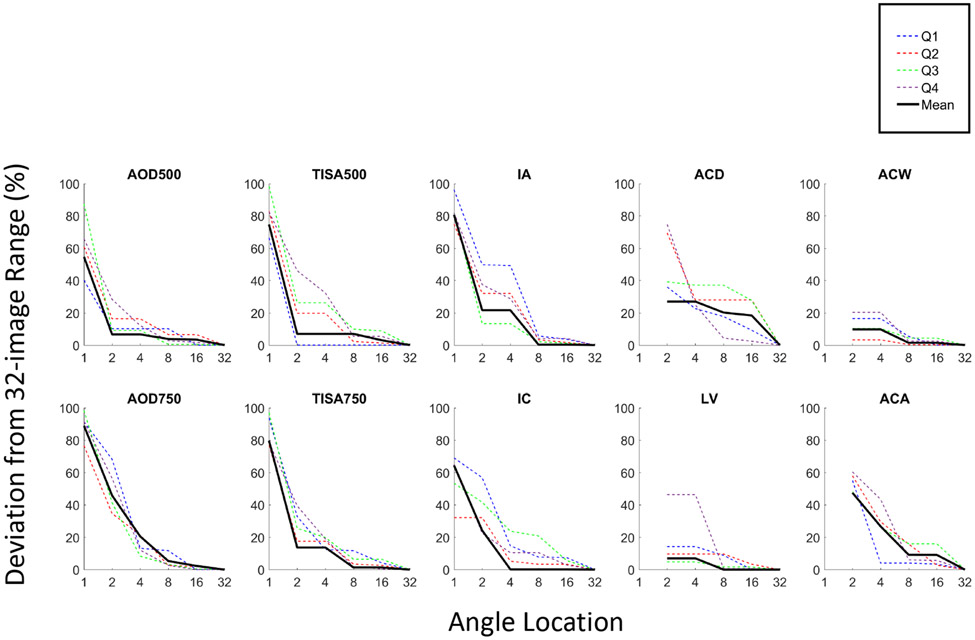
The range of measurements for all 10 AS-OCT parameters deviated substantially from the 32-image range (Figure 4). Deviations with 1 image ranged from 54.67% (AOD500) to 88.94% (AOD 750), 2 images ranged between 6.63% (AOD500) and 47.45% (ACA). With an increase to 4 images, the deviations decreased to between 6.63% (AOD500) and 26.96% (ACD). With 8, and 16 images, the deviations became <6.97% and <3.38% respectively, with the exceptions of ACD and ACA, which remained at approximately 20% and 10% deviations respectively. Eight images were required to approximate the 32-image range of measurements to within 7% for all parameters except of ACA and ACD.
Figure 4.
Deviations of range of measurements from 32-image reference values for Q1 through Q4 (dotted lines) and overall (black solid line).
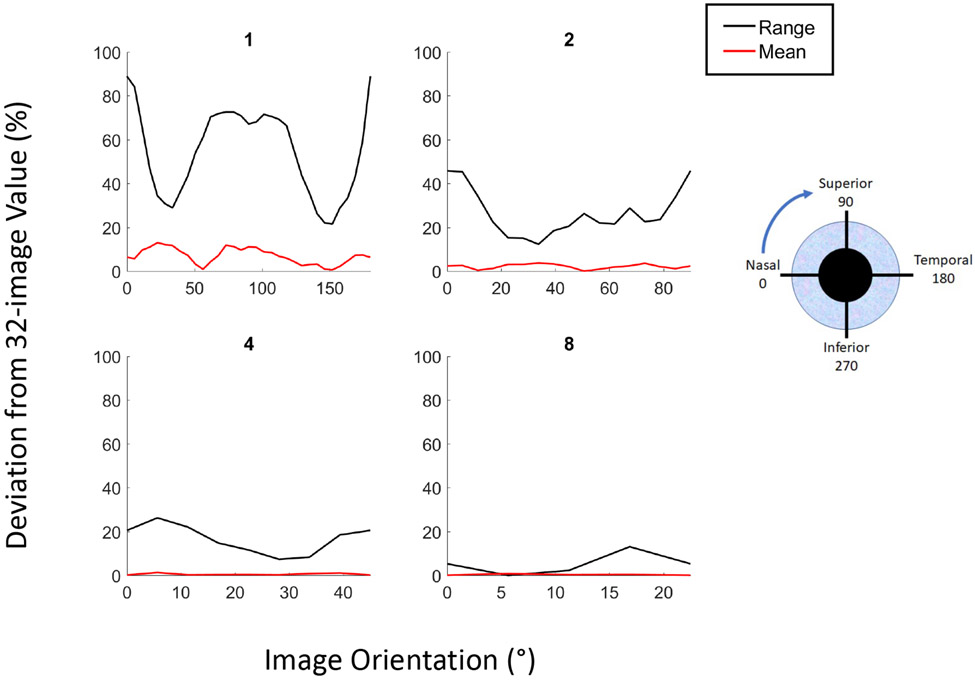
Deviation from the 32-image mean and range of AOD750 measurements with fewer images varied along the length of the angle depending on the starting meridian of the first image analyzed (Figure 5). In general, the deviation was much smaller for mean compared to range; the deviation in mean AOD750 was 3.4% or less with only 2 images. For 1 image, the deviation was most prominent if the image was oriented at 23°-203° meridian for the mean and 0°-180° for the range. For 2 images, the deviation was most prominent if the starting image was oriented at 34°-214° for the mean and 0°-180° for the range. Per study convention, all subsequent images were spaced evenly along the angle and all rotations were performed from nasal to temporal sectors (Supplementary Figure 1). As the number of images increased, the effect of changing the meridian of the initial image was reduced (Figure 5).
Figure 5.
Deviations in the mean (red lines) and range (blue lines) of AOD750 measurements of 1,2,4, or 8 AS-OCT images from 32-image values as a function of image orientation.
DISCUSSION
In this study, we explored the optimal number and orientation of AS-OCT scans to accurately characterize anterior segment anatomy in angle closure eyes. We found substantial sectoral variation among biometric parameters. Furthermore, variations in the mean and range of measurements were poorly represented with fewer than 2 images for the mean and 8 images for the range. Finally, these variations could be better captured with fewer images if the first image analyzed was not oriented along the horizontal meridian. These findings are consistent with previous studies of sectoral anatomical variation in open angle eyes and support reconsideration of conventions in AS-OCT imaging for measuring biometric parameters in angle closure eyes.16
We found that on average, when analyzing 32 images per eye, the superior and inferior sectors of the angle are more narrow than temporal and nasal sectors, a finding that is consistent with open angle eyes.7 This sectoral anatomical variation was relatively preserved in the three quartiles with the greatest angle width based on AOD500, but appears slightly decreased in the quartile with the narrowest angle width, especially in the temporal and nasal quadrants. This finding supports a previous study that found sectoral variations of angle width decrease after mean angle width drops below a specific measurement threshold.17 It also suggests that there is limited distinction between eyes with open angles and early angle closure in the continuous spectrum of anterior segment configurations.
Our results demonstrate that LV, ACW, IC, and IA vary along the extent of the angle in angle closure eyes. These findings help explain inherent sectoral variations in angle width in the context of previously described biometric models of angle width.12 LV and ACW are greater in the superior and inferior sectors, which suggests that the scleral spur is recessed posterolaterally in these sectors relative to the temporal and nasal sectors using the anterior lens surface as the axial reference point. Relative posterolateral position of the scleral spur in conjunction with anterior position of the ciliary body could contribute to sectoral angle narrowing in individual eyes.18 In contrast, IC is greatest inferiorly and smallest superiorly, which may be related to the effects of gravity causing inferior pooling of aqueous humor and tilting of the lens in the seated position .19,20 While increased IC should contribute to greater angle narrowing in the inferior compared to the superior quadrant, this effect may be offset by greater IA superiorly. Sectoral variations among these four parameters may also explain why there are sectoral differences in the agreement between AS-OCT and gonioscopy when assessing angle width.21-23
One historic convention of AS-OCT imaging is to measure the biometric properties of the anterior chamber using one image along the horizontal meridian or two images along the horizontal and vertical meridians.16 Despite decreases in sectoral anatomical variation with decreasing angle width, multiple images are still required to capture the mean and range of measurements in angle closure eyes. We found that only two images are needed to approximate the mean of all AS-OCT parameters to within 5% of their 32-image means in eyes with angle closure. This is fewer than the four images required to accurately approximate 32-image means in open angle eyes, which supports that sectoral anatomical variations decrease with angle narrowing. Quartile 1, with the most closed eyes based on AOD500 measurements, appeared to exhibit the largest deviation between the 1-image and 32-image means; this pattern was consistent for all 4 angle parameters. The 32-image range of the same eyes required either 4 or 8 images to approximate, which is consistent with open angle eyes. These findings suggest that 4 or 8 images per eye offers the best balance of non-redundant data collection with accurate characterization of the sectoral variations inherent to most biometric parameters.
Another convention of quantitative AS-OCT studies of the anterior chamber is to orient the first scan along the 0°-180° meridian and second along the 90°-270° meridian. This practice is based on ease of imaging and manufacturer-programmed scan patterns, rather than physiological significance of these particular angle sectors. An alternative to analyzing images centered on the horizontal meridian is to offset the orientation of image analysis. The most efficient method to approximate both the mean and range of angle width (AOD750) measurements with fewer (two or four) images is to orient the first scan at 28°-208°, which approximates the accuracy of analyzing 8 images with conventional orientation.
Our study has several limitations. First, study subjects were limited to one ethnicity; therefore, it is unclear if our findings can be generalized to other races. Second, the sample size of subjects in each quartile was small. Our sample size was primarily limited by the number of images we elected to analyze per eye. For example, based on the standard convention of two images per eye, we analyzed the equivalent of 640 eyes worth of images. This reiterates the importance of our results as a time-saving measure in the analysis of AS-OCT images. Third, we recognize that there are different AS-OCT phenotypes associated with angle closure disease.24-26 While we used measurements of AOD500 to stratify levels of angle closure severity, AOD500 itself is not a determinant of angle closure subtype. Therefore, our findings may not generalize to specific subtypes of angle closure. Fourth, we excluded eyes with unidentifiable scleral spurs from the analysis. While this was necessary to ensure that localized anatomical variations were not missed in some eyes, it is important to reiterate that scleral spur detectability in AS-OCT images remains operator dependent. Finally, image analysis was performed by a single experienced grader with over 40,000 images of experience. It is unclear if measurements by a less experienced grader would have the same repeatability and therefore the same sectoral variation of measurements.
In conclusion, we recommend the analysis of 2 AS-OCT images to accurately approximate the mean and 8 images to approximate the range of biometric measurements of angle width in angle closure eyes. Alternatively, 4 evenly spaced images starting at the 28°-208° meridian is also sufficient with regards to the mean and range. The exact number of images that best balances efficiency and accuracy may change with ongoing advancements in automation of the image analysis process, such as detection of the scleral spur.27 Artificial-intelligence (AI) based image analysis could facilitate quantitative analysis of AS-OCT images. However, there are currently no FDA-approved algorithms for this purpose, and it is not yet clear if automated algorithms will generalize across different patient populations and AS-OCT devices.28 Therefore, additional studies are needed to evaluate the clinical benefit of more accurate biometric measurements in the risk assessment of patients with angle closure disease.
Supplementary Material
Supplementary Figure 1. AS-OCT imaging orientation. The first image analyzed was oriented along the nasal (0°) – temporal (180°) meridian, with the remaining images evenly spaced throughout the angle, rotating counterclockwise for the right eye and clockwise for the left eye. A: orientation of 1 image. B: orientations of 2 images. C: orientations of 4 images. D: orientations of 8 images.
Supplementary Table 1. Mean measurements of AS-OCT parameters by quartile and overall.
SYNOPSIS.
A single OCT image along the nasal-temporal meridian does not accurately reflect sectoral variations of anterior segment anatomy. A multi-image approach with a starting meridian offset from the horizontal provides a more accurate alternative.
Acknowledgements
This work was supported by the National Eye Institute K23 EY029763; the American Glaucoma Society Young Clinician Scientist Research Award; and Research to Prevent Blindness unrestricted grant to the Department of Ophthalmology. B.Y.X and G.R designed the presented study. X.J, R.M.C, and R.V collected data. A.P, B.Y.X and J.S analyzed the data. All authors contributed to the final manuscript. There are no competing interests for any author.
References
- 1.Tham YC, Li X, Wong TY, Quigley HA, Aung T, Cheng CY. Global prevalence of glaucoma and projections of glaucoma burden through 2040: A systematic review and meta-analysis. Ophthalmology. 2014;121(11):2081–2090. [DOI] [PubMed] [Google Scholar]
- 2.Weinreb RN, Aung T, Medeiros FA. The pathophysiology and treatment of glaucoma: A review. JAMA - J Am Med Assoc. 2014;311(18):1901–1911. [DOI] [PMC free article] [PubMed] [Google Scholar]
- 3.He M, Jiang Y, Huang S, Chang DS, Munoz B, Aung T, Foster PJ, Friedman DS. Laser peripheral iridotomy for the prevention of angle closure: a single-centre, randomised controlled trial. Lancet. 2019;393(10181):1609–1618. [DOI] [PubMed] [Google Scholar]
- 4.Izatt JA, Hee MR, Swanson EA, Lin CP, Huang D, Schuman JS, Puliafito CA, Fujimoto JG. Micrometer-scale resolution imaging of the anterior eye in vivo with optical coherence tomography. Arch Ophthalmol (Chicago, Ill 1960). 1994;112(12):1584–1589. [DOI] [PubMed] [Google Scholar]
- 5.Seager FE, Jefferys JL, Quigley HA. Comparison of dynamic changes in anterior ocular structures examined with anterior segment optical coherence tomography in a cohort of various origins. Invest Ophthalmol Vis Sci. 2014;55(3):1672–1683. [DOI] [PMC free article] [PubMed] [Google Scholar]
- 6.Mak H, Xu G, Leung CK-S. Imaging the iris with swept-source optical coherence tomography: relationship between iris volume and primary angle closure. Ophthalmology. 2013;120(12):2517–2524. [DOI] [PubMed] [Google Scholar]
- 7.Xu BY, Israelsen P, Pan BX, Wang D, Jiang X, Varma R. Benefit of measuring anterior segment structures using an increased number of optical coherence tomography images: The Chinese American Eye Study. Investig Ophthalmol Vis Sci. 2016;57(14):6313–6319. [DOI] [PMC free article] [PubMed] [Google Scholar]
- 8.Shan J, DeBoer C, Xu B. Anterior Segment Optical Coherence Tomography: Applications for Clinical Care and Scientific Research. Asia-Pacific J Ophthalmol. 2019;8. [DOI] [PMC free article] [PubMed] [Google Scholar]
- 9.Tun TA, Baskaran M, Perera SA, Chan AS, Cheng CY, Htoon HM, Sakata LM, Cheung CY, Aung T. Sectoral variations of iridocorneal angle width and iris volume in Chinese Singaporeans: A swept-source optical coherence tomography study. Graefe’s Arch Clin Exp Ophthalmol. 2014;252(7):1127–1132. [DOI] [PubMed] [Google Scholar]
- 10.Blieden LS, Chuang AZ, Baker LA, Bell NP, Fuller TS, Mankiewicz KA, Feldman RM. Optimal number of angle images for calculating anterior angle volume and iris volume measurements. Investig Ophthalmol Vis Sci. 2015;56(5):2842–2847. [DOI] [PMC free article] [PubMed] [Google Scholar]
- 11.Xu BY, Burkemper B, Lewinger JP, Jiang X, Pardeshi AA, Richter G, Torres M, McKean-Cowdin R, Varma R. Correlation between Intraocular Pressure and Angle Configuration Measured by OCT. Ophthalmol Glaucoma. 2018;1(3):158–166. [DOI] [PMC free article] [PubMed] [Google Scholar]
- 12.Xu BY, Lifton J, Burkemper B, Jiang X, Pardeshi AA, Moghimi S, Richter G, McKean-Cowdin R, Varma R. Ocular Biometric Determinants of Anterior Chamber Angle Width in Chinese Americans: The Chinese American Eye Study. Am J Ophthalmol. July 2020. [DOI] [PMC free article] [PubMed] [Google Scholar]
- 13.Varma R, Hsu C, Wang D, Torres M, Azen SP. The chinese american eye study: design and methods. Ophthalmic Epidemiol. 2013;20(6):335–347. [DOI] [PMC free article] [PubMed] [Google Scholar]
- 14.Ho S-W, Baskaran M, Zheng C, Tun TA, Perera SA, Narayanaswamy AK, Friedman DS, Aung T. Swept source optical coherence tomography measurement of the iris-trabecular contact (ITC) index: a new parameter for angle closure. Graefe’s Arch Clin Exp Ophthalmol = Albr von Graefes Arch fur Klin und Exp Ophthalmol. 2013;251(4):1205–1211. [DOI] [PubMed] [Google Scholar]
- 15.Pardeshi AA, Song AE, Lazkani N, Xie X, Huang A, Xu BY. Intradevice Repeatability and Interdevice Agreement of Ocular Biometric Measurements: A Comparison of Two Swept-Source Anterior Segment OCT Devices. Transl Vis Sci Technol. 2020;9(9):14. [DOI] [PMC free article] [PubMed] [Google Scholar]
- 16.Porporato N, Baskaran M, Perera S, Tun TA, Sultana R, Tan M, Quah JH, Allen JC, Friedman D, Cheng CY, Aung T. Evaluation of meridional scans for angle closure assessment with anterior segment swept-source optical coherence tomography. Br J Ophthalmol. 2021;105(1):131–134. [DOI] [PubMed] [Google Scholar]
- 17.Xu BY, Pardeshi AA, Shan J, DeBoer C, Moghimi S, Richter G, McKean-Cowdin R, Varma R. Effect of Angle Narrowing on Sectoral Variation of Anterior Chamber Angle Width. Ophthalmol Glaucoma. 2019;3(2):130–138. [DOI] [PMC free article] [PubMed] [Google Scholar]
- 18.Henzan IM, Tomidokoro A, Uejo C, Sakai H, Sawaguchi S, Iwase A, Araie M. Ultrasound biomicroscopic configurations of the anterior ocular segment in a population-based study the Kumejima Study. Ophthalmology. 2010;117(9):1720–1728, 1728.e1. [DOI] [PubMed] [Google Scholar]
- 19.Atalay E, Tamçelik N, Bilgec MD. Quadrantwise Comparison of Lens-Iris Distance in Patients With Pseudoexfoliation Syndrome and Age-matched Controls. J Glaucoma. 2016;25(1):95–100. [DOI] [PubMed] [Google Scholar]
- 20.Schaeffel F. Binocular lens tilt and decentration measurements in healthy subjects with phakic eyes. Invest Ophthalmol Vis Sci. 2008;49(5):2216–2222. [DOI] [PubMed] [Google Scholar]
- 21.Xu BY, Pardeshi AA, Burkemper B, Richter GM, Lin SC, McKean-Cowdin R, Varma R. Quantitative Evaluation of Gonioscopic and EyeCam Assessments of Angle Dimensions Using Anterior Segment Optical Coherence Tomography. Transl Vis Sci Technol. 2018;7(6):33. [DOI] [PMC free article] [PubMed] [Google Scholar]
- 22.Xu BY, Pardeshi AA, Burkemper B, Richter GM, Lin SC, McKean-Cowdin R, Varma R. Differences in anterior chamber angle assessments between gonioscopy, eyecam, and anterior segment OCT: The Chinese American eye study. Transl Vis Sci Technol. 2019;8(2):5. [DOI] [PMC free article] [PubMed] [Google Scholar]
- 23.Porporato N, Baskaran M, Tun TA, Sultana R, Tan M, Quah JH, Allen JC, Perera S, Friedman DS, Cheng CY, Aung T. Understanding diagnostic disagreement in angle closure assessment between anterior segment optical coherence tomography and gonioscopy. Br J Ophthalmol. 2019;104(6). [DOI] [PubMed] [Google Scholar]
- 24.Baek S, Sung KR, Sun JH, Lee JR, Lee KS, Kim CY, Shon K. A hierarchical cluster analysis of primary angle closure classification using anterior segment optical coherence tomography parameters. Invest Ophthalmol Vis Sci. 2013;54(1):848–853. [DOI] [PubMed] [Google Scholar]
- 25.Nongpiur ME, Haaland BA, Friedman DS, Perera SA, He M, Foo L-L, Baskaran M, Sakata LM, Wong TY, Aung T. Classification Algorithms Based on Anterior Segment Optical Coherence Tomography Measurements for Detection of Angle Closure. Ophthalmology. 2013;120(1):48–54. [DOI] [PubMed] [Google Scholar]
- 26.Nongpiur ME, Atalay E, Gong T, Loh M, Lee HK, He M, Perera SA, Aung T. Anterior segment imaging-based subdivision of subjects with primary angle-closure glaucoma. Eye. 2017;31(4):572–577. [DOI] [PMC free article] [PubMed] [Google Scholar]
- 27.Xu BY, Chiang M, Pardeshi AA, Moghimi S, Varma R. Deep Neural Network for Scleral Spur Detection in Anterior Segment OCT Images: The Chinese American Eye Study. Transl Vis Sci Technol. 2020;9(2):18. [DOI] [PMC free article] [PubMed] [Google Scholar]
- 28.Pham TH, Devalla SK, Ang A, Soh Z-D, Thiery AH, Boote C, Cheng C-Y, Girard MJA, Koh V. Deep learning algorithms to isolate and quantify the structures of the anterior segment in optical coherence tomography images. Br J Ophthalmol. September 2020. [DOI] [PubMed] [Google Scholar]
Associated Data
This section collects any data citations, data availability statements, or supplementary materials included in this article.
Supplementary Materials
Supplementary Figure 1. AS-OCT imaging orientation. The first image analyzed was oriented along the nasal (0°) – temporal (180°) meridian, with the remaining images evenly spaced throughout the angle, rotating counterclockwise for the right eye and clockwise for the left eye. A: orientation of 1 image. B: orientations of 2 images. C: orientations of 4 images. D: orientations of 8 images.
Supplementary Table 1. Mean measurements of AS-OCT parameters by quartile and overall.


