

SUMMARY
Mating and aggression are innate social behaviors that are controlled by subcortical circuits in the extended amygdala and hypothalamus1–4. The bed nucleus of the stria terminalis (BNSTpr) is a node that receives input encoding sex-specific olfactory cues from the medial amygdala (MeApd)5,6, and which in turn projects to hypothalamic nuclei that control mating7–9 (MPOA) and aggression9–14 (VMHvl), respectively15. Previous studies have demonstrated that male aromatase+ BNSTpr (AB) neurons are required for mounting and attack, and may identify conspecific sex according to their overall level of activity16. However neural representations in BNSTpr, their function and their transformations in the hypothalamus have not been characterized. Here we have performed calcium imaging17,18 of male BNSTprEsr1 neurons during social behaviors. We identify distinct populations of female- vs. male-tuned neurons in BNSTpr, with the former outnumbering the latter by ~2:1, similar to MeApd and MPOA but opposite to VMHvl, where male-tuned neurons predominate6,9,19. Chemogenetic silencing of BNSTprEsr1 neurons whilst imaging MPOAEsr1 or VMHvlEsr1 neurons in behaving animals revealed, unexpectedly, that the male-dominant sex-tuning bias in VMHvl was inverted to female-dominant, while a switch from sniff- to mount-selective neurons during mating was attenuated in MPOA. Our data also indicate that BNSTprEsr1 neurons are not essential for conspecific sex identification. Rather, they control the transition from appetitive to consummatory phases of male social behaviors by shaping sex- and behavior-specific neural representations in the hypothalamus.
BNSTprEsr1 neurons control social behaviors independently of conspecific sex identification
We first examined the behavioral effects of silencing Esr1+ neurons in the principal subdivision of BNST (BNSTprEsr1 neurons) in socially experienced males. Chemogenetic silencing20 significantly reduced mounting and increased sniffing toward females, and reduced attack toward males, consistent with prior observations in inexperienced males16 (Extended Data Fig. 1a–m). Next, we optogenetically silenced21,22 BNSTprEsr1 neurons during either the appetitive or consummatory phases of social interactions with males or females (Fig. 1). Silencing BNSTprEsr1 cells during approaching or sniffing of males strongly inhibited the transition to, and duration of, attack, but did not significantly alter sniffing itself (Fig. 1e–g and Extended Data Fig. 1n–q). Silencing BNSTprEsr1 neurons during approaching or sniffing of females significantly reduced the transition to (~2 fold) and duration of (~2.5 fold) mounting (Fig. 1j–l and Extended Data Fig. 1t), while extending the total time spent sniffing (Extended Data Fig. 1r, s). Interestingly, while optogenetic silencing during attack interrupted this behavior (Fig. 1h, i), silencing during ongoing mounting had no effect (Fig. 1m, n). Optogenetic silencing of BNSTprEsr1 terminals23–25 in the medial preoptic area (MPOA) or ventromedial hypothalamus, ventrolateral subdivision (VMHvl) revealed that the sniff-to-mount transition toward females is primarily dependent upon activity in the BNSTpr→MPOA projection (Extended Data Fig. 2l), while activity in the BNSTpr→VMHvl projection is necessary for attack (Extended Data Fig. 2i). These data confirm that BNSTprEsr1 activity is required to gate the transition from appetitive to consummatory male social behaviors towards both sexes16,26, and show that this gating occurs via its projections to MPOA and VMHvl, respectively. They additionally demonstrate a requirement for BNSTprEsr1 activity during ongoing attack (but not mounting)27.
Figure 1: BNSTprEsr1 neurons are necessary for the transition from appetitive to consummatory social behaviors in sexually experienced male mice.
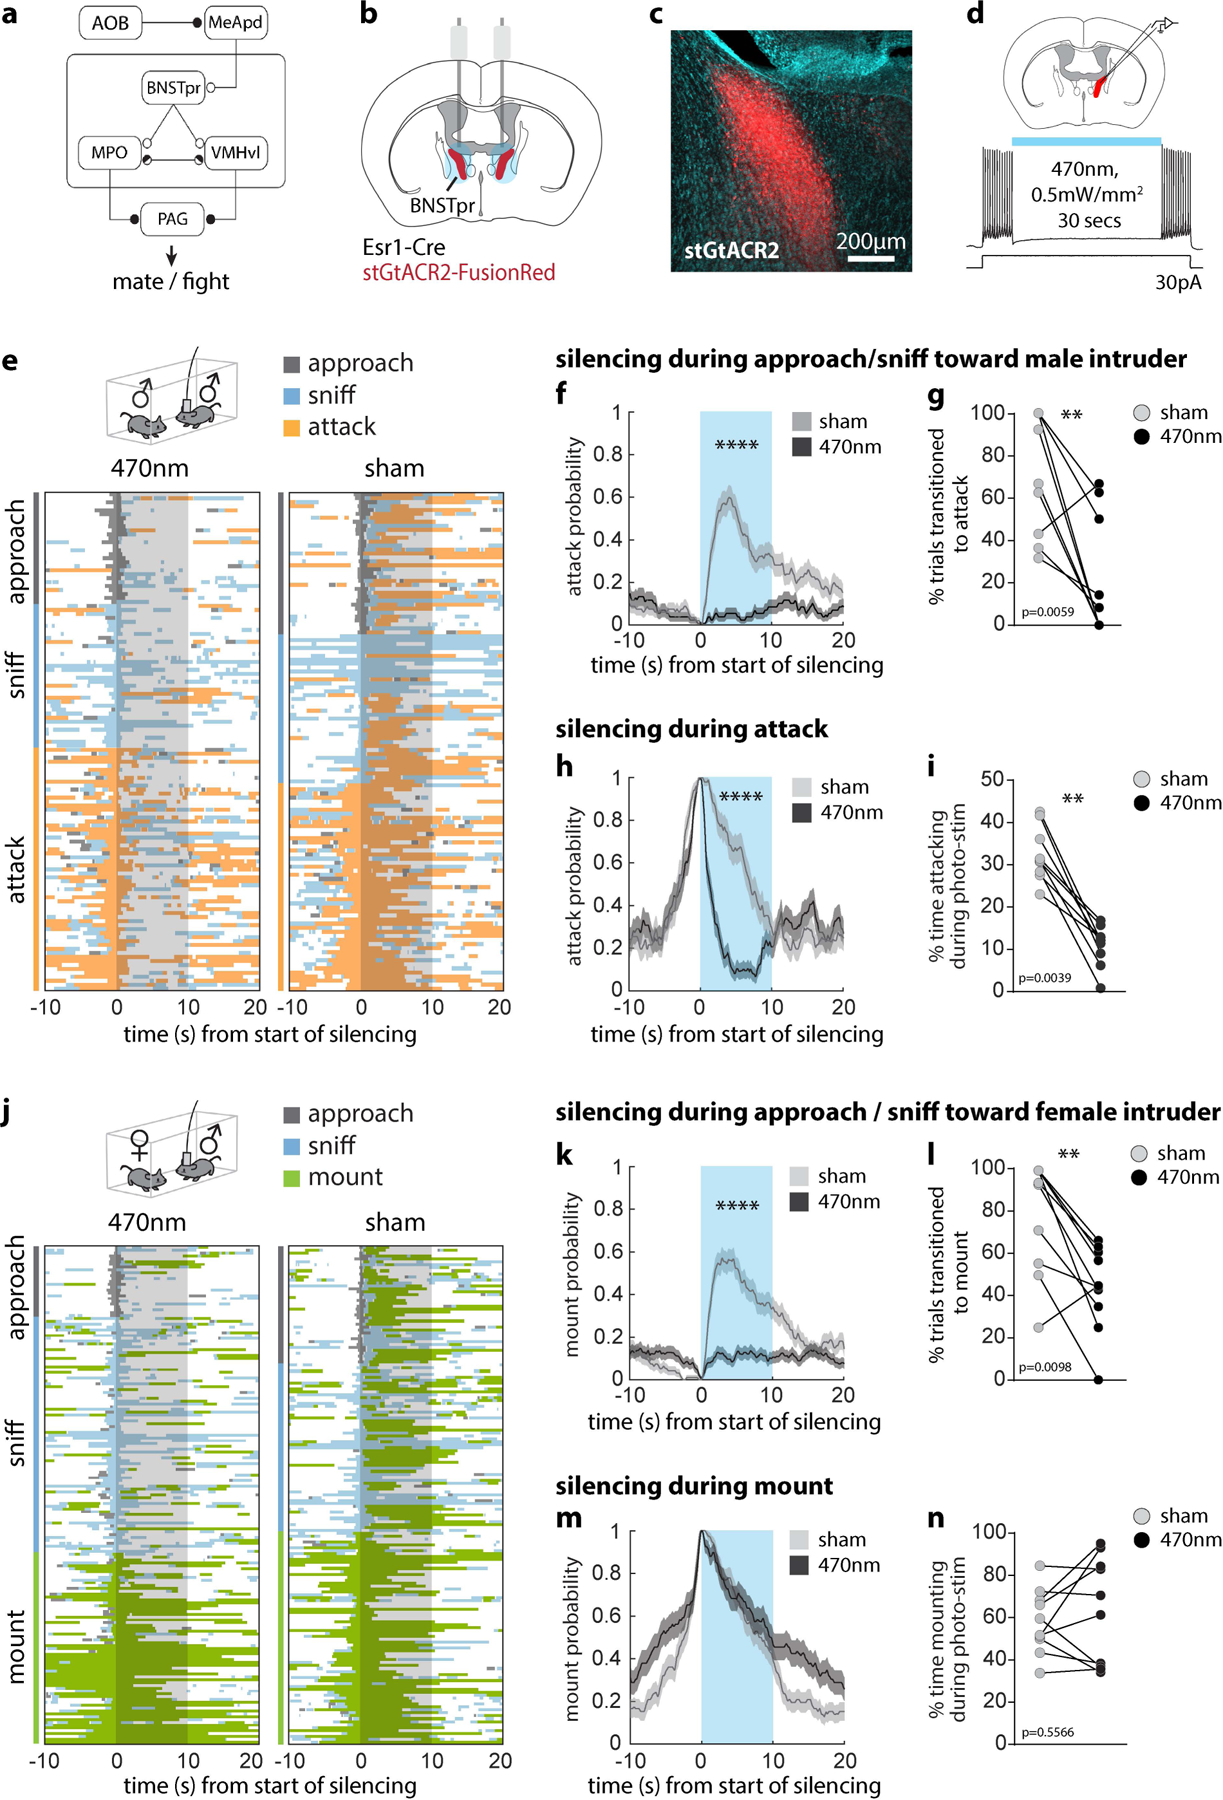
a, Schematic of circuit under study. Solid bars, inhibitory connections; Small arrows, excitatory connections. b, Illustration of bilateral optogenetic silencing in BNSTpr. c, Representative image showing stGtACR2 expression in BNSTpr. Similar expression patterns were observed in all animals tested (n = 10). d, Whole cell voltage clamp showing light mediated silencing of BNSTprEsr1 neurons in an acute slice preparation. e, j, Raster plots showing distribution of social behaviors relative to optogenetic silencing. f, h, k, m, Mean probability of behavior occurring relative to onset of optogenetic silencing. g, l, percent of trials that transitioned to attack (g) or mount (l). i, n, Duration of attack (i) or mount (n) as a percentage of the 10s optogenetic silencing interval. Statistics: two-sided Wilcoxon signed-rank test (g, i, l, n), two-sided Kolmogorov-Smirnov test (f, h, k, m). Values are plotted as mean ± SEM. ****p < 0.0001; ***p < 0.001; **p < 0.01; *p < 0.05. Male-male trials: n=131 stim and 125 sham trials pooled from 10 mice. Male-female trials: n=181 stim and 170 sham trials pooled from 10 mice. The mouse brain in this figure (b) has been reproduced with permission from “The mouse brain in stereotaxic coordinate”, Paxinos G. and Watson C., copyright Elsevier Academic Press 2001.
A previous study concluded that BNSTprAB neurons are required for intruder sex recognition, based on male vs. female cue-preference tests16. Males emit USVs in response to female but not male urine9,28. We performed bilateral optogenetic silencing of BNSTprEsr1 neurons using GtACR2 and tested both cue preference and USVs. Consistent with earlier data16, we observed a reduced preference for female over male cues (Extended Data Fig. 1r, w). Surprisingly, however, there was no loss of USVs towards female urine or intact females (Extended Data Fig. 1s, x). Thus, while silencing BNSTprEsr1 neurons reduced the males’ preference for female cues, it did not eliminate their ability to recognize and distinguish female vs. male cues.
The male BNSTprEsr1 population represents conspecific sex via a cell identity code
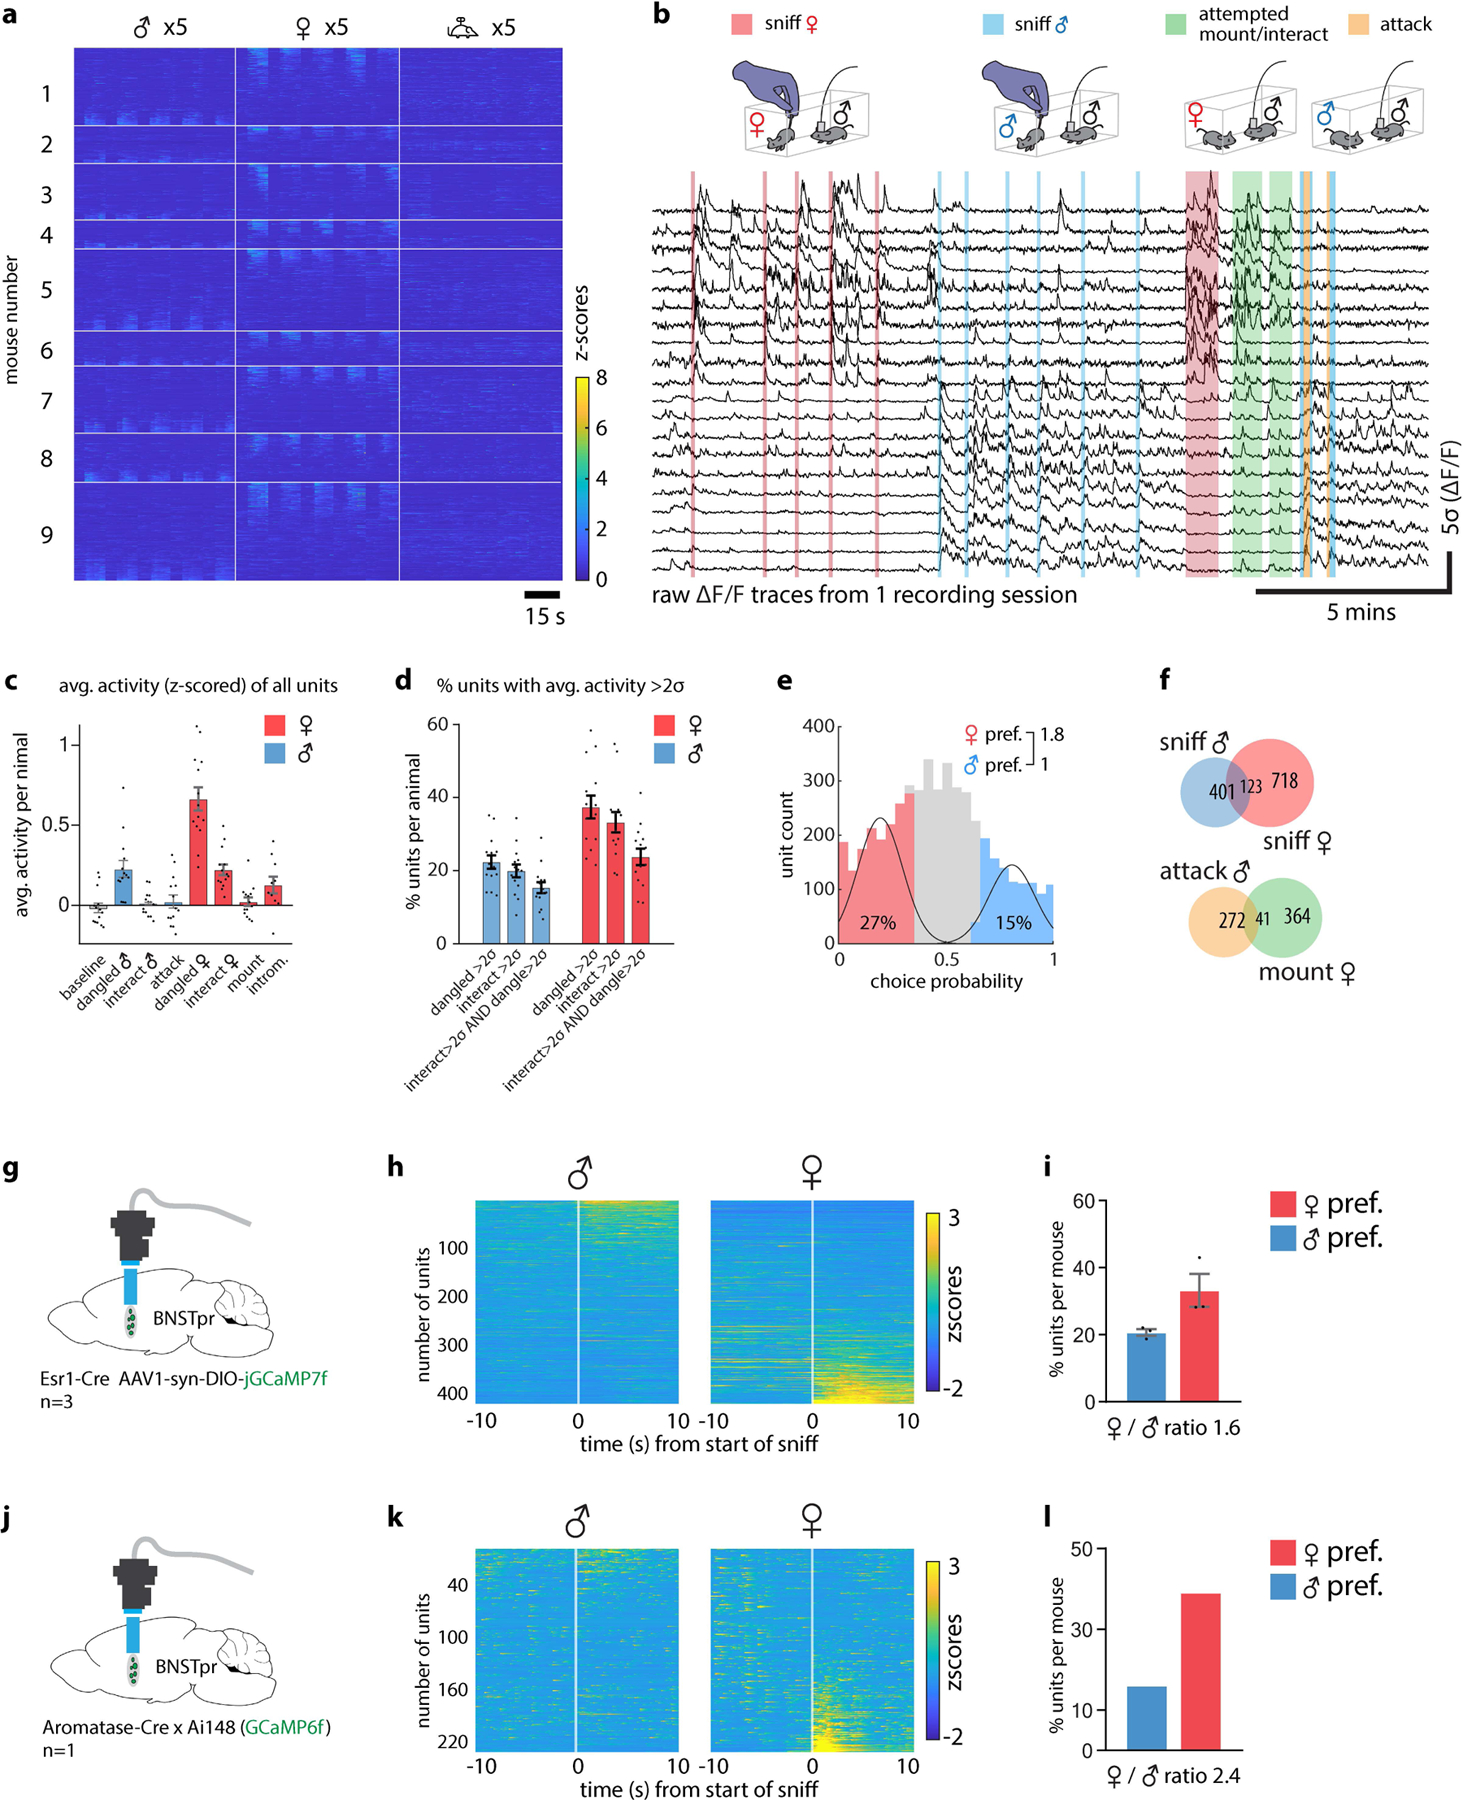
Previous bulk calcium measurements of BNSTprAB neurons suggested that intruder sex is encoded by overall activity, such that strong activity indicates a female, while weaker activity indicates a male16. To reveal how sex and social behaviors are represented in BNSTpr at the single cell level, we imaged BNSTprEsr1 neurons (a subset partially overlapping with, but larger than, AB neurons29) expressing jGCaMP7f30 using a microendoscope (Inscopix, Inc.; Fig. 2a). By utilizing a prism-coupled gradient refractive index (GRIN) lens, we were able to image the dorso-ventral extent of this elongated nucleus in behaving mice, yielding almost three-fold more units per session compared to conventional cylindrical GRIN lenses (Fig. 2b, c; Extended Data Fig. 3a–h).
Figure 2: BNSTprEsr1 neurons represent intruder sex via a cell-identity code.
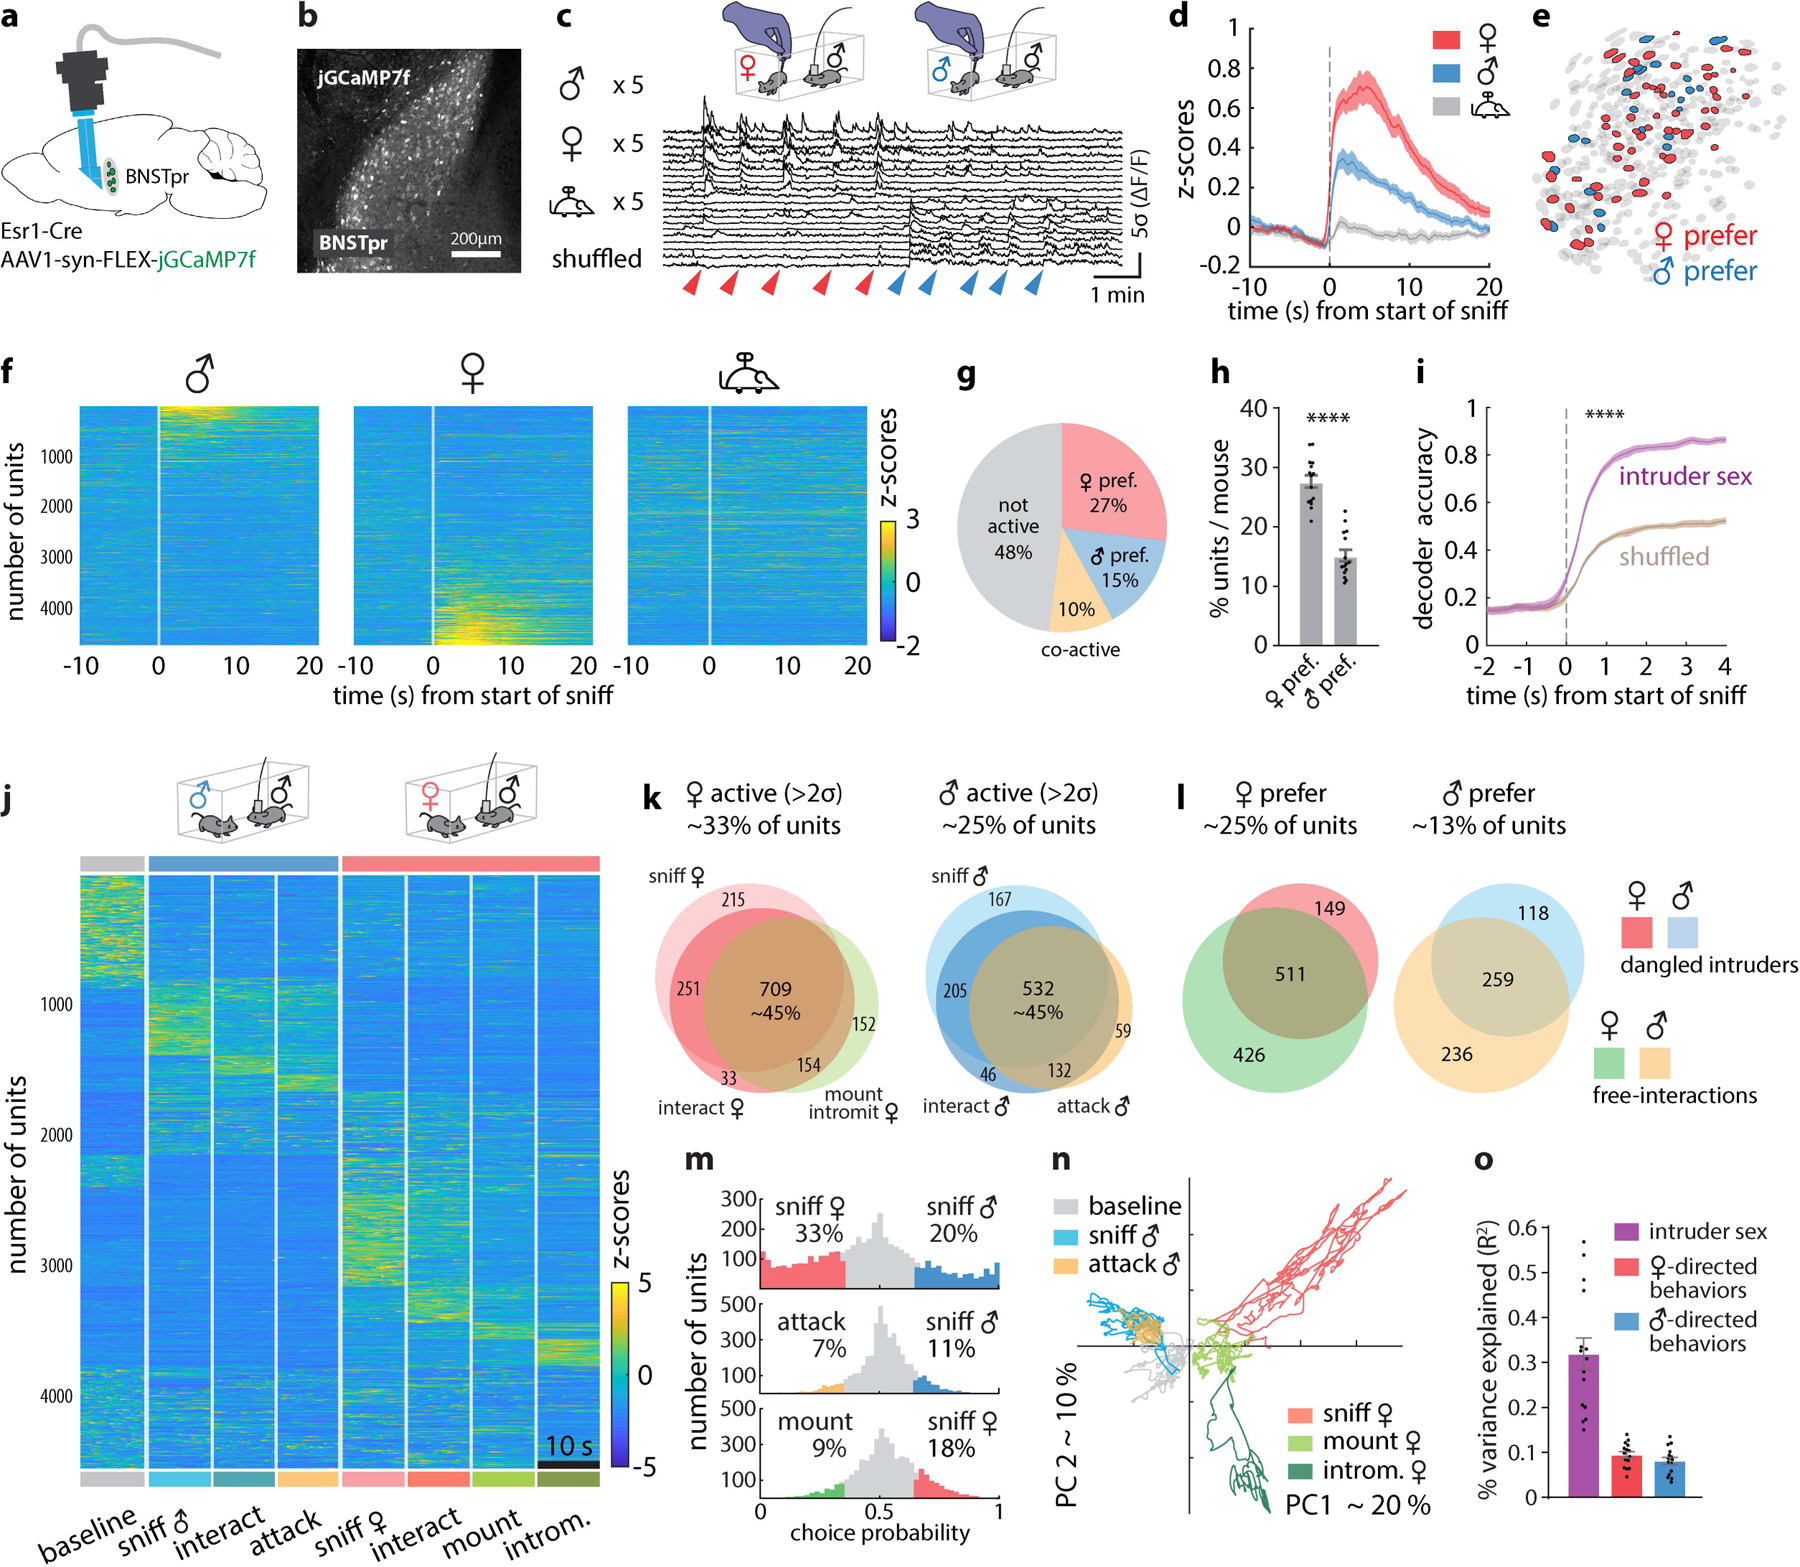
a, Illustration of BNSTpr miniscope imaging using a prism-coupled GRIN lens. b, Representative image showing jGCaMP7f expression in BNSTpr. Similar expression patterns were observed in 20 mice. c, Imaging experiment paradigm and responses of 20 example neurons during dangled presentation of conspecifics. d, Mean responses of BNSTprEsr1 neurons during 5 stimulus presentations. e, Spatial map of female- and male-preferring units from 1 representative mouse. f, Single-unit responses during 5 repeated dangling presentations of male, female or toy mice. g, Mean percentages of male- or female-preferring or co-active units (calculated by choice probability; see Methods). h, Percentage of male- or female-preferring units per imaged animal. i, Performance of time-evolving SVM decoders (Methods) of intruder sex. j, Raster plot of BNSTpr neuronal activity during male-male or male-female unrestrained social interactions. For comparative purposes, all frames containing each behavior scored during a 30-minute social interaction were concatenated and binned into 10s intervals; Average responses of each unit across all bins are shown. k, Venn diagram of units that are >2σ over pre-intruder baseline during male-male / male-female interactions. Color code as in (j). l, Venn diagram of units that are male- or female- preferring (determined by choice probability) during dangled presentations of, or free interactions with, intruders. Color scheme to right. m, Choice probability histograms and percentages of tuned units. n, Population activity vectors in the first two principal components space during male- and female-directed behaviors, from 1 example mouse. o, Variance (R2) in population activity that can be explained by conspecific’s sex or by male- or female-directed consummatory behavior. Statistics: two-sided Wilcoxon signed-rank test (h). two-sided Kolmogorov-Smirnov test (i). Values are plotted as mean ± SEM. ****p < 0.0001. n=15 mice. The mouse brain in this figure (a) has been reproduced with permission from “The mouse brain in stereotaxic coordinate”, Paxinos G. and Watson C., copyright Elsevier Academic Press 2001.
We first performed trials in which male, female, or toy mice suspended by their tails were presented to male residents in their home cage (5 trials each, 10s per trial), permitting sniffing but not mounting or attack19. We observed distinct BNSTprEsr1 populations responding to either male or female “dangled” intruders, but not to toy mice (Fig. 2c, f and Extended Data Fig. 4a). The average down-sampled bulk calcium peak response (5 × 10 s trials) to female intruders was ~2 times that of male intruders (Fig. 2d), explaining prior bulk calcium imaging results16. Analysis of single unit calcium responses (extracted using CNMF-E31,32, see Methods) to intruders revealed that 27% of the units were female preferring (determined by choice probability19 (CP); see Methods) vs. 15% that were male preferring (Fig. 2g, h and Extended Data Fig. 4e). Qualitatively similar results were obtained by imaging of BNSTprAB neurons16, a functionally equivalent subset of BNSTprEsr1 neurons33 (Extended Data Fig. 4j–l). A temporal linear decoder9 (Support Vector Machine, SVM) trained on BNSTprEsr1 data could identify the sex of a dangled intruder, in held-out test data, within 1 sec of intruder presentation (p<0.0001) compared to shuffled control data (Fig. 2i), suggesting that olfactory cues are sufficient to generate distinct cellular representations of intruder sex in BNSTpr. Male and female-preferring cells were not topographically segregated but appeared intermingled (Fig. 2e).
We asked next whether BNSTprEsr1 population activity also represents distinct social behaviors, by imaging under conditions where the resident male freely interacted with male or female intruders (4,585 units from 15 mice). We constructed raster plots of population activity during a 10s interval from each of 8 different conditions (baseline, sniff male/female, interact with male/female, attack, mount, and intromission; see Methods) (Fig. 2j). Overall, ~33% of imaged units were active (>2σ) during female encounters, while ~25% were activated during male encounters. Of these, ~45% were activated during appetitive and/or consummatory behaviors toward the intruder (Fig. 2k, orange circle and Extended Data Fig. 4b, c, d). Approximately 77% of the female-preferring (511 out of 660) and 70% of the male-preferring (259 out of 377) units that exhibited a sex preference during dangling trials retained this preference during subsequent unrestrained social interactions (Fig. 2l).
We computed the tuning of BNSTprEsr1 neurons for intruder sex or specific behaviors using choice probability19, a binary comparison. Among all units that were active during appetitive and/or consummatory behaviors, a larger percentage were male- or female-tuned (20% male, 33% female), than were consummatory behavior-tuned (7% attack, 9% mount) (Fig. 2m and Extended Data Fig. 4f). Principle Component (PC) analysis indicated that the largest source of variance in neural activity was explained by intruder sex (Fig. 2n, PC1). Linear regression (Methods) revealed that intruder sex accounted for over 30% of the observed variance, while only 9% and 8% of the variance was explained by behavior towards females and males, respectively (Fig. 2o and Extended Data Fig. 3i). Together, these results suggest that a major source of variance in BNSTprEsr1 population activity is the sex of the intruder (or an internal motive state highly correlated with intruder sex), and that sex is represented by population coding, as in MPOA and VMHvl9,19.
Control of hypothalamic representations of conspecific sex by BNSTprEsr1 neurons
We next directly compared representations of intruder sex in MeApd, BNSTpr, VMHvl, and MPOA Esr1+ neurons, imaged under identical conditions (Fig. 3a–f; Extended Data Fig. 3i). Like BNSTpr, both the MPOA and VMHvl Esr1+ populations contained distinct subsets of male- and female-preferring cells9,19. However, whereas among MPOAEsr1 and MeApdEsr1 neurons female-preferring outnumbered male-preferring units, by about 2:1 (as in BNSTprEsr1), among VMHvlEsr1 neurons the ratio was reversed (1:2; Fig. 3o, p, gray bars; Extended Data Figs. 3i and 5p–s), consistent with earlier results6,9,19.
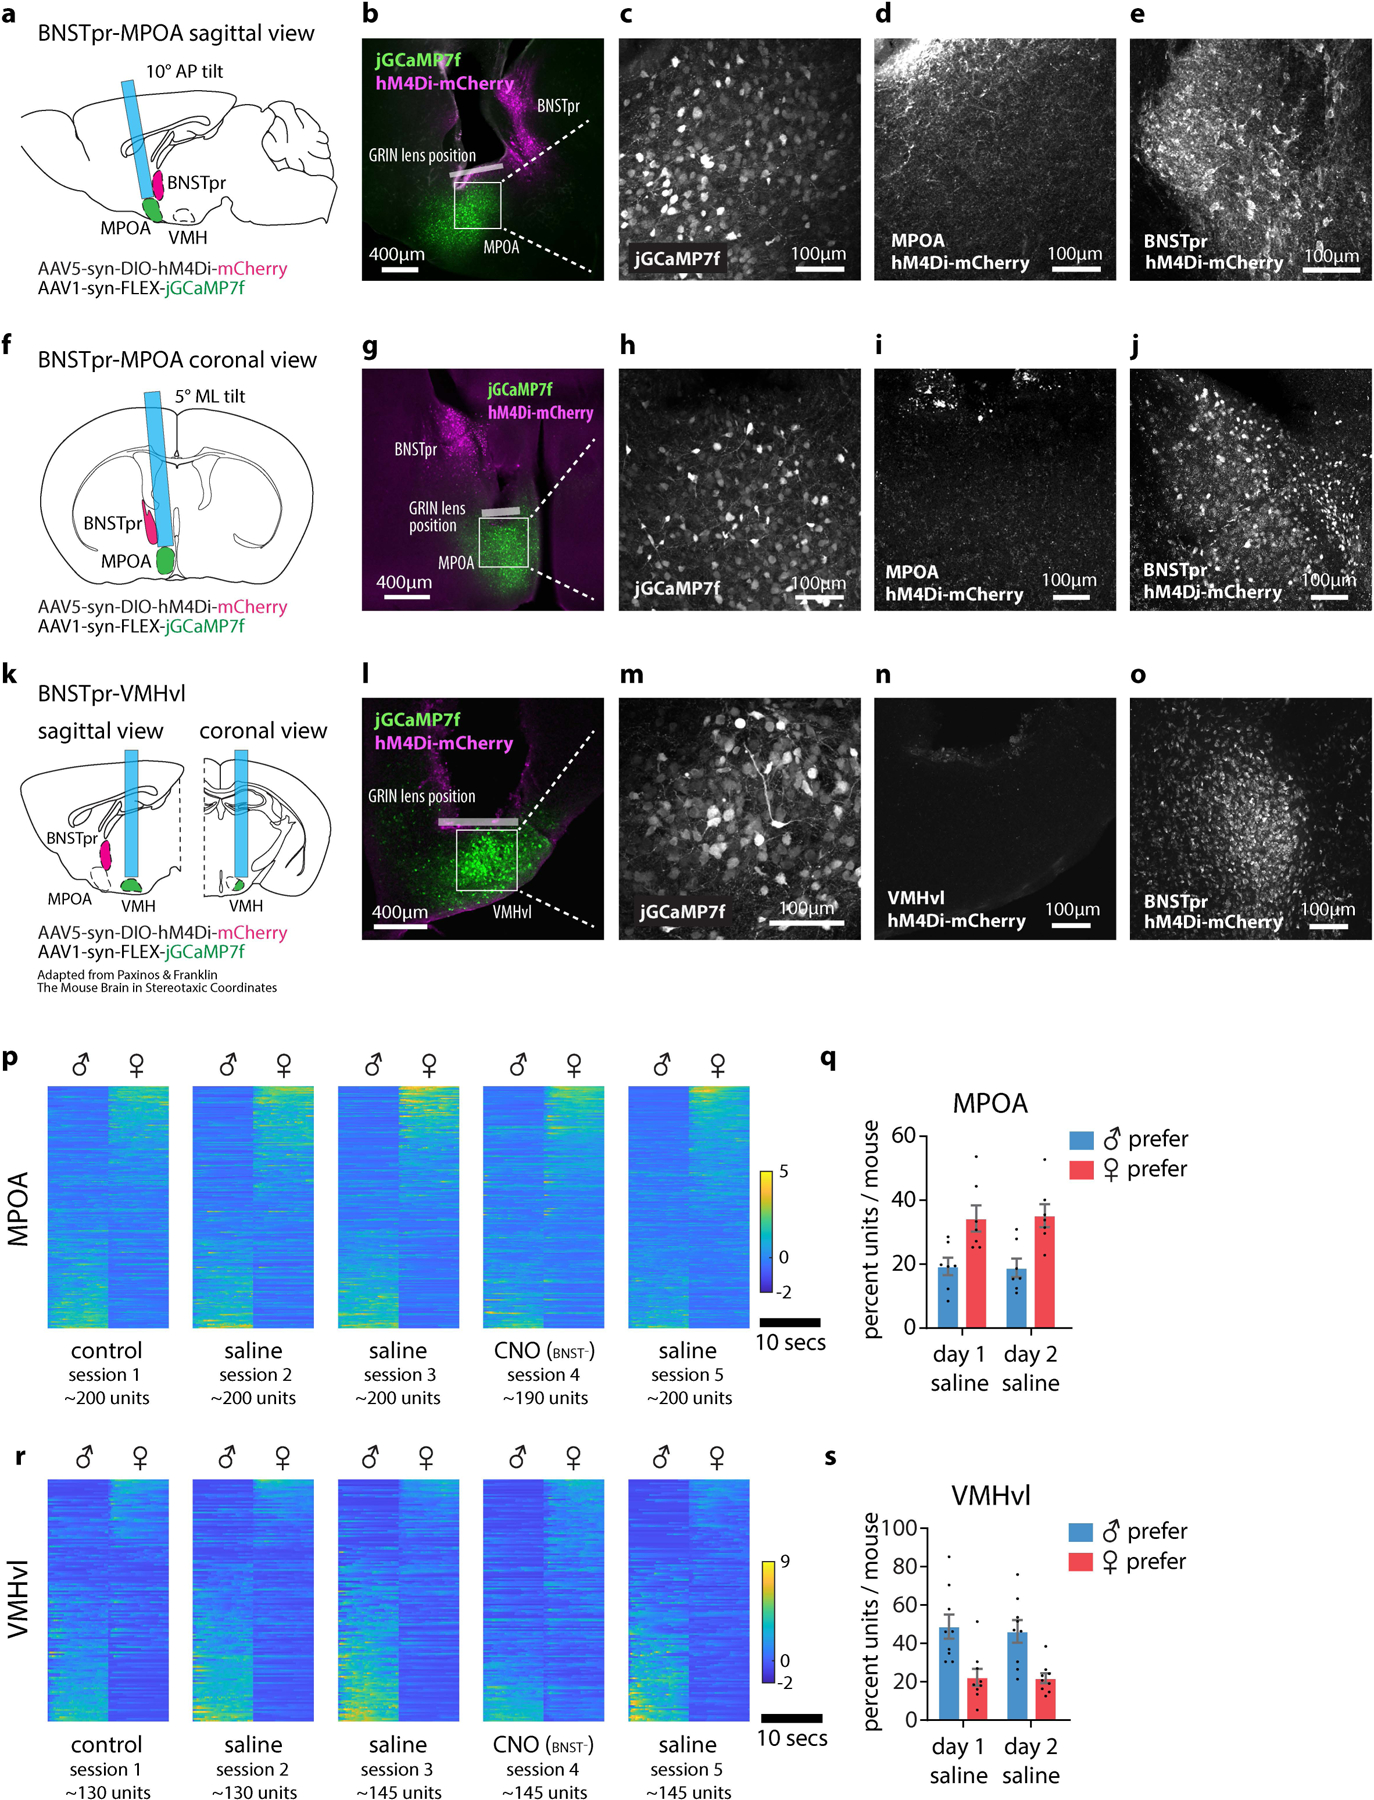
Figure 3: BNSTpr is required for male-biased intruder sex representations in VMHvl.
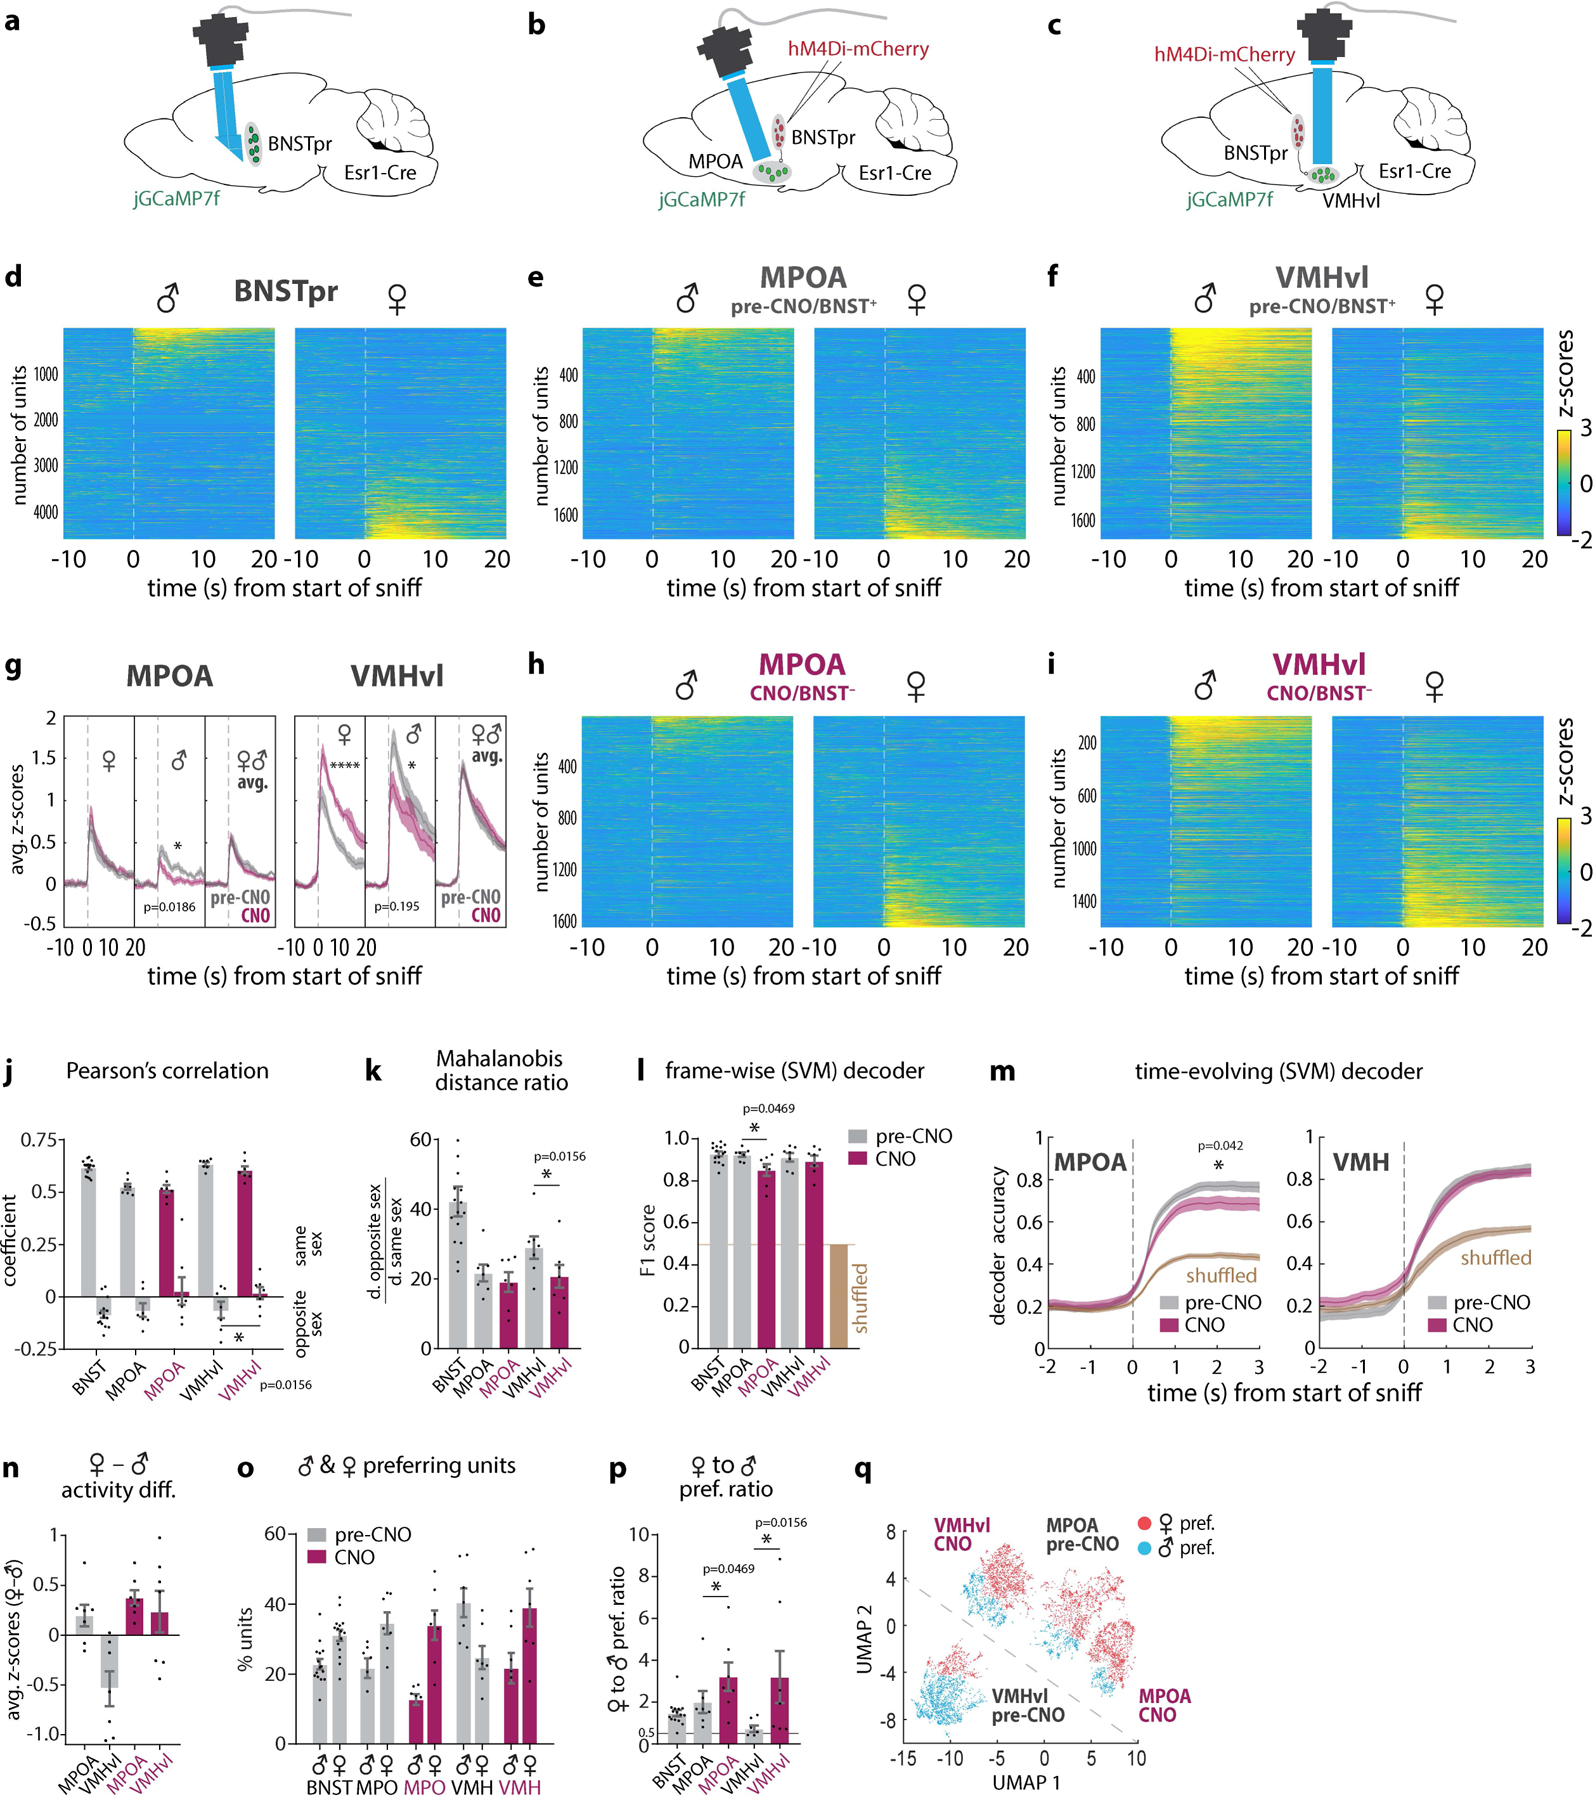
a, Illustration of BNSTpr miniscope imaging. b, c, Illustration of ChemoScope imaging in MPOA (b) and VMHvl (c) while silencing BNSTpr. d, e, f, h, i Average single-unit responses imaged during 5 repeated dangling presentations of male or female mice in BNSTpr (d), pre-CNO MPOA (e), and pre-CNO VMHvl (f), or CNO-treated (7.5mg/kg CNO i.p.) MPOA (h), and VMHvl (i), “Pre-CNO” animals received an equivalent volume of saline i.p. CNO controls shown in ED Fig. 1l, m. g, Average bulk (down-sampled) calcium responses to dangled female or male stimuli, or combined male and female responses, before (i.e., saline-injected) vs. after the application of CNO, in MPOA (left panel) or VMHvl (right panel). j, Average Pearson’s correlation coefficient and k, average Mahalanobis distance ratio between population responses to dangled mice of the same or opposite sex in BNSTpr, MPOA and VMHvl, ±CNO. l, m Performance of frame-wise (l) or time-evolving (m) decoders. n, Average difference between responses to female or male stimuli in MPOA and VMHvl. o, Average percentage of male- vs female-preferring units. p, Ratio of female to male-preferring units. q, supervised UMAP embedding of population responses to male and female stimuli across MPOA and VMHvl (see Methods). Statistics: two-sided Kolmogorov-Smirnov test (g, m). two-sided Wilcoxon signed-rank test (j, k, l, p). Values are plotted as mean ± SEM. ****p < 0.0001; ***p < 0.001; **p < 0.01; *p < 0.05. n=7 mice per imaged region.
The mouse brain in this figure (a-c) has been reproduced with permission from “The mouse brain in stereotaxic coordinate”, Paxinos G. and Watson C., copyright Elsevier Academic Press 2001.
Since BNSTpr projects directly to MPOA and VMHvl34 and encodes conspecific sex identity16, we hypothesized that inhibiting BNSTprEsr1 neurons should eliminate sex-specific representations in MPOA and VMHvl. To test this, we combined chemogenetic silencing of BNSTprEsr1 neurons using hM4Di20, with microendoscopic imaging of VMHvlEsr1 or MPOAEsr1 neurons expressing jGCaMP7f30 (Fig. 3b,c and Extended Data Fig. 5a–o), a method we call “ChemoScope”. Imaging during presentation of dangled intruders was performed both in control (“pre-CNO”, i.e. saline-injected) and experimental (CNO-injected) conditions in the same animals, to permit within-subject comparisons at the single-cell level.
Surprisingly, silencing BNSTprEsr1 neurons during presentation of dangled male or female intruders did not eliminate sex-specific representations in VMH and MPOA (Fig. 3e vs. h; 3f vs. i). A small, but statistically significant, decrease in the separation of male vs. female representations was observed in VMHvl, as indicated by the Pearson’s correlation coefficient and Mahalanobis distance ratio19 (Fig. 3j, k, VMHvl, opposite sex, gray vs. maroon bars). However, the performance of linear decoders of intruder sex, trained on data from MPOAEsr1 or VMHvlEsr1 neurons, was only slightly decreased in MPOA by silencing BNSTprEsr1 neurons, and was still well above chance (computed using shuffled data). Sex decoding in VMHvl was unaffected (Fig. 3 l–m). There was a slight increase in the difference between average z-scored responses to females vs. males in MPOA, and a larger increase in VMHvl (Fig. 3n), likely reflecting a decrease in the mean response to male intruders in both nuclei, and an increase in the mean response to female intruders in VMHvl (Extended Data Fig. 6q–s).
In contrast to these relatively subtle effects, silencing BNSTprEsr1 neurons unexpectedly inverted the 2:1 ratio of male- to female-tuned units in VMHvl, to the female-dominant ratio seen in MPOA (~2:1; Fig. 3p; VMH, gray vs. maroon bars). This reversal of sex bias in VMHvl reflected both a decrease in male-preferring units, and an increase in female-preferring units (Fig. 3o). In MPOA, by contrast, the ratio of female- to male-preferring units was slightly increased by BNSTpr silencing (Fig. 3p, q and Extended Data Fig. 6s, t). Together, these data indicate that the activity of BNSTprEsr1 neurons is not required for the neural coding of intruder sex identity by MPOAEsr1 and VMHvlEsr1 neurons. Rather, it is required to invert, in VMHvl, the female bias in population representations of intruder sex seen in BNSTpr, MPOA and MeApd6, to a male bias.
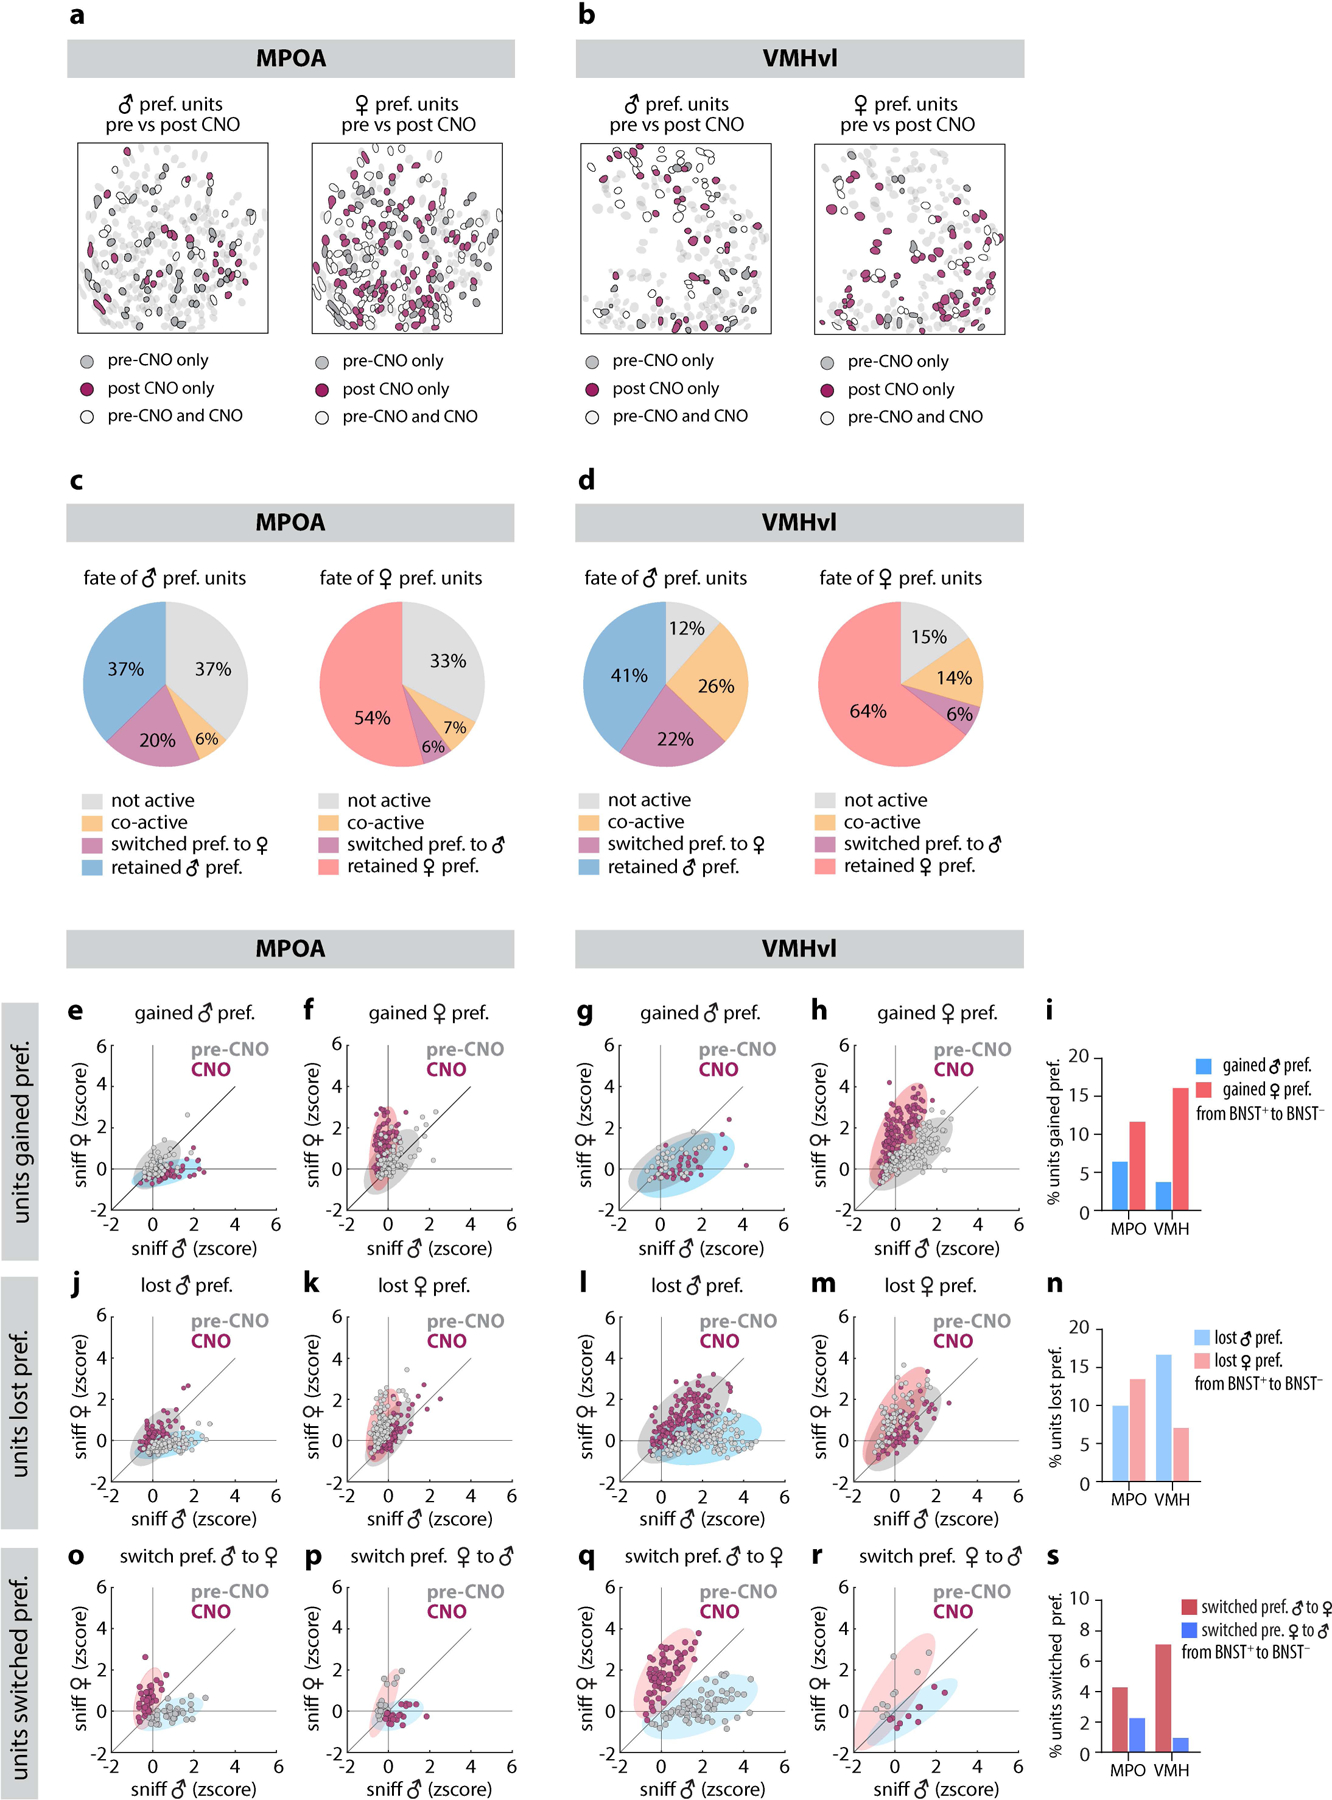
The inversion of sex tuning bias in VMHvl caused by silencing BNSTprEsr1 neurons could be explained by two mechanisms: conversion, in which a subset of initially male-tuned VMHvlEsr1 neurons switched to female-tuning; or selection, in which new female-tuned units appeared and replaced silenced male-tuned units. To distinguish these possibilities, we registered the spatial maps imaged during pre-CNO (saline-injected) and CNO sessions within the same animals, and tracked single unit responses19 (over 60% of all recorded MPOAEsr1 units and over 55% of all recorded VMHvlEsr1 units) during male and female dangling trials, before and after CNO treatment (Fig. 4 a, i). Consistent with the data from all (i.e., non-tracked) units (Fig. 3p), we observed an approximate inversion of the ratio of male- to female-preferring VMHvlEsr1 neurons, from 2m:1f before, to 1m:1.7f after, BNSTpr silencing (Fig. 4b, c). In contrast, the ratio of female- to male-preferring MPOAEsr1 tracked units was slightly increased in CNO, from 1.5f:1m to 2f:1m (Fig. 4j, k; cf. Fig. 3p).
Figure 4: Differential effect of BNSTpr silencing on sex representations in VMHvl and MPOA revealed by sequential imaging of identified units.
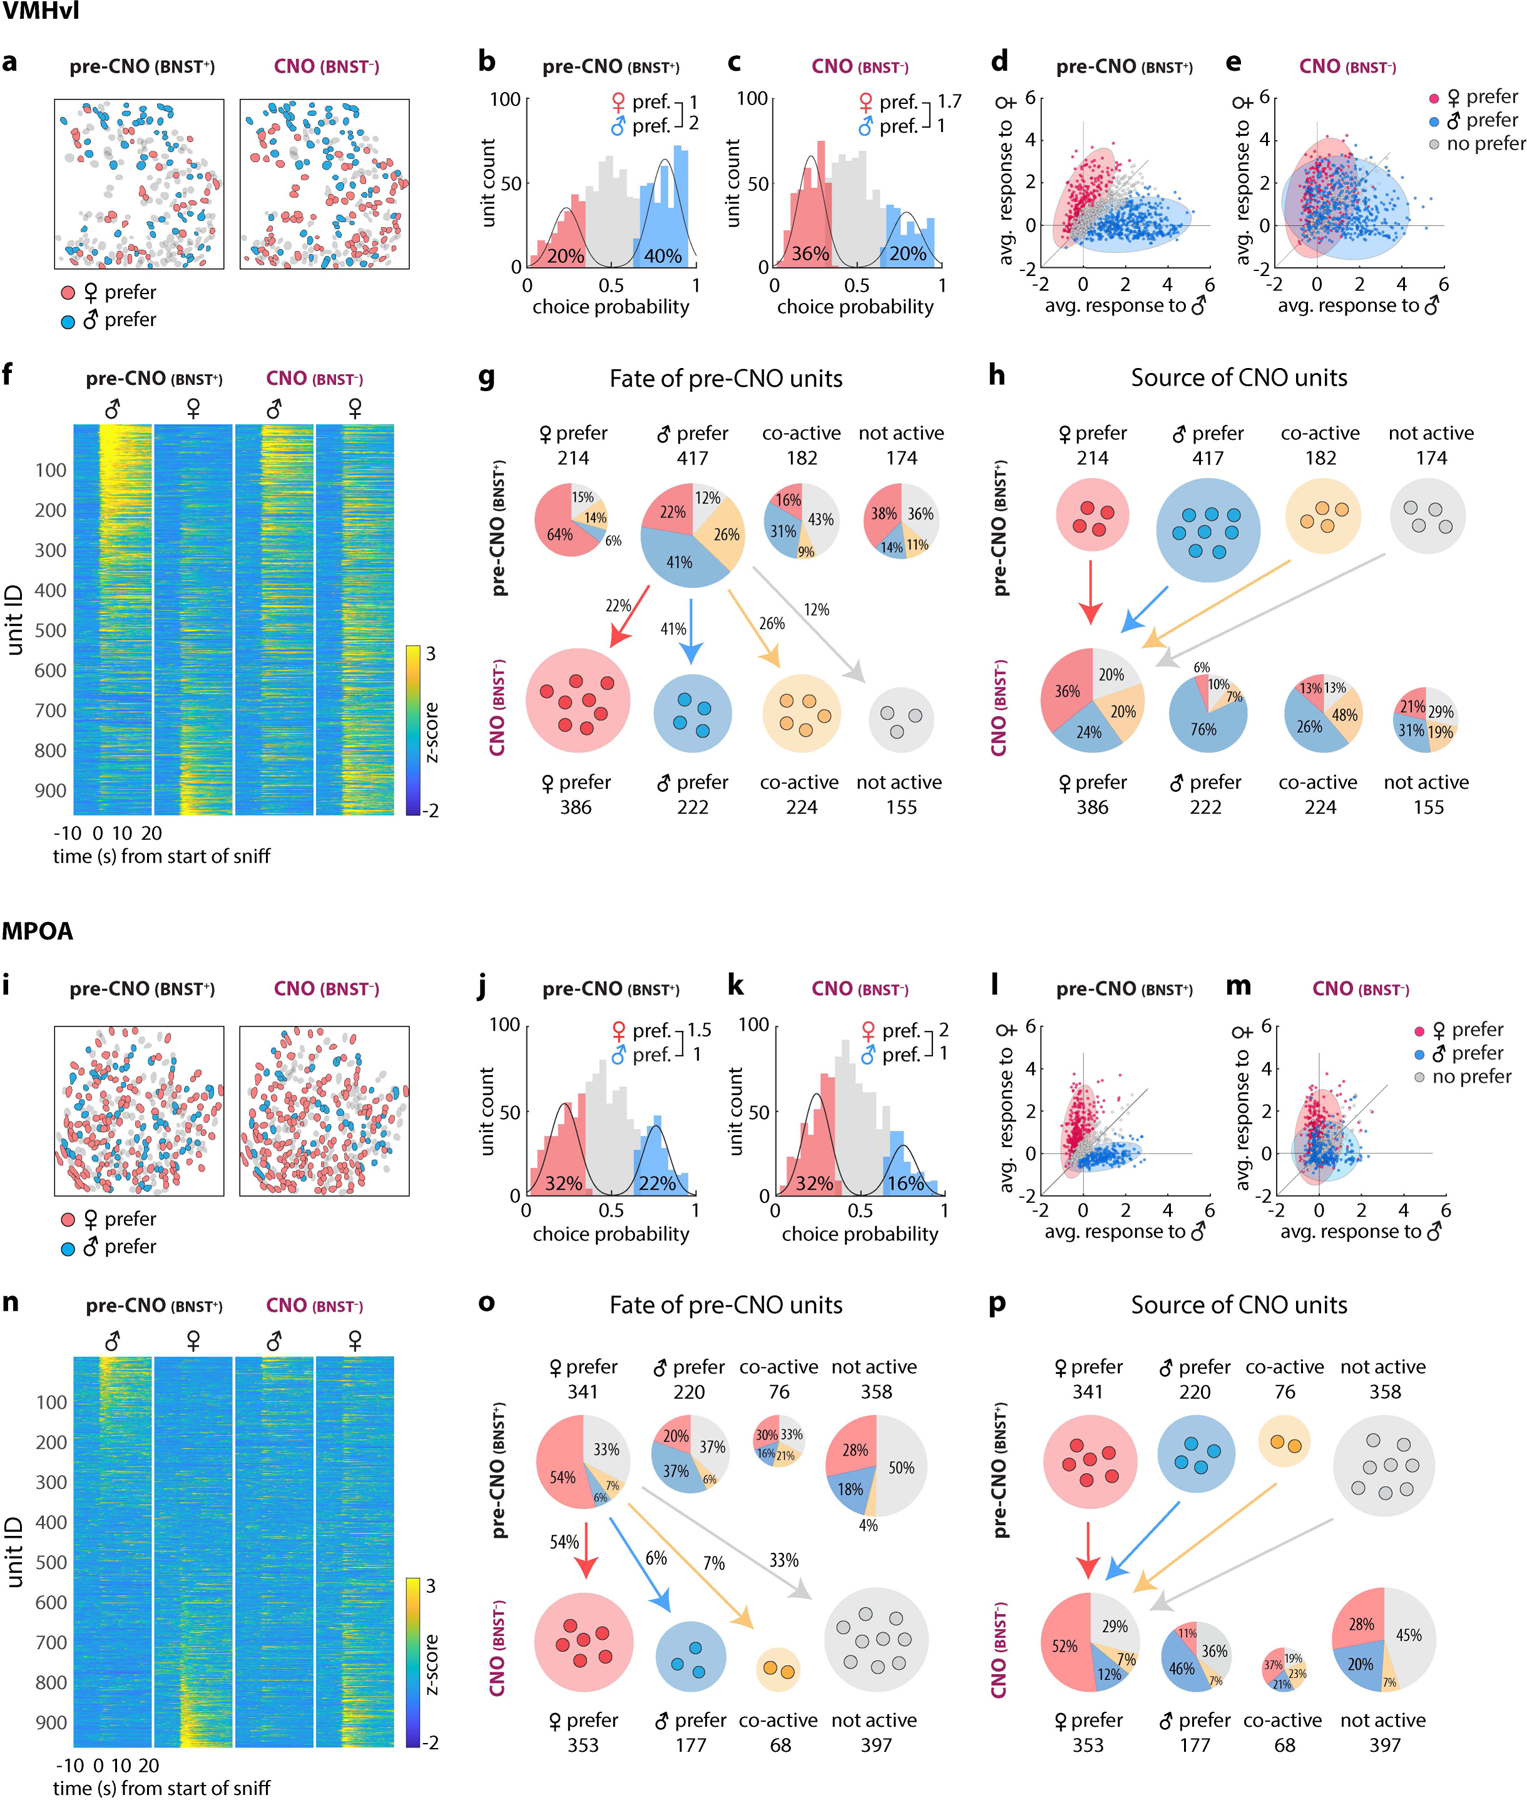
a, i, Spatial maps of tracked male and female-preferring units in VMHvl (a) and MPOA (i) before and after CNO application. f, n, Single-unit responses to dangled male or female stimuli in VMHvl (f) or MPOA (n) before vs. after CNO application. Sorting of units is the same pre- vs. post-CNO b, c, j, k, Histograms of male- vs. female-tuned units determined by choice probability from single-unit responses to dangled intruders. d, e, l, m, Scatter plots of single-unit responses to dangled male and female mice before and after CNO application in VMHvl (d, e) or MPOA (l, m). Each dot (d, e, l, m) represents a single neuron and the color of each dot indicate its male / female preference before CNO application. Distribution of male- or female-preferring units before (d, l) and after (e, m) CNO are shown as colored ellipses. g, h, o, p, Pie charts showing fates (g, o) and sources (h, p) of units in VMHvl (g, h) or MPOA (o, p) before vs. after CNO treatment, respectively. The percentage of units of each type that retained or switched sex-preference, responded to both sexes (“co-active”) or responded to neither sex (“not active”) is indicated.
Single-unit tracking revealed the source of the additional female-preferring Esr1+ units in VMHvl following BNSTpr silencing (Fig. 4h). Almost a quarter of the female-preferring units (24%) in CNO-treated animals derived from pre-CNO male-preferring units that switched sex-preference (Fig. 4h, blue; Extended Data Fig. 7q, s, VMH, red bar). Twenty percent of the female-preferring units after CNO derived from pre-CNO “co-active” (i.e., responsive to both sexes) units that lost male preference (Fig. 4h, yellow; Extended Data Fig. 7l–n), or from initially non-active units that gained female preference (20%) (Fig. 4h, grey; Extended Data Fig. 7g–i). Thus, the inversion of the male sex-tuning bias in VMHvl following BNSTpr silencing was due mostly to the conversion of initially male-preferring, or dual-responsive, units to female-preferring units (Fig. 4g).
In MPOA, following BNSTprEsr1 silencing a substantial proportion of initially male-preferring, co-active or non-active units converted to female-preferring units (Fig. 4o). However, this conversion was partially offset by the silencing of some initially female-preferring units (Fig. 4o, Extended Data Fig. 7c, right; f, k, n). Consequently, the overall proportion of female-preferring MPOAEsr1 units did not change greatly after CNO (Fig. 4j, k, p). In contrast to VMHvl, therefore, where BNSTprEsr1 silencing converted initially non-female-selective to female-selective units, in MPOA the slight increase in female-tuned units (Fig. 3n, p) was primarily due to a substitution of new female-tuned units for others that became inactive. There was no significant change in the percentage of tracked male- or female-tuned units in either MPOA or VMHvl, in animals injected with saline on two consecutive days (Extended Data Fig. 5p–s).
Control of hypothalamic representations of social behaviors by BNSTprEsr1 neurons
To investigate how silencing BNSTprEsr1 neurons affects hypothalamic activity during mounting and attack, we tracked single-unit responses in MPOAEsr1 or VMHvlEsr1 neurons before and after unilateral silencing of BNSTpr in freely behaving animals (Fig. 5a). Because BNSTpr→hypothalamic projections are primarily ipsilateral34, by performing silencing and imaging on one side of the brain while leaving the other unperturbed, this design allowed normal social behavior even in CNO, due to redundant contralateral circuits. Thus, any observed changes in neural activity on the silenced side cannot be due to a loss of social behavior, which requires bi-lateral BNSTprEsr1 silencing (Fig. 1b and Extended Data Fig. 1a).
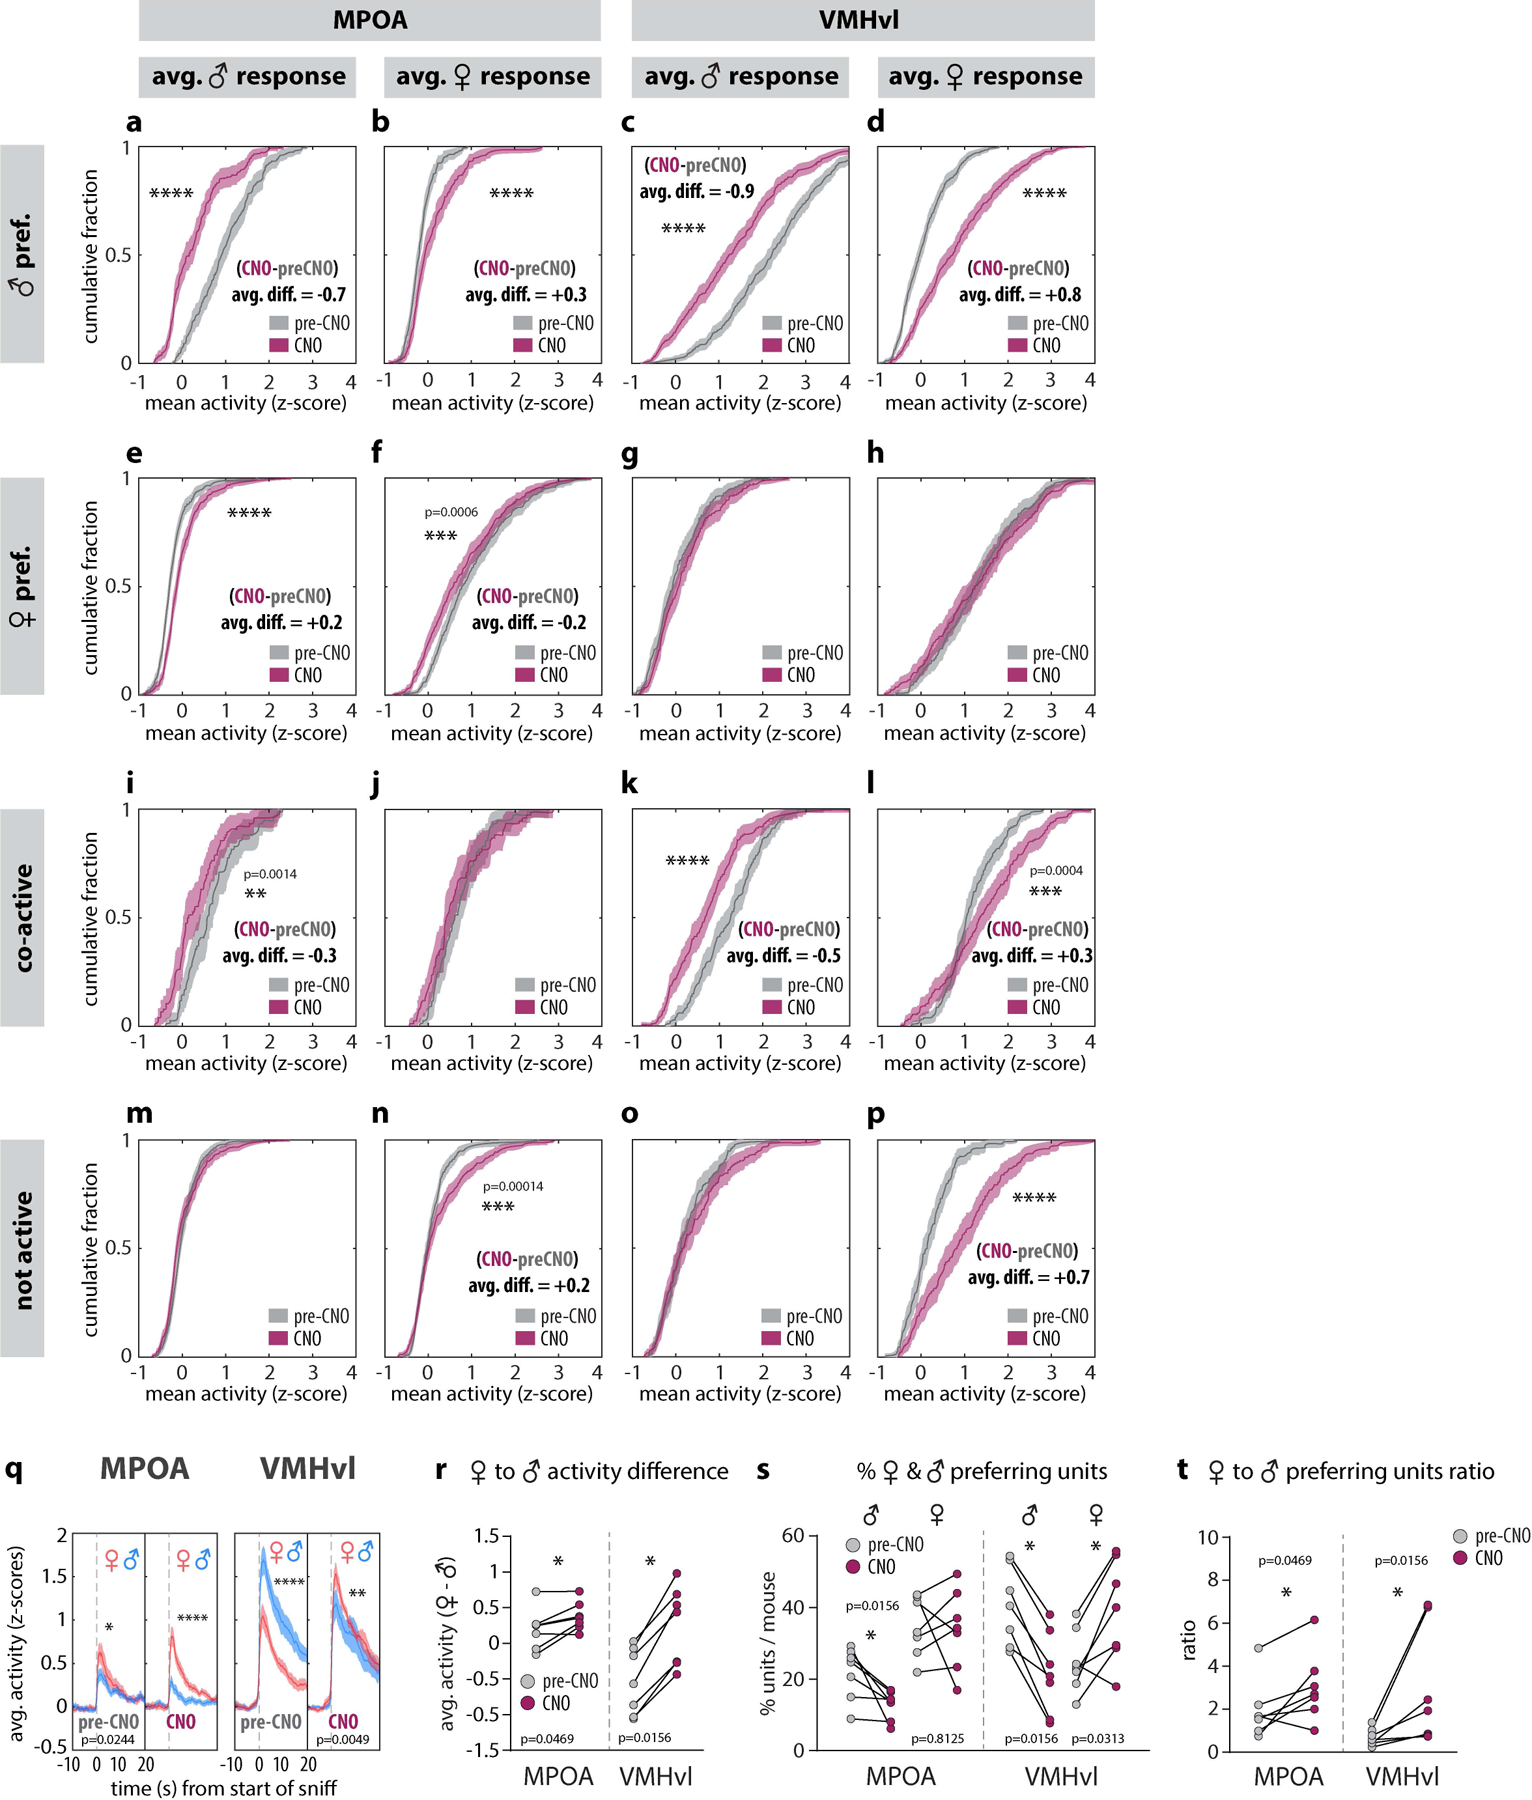
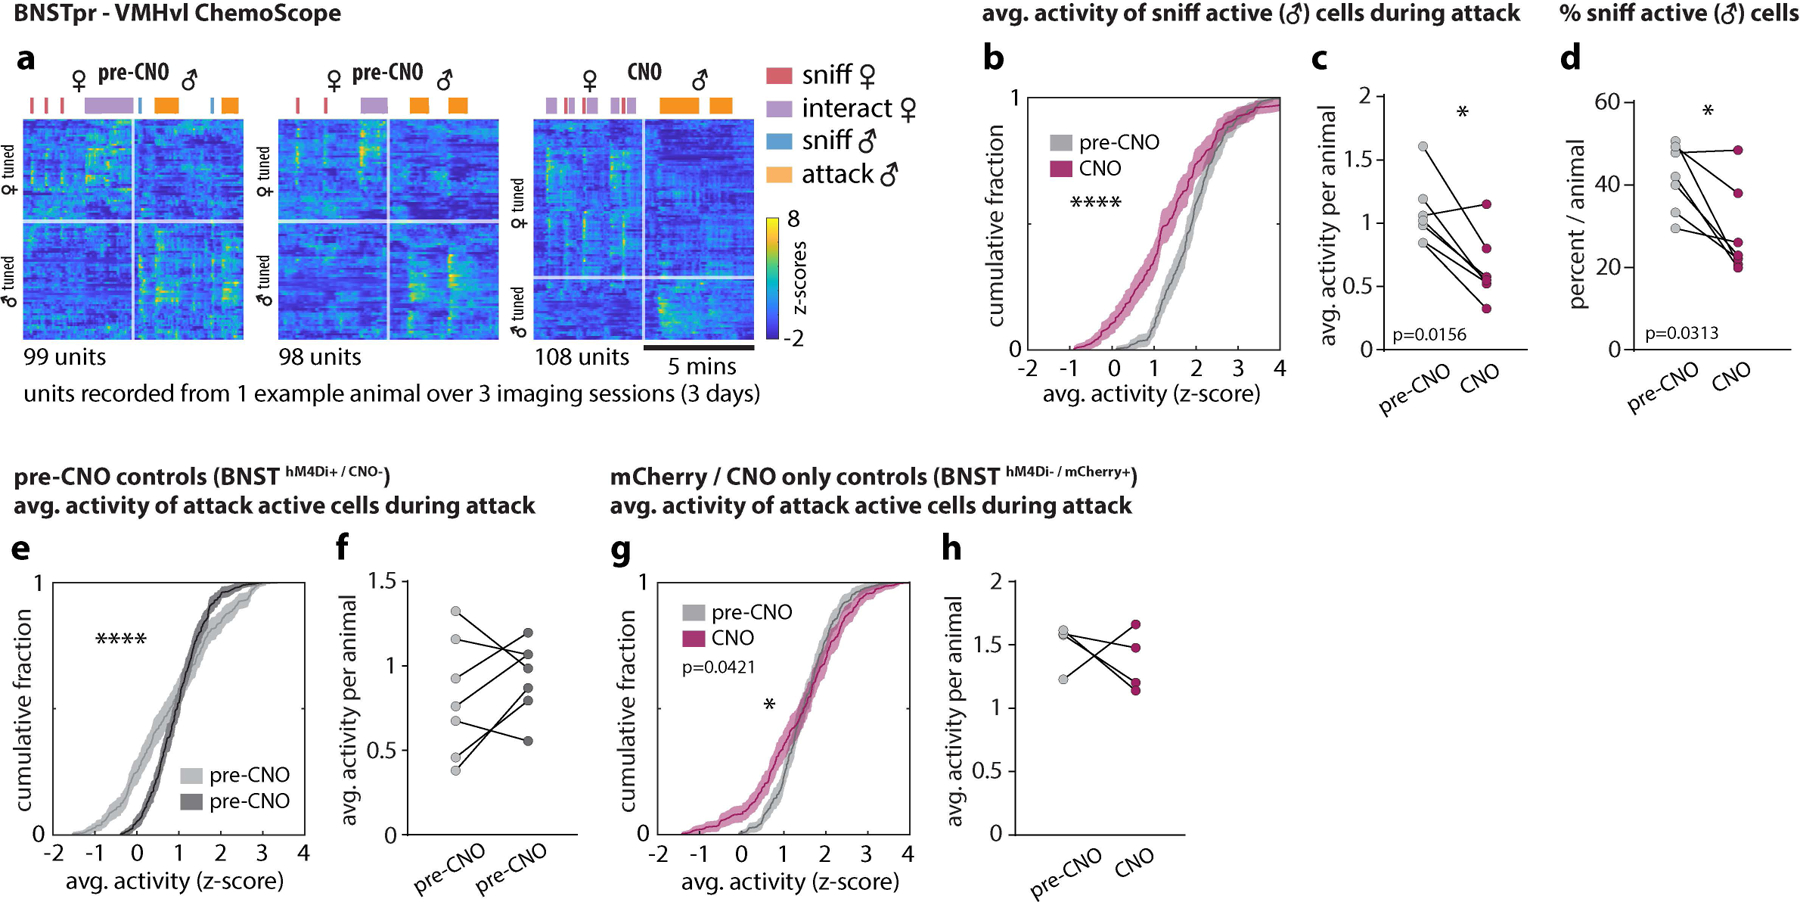
Figure 5: Differential effect of BNSTpr silencing on behavior representations in MPOA and VMHvl revealed by unilateral ChemoScope imaging.
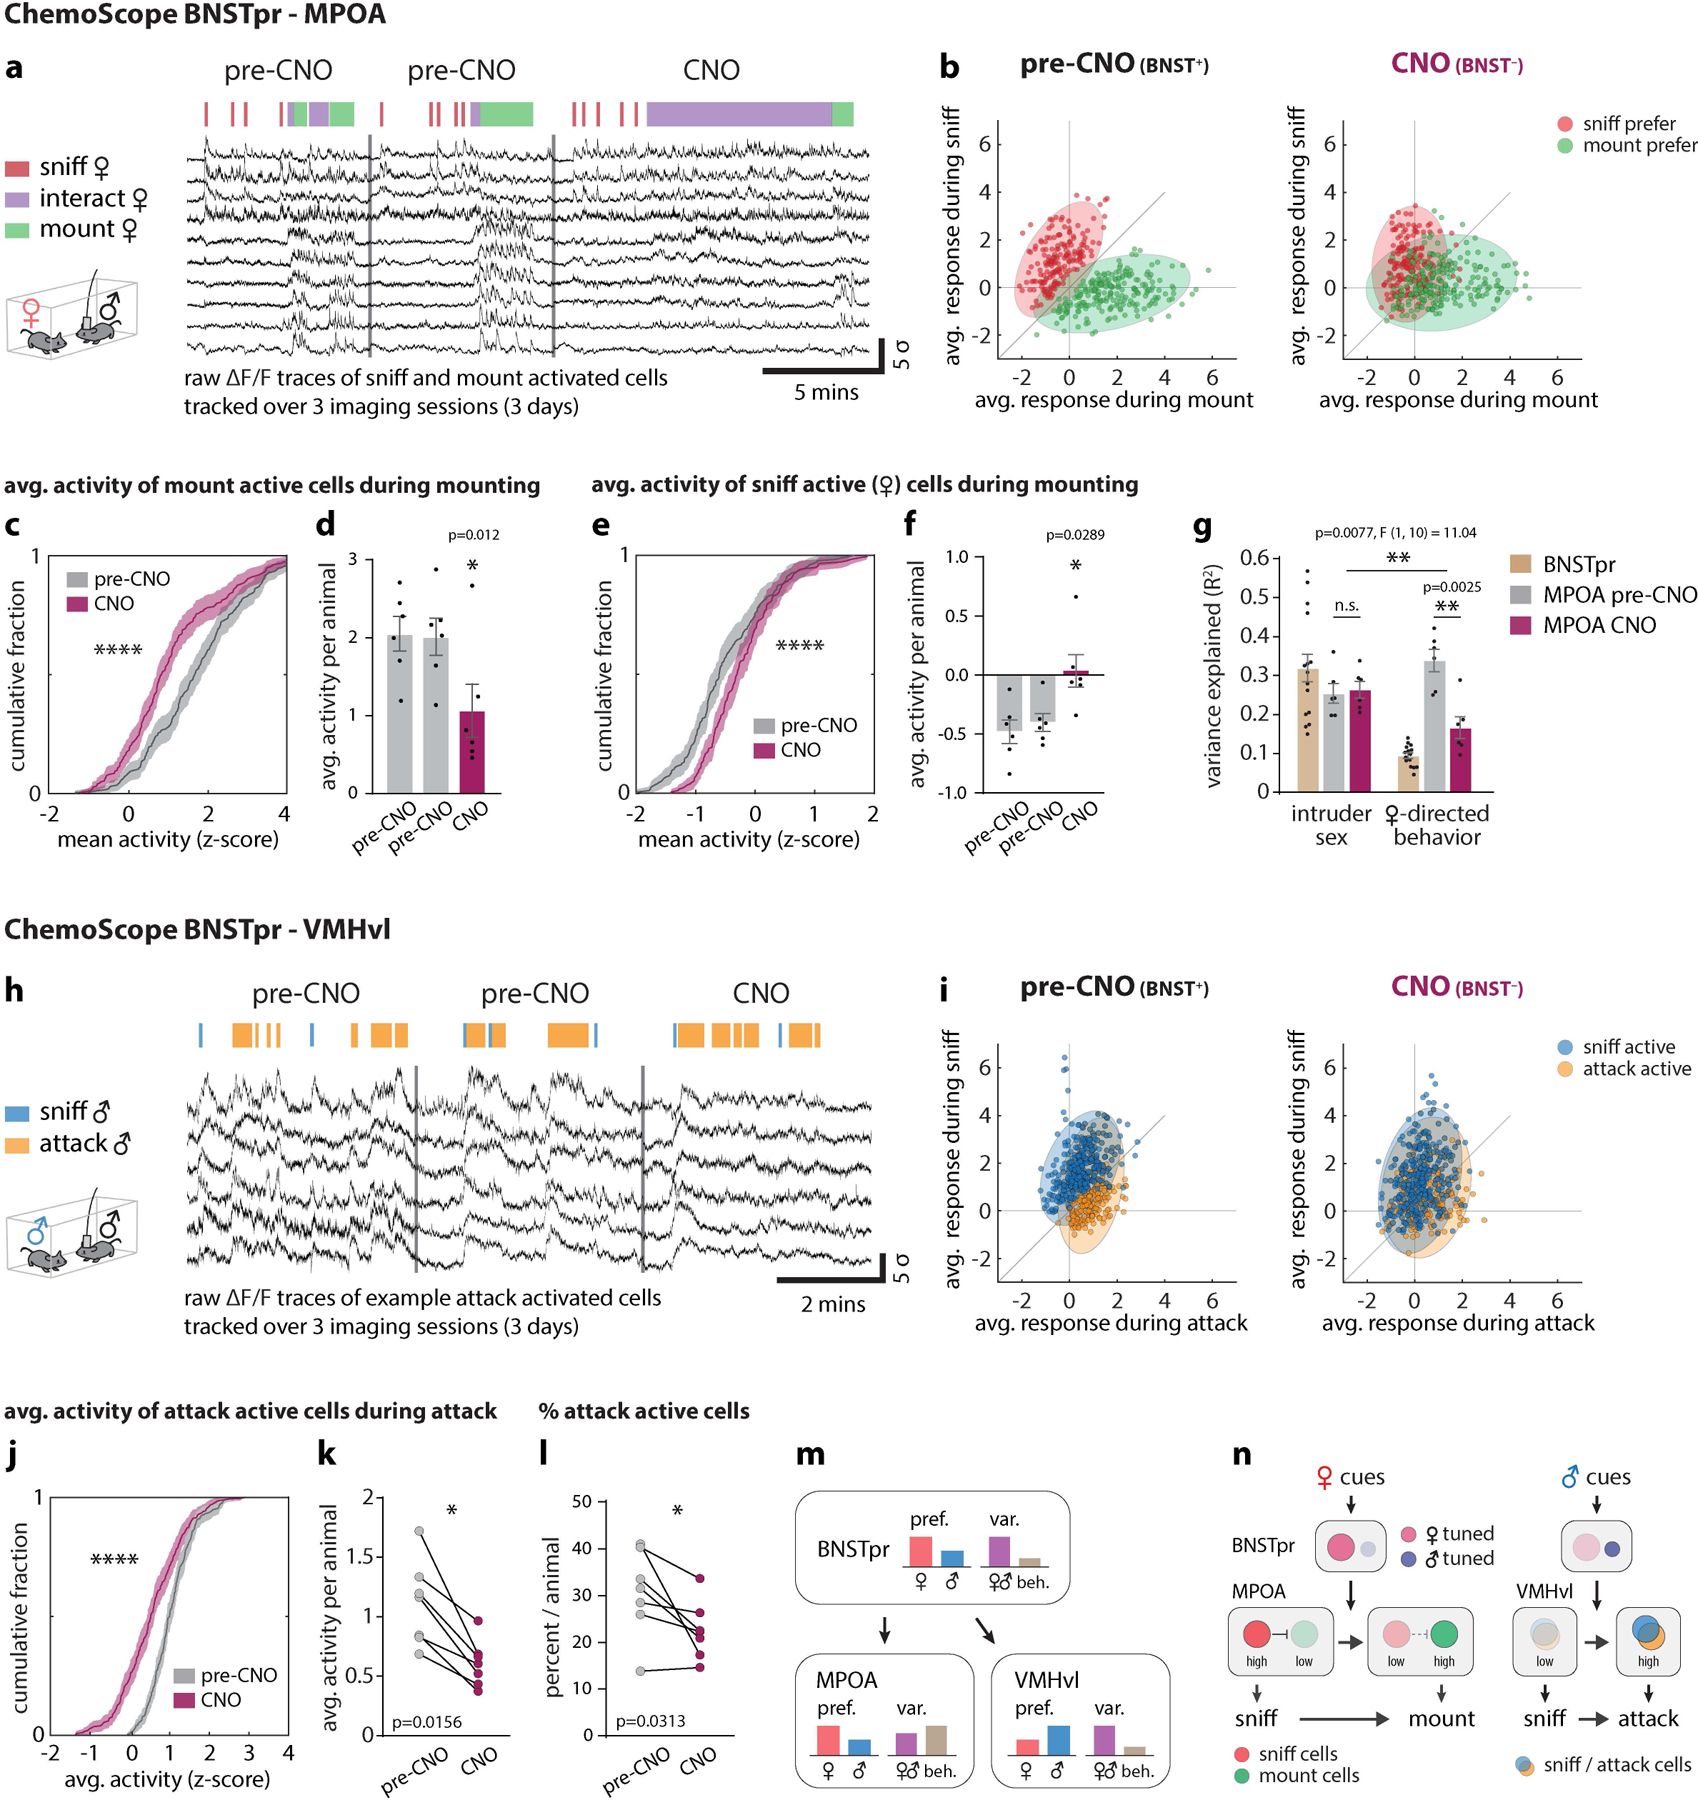
a, h, responses from example neurons tracked over 3 imaging sessions in MPOA (a) and VMHvl (h). b, i, Scatter plot of single-unit responses to sniff and mount females in MPOA (b), or to sniff and attack males in VMHvl (i). Each dot (b, i) represents a single neuron and the color of each dot indicates its tuning before CNO application. Distribution of sniff vs mount MPOA units (b) or sniff vs attack VMHvl units (i) before and after CNO are shown as colored ellipses. c-f Cumulative fractions (c, e) and bar graphs (d, f) of MPOA single-unit responses to initially (i.e., in saline-injected animals/pre-CNO) mount active (c) or sniff active (e) cells during mounting. g, Variance (R2) in population activity that can be explained by intruder sex or by female-directed consummatory behavior. j, k, Cumulative fractions (j) and scatter plots (k) of VMHvl single-unit responses to initially attack-active cells during attack. l, percent of attack-active cells per animal. m, Diagram summarizing observed transformations of sex and behavior representations from BNSTpr to MPOA and VMHvl. “pref.,” fraction of units that are either female (red bars)- or male (blue bars)-preferring neurons. “var expl.,” fraction of variance explained (R2) by intruder sex (purple bars) or consummatory behavior (light brown bars). n, Schematic illustrating the role of BNSTprEsr1 neurons in controlling the transition from sniffing to mounting or attack. Pale circles, low activity; saturated circles; high activity. Vertical arrows indicate net functional influences and requirements for BNSTpr activity. Horizontal arrows indicate time-dependent transitions. Statistics: two-sided Kolmogorov-Smirnov test (c, e, j), two-sided Wilcoxon signed-rank test (k, l), Friedman test with Dunn’s correction (d, f), two-way ANOVA with Bonferroni correction (g). ****p < 0.0001. Values are plotted as mean ± SEM. For ChemoScope BNSTpr – MPOA, n=6 mice (d, f, g); For ChemoScope BNSTpr – VMHvl, n=7 mice (k, l).
In MPOA, female-directed sniffing vs. mounting were represented by largely distinct groups of neurons (Fig. 5b, pre-CNO). CNO silencing of BNSTprEsr1 significantly decreased the activity of mount-selective cells, with a concomitant increase in sniff-active cells during mounting behavior (Fig. 5c–f). Thus, during BNSTprEsr1 silencing the cellular responses during female-directed sniffing vs. mounting became more similar than in controls (Fig. 5b, CNO). A corresponding decrease in the fraction of variance in neural activity explained by female-directed behaviors was observed as well (Fig. 5g).
In contrast to MPOA, in VMHvl male-directed sniffing and attack are represented by largely overlapping neuronal populations (Fig. 5h)9,19. Following BNSTprEsr1 silencing, both the average activity of those neurons normally active during attack behavior, as well as well as the percentage of attack-active neurons, were significantly reduced (Fig 5j–l). There was also a decrease in the number of male-selective VMHvlEsr1 neurons (Fig. 5i, CNO; see also Fig. 4b, c). Together these data show that in MPOA, unilateral BNSTprEsr1 silencing extended the activity of normally sniff-selective cells into the mounting phase, and decreased the activity of mount-selective cells during mounting. In VMHvl it reduced the activity of both mixed-selectivity and attack-selective cells during the attack, but not the sniff, phase. Thus, silencing of BNSTprEsr1 neurons in freely behaving males during social interactions caused distinct changes in neural representations of consummatory behavior in VMHvl and MPOA. However the average response to males and females in both nuclei remained unchanged (Fig. 3g ♀♂ Avg.).
Discussion
BNSTpr lies at the interface between the encoding of sex-specific olfactory cues in the medial amygdala and of motive drive states in the hypothalamus that control the consummatory phases of social behaviors. Previous studies suggested that it represents and is essential for the identification of conspecific sex via an intensity code16, with its requirement for consummatory behaviors presumably reflecting the former function. The data presented here suggest an alternative view.
First, while we confirm that BNSTpr neural activity contains a representation of conspecific sex identity, our cellular resolution calcium imaging reveals that female vs. male identity is not encoded by a higher vs. lower level of activity in this structure, respectively, as indicated by previous bulk calcium measurements16, but rather by a cell identity code: distinct subpopulations of BNSTprEsr1 neurons are tuned to males vs. females. Because the female-tuned neurons outnumber the male-tuned cells by ~2:1, a higher level of BNSTpr activity is observed in response to females than males when bulk calcium signals are measured by fiber photometry16. This ~2:1 female tuning bias is similar to that in MeApd6 and MPOA9, but is inverted in VMHvl19. Thus, at each node in the processing pathway from MeApd→BNSTpr→MPOA/VMHvl, intruder sex is represented as a cell identity code (Extended Data Fig. 3i).
Second, while BNSTprEsr1 neuronal activity represents intruder sex identity, this activity is not required to identify conspecific sex15. Although we confirmed that BNSTprEsr1 neuronal activity is required for males to show a preference for female cues16, we find surprisingly that it is not required for them to identify and distinguish females vs males: emission of USVs is only observed in response to female and not male cues, as in control males8,9. Consistent with this, intruder sex can be decoded equally well from MPOAEsr1 or VMHvlEsr1 neural activity in the presence or absence of BNSTprEsr1 activity. While the ability to identify and distinguish females vs. males is clearly a prerequisite for a male to display a preference for females, it does not follow that all deficits in female preference necessarily reflect deficient sex identification. Our results call into question the widespread use of male vs female preference assays as a surrogate measure of conspecific sex identification.
Interestingly, female-biased conspecific sex-tuned neural representations have been observed in the prefrontal cortex as well, where they play a role in sex preference behavior35. The causal relationship between conspecific sex tuning in cortical vs. subcortical regions remains to be determined. Our results also raise the question of whether the weak male-biased sex-tuning observed in MeApd6 in female mice extends to the structures we have investigated here. Previous bulk calcium imaging studies suggest that BNSTpr AB neurons do not encode intruder sex in females15, but single-cell analysis was not performed.
Third, while it may be intuitive to think that MeApd, BNSTpr and the hypothalamus each play distinct functional roles in the transformation of sex-specific social cues into behavior, such as social cue representation, sex identification and action selection, respectively, our data on the transformations in neural representations that occur as information flows through this circuit do not support such a strict hierarchical view. Instead, we find that the relative variance explained by intruder sex identity vs. behavior is different in each of these regions. In MPOA, the variance explained by behavior is higher than that in BNSTpr (and in MeApd) (Fig. 5g, m and Extended Data Fig. 3i), consistent with a gradual shift in the relative representations of sex identity vs. behavior from the amygdala to the hypothalamus. In contrast, the variance explained by intruder sex in VMHvl is higher than that in BNSTpr, largely because VMHvl has very few neurons tuned to specific phases of social behavior19. Rather, the main transformation that occurs from MeApd and BNSTpr to VMHvl is an inversion of the ratio of sex-tuned neurons, from female-dominant to male-dominant, respectively (Fig. 5m).
Surprisingly, when BNSTprEsr1 neurons were silenced chemogenetically, the male sex-tuning bias in VMHvl flipped to a female-tuning bias. Apparently, female tuning-dominant Esr1+ GABAergic neurons in BNSTpr are required to suppress female-specific tuning among VMHvlEsr1 glutamatergic neurons. Consistent with this, retrograde imaging indicated that female-biased tuning is present among BNSTprEsr1 neurons that project to VMHvl (as well as to MPOA; Extended Data Fig. 9). The mechanism whereby the female-biased sex representation in BNSTpr is transformed into a male-biased representation in VMHvl remains to be established, and may involve differential male- or female-biased inputs from other regions, such as the posterior amygdala36–38. In contrast, silencing BNSTpr did not significantly alter the female-dominant sex bias in MPOA (if anything it was slightly increased); rather it reduced the variance explained by behavior (Fig. 5g). Together, these data indicate a requirement for BNSTprEsr1 neuronal activity in shaping the representations of social behavior and conspecific sex in MPOA and VMHvl, respectively, albeit to different extents (Fig. 5m).
Finally, our results indicate that the inhibition of mounting and attack behavior that occurs upon BNSTprEsr1 silencing is not secondary to a deficiency in sex identification16. Rather, the failure to transition from appetitive to consummatory social behavior following silencing reflects changes in the pattern of sex- and behavior-specific tuning among VMHvlEsr1 and MPOAEsr1 neurons, with no loss of sex identity coding. In what follows we suggest plausible explanations for how these circuit-level “mutant phenotypes” may lead to the observed behavioral phenotypes. However, this causality is not directly demonstrated, and more complex explanations are certainly possible.
In MPOA, many Esr1+ neurons are tuned for specific behaviors, including sniffing or mounting (Fig. 5a and Extended Data Fig. 3i). Accordingly, as males transition from sniffing to mounting, sniff-selective neurons become less active while mount-selective neurons become more active. When BNSTprEsr1 neurons are silenced, this change in MPOA neural representations of social behavior is muted: sniff-selective neurons continue to be active (on the silenced side) as the animal transitions to mounting, while mount-selective neurons exhibit reduced activity (Fig. 5a–e). Since ~95% of BNSTpr neurons are GABAergic16,26,39,40, these observations suggest that in normal animals during sniffing, sniff-selective neurons (or another MPOA subpopulation) may inhibit mount-selective neurons. In order to transition to mounting, input from BNSTprEsr1 GABAergic neurons may be required to inhibit the sniff-selective population, thereby dis-inhibiting the mount-selective cells (Fig. 5n). In the absence of BNSTprEsr1 activity, mount-selective cells remain inhibited and so this transition is blocked; instead, the male continues to sniff the female (Extended Data Fig. 1b, lower).
In VMHvl, sniff- and attack-active cells are largely overlapping (Fig. 5i) but are sex-specific9,19, with male-tuned neurons outnumbering female-tuned cells by ~2:1. During attack, primarily male-tuned neurons are active9,19. Optogenetic experiments9,11,13 and computational modeling41 suggest that the activity of VMHvlEsr1 neurons must reach a certain threshold in order for males to transition from sniff to attack. In the absence of BNSTprEsr1 activity female-tuned neurons become dominant in VMHvl, so the number and activity of male-selective neurons are reduced (Fig. 4c, Extended Data Fig. 8a). This reduction may prevent activity in the male-tuned population from reaching the threshold necessary to transition to attack (Fig. 5j–l, n), although increased inhibition from neighboring GABAergic neurons may contribute as well. Together these data suggest that activity in BNSTprEsr1 neurons controls sex- and behavior-tuning in MPOA and VMHvl in a manner essential for the transition from sniffing to mounting or attack, respectively.
Functional perturbations and observational studies often yield different views of brain function42. Our results demonstrate how calcium imaging can be combined with manipulations of neural activity in freely moving animals to identify and link circuit-level to behavioral phenotypes. This combined approach allows an integration of observational and perturbational data to reveal both the transformations in neural representations that occur as information flows through a circuit, and the potential function of such transformations in the control of behavior. Future studies should reveal the detailed cellular and synaptic mechanisms that underlie these important transformations.
METHODS
Mice
All experimental procedures involving the use of live mice or their tissues were carried out in accordance with NIH guidelines and approved by the Institute Animal Care and Use Committee (IACUC) and the Institute Biosafety Committee (IBC) at the California Institute of Technology (Caltech). All C57BL/6N mice used in this study, including wild-type and transgenic mice, were bred at Caltech. BALB/c male and female mice were used as intruder mice and bred at Caltech or purchased from Charles River Laboratories (CRL). Experimental mice were used at the age of 2–3 months. Intruder mice were used at the age of 2–6 months and were maintained with three to five cage mates to reduce their aggression. Esr1Cre/+ knock-in mice (Jackson Laboratory stock no. 017911) were backcrossed into the C57BL/6N background (>N10) and bred at Caltech. Heterozygous Esr1Cre/+, or double heterozygous AromataseCre/+ (ref. 17); Ai148/+43 mice were used for cell-specific targeting experiments and were genotyped by PCR analysis using genomic DNA from tail or ear tissue. All mice were housed in ventilated micro-isolator cages in a temperature-controlled environment (median temperature 23 °C, humidity 60%), under a reversed 11-h dark–13-h light cycle, with ad libitum access to food and water. Mouse cages were changed weekly.
Virus
The following AAVs along with the supplier, injection titres in viral genome copies/ml (vg/ml) and injection volumes in nanoliters (nl) were used in this study.
AAV1-hSyn1-SIO-stGtACR2-FusionRed (Addgene 105677, ~2 × 10¹² vg/ml, 200nl), AAV5-hSyn-DIO-hM4D(Gi)-mCherry (Addgene 44362, ~2 × 10¹² vg/ml, 200nl per injection), AAV5-Ef1a-DIO-eNpHR3.0-eYFP (Halo-eYFP, E.D. Fig. 2) (Addgene 26966, ~4 × 10¹² vg/ml, 200nl per injection), AAV1-syn-FLEX-jGCaMP7f-WPRE (Addgene 104492, ~2 × 10¹² vg/ml, 200nl per injection), AAVdj-syn-FLEX-FlpO (Janelia Vector Core, ~1 × 10¹³ vg/ml, 200nl per injection), AAVretro-syn-fDIO-jGCaMP7f (Janelia Vector Core, ~2 × 10¹² vg/ml, 200nl per injection), AAVretro-CBH-DIO-nls-mScarlet (Janelia Vector Core, ~1 × 10¹³ vg/ml, 200nl per injection), AAVretro-CBH-DIO-nls-mNeonGreen (Janelia Vector Core, ~1 × 10¹³ vg/ml, 200nl per injection).
Stereotaxic Coordinates for virus injection and GRIN lens implantation
Stereotaxic injection coordinates were based on the Paxinos and Franklin atlas44.
Virus injection: BNSTpr, AP: −0.15, ML: ± 0.65, DV: −3.75, VMHvl, AP: −1.5, ML: ± 0.75, DV: −5.75, MPOA, AP: 1.0, ML: ± 0.3, DV: −4.75, MeApd, AP: −1.65, ML: ± 2.1, DV: −4.9).
Gradient Refractive Index (GRIN) lens implantation:
BNSTpr: AP: −0.1, ML: −0.7, DV: −4.5 (⌀0.85 × 7mm GRIN lens with prism, Extended Data Fig. 3).
BNSTpr: AP: −0.2, ML: −0.7, DV: −3.65 (⌀0.6 × 7.3mm GRIN lens).
MeApd: AP: −1.65, ML: −2.0, DV: −4.75(⌀0.6 × 7.3mm GRIN lens).
VMHvl: AP: −1.6, ML: −0.75, DV: −5.6 (⌀0.6 × 7.3mm GRIN lens).
MPOA: AP: +1.0, ML: −1.0, DV: −5.0 (⌀0.6 × 7.3mm GRIN lens). Implanted at a 10° tilt in AP axis and a 5° tilt in ML axis to avoid damaging BNSTpr and its projections to MPOA (Extended Data Fig. 5a–j).
Surgeries
Surgeries were performed on socially and sexually experienced adult male Esr1Cre/+ mice, aged 2–3 months. Virus injection and implantation were performed as described previously9,19. Briefly, animals were anaesthetized with isoflurane (5% for induction and 1.5% for maintenance) and placed on a stereotaxic frame (David Kopf Instruments). Virus was injected into the target area using a pulled glass capillary (World Precision Instruments) and a pressure injector (Micro4 controller, World Precision Instruments), at a flow rate of 50 nl/minute. The glass capillary was left in place for 5 minutes following injections before withdrawing. For microendoscope experiments, virus injection and lens implantation were performed two weeks apart. Lenses were slowly lowered into the brain and fixed to the skull with dental cement (Metabond, Parkell). 2 weeks after lens implantation, mice were head-fixed on a running wheel and a miniaturized microendoscope (nVista, Inscopix) was lowered over the implanted lens until GCaMP-expressing fluorescent neurons were in focus. Once GCaMP-expressing neurons were detected, a permanent baseplate was attached to the skull with dental cement. Mice were habituated with weight-matched dummy microendoscopes (Inscopix) for at least 1 week before behavior testing.
Housing conditions for social and sexual experience
All male C57BL/6N mice used in this study were socially and sexually experienced. Mice aged 8–12 weeks were initially co-housed with a female BALB/c for 1 week and were screened for sex-appropriate social behaviors. Mice that show both mounting toward females and attack toward males during a 30-minute resident intruder assay were selected for surgery and subsequent behavior experiments. From this point forward, these male mice were always cohoused with non-pregnant female BALB/c mice.
Chemogenetic inhibition
Behavioral tests were performed on two consecutive days. The number of mice receiving saline or Clozapine-N-oxide (CNO) (Enzo Life Sciences) was counterbalanced across the two days. CNO was dissolved in saline. CNO (7.5mg/kg) or saline (control) was intraperitoneally injected 60 minutes prior to behavioral tests.
Optogenetic inhibition
Animals were connected to a 470nm or a 590nm laser (Changchun New Industries Optoelectronics Tech Co., Ltd.) via optical patch cords (⌀200 μm, N.A., 0.22, Doric lenses and Thorlabs) and a rotary joint (Doric lenses). The experimenter monitored mouse behavior via a computer monitor in a room adjacent to the behavioral arena. Laser was triggered manually when animals were engaged in the behaviors of interest. Sham stimulation (laser OFF) was interleaved with the light stimulation (laser ON) as an internal control. For optogenetic inhibition of BNSTpr using gtACR2, 10 seconds of 470nm continuous photo stimulation at 1mW/mm2 at the tissue level was used during social interactions. 10 minutes of 470nm continuous photo stimulation at 1mW/mm2 at the tissue level was used for urine preference and “pencil-cup” (meshed barrier) tests. For optogenetic inhibition of BNSTpr – MPOA and BNSTpr – VMHvl terminals using Halorhodopsin, 5 seconds of 590nm continuous photo stimulation at 3mW/mm2 at the tissue level was used.
Behavior annotations
Behavior videos were manually annotated using a custom MATLAB-based behavior annotation interface11,45. A “baseline” period of 5 minutes where the animal was alone in his home cage was recorded at the start of every recording session. A total of 7 behaviors during the resident intruder assays were annotated: sniff (face, body, genital-directed sniffing) toward male or female intruders, attack, mount, intromission, “interact” (periods where the animals were close to each other but sniff, attack, mount/intromission were absent) with male or female intruders. For “dangled” presentations of male or female intruders, the dangled bout starts at the onset of nostril/whiskers movement when the ano-genital region of the dangled intruder is held next to the resident.
Microendoscopic imaging
On the day of imaging, mice were habituated for at least 10 minutes after installation of the miniscope in their home cage prior to the start of the behavior tests. Imaging data was acquired at 30 Hz with 2x spatial down-sampling, LED power (0.1–0.5) and gain (1x-7x) were adjusted depending on the brightness of GCaMP expression determined by the image histogram as per the user manual. A TTL pulse from the Sync port of the data acquisition box (DAQ, Inscopix) was used to synchronously trigger StreamPix7 (Norpix) for video recording. Imaging sessions typically lasted 1 hour (20–25 minutes of interactions per sex.)
ChemoScope imaging
To minimize population activity changes associated with stress from i.p. injections, social experience or fatigue from resident intruder assays in saline or CNO trials, a series of habituation imaging sessions were performed every 2–3 days (3–4 sessions total) prior to the saline vs CNO trials used for analysis (Extended Data Fig. 5p–s). Mice were injected with 100μl of saline (or 100μl of 7.5mg/kg CNO for CNO trials) and returned to their home cage for 60 minutes prior to imaging.
Microendoscopic data extraction
Preprocessing
Miniscope data were acquired using the Inscopix Data Acquisition Software as 2x down-sampled .isxd files. Preprocessing and motion correction was performed using the Inscopix Data Processing Software. Briefly, raw imaging data was cropped, 2x down-sampled, median filtered and motion corrected. A spatial band-pass filter was then applied to remove out of focus background. The filtered imaging data was temporal down-sampled to 10Hz and exported as a .tiff image stack.
Calcium data extraction
After preprocessing, calcium traces were extracted and deconvolved using the CNMF-E large data pipeline32 with the following parameters: patch_dims = [42, 42], gSig = 3, gSiz = 13, ring_radius = 19, min_corr = 0.8, min_pnr = 8, deconvolution: foopsi with the ar1 model46. The spatial and temporal components of every extracted unit were carefully inspected manually (SNR, PNR, size, motion artifacts, decay kinetics, etc.) and outliers (obvious deviations from the normal distribution) were discarded. The extracted traces were then Z-scored prior to analysis.
Choice probability
Choice probability (CP) is a metric that estimates how well either of two different behaviors can be predicted/distinguished, based on the activity of any given neuron during these two behaviors47. CP of single neurons were computed using previously described methods9,19. To compute the CP of a single neuron for any behavior pair, 1-second binned neuronal responses occurring during each of the two behaviors were used to generate a “receiver operating characteristic” (ROC) curve. CP is defined as the area under the curve (AUC) bounded between 0 to 1. A CP of 0.5 indicates the activity of the neuron cannot distinguish between the two alternative behaviors. We defined a neuron as being capable of distinguishing between two behaviors (e.g. interacting with male vs. female) if the CP of that neuron was > 0.65 or < 0.35, and was > 2σ or < −2σ of the CP computed using shuffled data (repeated 100 times). For instance, if the CP of a particular neuron for females was 0.8, and the shuffled CP was 0.5±0.1 (SD), that neuron would be considered as “female-preferring”. If another neuron had a CP of 0.1 and a shuffled CP of 0.5±0.15 (SD), that neuron would be considered as a “male-preferring” neuron.
Decoding intruder sex
We constructed “frame-wise” (using 1-second binned behavior and calcium activity “frames”, Fig. 3l) or “time-evolving” (as a function of time at 10Hz, Fig. 2i and Fig. 3m) linear SVM decoders (as described previously9) to distinguish intruder sex using 50 randomly selected neurons from each animal in BNST (n=15 animals), VMHvl (n=7) and MPOA (n=7). Accuracy was evaluated using a stratified 5-fold cross-validator. Decoding was repeated 100 times and the decoder performance was reported as the mean accuracy per imaged animal. For significance testing, the mean accuracy of the decoder trained on shuffled data (repeated 500 times per imaged animal) was computed to compare against the decoder accuracy trained on actual data.
Determining explained variance in BNSTpr population activity
We calculated the variance of the population activity explained by intruder sex and behaviors (Fig. 2o) using linear regression as described previously9. To evaluate the encoding of intruder sex and behaviors by BNSTprEsr1 neurons, we regressed the activity of single neurons against the sex of the intruder (a pair of binary vectors) and against 7 annotated behaviors (7 binary vectors). The fraction of variance explained is calculated as the ratio of the cross-validated R2 (coefficient of determination) of the fit against the sex of the intruder and the cross-validated R2 of the fit against 7 different behaviors. To determine the fraction of variance explained by behaviors, we regressed the residual activity (from the fit against intruder sex) against male- or female- directed behaviors and reported the fraction of the residual variance explained, as cross-validated R2 of the fit.
Pearson’s correlation
Pearson’s correlation (Fig. 3j) was reported as the mean pair-wise Pearson’s correlation coefficient per imaged animal computed by using the average population responses (all trials during 1 recording session) to dangled male intruders and the 1-second binned population responses to dangled male intruders (same-sex) or dangled female intruders (opposite-sex).
Mahalanobis distance ratio
Mahalanobis distance ratio (Fig. 3k) was expressed as the ratio between the Mahalanobis distance (described previously19) of the population vector responding to dangled female intruders (opposite sex) and the Mahalanobis distance of the population vector responding to dangled male intruders (same sex).
Supervised UMAP embedding of single-unit responses to male and female stimuli
The first 50 PCs of 1-second-binned single-unit responses to male and female stimuli from MPOA and VMHvl along with categorical labels indicating the origin of each unit (MPOA pre-CNO, MPOA CNO, VMHvl pre-CNO, VMHvl CNO) were used to initialize the embedding (Fig. 3q). The Python implementation of UMAP48 (umap-learn) were used along with the following parameters: n_neighbors = 15, min_dist = 0.4, metric = euclidean.
Statistical analysis
Data were processed and analyzed using Python, MATLAB, and GraphPad (GraphPad PRISM 9). All data were analyzed using two-tailed non-parametric tests except urine preference and pencil-cup (meshed barrier) tests (Extended Data Fig. 1r, w), and the fraction of variance explained by intruder sex or female-directed behavior (Fig. 5g) where two-way ANOVA with Bonferroni correction was used. Wilcoxon signed-rank test (paired, non-parametric Mann-Whitney U test) was used for binary paired samples. Friedman test with Dunn’s correction was used for non-binary paired samples (Fig. 5d, f). Kolmogorov-Smirnov test was used for non-paired samples. Not significant (N.S.), P > 0.05; *P < 0.05; **P < 0.01; ***P < 0.001; ****P < 0.0001.
Code availability
The custom MATLAB and Python codes used to analyze the data in this study are available upon request.
Extended Data
Extended Data Figure 1: Chemogenetic and optogenetic silencing of BNSTprEsr1 neurons disrupts aggression and mating.
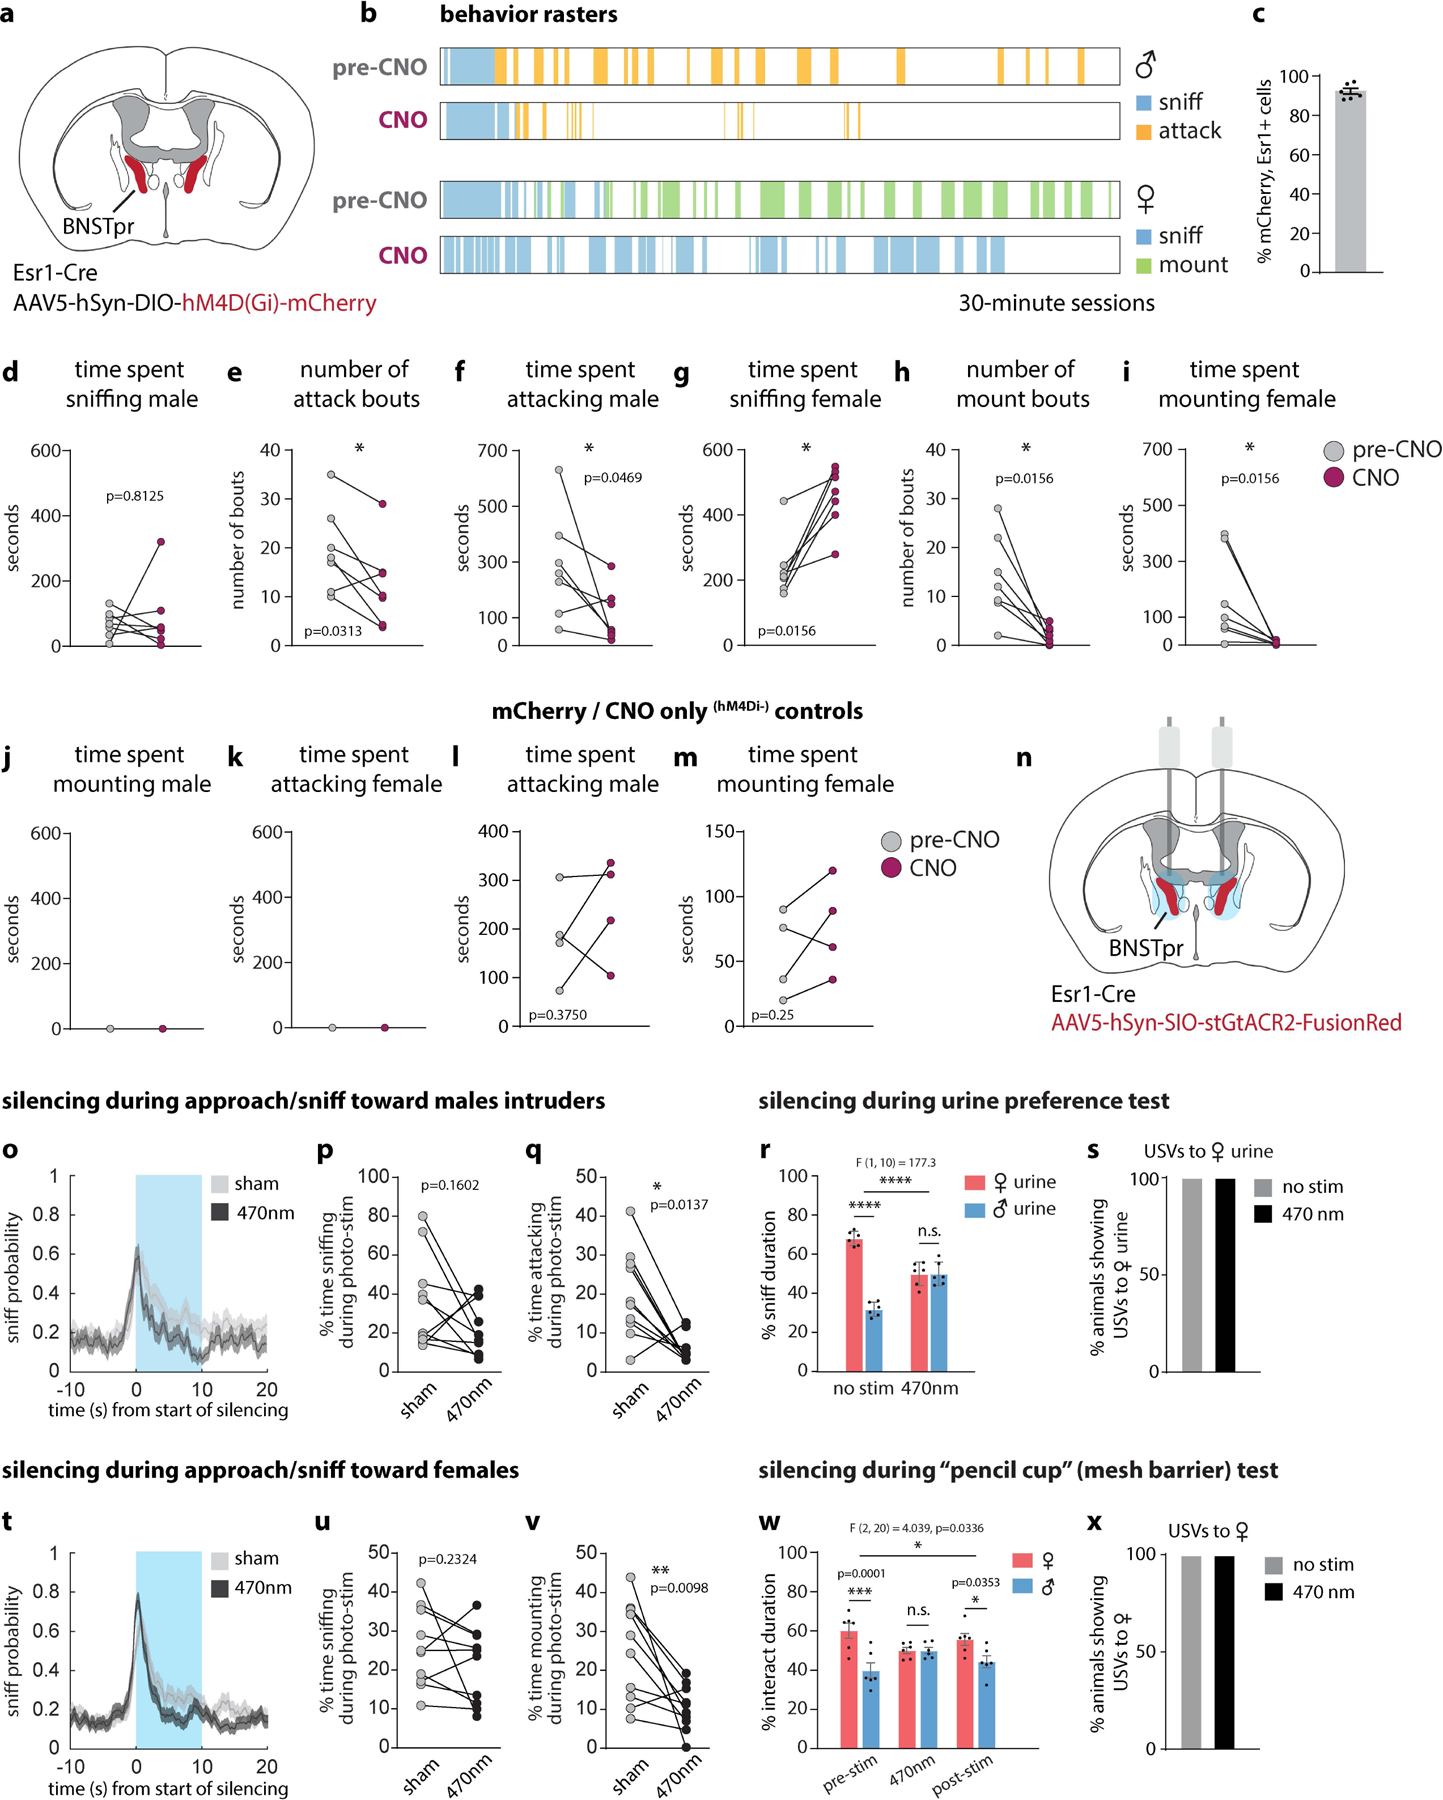
a, Illustration of hM4d (Gi)-mediated silencing in bilateral BNSTprEsr1 neurons. b, Example behavior raster plot from 1 animal across 4 recording sessions. c, Percent of BNSTprEsr1 neurons that express mCherry. Values are plotted as mean ± SEM, n=6 mice. d-m, Measurements performed before (pre-CNO: saline injection, gray points) vs. after (CNO injection, maroon points) chemogenetic silencing of BNSTpr, of time spent sniffing male intruders (d), number of attack bouts toward male intruders (e), time spent attacking male intruders (f), time spent sniffing female intruders (g), number of mount bouts toward female intruders (h), time spent mounting female intruders (i), time spent mounting male intruders (j), time spent attacking female (k), and time spent attacking male (l), time spent mounting female (m) in mCherry/CNO only controls (l, m) per 30-minute session. 100μl containing either saline (pre-CNO) or 7.5mg/kg CNO was given i.p. 60 minutes prior to start of behavior tests. n, Illustration of bilateral optogenetic silencing in BNSTpr. o, t, Mean probability of sniff behavior occurring relative to onset of optogenetic silencing. p, u, Duration of sniffing toward male (p) or female (u) intruders. q, v, Duration of attack (q) toward male intruders or mount (v) toward female intruders as a percentage of the duration of optogenetic silencing. “Sham” controls were the same animals during a 10s “sham stimulation,” i.e., without light. r, w, Percent of time spent interacting with male or female urine (r), or male or female conspecifics separated by a meshed barrier (w) before and during (r) or before, during and after (w) optogenetic silencing of BNSTpr. Optogenetic silencing conditions: 470nm @ ~1 mW/mm2 for 10 seconds (o, p, q, t, u, v). 470nm @ ~1 mW/mm2 for 10 minutes (r, s, w, x) Statistics: For Chemogenetic inhibition, two-sided Wilcoxon signed-rank test (d-m). Values are plotted as total time or total bouts per 30-minute session per animal. n = 7 mice (d-k), n=4 mice (l, m). For Optogenetic inhibition during interactions with male or female conspecifics (o, p, q, t, u, v), two-sided Kolmogorov-Smirnov test (o, t), two-sided Wilcoxon signed-rank test (p, q, u, v). Male-male trials (o, p, q), n=131 stim and 125 sham trials pooled from 10 mice. Male-female trials mice (t, u, v), n=181 stim and 170 sham trials pooled from 10 mice. For Optogenetic inhibition during urine preference (r) and “pencil cup” (mesh barrier) (w) tests, two-way ANOVA with Bonferroni correction, n=6 mice. Values are plotted as mean ± SEM. ****p < 0.0001; ***p < 0.001; **p < 0.01; *p < 0.05. The mouse brain in this figure (a, n) has been reproduced with permission from “The mouse brain in stereotaxic coordinate”, Paxinos G. and Watson C., copyright Elsevier Academic Press 2001.
Extended Data Figure 2: Optogenetic silencing of BNSTprEsr1 terminals in MPOA or VMHvl during male-male/ male-female interactions.
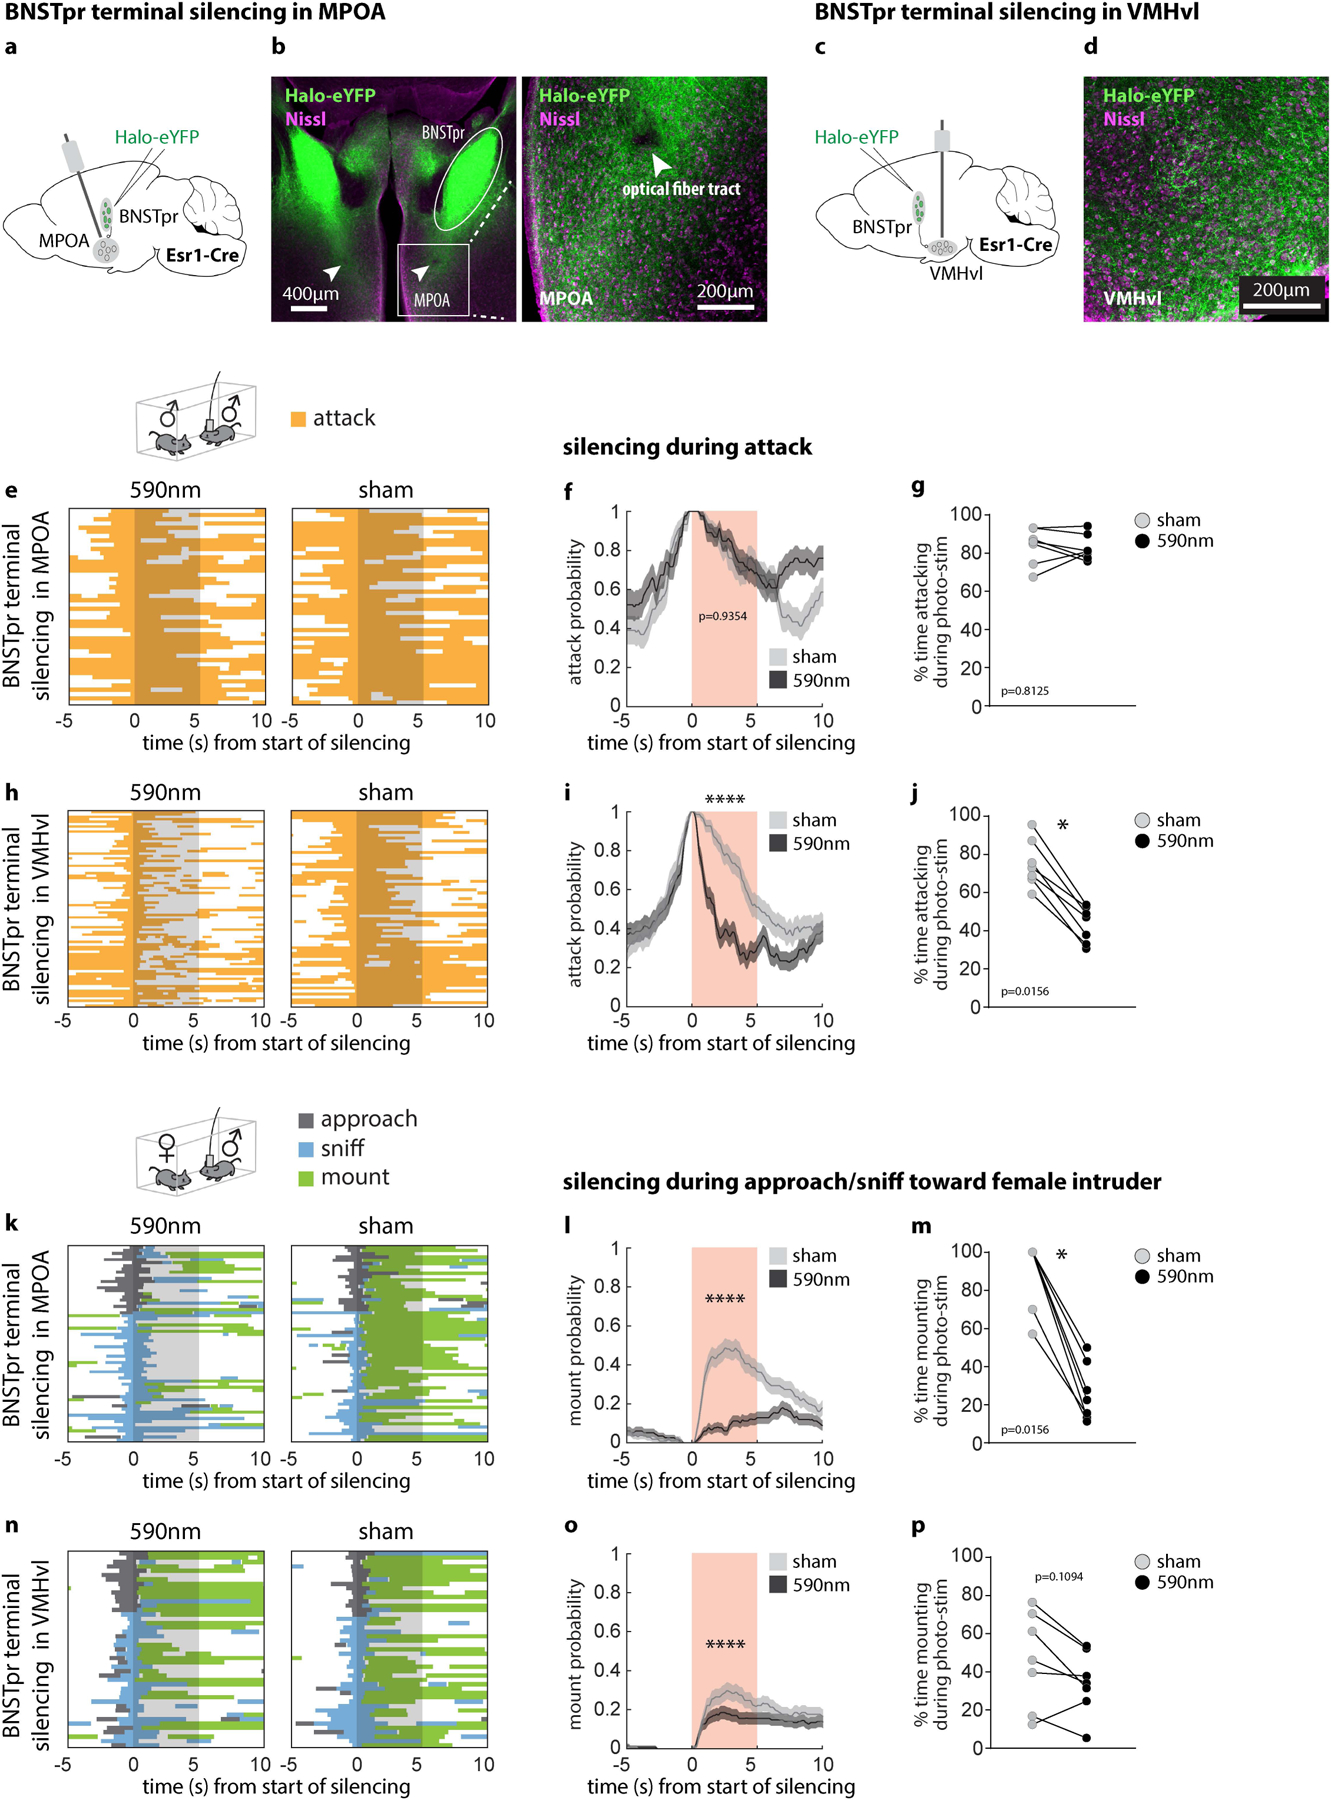
a, c, Diagram illustrating BNST terminal silencing in MPOA (a) or VMHvl (c). b, d, Representative images showing Halo-EYFP cell body expression in BNSTpr and axonal expression in MPOA (b) and VMHvl (d). Similar expression patterns were observed in all 14 animals tested (b, d). e, h, k, n, Raster plots showing distribution of social behaviors relative to optogenetic silencing of BNSTpr terminal in MPOA (e, k) or VMHvl (h, n). f, i, l, o, Average probability of behavior occurring relative to onset of optogenetic silencing. g, j, m, p, Duration of attack (g, j) or mount (m, p) as a percentage of the 5-second optogenetic silencing. Statistics: two-sided Kolmogorov-Smirnov test (f, i, l, o), values are plotted as mean ± SEM. Two-sided Wilcoxon signed-rank test (g, j, m, p). ****p < 0.0001; ***p < 0.001; **p < 0.01; *p < 0.05. n=7 mice for each silenced region. The mouse brain in this figure (a, c) has been reproduced with permission from “The mouse brain in stereotaxic coordinate”, Paxinos G. and Watson C., copyright Elsevier Academic Press 2001.
Extended Data Figure 3: Performance of 0.85 mm Ø prism coupled GRIN lens compared to 0.6 mm Ø GRIN lens for imaging BNSTpr.
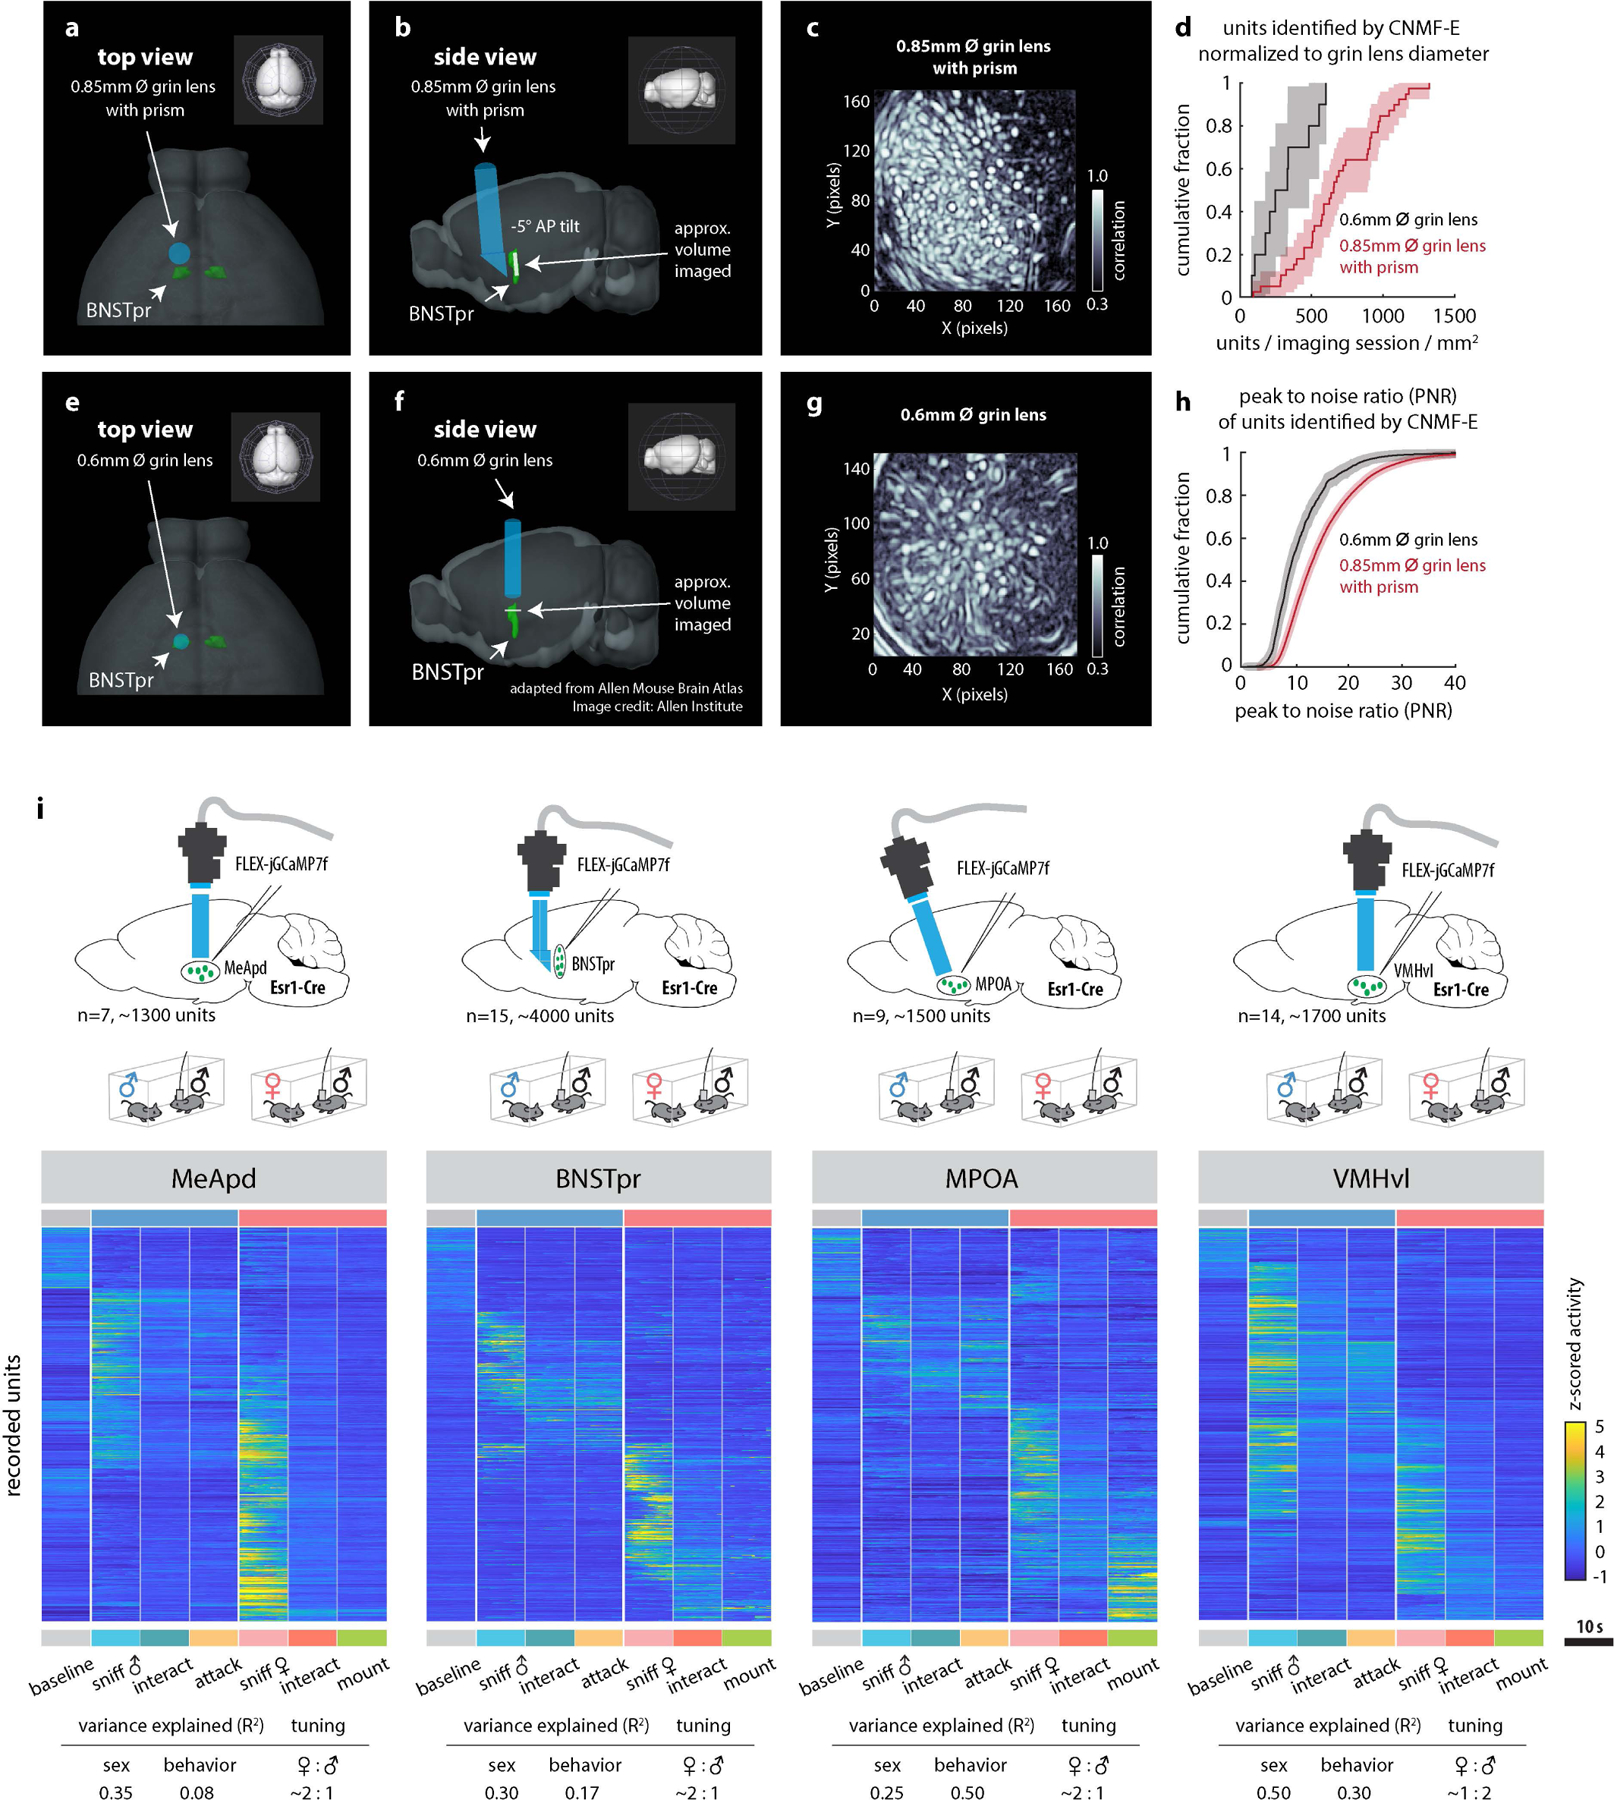
a, b, d, e, Illustrations showing GRIN lens placement in BNSTpr from top (a, d) and side (b, e) views. a-c, Illustrations or data from animals implanted with prism lenses. d-f, Data from animals implanted with conventional cylindrical GRIN lenses. c, f, Mean pixel correlation during 1 example imaging session. g, Cumulative fraction of number of units captured per imaging session normalized to the diameter of the GRIN lens. h, Cumulative fraction of the peak to noise ratio (PNR) of all units imaged using either a 0.6mm grin lens or a 0.85mm prism-coupled grin lens. i, Raster plots of MeApd, BNSTpr, MPOA and VMHvl Esr1+ neuronal activity during male-male or male-female unrestrained social interactions. For comparative purposes, all frames containing each behavior scored (indicated below plot) during a 30 minute social interaction were concatenated and binned into 10s intervals; Averaged z-scored responses of each unit across all bins are shown.
Tables below show the average variance (R2) in population activity that can be explained by intruder sex or by male and female-directed consummatory behavior and the ratio of female-preferring to male-preferring neurons in each imaged region. The mouse brain in this figure (i) has been reproduced with permission from “The mouse brain in stereotaxic coordinate”, Paxinos G. and Watson C., copyright Elsevier Academic Press 2001.
Extended Data Figure 4: Miniscope imaging analysis of BNSTpr neurons.
a, Example raster plot of population responses to 5 repeated presentations of dangled male, female or toy intruders from a cohort of 9 individual animals (cohort 1, n = 6, cohort 2, n = 9). b, continuously recorded raw ΔF/F traces of 20 example neurons from 1 recording session. c, Average z-scored responses of BNSTpr neurons per animal (n=15 mice) during 8 annotated behaviors/conditions. d, Percent of units per animal (n=15 mice) whose average response is >2σ baseline measured prior to intruder introduction. e, Histograms of male- / female-preferring units determined by choice probability from single-unit responses to dangled intruders. f, Venn diagram of units that are male- or female- sniff preferring (top), or attack- or mount- preferring (bottom) (determined by choice probability) during free interactions with, or sniffing of dangled, male or female intruders. g-l, Comparison of BNSTprEsr1 (g, h, i) and BNSTprAB (j, k, l) population responses to dangled presentation of male or female intruders. g, j, Illustration of BNSTprEsr1 (g) and BNSTprAB (j) miniscope imaging using a conventional 0.6mm GRIN lens. h, k, Average z-scores of single-unit responses relative to the start of sniff during 5 repeated dangling presentations of male or female intruders. i, l, percent of male vs female preferring units in BNSTpr. n=15 mice. The mouse brain in this figure (g, j) has been reproduced with permission from “The mouse brain in stereotaxic coordinate”, Paxinos G. and Watson C., copyright Elsevier Academic Press 2001.
Extended Data Figure 5: ChemoScope imaging of MPOA and VMHvl across multiple days.
a, f, k, Diagram showing the position of 0.6mm GRIN lens in relation to MPOA, BNSTpr and VMHvl. b-e, Sagittal histology sections showing the expression of jGCaMP7f in MPOA (b, c), hM4Di-mCherry in BNSTpr (b, e), and lack of cell body expression of hM4Di-mCherry in MPOA (d). g-j, Coronal histology sections showing the expression of jGCaMP7f in MPOA (g, h), hM4Di-mCherry in BNSTpr (g, j), and lack of cell body expression of hM4Di-mCherry in MPOA (i). l-o Coronal histology sections showing the expression of jGCaMP7f VMHvl (l, m), hM4Di-mCherry in BNSTpr (o), and lack of cell body expression of hM4Di-mCherry in VMHvl (n). Similar expression patterns were observed in 14 mice tested (7 mice for each imaged region). p, r example raster plots of average single-unit responses to 5 trials of dangled male or female intruders in MPOA (p) and VMHvl (r) across multiple imaging sessions (sessions are 2–3 days apart). Units are sorted based on their eigenvalues in the first principal component of the population activity vector. q, s percent of units that are male or female preferring across 2 days of imaging in MPOA (q) and VMHvl (s), in saline-injected animals. n=7 mice from each imaged region.
Extended Data Figure 6: ChemoScope imaging of MPOA and VMHvl.
a-p, Cumulative fractions showing average single unit responses to dangled male and female intruders from initially (i.e., in saline-injected animals) male preferring (a-d), female preferring (e-h), co-active (i-l) and not active (m-p) units in MPOA (a, b, e, f, i, j, m, n) and VMHvl (c, d, g, h, k, l, o, p). q average responses to dangled male or female intruders in MPOA (left panel) and VMHvl (right panel). r-t, mean response difference between dangled female and male intruders (r), percentage of male vs female preferring units (s) and the ratio of female- to male-preferring units (t) before and after the application of CNO, in MPOA or VMHvl. Statistics: two-sided Kolmogorov-Smirnov test (a-q), values are plotted as mean ± SEM. Two-sided Wilcoxon signed-rank test (r-t). ****p < 0.0001; ***p < 0.001; **p < 0.01; *p < 0.05. n=7 mice from each imaged region.
Extended Data Figure 7: Tracking changes to MPOA and VMHvl single-unit responses before and after silencing BNSTpr.
a, b, Spatial maps showing distribution of male- or female preferring units before (gray) and after (maroon) chemogenetic silencing of BNSTpr in MPOA(a) or VMHvl (b). c, d, response profiles of initially (i.e., in saline-injected animals/pre-CNO) male- or female preferring units after BNSTpr silencing, in MPOA (c) and VMHvl (d). (e-s) 2d scatter plots and bar plots showing average single-unit responses to dangled male and female intruders from tracked units in MPOA and VMHvl, sorted as indicated.
Extended Data Figure 8: Effect of BNSTpr silencing on VMHvl behavior representations and female / male preference.
a, Raster plot of all recorded units from 1 example animal over 3 imaging sessions. Units are sorted separately for each recorded session based on their responses during male and female interactions. b, c, e-h, Cumulative fractions (b, e, g) and bar graphs (c, f, h) of VMHvl single-unit responses to initially (i.e., in saline-injected animals/pre-CNO) sniff active (b, c) or attack active (e-h) cells during attack before CNO (i.e., saline-injected/pre-CNO) (e, f), or before and after CNO (b, c, g, h). g, h, mCherry/CNO only controls. d, percent sniff active cells in VMHvl before (i.e., saline-injected/pre-CNO) and after CNO. Statistics: two-sided Kolmogorov-Smirnov test (b, e, g), values are plotted as mean ± SEM, two-sided Wilcoxon signed-rank test (c, d f, h). ****p < 0.0001; ***p < 0.001; **p < 0.01; *p < 0.05. n=7 mice.
Extended Data Figure 9: Retrograde tracing and imaging of BNSTpr projection neurons.
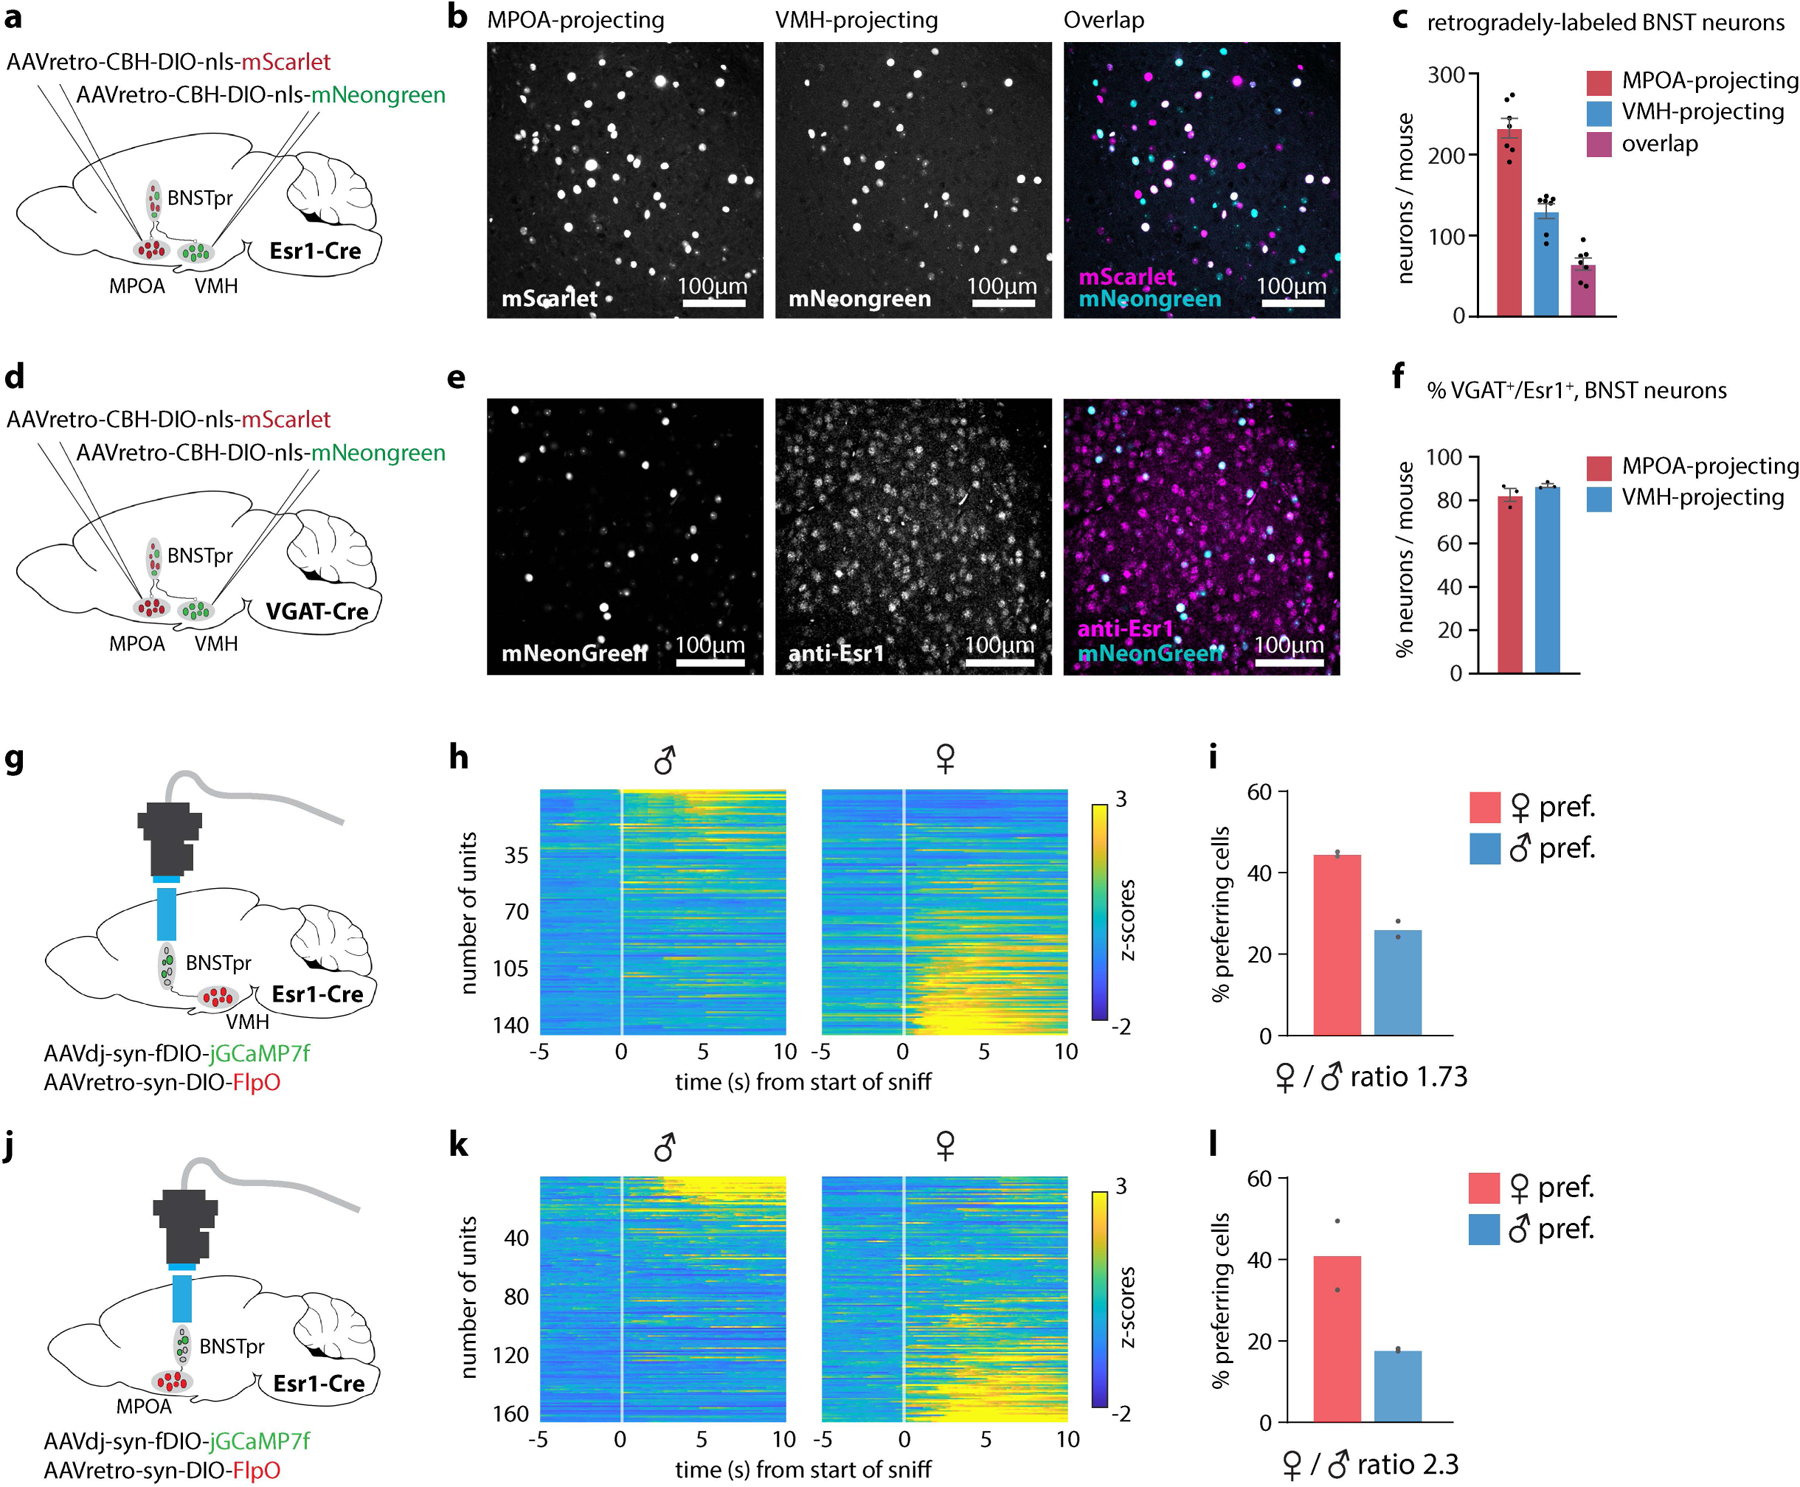
a, d, Diagram showing retrograde tracing of BNSTpr projection neurons. b, e, Example images showing MPOA or VMHvl projecting neurons expressing mScarlet or mNeongreen. c, Average number of back-labeled BNSTpr neurons per animal. n=7 mice. f, Percent of VGAT+ projection neurons that are Esr1+. n=3 mice per injected region. Values are plotted as mean ± SEM (c, f). g, j, Diagram showing miniscope imaging of VMHvl-projecting (n=2 mice) or MPOA-projecting (n=2 mice) BNSTpr neurons. h, k, Average z-scores of single-unit responses relative to the start of sniff during 5 repeated dangling presentations of male or female intruders (n=2 mice per injected region). i, l, Percent of male- or female-preferring units (n=2 mice per injected region). The mouse brain in this figure (a, b, g, j) has been reproduced with permission from “The mouse brain in stereotaxic coordinate”, Paxinos G. and Watson C., copyright Elsevier Academic Press 2001.
Acknowledgements
We thank A. Kennedy and A. Nair for advice on miniscope data analysis, M. Hui and C. Kim for assisting with animal surgery and behavior experiments, M. Zelikowsky for advice on statistical analysis, W. Hong for pilot experiments performed in BNSTpr, X. Da, J. Chang and X. Wang for histology, Y. Huang for genotyping, Caltech OLAR staff for animal care, J. Costanza for mouse colony management, M. Schnitzer, A. Vinograd and B. Weissbourd for constructive comments on the manuscript, C. Chiu for laboratory management and G. Mancuso for administrative assistance, members of the Anderson laboratory for helpful comments on this project. This paper was supported by NIH grants MH070053, MH112593, NS123916 and by the Simons Collaboration on the Global Brain. D.J.A. is an investigator of the Howard Hughes Medical Institute.
Footnotes
Competing interests
The authors declare no competing interests.
Data availability
The data on which this study is based are available upon reasonable request.
References
- 1.Yang CF & Shah NM Representing Sex in the Brain, One Module at a Time. Neuron 82, 261–278 (2014). [DOI] [PMC free article] [PubMed] [Google Scholar]
- 2.Anderson DJ Circuit modules linking internal states and social behaviour in flies and mice. Nat. Rev. Neurosci 17, 692–704 (2016). [DOI] [PubMed] [Google Scholar]
- 3.Hashikawa K, Hashikawa Y, Falkner A & Lin D The neural circuits of mating and fighting in male mice. Curr. Opin. Neurobiol 38, 27–37 (2016). [DOI] [PMC free article] [PubMed] [Google Scholar]
- 4.Chen P & Hong W Neural Circuit Mechanisms of Social Behavior. Neuron 98, 16–30 (2018). [DOI] [PMC free article] [PubMed] [Google Scholar]
- 5.Bergan JF, Ben-Shaul Y & Dulac C Sex-specific processing of social cues in the medial amygdala. eLife 3, e02743 (2014). [DOI] [PMC free article] [PubMed] [Google Scholar]
- 6.Li Y et al. Neuronal Representation of Social Information in the Medial Amygdala of Awake Behaving Mice. Cell 171, 1176–1190.e17 (2017). [DOI] [PMC free article] [PubMed] [Google Scholar]
- 7.Simerly RB Wired for Reproduction: Organization and Development of Sexually Dimorphic Circuits in the Mammalian Forebrain. Annu. Rev. Neurosci 25, 507–536 (2002). [DOI] [PubMed] [Google Scholar]
- 8.Wei Y-C et al. Medial preoptic area in mice is capable of mediating sexually dimorphic behaviors regardless of gender. Nat. Commun 9, 279 (2018). [DOI] [PMC free article] [PubMed] [Google Scholar]
- 9.Karigo T et al. Distinct hypothalamic control of same- and opposite-sex mounting behaviour in mice. Nature (2020) doi: 10.1038/s41586-020-2995-0. [DOI] [PMC free article] [PubMed] [Google Scholar]
- 10.Ogawa S et al. Abolition of male sexual behaviors in mice lacking estrogen receptors α and β (αβERKO). Proc. Natl. Acad. Sci 97, 14737 (2000). [DOI] [PMC free article] [PubMed] [Google Scholar]
- 11.Lin D et al. Functional identification of an aggression locus in the mouse hypothalamus. Nature 470, 221–226 (2011). [DOI] [PMC free article] [PubMed] [Google Scholar]
- 12.Yang T et al. Social Control of Hypothalamus-Mediated Male Aggression. Neuron 95, 955–970.e4 (2017). [DOI] [PMC free article] [PubMed] [Google Scholar]
- 13.Lee H et al. Scalable control of mounting and attack by Esr1+ neurons in the ventromedial hypothalamus. Nature 509, 627–632 (2014). [DOI] [PMC free article] [PubMed] [Google Scholar]
- 14.Yang CF et al. Sexually Dimorphic Neurons in the Ventromedial Hypothalamus Govern Mating in Both Sexes and Aggression in Males. Cell 153, 896–909 (2013). [DOI] [PMC free article] [PubMed] [Google Scholar]
- 15.Wei D, Talwar V & Lin D Neural circuits of social behaviors: innate yet flexible. Neuron S0896627321001124 (2021) doi: 10.1016/j.neuron.2021.02.012. [DOI] [PMC free article] [PubMed] [Google Scholar]
- 16.Bayless DW et al. Limbic Neurons Shape Sex Recognition and Social Behavior in Sexually Naive Males. Cell 176, 1190–1205.e20 (2019). [DOI] [PMC free article] [PubMed] [Google Scholar]
- 17.Ghosh KK et al. Miniaturized integration of a fluorescence microscope. Nat. Methods 8, 871–878 (2011). [DOI] [PMC free article] [PubMed] [Google Scholar]
- 18.Ziv Y et al. Long-term dynamics of CA1 hippocampal place codes. Nat. Neurosci 16, 264–266 (2013). [DOI] [PMC free article] [PubMed] [Google Scholar]
- 19.Remedios R et al. Social behaviour shapes hypothalamic neural ensemble representations of conspecific sex. Nature 550, 388–392 (2017). [DOI] [PMC free article] [PubMed] [Google Scholar]
- 20.Armbruster BN, Li X, Pausch MH, Herlitze S & Roth BL Evolving the lock to fit the key to create a family of G protein-coupled receptors potently activated by an inert ligand. Proc. Natl. Acad. Sci 104, 5163–5168 (2007). [DOI] [PMC free article] [PubMed] [Google Scholar]
- 21.Govorunova EG, Sineshchekov OA, Janz R, Liu X & Spudich JL Natural light-gated anion channels: A family of microbial rhodopsins for advanced optogenetics. Science 349, 647–650 (2015). [DOI] [PMC free article] [PubMed] [Google Scholar]
- 22.Mahn M et al. High-efficiency optogenetic silencing with soma-targeted anion-conducting channelrhodopsins. Nat. Commun 9, 4125 (2018). [DOI] [PMC free article] [PubMed] [Google Scholar]
- 23.Gradinaru V et al. Molecular and Cellular Approaches for Diversifying and Extending Optogenetics. Cell 141, 154–165 (2010). [DOI] [PMC free article] [PubMed] [Google Scholar]
- 24.Mahn M, Prigge M, Ron S, Levy R & Yizhar O Biophysical constraints of optogenetic inhibition at presynaptic terminals. Nat. Neurosci 19, 554–556 (2016). [DOI] [PMC free article] [PubMed] [Google Scholar]
- 25.Zhang C et al. Optimized photo-stimulation of halorhodopsin for long-term neuronal inhibition. BMC Biol. 17, 95 (2019). [DOI] [PMC free article] [PubMed] [Google Scholar]
- 26.Knoedler JR et al. A functional cellular framework for sex and estrous cycle-dependent gene expression and behavior. Cell S009286742101494X (2022) doi: 10.1016/j.cell.2021.12.031. [DOI] [PMC free article] [PubMed] [Google Scholar]
- 27.Padilla SL et al. Agouti-related peptide neural circuits mediate adaptive behaviors in the starved state. Nat. Neurosci 19, 734–741 (2016). [DOI] [PMC free article] [PubMed] [Google Scholar]
- 28.Nyby J, Wysocki CJ, Whitney G & Dizinno G Pheromonal regulation of male mouse ultrasonic courtship (Mus musculus). Anim. Behav 25, 333–341 (1977). [DOI] [PubMed] [Google Scholar]
- 29.Stanić D et al. Characterization of Aromatase Expression in the Adult Male and Female Mouse Brain. I. Coexistence with Oestrogen Receptors α and β, and Androgen Receptors. PLoS ONE 9, e90451 (2014). [DOI] [PMC free article] [PubMed] [Google Scholar]
- 30.Dana H et al. High-performance calcium sensors for imaging activity in neuronal populations and microcompartments. Nat. Methods 16, 649–657 (2019). [DOI] [PubMed] [Google Scholar]
- 31.Pnevmatikakis EA et al. Simultaneous Denoising, Deconvolution, and Demixing of Calcium Imaging Data. Neuron 89, 285–299 (2016). [DOI] [PMC free article] [PubMed] [Google Scholar]
- 32.Zhou P et al. Efficient and accurate extraction of in vivo calcium signals from microendoscopic video data. eLife 7, e28728 (2018). [DOI] [PMC free article] [PubMed] [Google Scholar]
- 33.Knoedler JR et al. A functional cellular framework for sex and estrous cycle-dependent gene expression and behavior. Cell 185, 654–671.e22 (2022). [DOI] [PMC free article] [PubMed] [Google Scholar]
- 34.Dong H-W & Swanson LW Projections from bed nuclei of the stria terminalis, posterior division: Implications for cerebral hemisphere regulation of defensive and reproductive behaviors. J. Comp. Neurol 471, 396–433 (2004). [DOI] [PubMed] [Google Scholar]
- 35.Kingsbury L et al. Cortical Representations of Conspecific Sex Shape Social Behavior. Neuron 107, 941–953.e7 (2020). [DOI] [PMC free article] [PubMed] [Google Scholar]
- 36.Stagkourakis S, Spigolon G, Liu G & Anderson DJ Experience-dependent plasticity in an innate social behavior is mediated by hypothalamic LTP. Proc. Natl. Acad. Sci 117, 25789–25799 (2020). [DOI] [PMC free article] [PubMed] [Google Scholar]
- 37.Yamaguchi T et al. Posterior amygdala regulates sexual and aggressive behaviors in male mice. Nat. Neurosci 23, 1111–1124 (2020). [DOI] [PMC free article] [PubMed] [Google Scholar]
- 38.Zha X et al. VMHvl-Projecting Vglut1+ Neurons in the Posterior Amygdala Gate Territorial Aggression. Cell Rep. 31, 107517 (2020). [DOI] [PubMed] [Google Scholar]
- 39.Welch JD et al. Single-Cell Multi-omic Integration Compares and Contrasts Features of Brain Cell Identity. Cell 177, 1873–1887.e17 (2019). [DOI] [PMC free article] [PubMed] [Google Scholar]
- 40.Moffitt JR et al. Molecular, spatial, and functional single-cell profiling of the hypothalamic preoptic region. Science 362, eaau5324 (2018). [DOI] [PMC free article] [PubMed] [Google Scholar]
- 41.Nair A et al. An approximate line attractor in the hypothalamus that encodes an aggressive internal state. http://biorxiv.org/lookup/doi/10.1101/2022.04.19.488776 (2022) doi: 10.1101/2022.04.19.488776. [DOI] [PMC free article] [PubMed] [Google Scholar]
- 42.Jazayeri M & Afraz A Navigating the Neural Space in Search of the Neural Code. Neuron 93, 1003–1014 (2017). [DOI] [PubMed] [Google Scholar]
- 43.Daigle TL et al. A Suite of Transgenic Driver and Reporter Mouse Lines with Enhanced Brain-Cell-Type Targeting and Functionality. Cell 174, 465–480.e22 (2018). [DOI] [PMC free article] [PubMed] [Google Scholar]
- 44.Franklin KBJ & Paxinos G The mouse brain in stereotaxic coordinates. (2013). [Google Scholar]
- 45.Segalin C et al. The Mouse Action Recognition System (MARS) software pipeline for automated analysis of social behaviors in mice. eLife 10, e63720 (2021). [DOI] [PMC free article] [PubMed] [Google Scholar]
- 46.Friedrich J, Zhou P & Paninski L Fast online deconvolution of calcium imaging data. PLOS Comput. Biol 13, e1005423 (2017). [DOI] [PMC free article] [PubMed] [Google Scholar]
- 47.Shadlen M, Britten K, Newsome W & Movshon J A computational analysis of the relationship between neuronal and behavioral responses to visual motion. J. Neurosci 16, 1486–1510 (1996). [DOI] [PMC free article] [PubMed] [Google Scholar]
- 48.McInnes L, Healy J & Melville J UMAP: Uniform Manifold Approximation and Projection for Dimension Reduction. (2020). [Google Scholar]
Associated Data
This section collects any data citations, data availability statements, or supplementary materials included in this article.
Data Availability Statement
The data on which this study is based are available upon reasonable request.