Abstract
Purpose:
To rapidly image and localize the focus in MR-guided focused ultrasound (FUS) while maintaining a low ultrasound duty cycle to minimize tissue effects.
Methods:
MR-ARFI is key to targeting FUS procedures such as neuromodulation, and works by encoding ultrasound-induced displacements into the phase of MR images. However, it can require long scan times to cover a volume of tissue, especially when minimizing the FUS dose during targeting is paramount. To simultaneously minimize scan time and the FUS duty cycle, a two-minute 3D reduced-FOV spin echo ARFI scan with two-dimensional undersampling was implemented at 3T with a FUS duty cycle of 0.85%. The 3D k-space sampling scheme incorporated uniform undersampling in one phase-encoded axis and partial Fourier sampling in the other. The scan interleaved FUS-on and FUS-off data collection to improve displacement map quality via a joint low-rank image reconstruction. Experiments in agarose and graphite phantoms and living macaque brains for neuromodulation and blood-brain barrier opening studied the effects of the sampling and reconstruction strategy on the acquisition, and evaluated its repeatability and accuracy.
Results:
In the phantom, the distances between displacement centroids of ten prospective reconstructions and a fully-sampled reference were below 1 mm. In in vivo brain, the distances between centroids ranged from 1.3 mm to 2.1 mm. Results in phantom and in vivo brain both showed that the proposed method can recover the FUS focus compared to slower fully sampled scans.
Conclusion:
The proposed 3D MR-ARFI rFOV method enables rapid imaging of the FUS focus while maintaining a low FUS duty cycle.
Keywords: MRI, focused-ultrasound, MR-ARFI, 3D, reduced-FOV, low-rank
Introduction
Magnetic resonance imaging-guided focused ultrasound (MRgFUS) is a noninvasive and spatially precise therapeutic technique that targets acoustic energy to tissue deep inside the body, using MRI to target the focus and monitor treatment. MRgFUS has been widely applied to thermally ablate tissue for the treatment of uterine fibroids, bone metastases, neurological disorders, and prostate and breast cancer [1, 2, 3, 4, 5, 6]. Non-ablative brain applications of MRgFUS such as neuromodulation and blood-brain barrier opening (BBBO) are being increasingly studied [7, 8, 9]. However, when ultrasound waves propagate through tissue or skull bone with acoustic inhomogeneities, the ultrasonic waves are distorted, which leads to attenuation and spatial shifts of the FUS focus. Therefore, before applying high FUS energy for treatment, it is essential to verify if the FUS focus is positioned at the correct target.
MR acoustic radiation force imaging (MR-ARFI) images the FUS focal spot using motion-encoding gradients (MEGs) that are synchronized with FUS bursts to encode micron-level FUS-induced tissue displacements into phase shifts in MR images [10, 11, 12]. Displacement maps are obtained by phase subtraction. MR-ARFI sequences usually use FUS bursts of 1 – 20 ms for each TR and a long TR to maintain a FUS duty cycle of 0.5% – 10%. While the basic safety of MR-ARFI at low duty cycles has been established in histology [13] and simulation [14, 15] studies, the deposited heat and mechanical effects on neurons due to MR-ARFI’s powerful and frequent FUS bursts could generate unwanted neuromodulatory effects [16] since the brain is very sensitive to even small temperature rises. Thus, the FUS duty cycle of MR-ARFI should be kept as low as possible. As a result, long TRs corresponding to long delays between FUS bursts must be used which result in long scan times. In addition, it is necessary to cover the entire volume of the FUS focus to verify its center position and three-dimensional (3D) shape.
Full coverage of the focus requires long scan times, which limits MR-ARFI’s use in iteratively identifying and re-steering the focus during treatment planning, and raises the risk of unsafe skull heating during the scan; along these lines, multiple MR-ARFI methods have been described that can simultaneously monitor displacement and FUS tissue heating [17, 18, 19, 20]. To accelerate MR-ARFI, multishot EPI sequences have been reported [21, 14], as well as approaches to reduce k-space coverage such as outer volume suppression (reduced-FOV), partial Fourier (PF) imaging and keyhole imaging [21, 22, 23, 24]. Existing MR-ARFI sequences are either 2D, 2D reduced-FOV, or 3D, where the 3D methods [25] encode a whole brain volume in two dimensions. Parallel imaging [26] has also been used in MR-ARFI sequences [23], but there are two challenges associated with this: i) It is difficult to position multi-channel RF coils around bulky focused ultrasound transducers which must be in direct acoustic contact with the body; ii) The relatively small three-dimensional fields-of-view (not more than several centimeters in each dimension) over which the FUS beam needs to be mapped are not amenable to encoding with coil sensitivities which vary smoothly over space. Therefore, there is a need for an MR-ARFI technique that can cover a small 3D FOV with a short scan time and minimal FUS duty cycle, which does not rely on parallel imaging.
To cover the entire FUS focus and minimize the FUS duty-cycle and scan time in MR-ARFI, this work integrated reduced-FOV imaging with an undersampled 3D scan to achieve a 3D reduced-FOV (rFOV) spin echo (SE) MR-ARFI pulse sequence with a scan time of 2 minutes and 20 seconds, which images a FOV of 160×40×40 mm3 with 2 mm isotropic resolution and has a low FUS duty cycle of 0.85%. A low-rank reconstruction algorithm based on self-consistency with acquired k-space data and matching image magnitudes was implemented to reconstruct images from the scan. To evaluate it, experiments were performed in a brain tissue-mimicking phantom and in two macaque brain studies. Results in the phantom and in vivo brains show the proposed MR-ARFI scan recovered the FUS focus with high fidelity compared to full sampling. Retrospectively undersampled phantom scans were also performed to study the effect of undersampling in each dimension and characterize its repeatability. The reported technique could improve the efficiency of MRgFUS brain applications, especially when MR-ARFI needs to be repeated several times for finding, steering, or phase-correcting the focus.
Methods
Pulse Sequence
The 3D rFOV SE MR-ARFI sequence using multi-shot EPI with an echo train length of 3 was implemented on a 3.0-Tesla (T) human MRI scanner (Philips Elition, Philips Healthcare, Best, Netherlands). As the pulse sequence diagram in Figure 1b depicts, the frequency encoding direction was aligned with the ultrasound propagation direction. The two phase-encoded FOV’s were reduced by applying the selective excitation pulse along the slow phase-encoded dimension (kz), and the selective refocusing pulse along the EPI phase-encoded dimension (ky), enabling the excitation of a rectangular slab which covers the entire focus (Figure 1a). Selective minimum-phase excitation and linear phase refocusing pulses were designed by the Shinnar-Le Roux algorithm [27]. Root-flipping [28] was applied to the refocusing pulse to shorten its duration to 4.12 ms while staying within the scanner’s 13 μT peak RF amplitude limit. Without root-flipping, its duration would be 14.0 ms for the same peak amplitude. Root-flipping has no effect on an RF pulse’s SAR, which was not an active constraint in this pulse sequence. The time-bandwidth products of the 90° and 180° pulses were 7.0 and 5.0, respectively. For ARFI displacement encoding, a pair of unipolar trapezoidal motion-encoding gradients (MEGs) were placed before and after the refocusing pulse. k-Space data collection with and without FUS bursts were alternated between TRs to maintain a low FUS duty-cycle with a period of 2 TRs. The FUS emission was synchronized with the first MEG (odd ky lines) or second MEG (even ky lines) [19] to acquire two FUS-ON images with opposite displacement phase shifts.
Figure 1.
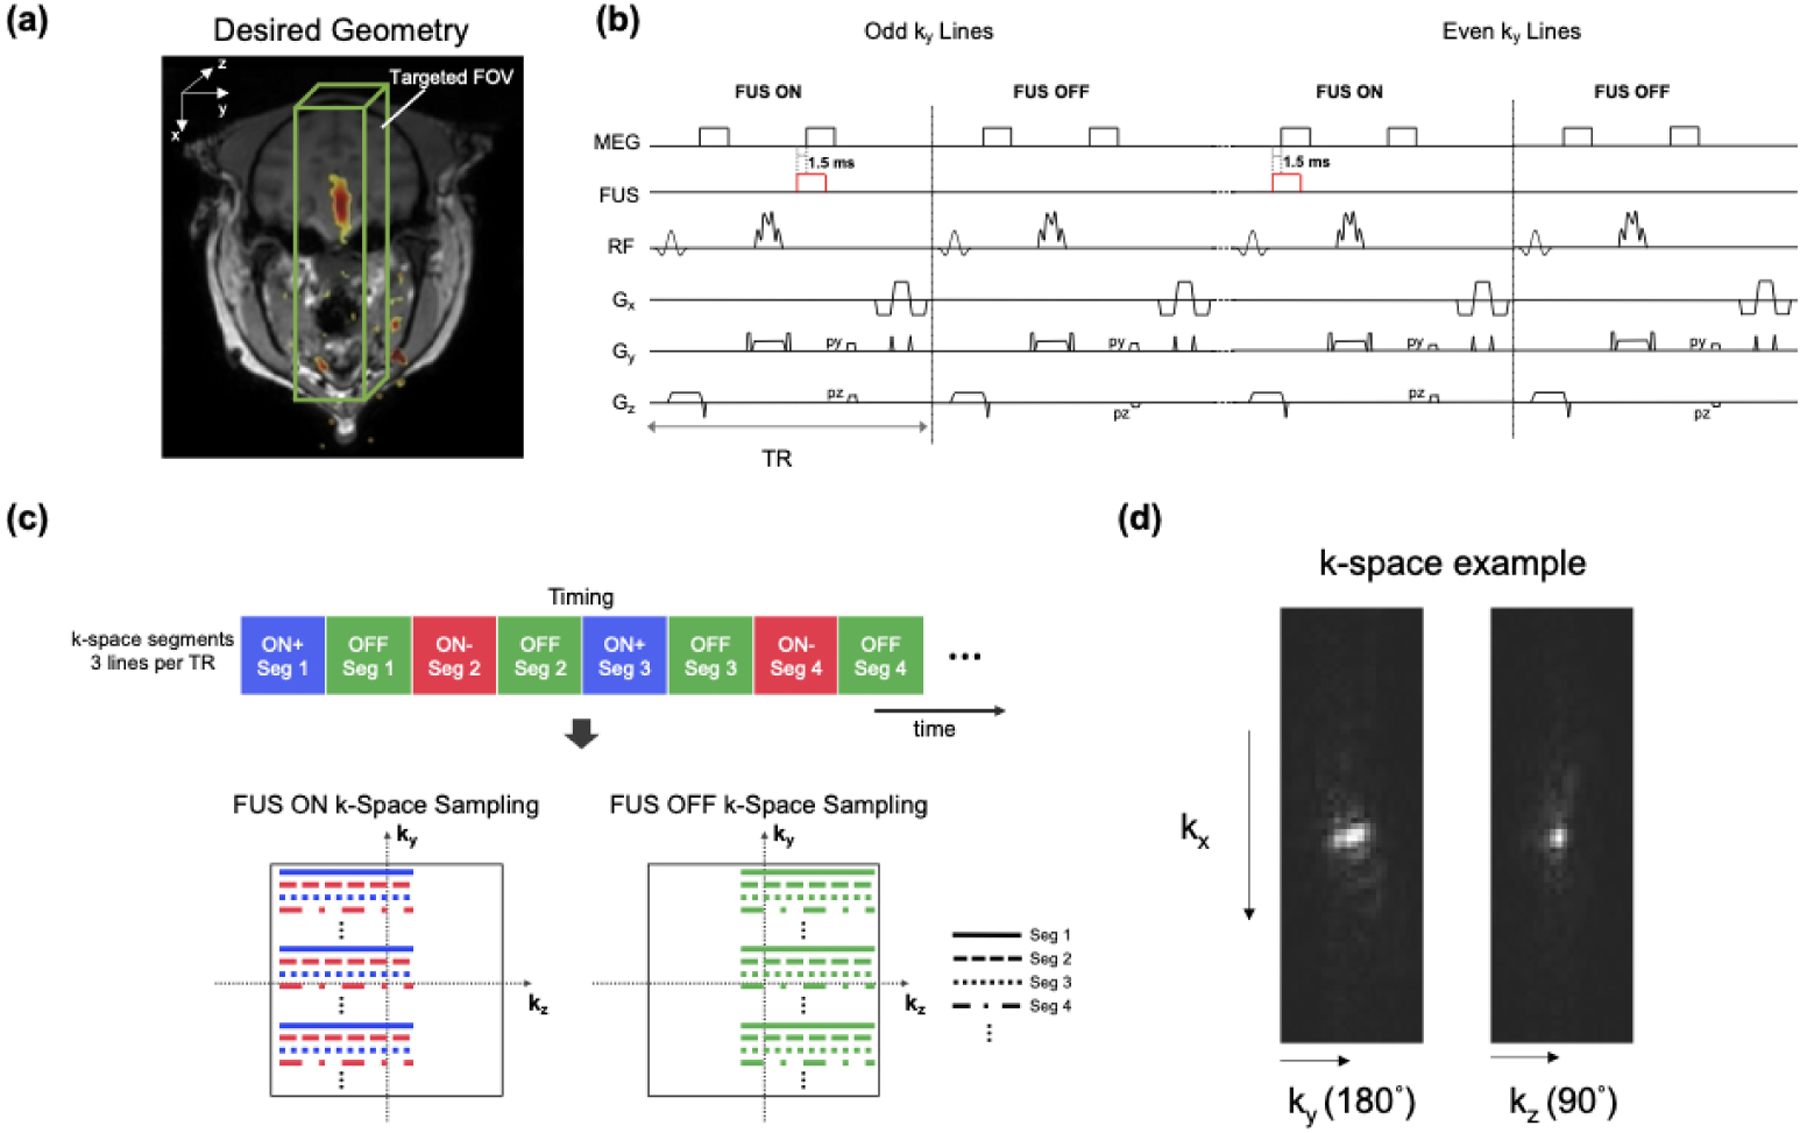
a: The 3D rFOV MR-ARFI sequence images a rectangular cube sized to cover the entire focus along the FUS axial dimension. b Timing diagram of the 3D reduced-FOV (rFOV) spin-echo ARFI sequence which uses multi-shot EPI with an echo train length of 3. Unipolar motion-encoding gradients (MEGs) were placed before and after the 180° pulse, the 180° pulse was applied to the in-plane EPI phase-encoded dimension (y) to reduce the FOV, and the ultrasound emission was alternated on or off between TRs. The ultrasound was started 1.5 ms before the beginning of the MEGs. c: The proposed k-space undersampling scheme. The top colored blocks illustrate the ordering of the ky segments, which yields three 3D k-space datasets with complementary undersampling patterns (yON+, yON− and yOFF), as illustrated by the ky-kz phase encoding patterns at the bottom. The FUS pulses were synchronized with the first MEG (odd ky lines) or the second MEG (even ky lines) to obtain positive and negative motion-encoded phases. The partial Fourier direction was alternated between TRs. d: Perpendicular k-space dataset slices illustrate how the root-flipped refocusing pulse applied an approximately quadratic phase that spread out k-space energy in the ky direction, making that dimension amenable to uniform R = 2 undersampling, while the kz dimension was better suited to partial Fourier sampling.
The sequence’s k-space sampling scheme is illustrated in Figure 1c. As illustrated in Figure 1d, the root-flipped refocusing pulse applies approximately quadratic phase across the refocused slab which broadens the k-space signal along the ky direction. This suggests an acquisition in which uniform undersampling is applied along the ky direction, and partial Fourier undersampling is applied along the kz direction. The sequence acquires subsampled data of three 3D rFOV images: two FUS-on images with opposite polarities of the displacement-induced phase shifts via alternating the FUS pulse between the two MEGs (xON+ with the FUS pulse played during the first MEG and xON− with the FUS pulse played during the second MEG), and one with FUS off (xOFF). Alternating the timing of ultrasound pulse between odd and even ky lines yielded complementary k-space data between the two FUS-ON images when each was undersampled uniformly in the ky direction by an acceleration factor (R) of 2. Partial Fourier (PF) encoding was further applied in the kz-direction for an additional scan time reduction, with a factor of 0.67. Finally, the FUS-ON and FUS-OFF k-space datasets were acquired with opposite PF directions to obtain complementary k-space data (FUS-ON: ‘left half’, FUS-OFF: ‘right half’ in Figure 1c).
Image Reconstruction
The flowchart in Figure 2 illustrates the image reconstruction algorithm. The unsampled k-space data points were recovered with a low-rank reconstruction using annihilating filters [29, 30] with a data consistency constraint and a constraint that all three images have the same magnitude, since the acoustic radiation force applied by the FUS beam is expected to only change image phase. The virtual conjugate coil concept [31] was also applied by treating the three images as different ‘coils’ whose conjugate symmetric k-space signals were used to generate additional virtual coil signals. The reconstruction algorithm solved the following nuclear norm-regularized least-squares optimization problem:
| (1) |
where the ‘+’, ‘−’, and ‘0’ subscripts respectively represent positive and negative FUS-ON and FUS-OFF, the x are the reconstructed images, the y are the collected k-space data, and the P are the k-space sampling patterns. F is a Fourier transform operator, and λ is a regularization parameter that balances data consistency with the nuclear norm of the block-Hankel matrix H(x+, x−, x0). As illustrated in Figure 2, in each iteration of the reconstruction the 3D datasets were extracted as blocks and stretched to form rows of the Hankel matrix for each dataset, which were then concatenated into H(x+, x−, x0). That matrix was singular value-thresholded, and the thresholded matrix was converted back to k-space data and inverse Fourier-transformed back to images. To constrain the images to have the same magnitude, a single magnitude image Im was calculated from the first component of the SVD of the Nx × 3 matrix formed from the image estimates at each iteration , and . Then, the magnitudes of , and were replaced with Im but their phases were left unmodified. Finally, data consistency was enforced by replacing the sampled data in the reconstructed data arrays.
Figure 2.
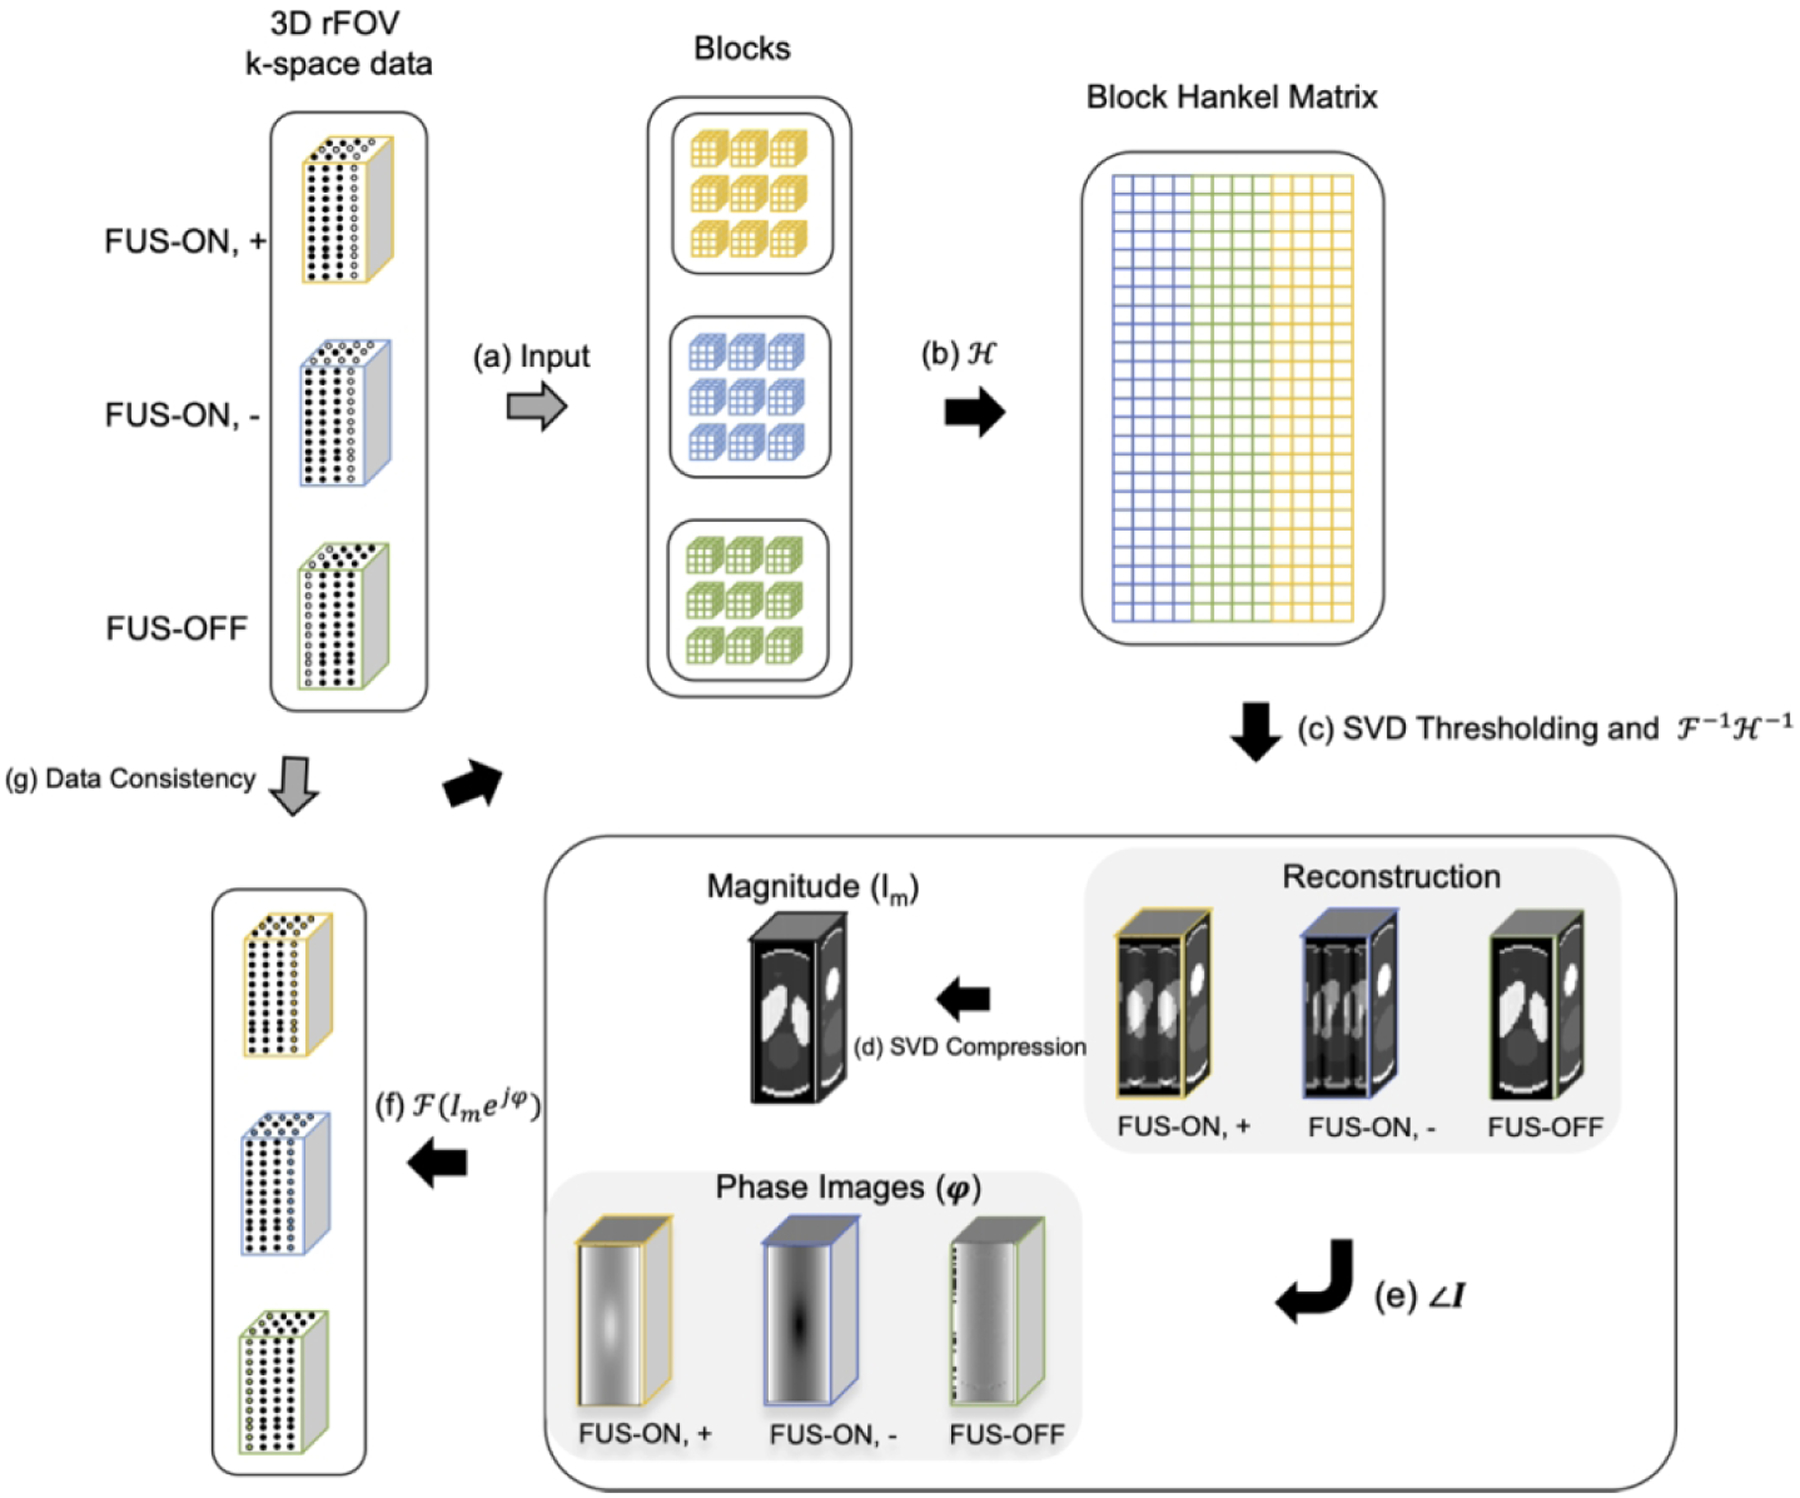
Flowchart of Low-rank image reconstruction. Step a - b: At each iteration, the k-space datasets for the three images are segmented into blocks that are stretched to form a Block Hankel matrix; Step c: That matrix is singular value-thresholded and converted back to estimated images; Step d - f: One magnitude image Im was calculated by taking the first singular component of SVD of three images (FUS ON, +; FUS ON, −; FUS-OFF) and then was applied to replace the magnitudes of the current image estimates with unchanging phases; Step g: The originally acquired k-space data were reinserted into the recovered data to enforce data self-consistency.
Image reconstructions were performed in MATLAB 2020b (Mathworks, Natick, MA, USA). Coil compression [32] was first applied to the raw data acquired from the scanner before reconstruction, to compress data to a single channel. The displacements Δd were calculated by complex phase subtraction of FUS-ON images with positive and negative displacement encoding phases to cancel out the background phases:
| (2) |
where γ is the gyro-magnetic ratio, G is the gradient strength, and τ is the gradient duration.
Experiments
rFOV MR-ARFI images were acquired in 2 minutes 20 seconds with imaging parameters of FOV 160×40×40 mm3 (x/y/z), 2×2×2 mm3 isotropic resolution, flip angle 90°, TE/TR 38 ms/500 ms, and an EPI factor of 3 echoes per TR. The oversampling factors along the two phase-encoded dimensions were both 1.2 to account for the transition bands of the selective excitations, i.e., the encoded FOVs in the two phase-encoded dimensions were 48 mm with a matrix size of 24, to account for transitions of the 40 mm-wide excitation and refocusing profiles. These parameters resulted in an EPI phase-encoded (ky) dimension effective echo spacing of 0.369 ms, a y pixel bandwidth of 113.5 Hz, and an x pixel bandwidth of 501.4 Hz. Unipolar MEGs with strength 40 mT/m and duration 8 ms were used for ARFI displacement encoding with a trigger delay of −1.5 ms. The same scan was also collected with full sampling for reference, with the same parameters and a scan time of 6 minutes 28 seconds. The collected data were zero-fill-interpolated to 0.33 × 0.33 × 0.33 mm3 voxels to mitigate partial volume effects, with Tukey windowing. In phantom scans, high-resolution large-FOV T1-weighted images were acquired in the same sessions with a 3D T1-weighted RF-spoiled GRE sequence. The acquisition parameters of that sequence were: flip angle 8°, FOV 18.1 × 18.1× 12 cm3, acquired resolution 1 × 1 × 1 mm3, reconstructed resolution 0.42 × 0.42 × 0.50 mm3, and TE/TR 3.7 ms/8 ms. For in vivo scans, the high-resolution T1-weighted images were acquired with a 3D compressed SENSE fast GRE sequence. The acquisition parameters were: flip angle 8°, SENSE acceleration factor 3, echo train length 121, FOV 25 × 24× 25 cm3, acquired resolution 1 × 1 × 1 mm3, reconstructed resolution 0.49 × 0.49 × 0.50 mm3, and TE/TR 4.6 ms/9.9 ms.
The phantom experimental setup is shown in Figure 3 (left). An MR-compatible single-element transducer (H115MR, Sonic Concepts, Bothell, WA, USA) was used to generate ultrasound emissions at 850 kHz with a low duty-cycle (8.5 ms per 1000 ms / 2 TRs, free field pressure 2.7 MPa) for all phantom experiments. It has a 63.2 mm radius of curvature, a 64 mm diameter, and focus full-width-at-half-maximums (FWHMs) of 6 × 6 × 39.5 mm3. A custom 3D-printed coupling cone with a 3 cm aperture held the transducer and was filled with agar (1% weight by volume). The cone was connected to a 3D-printed cylindrical phantom container with a diameter of 8 cm. The remaining space in the cone and the phantom holder was filled with an agar-graphite phantom (1% agar/4% graphite weight by volume) to mimic brain tissue acoustic properties [14, 33]. A pair of loop receive coils (dStream Flex-L; Philips Healthcare) were placed on either side of the phantom. The volumetric FOV was aligned with the ultrasound beam by finding the geometric focus according to the transducer’s 64 mm focal length. The MEGs were aligned with the ultrasound propagation direction (anterior-posterior). The fully-sampled and accelerated rFOV MR-ARFI scans were repeated ten times to obtain a high-SNR averaged reference and study repeatability of the acquisitions. The mean and standard deviations around the focus were calculated for the displacements in a 3×3×3-voxel (6×6×6-mm3) region centered at the voxel with maximum displacement. The displacement SNR was calculated as the ratio of peak displacement at the focus and the standard deviation of background displacements. In addition, we calculated the distances between the displacement centroid for each individual reconstruction and the centroid of the averaged fully-sampled reference, where centroids were calculated according to:
| (3) |
where is the position of the displacement centroid, is the position of each voxel and di is the displacement at voxel .
Figure 3.
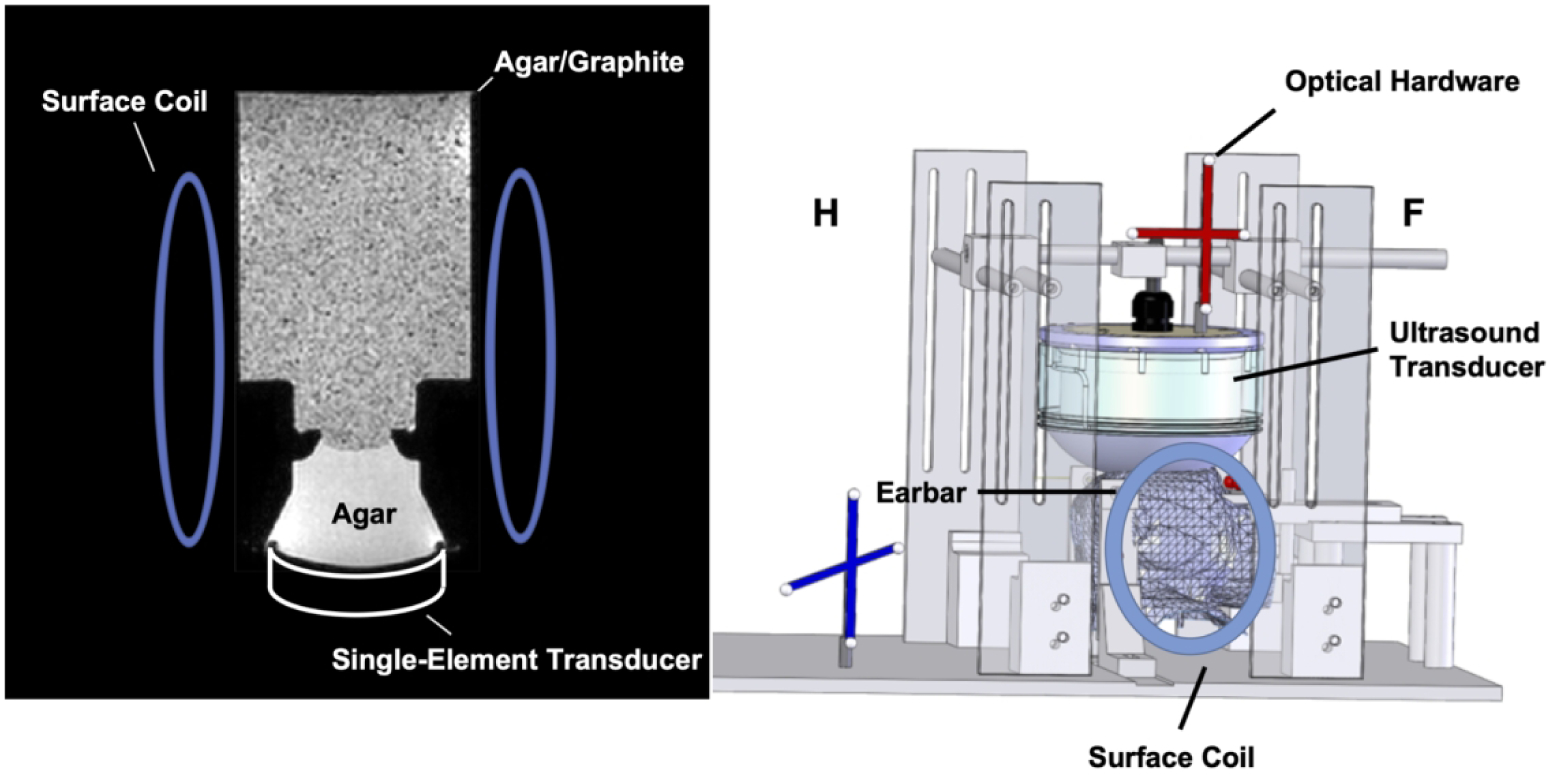
Experimental setup for phantom (left) and macaque imaging (right).
Two sets of in vivo MR-ARFI scans were performed in a healthy adult female macaque monkey weighing 4.2 kilograms. Imaging procedures were approved by the Institutional Animal Care and Use Committee (IACUC) at Vanderbilt University and were in agreement with all guidelines and regulations. The animal was anesthetized with 1–1.5% isoflurane and mechanically ventilated. Its head was positioned in an MRI-compatible stereotaxic frame. Physiological vital signs (heart rate, end-tidal CO2, and SpO2) were consistently monitored and maintained at stable ranges. Figure 3 (right) illustrates the experimental setup for these experiments, in which the focus was positioned in the periaqueductal grey for neuromodulation, and in cortical grey matter for blood-brain barrier opening (BBBO). The optical tracking method described in Ref. [14] was used to align the FOV with the ultrasound beam. The direction of the MEGs was aligned with the vertical dimension. For neuromodulation, a custom-designed phased-array transducer at 650 kHz described in Ref. [34] was used to generate ultrasound emissions with durations of 8.5 ms per 1000 ms/2 TRs, with an estimated free-field pressure of 6.4 MPa. It has a diameter of 103 mm, a 72 mm radius of curvature, and 128 elements with 6.6 mm diameters. It generates a focus with FWHMs of 2.2 × 2.2 × 9.3 mm3. Measurements through an ex vivo nonhuman primate skull with that transducer showed that the focal pressure is 28% of the free field pressure [34], resulting in an estimated in vivo pressure of 1.8 MPa. For ARFI acquired during BBBO procedures, the ultrasound emissions were generated by a 1 MHz phased-array transducer with the same FUS pulse length and period as for the neuromodulation ARFI scans and an estimated in situ pressure of 1.5 MPa with an estimated 20% of free field pressure transmission through the skull. This transducer has a diameter of 58 mm, a focal length of 53.2 mm, 128 transmit elements with 3.5 mm diameters, and focus FWHMs of 2.0 × 2.0 × 13.5 mm3. The transmission estimate is based on hydrophone measurements through an ex vivo NHP skull and acoustic simulations using k-Wave [35]. After the MR-ARFI scans, microbubbles were injected systemically and BBB opening was performed with 10 ms, 1 MHz pulses repeated at 2 Hz for 2 minutes at an estimated in-vivo pressure of 0.7 MPa at the target. Definity microbubbles (Lantheus Medical Imaging, North Billerica, MA, USA) were administered intravenously as a bolus injection. The microbubble concentration was 20 uL/kg diluted into 3 mL of saline. Gadolinium (Gadavist) was then injected to visualize BBBO by collecting a pair of T1-weighted images before injection and after the Gadavist perfused into the target spot. A pair of loop receive coils (dStream Flex-S; Philips Healthcare) were placed on either side of the macaque’s head. Due to inter-scan differences between the reference in vivo fully-sampled scans and the undersampled scans, displacement map reconstructions were performed from both retrospectively undersampled and prospectively undersampled data. The mean (± standard deviation) displacements at the maximum displacement, the maximum displacement, and the FWHMs of the displacement profiles along US-x/y/z direction were calculated. The FWHM’s of the FUS focus along the long axis (US-x) and the two short axes (US-y and US-z) were measured by Gaussian fitting of the displacement profiles across the point with the maximum displacement with least-squares curve fitting using the MATLAB function “lsqcurvefit”.
Results
Figure 4 shows the middle axial and sagittal slices of full-FOV T1-weighted images (reference) and rFOV ARFI magnitude images in the macaque brain (top) and phantom (bottom) experiments, respectively. The blue boxes indicate the positions of the rFOV images in the full-FOV reference images.
Figure 4.
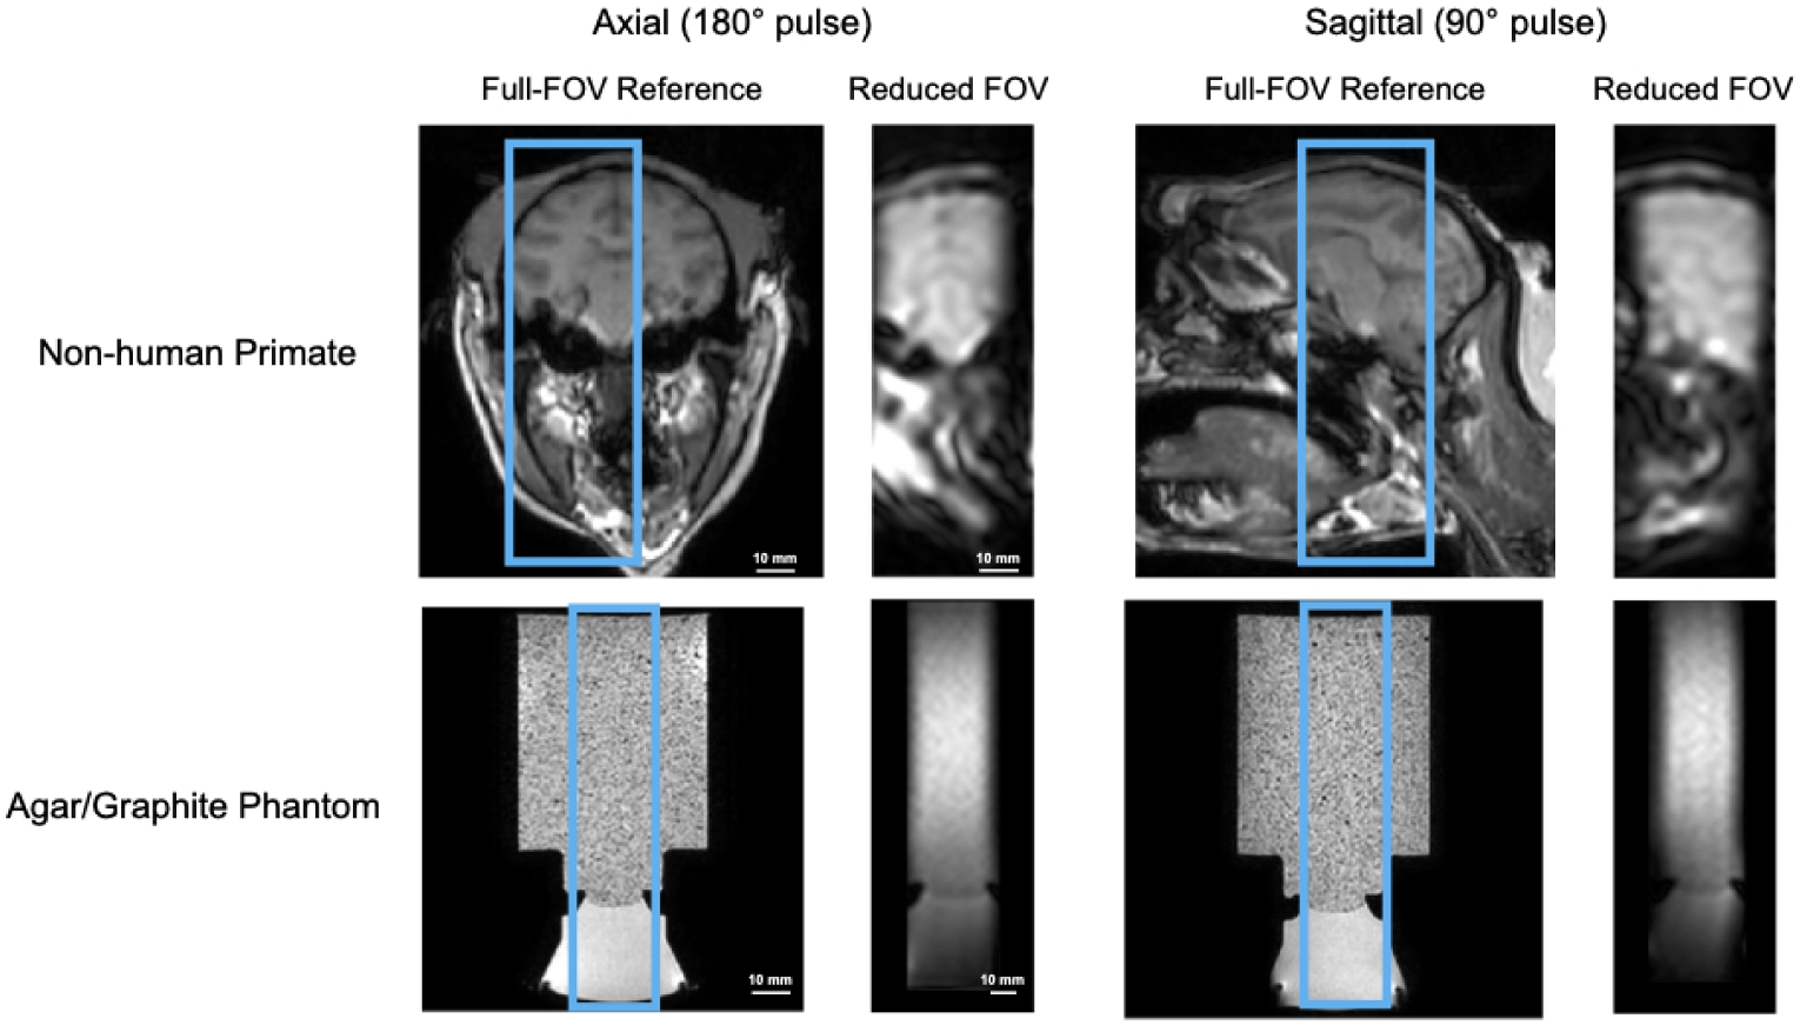
Middle axial and sagittal slices of reduced-FOV images compared with full-FOV high-resolution structural scans of in vivo macaque brain (top) and a brain-tissue mimicking phantom (bottom). The axial plane was selected by the sequence’s 180° RF pulse and the sagittal plane was selected by its 90° RF pulse.
Figure 5 shows axial, sagittal, and coronal slices through the point in the phantom with maximum displacement with R = 2 undersampling alone, R = 2 undersampling and partial Fourier together, and R = 2 undersampling and partial Fourier together but without joint reconstruction of the FUS-OFF image. These results were obtained by retrospectively undersampling one of the fully-sampled phantom datasets. The displayed displacement maps were cropped in the frequency encoded dimension to a FOV of 64×48×48 mm3. The right subfigure illustrates the position of zoomed-in displacement maps in the full-FOV reference. The reconstructions from the undersampled data of R = 2 only (2nd row), R = 2 and PF sampling (3rd row) recovered the displacement maps successfully, with root-mean-squared errors (RMSEs) of 0.129 μm and 0.124 μm compared with the reference. The fourth row shows the reconstructed maps from the undersampled FUS-ON data alone, without jointly reconstructing the FUS-OFF images, which led to a high RMSE of 1.446 μm. The reconstruction algorithm failed in this case due to the lack of the FUS-OFF image’s k-space data in the joint reconstruction.
Figure 5.
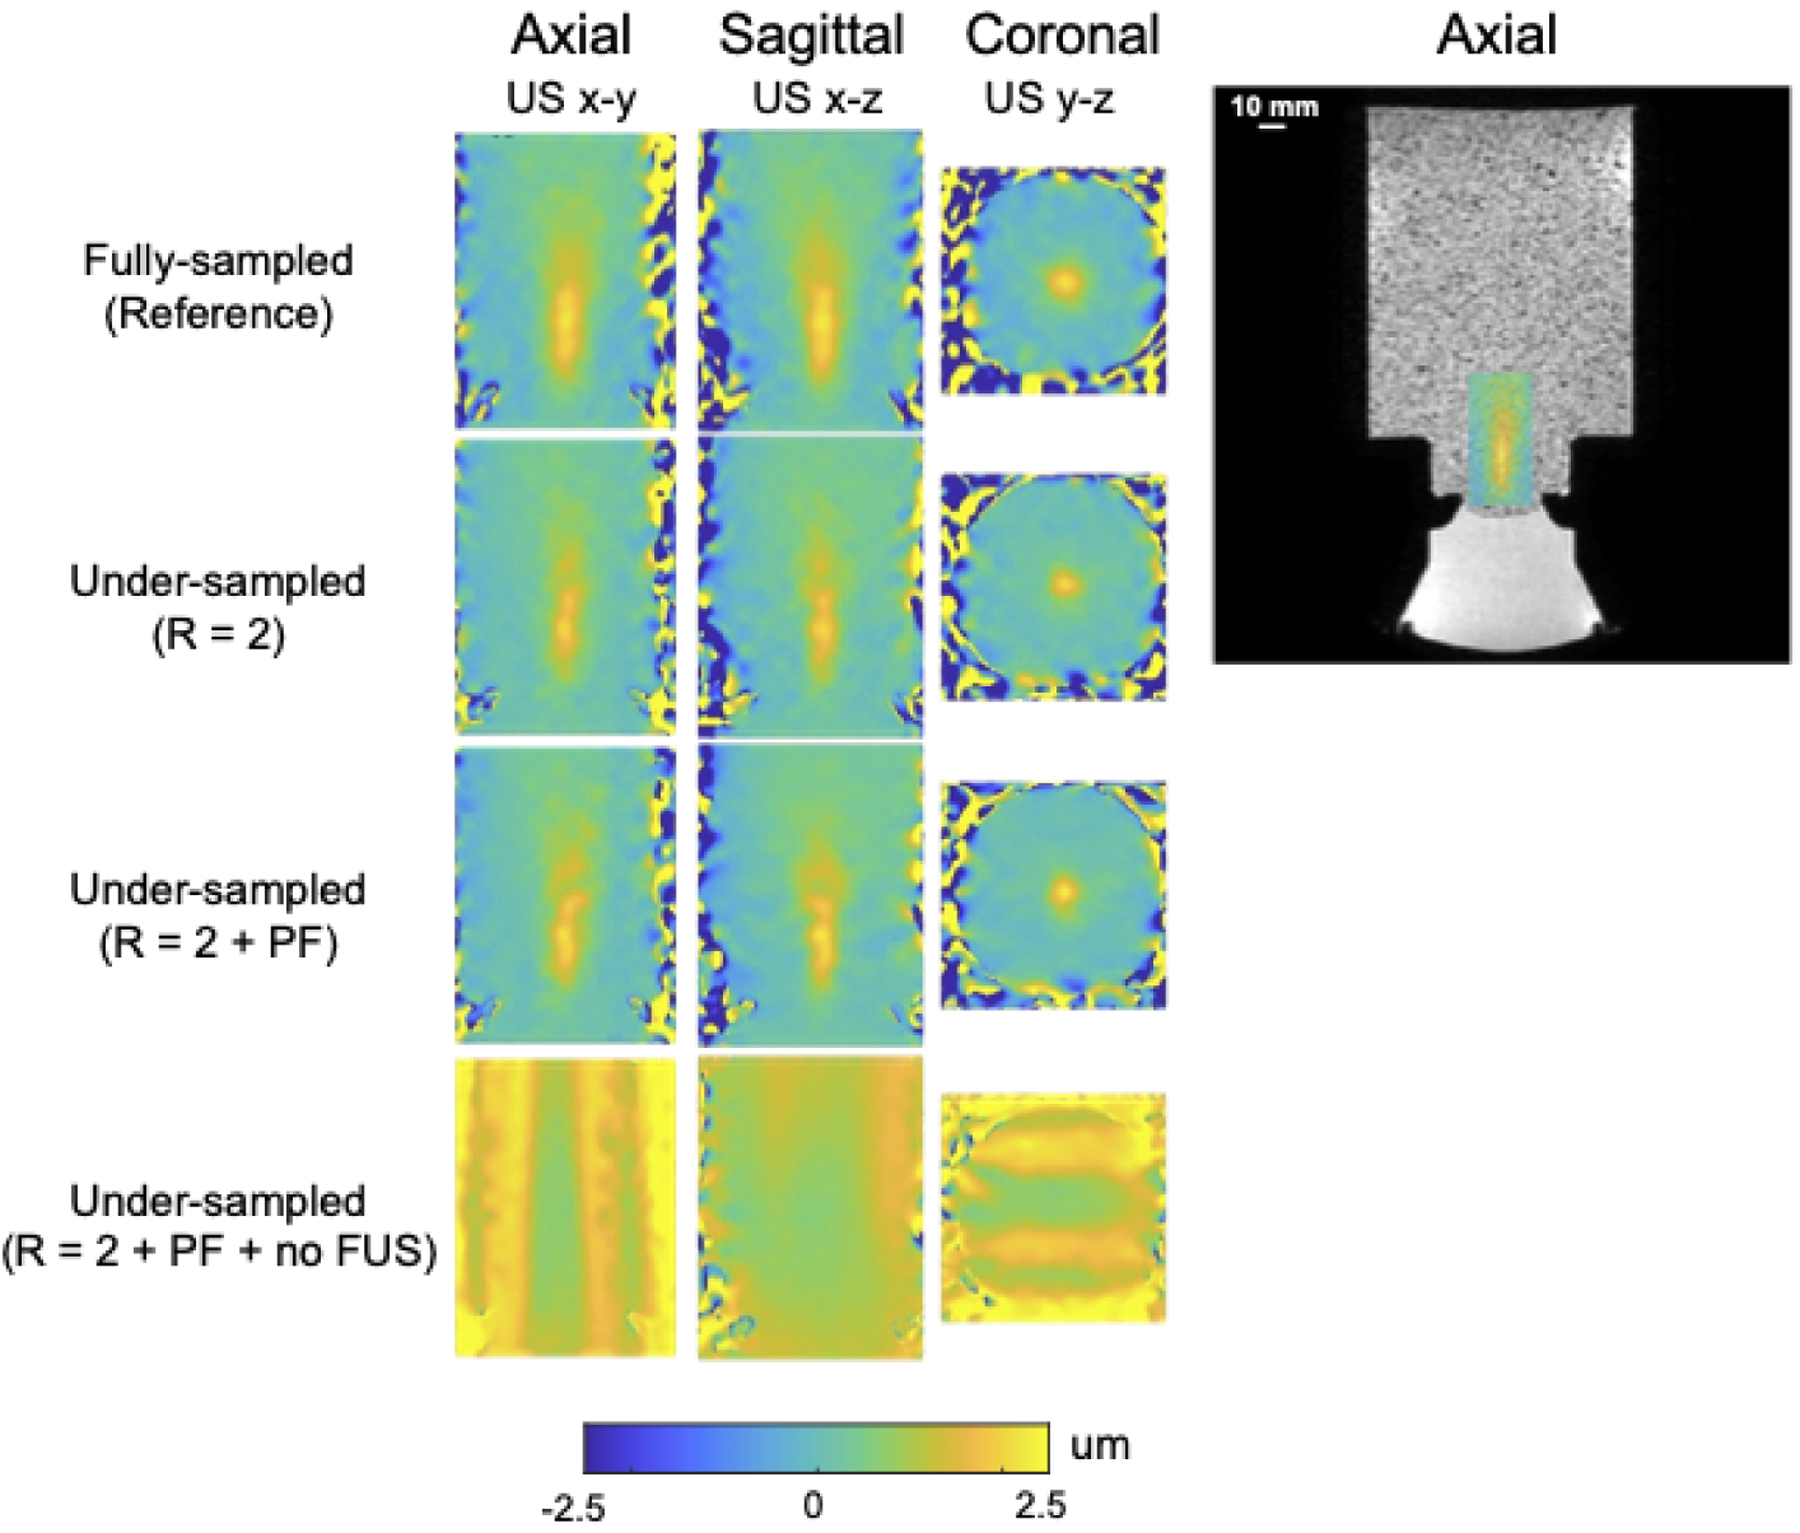
Phantom displacement maps reconstructed from retrospectively undersampled data with different sampling settings (from top to bottom): Fully-sampled, R = 2 only, R = 2 and PF = 0.67, R = 2 and PF = 0.67 but without joint reconstruction of the FUS-OFF images. The subfigure on the right shows the position of the displacement maps shown on the left in the larger phantom, overlaid on a full-FOV axial image.
Over the ten repeated prospectively undersampled phantom scans the mean displacement was 1.70 ± 0.15 μm, the peak displacement was 2.36 ± 0.22 μm, the Euclidean distances to the centroid of the averaged fully-sampled reference were 0.55 ± 0.27 mm, and the FWHMs in each direction were 18.70 ± 0.66 mm (US-x), 6.49 ± 0.54 mm (US-y), and 7.20 ± 0.42 mm (US-z), respectively. The reference metrics from the ten averaged fully-sampled datasets were 1.75 μm (displacement mean), 2.14 μm (peak displacement), and 19.43/7.53/7.41 mm (FWHMs in the US-x/US-y/Us-z directions). The image SNR was 77.1, the background standard deviation of displacement maps was 0.005 μm, and the displacement SNR was 260.7.
Figure 6 shows reconstructed displacement maps in the slices with maximum displacement in the macaque brain in the neuromodulation experiment. The displayed images with FOV 54×48×48 mm3 are cropped in the fully sampled frequency encoding dimension (the axial FUS dimension). The axial slice shown on the right illustrates the location of the focus and sub-images on a full-FOV reference image. The second row shows a reconstruction from retrospective undersampling of the fully sampled dataset and the third row shows a reconstruction from a prospectively undersampled scan. These displacement maps illustrate the differences between the fully-sampled and undersampled scan that arise from the undersampling and reconstruction alone, versus the differences that arise from inter-scan variation. Table 1a reports mean (mean ± std) and peak displacements in an ROI of size 6×6×6 mm3 centered on the peak displacement, the FWHMs of the foci in each dimension and the distance between displacement centroids of undersampled reconstructions and the fully sampled reference, as well as image SNR, displacement SNR and background displacement standard deviation.
Figure 6.
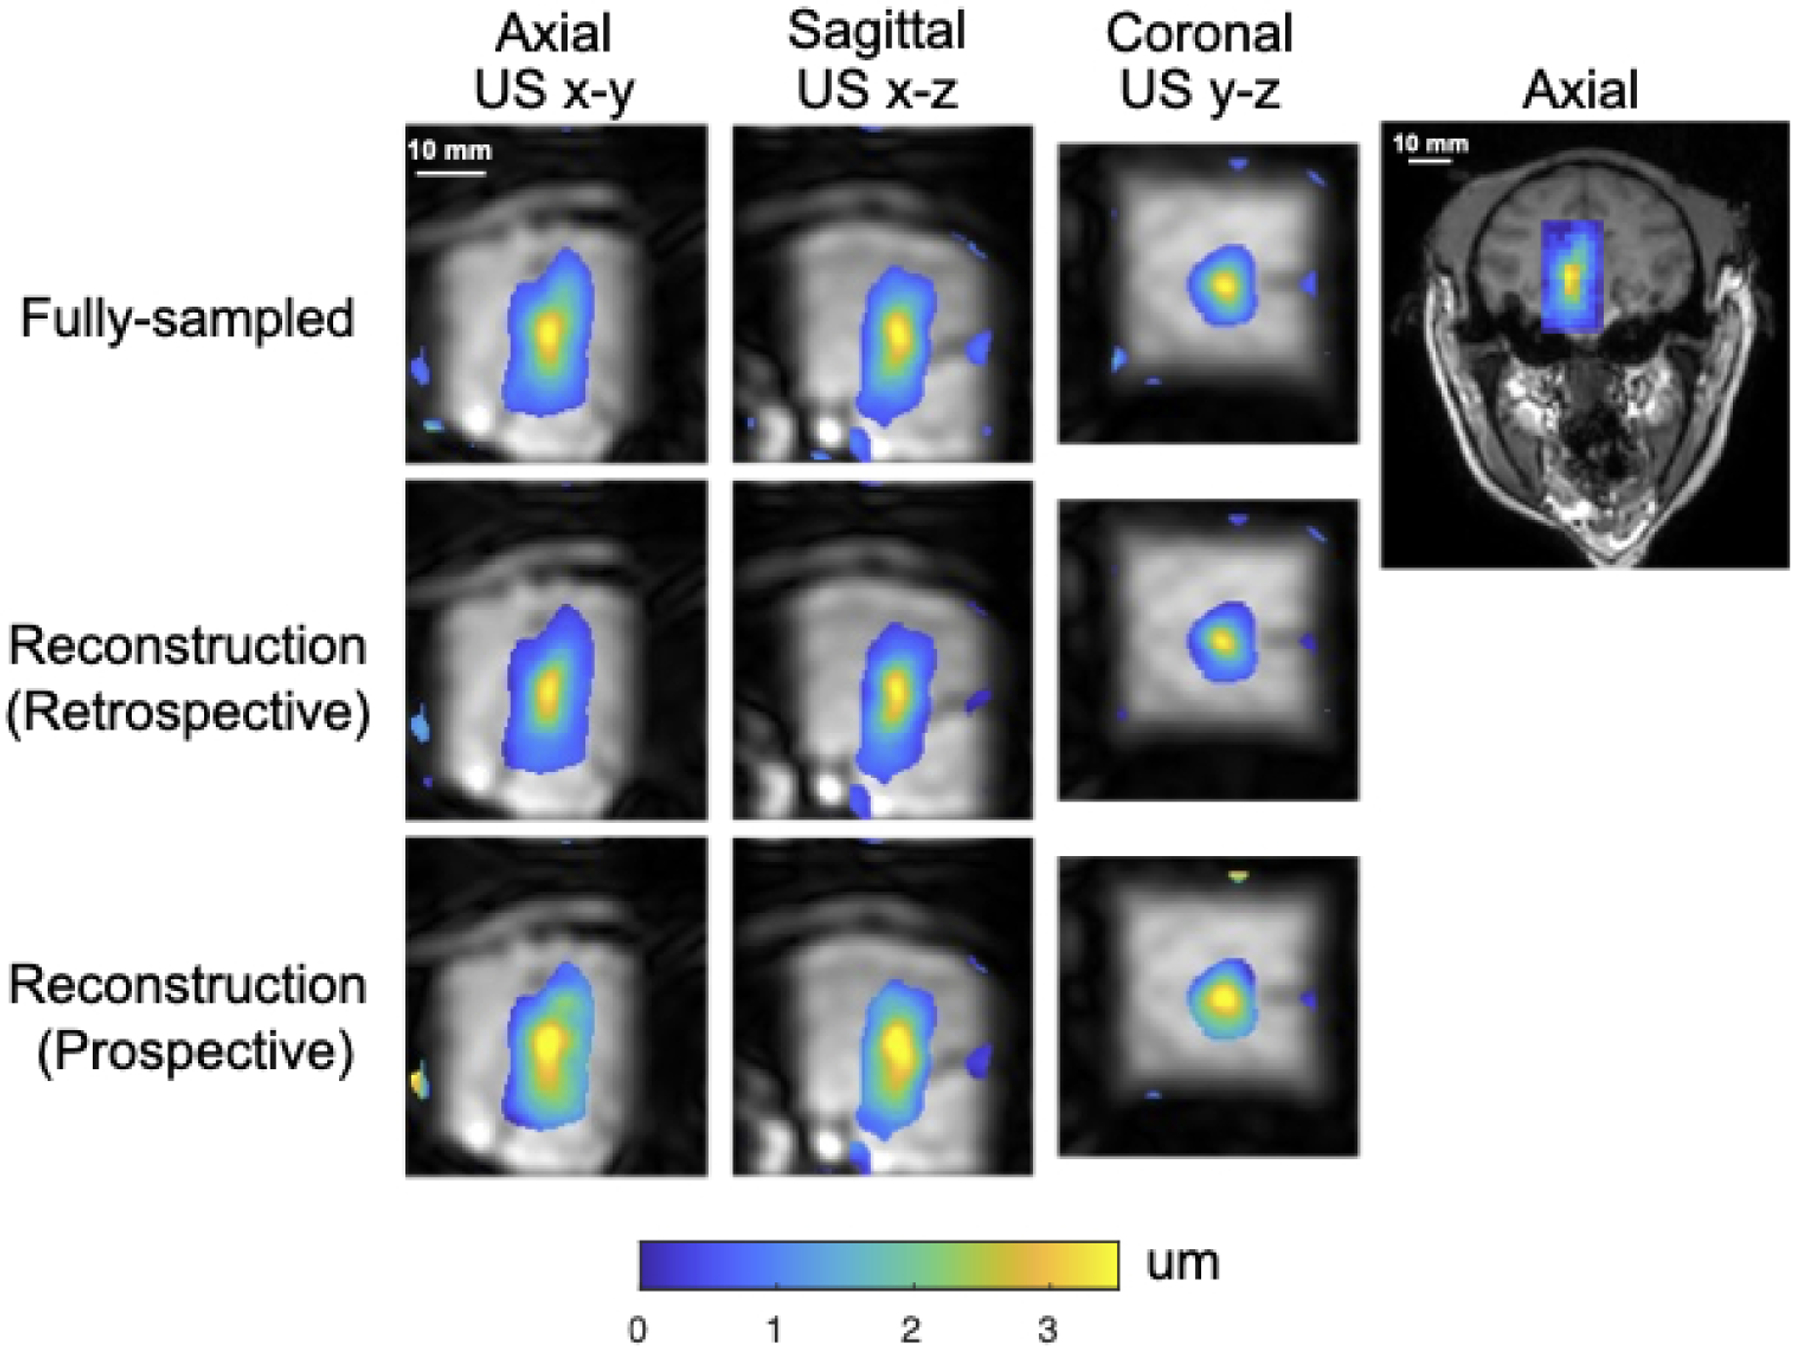
Macaque displacement maps overlaid on reconstructed magnitude images with a midbrain focus for neuromodulation.
The right figure shows the position of the zoomed-in displacement maps on the left in the axial plane (US x-y) of the whole brain.
Table 1:
Mean and peak displacement in an ROI of size 6 × 6 × 6 mm3, Euclidean distances to the centroid of the averaged fully-sampled reference, FWHMs in three dimensions of the two in vivo scans, Centroid distance to the reference, image SNR, displacement SNR and background displacement standard deviation.
(a) Measured displacements in neuromodulation experiments
| Fully-sampled | Retrospectively undersampled | Prospectively undersampled | |
|---|---|---|---|
| Mean displacement in 6 × 6 × 6 mm3 ROI (μm) | 2.72 ± 0.45 | 3.13 ± 0.44 | 2.52 ± 0.49 |
| Peak Displacement (μm) | 3.66 | 3.53 | 4.06 |
| FWHM in US-x (mm) | 14.00 | 13.07 | 15.19 |
| FWHM in US-y (mm) | 6.10 | 5.93 | 6.76 |
| FWHM in US-z (mm) | 7.33 | 6.73 | 7.85 |
| Centroid Distance (mm) | 0.42 | 0.85 | |
| Image SNR | 216.30 | 246.42 | 246.44 |
| Displacement SNR | 41.68 | 54.95 | 65.10 |
| Displacement standard deviation (μm) | 0.06 | 0.05 | 0.05 |
Figure 7 shows the same reconstructed displacement maps with a FOV of 50×48×48 mm3 in the slices with maximum displacement in the macaque brain in the BBBO experiment. The axial slice shown on the right illustrates the location of the focus and sub-images on a full-FOV reference image. Table 1b reports mean (mean ± std) and peak displacements in an ROI of size 6 × 6 × 6 mm3 centered on the peak displacement, the FWHMs of the foci in each dimension and the distance between displacement centroids of undersampled reconstructions and the fully sampled reference, as well as image SNR, displacement SNR and background displacement standard deviation. Figure 8 shows the gadolinium-based percentage signal change (%) at region of blood-brain barrier disruption ranging from 5% to 35%, overlaid on an axial T1-weighted image. The contour of the focus in Figure 7 is marked by the blue contour. An additional BBBO case without corresponding contrast-enhanced imaging is shown in Supporting Information Figure S.1.
Figure 7.
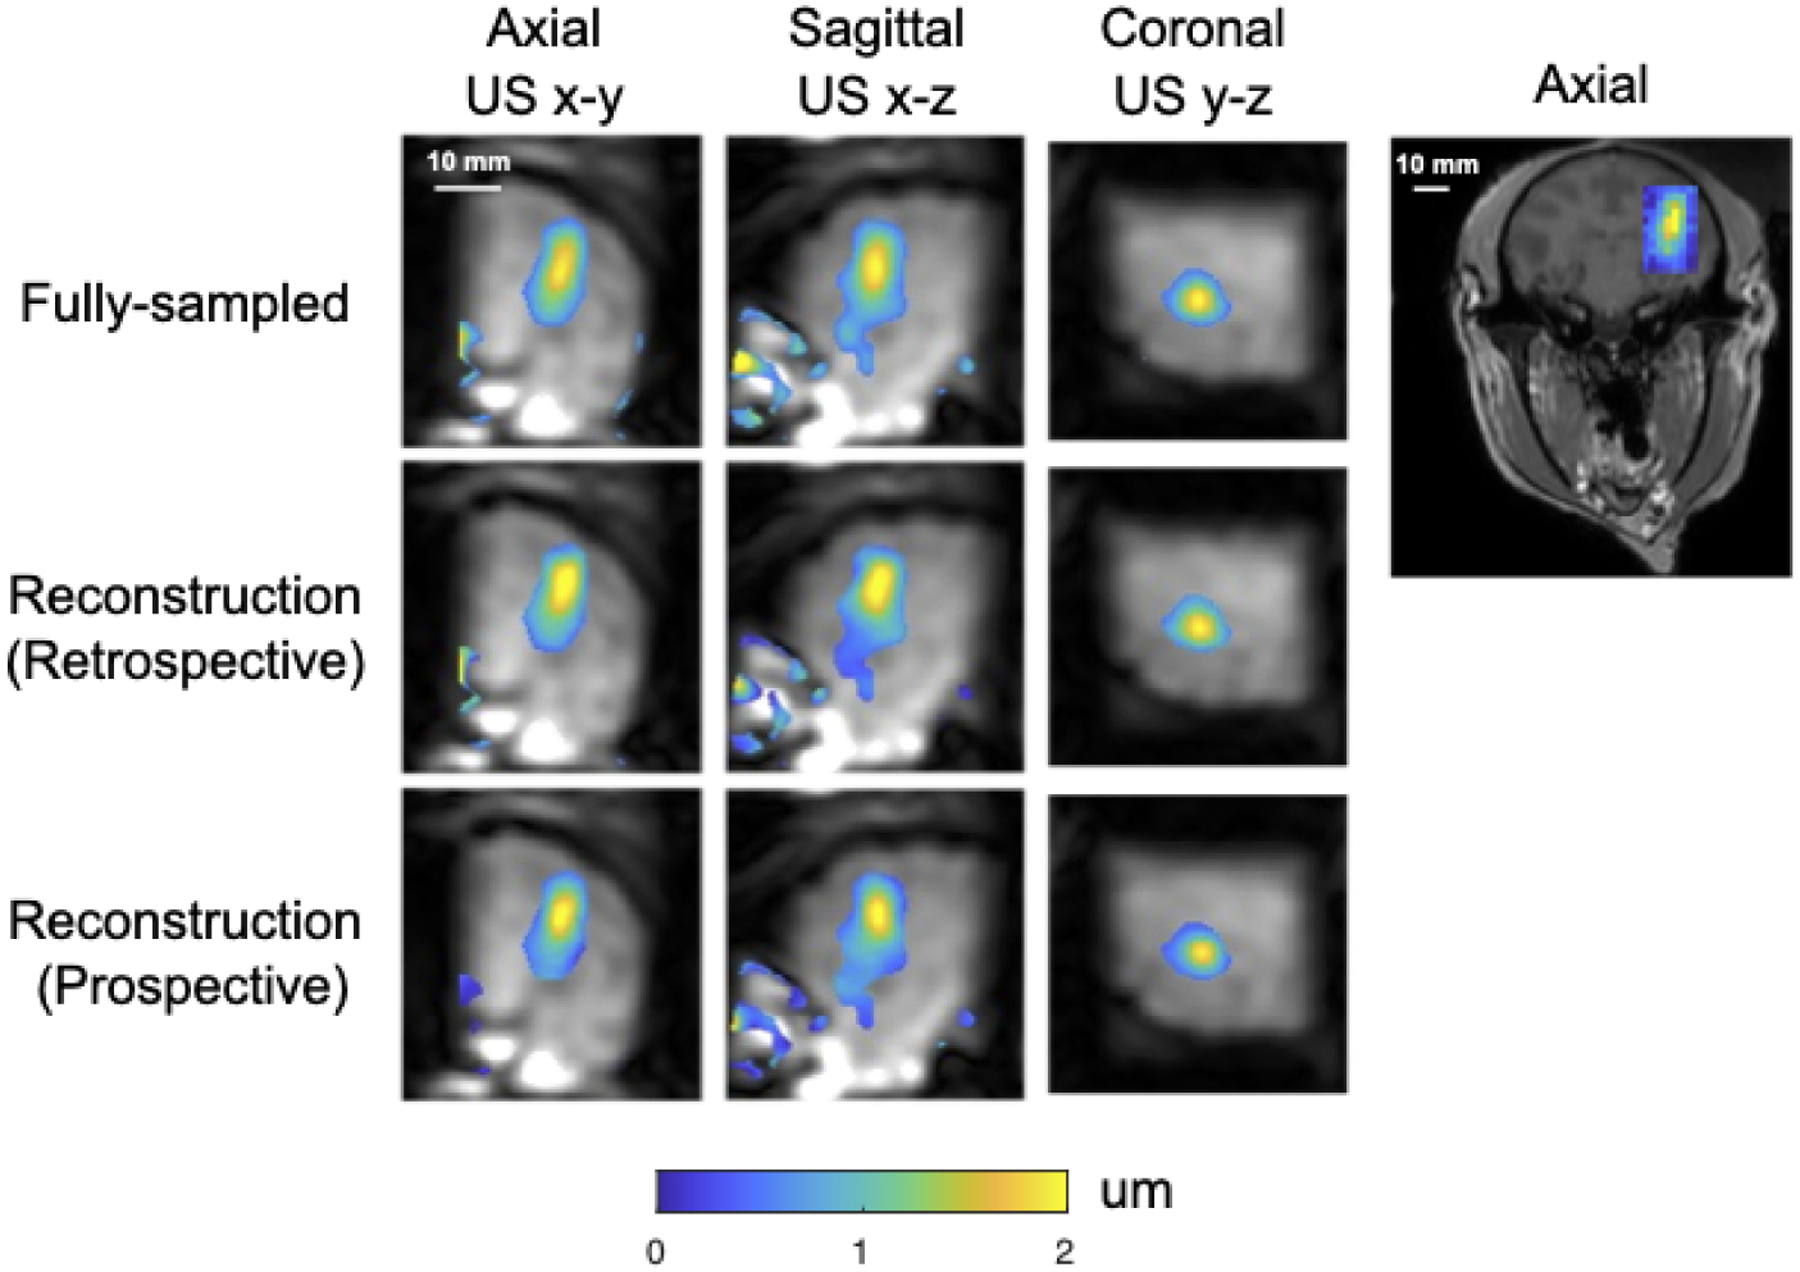
Macaque displacement maps overlaid on reconstructed magnitude images with a focus positioned in cortical grey matter for blood-brain barrier opening.
The right figure shows the position of the zoomed-in displacement maps on the left in the axial plane (US x-y) of whole brain.
Table 1:
Mean and peak displacement in an ROI of size 6 × 6 × 6 mm3, Euclidean distances to the centroid of the averaged fully-sampled reference, FWHMs in three dimensions of the two in vivo scans, Centroid distance to the reference, image SNR, displacement SNR and background displacement standard deviation.
(b) Measured displacements in blood brain barrier opening experiments
| Fully-sampled | Retrospectively undersampled | Prospectively undersampled | |
|---|---|---|---|
| Mean displacement in 6 × 6 × 6 mm3 ROI (μm) | 1.51 ± 0.31 | 1.56 ± 0.24 | 1.46 ± 0.48 |
| Peak Displacement (μm) | 2.06 | 2.21 | 2.18 |
| FWHM in US-x (mm) | 11.30 | 10.65 | 10.78 |
| FWHM in US-y (mm) | 5.52 | 5.26 | 5.60 |
| FWHM in US-z (mm) | 5.99 | 6.09 | 5.84 |
| Centroid Distance (mm) | 0.81 | 0.73 | |
| Image SNR | 133.22 | 116.79 | 131.90 |
| Displacement SNR | 38.56 | 32.88 | 36.67 |
| Displacement standard deviation (μm) | 0.04 | 0.05 | 0.04 |
Figure 8.
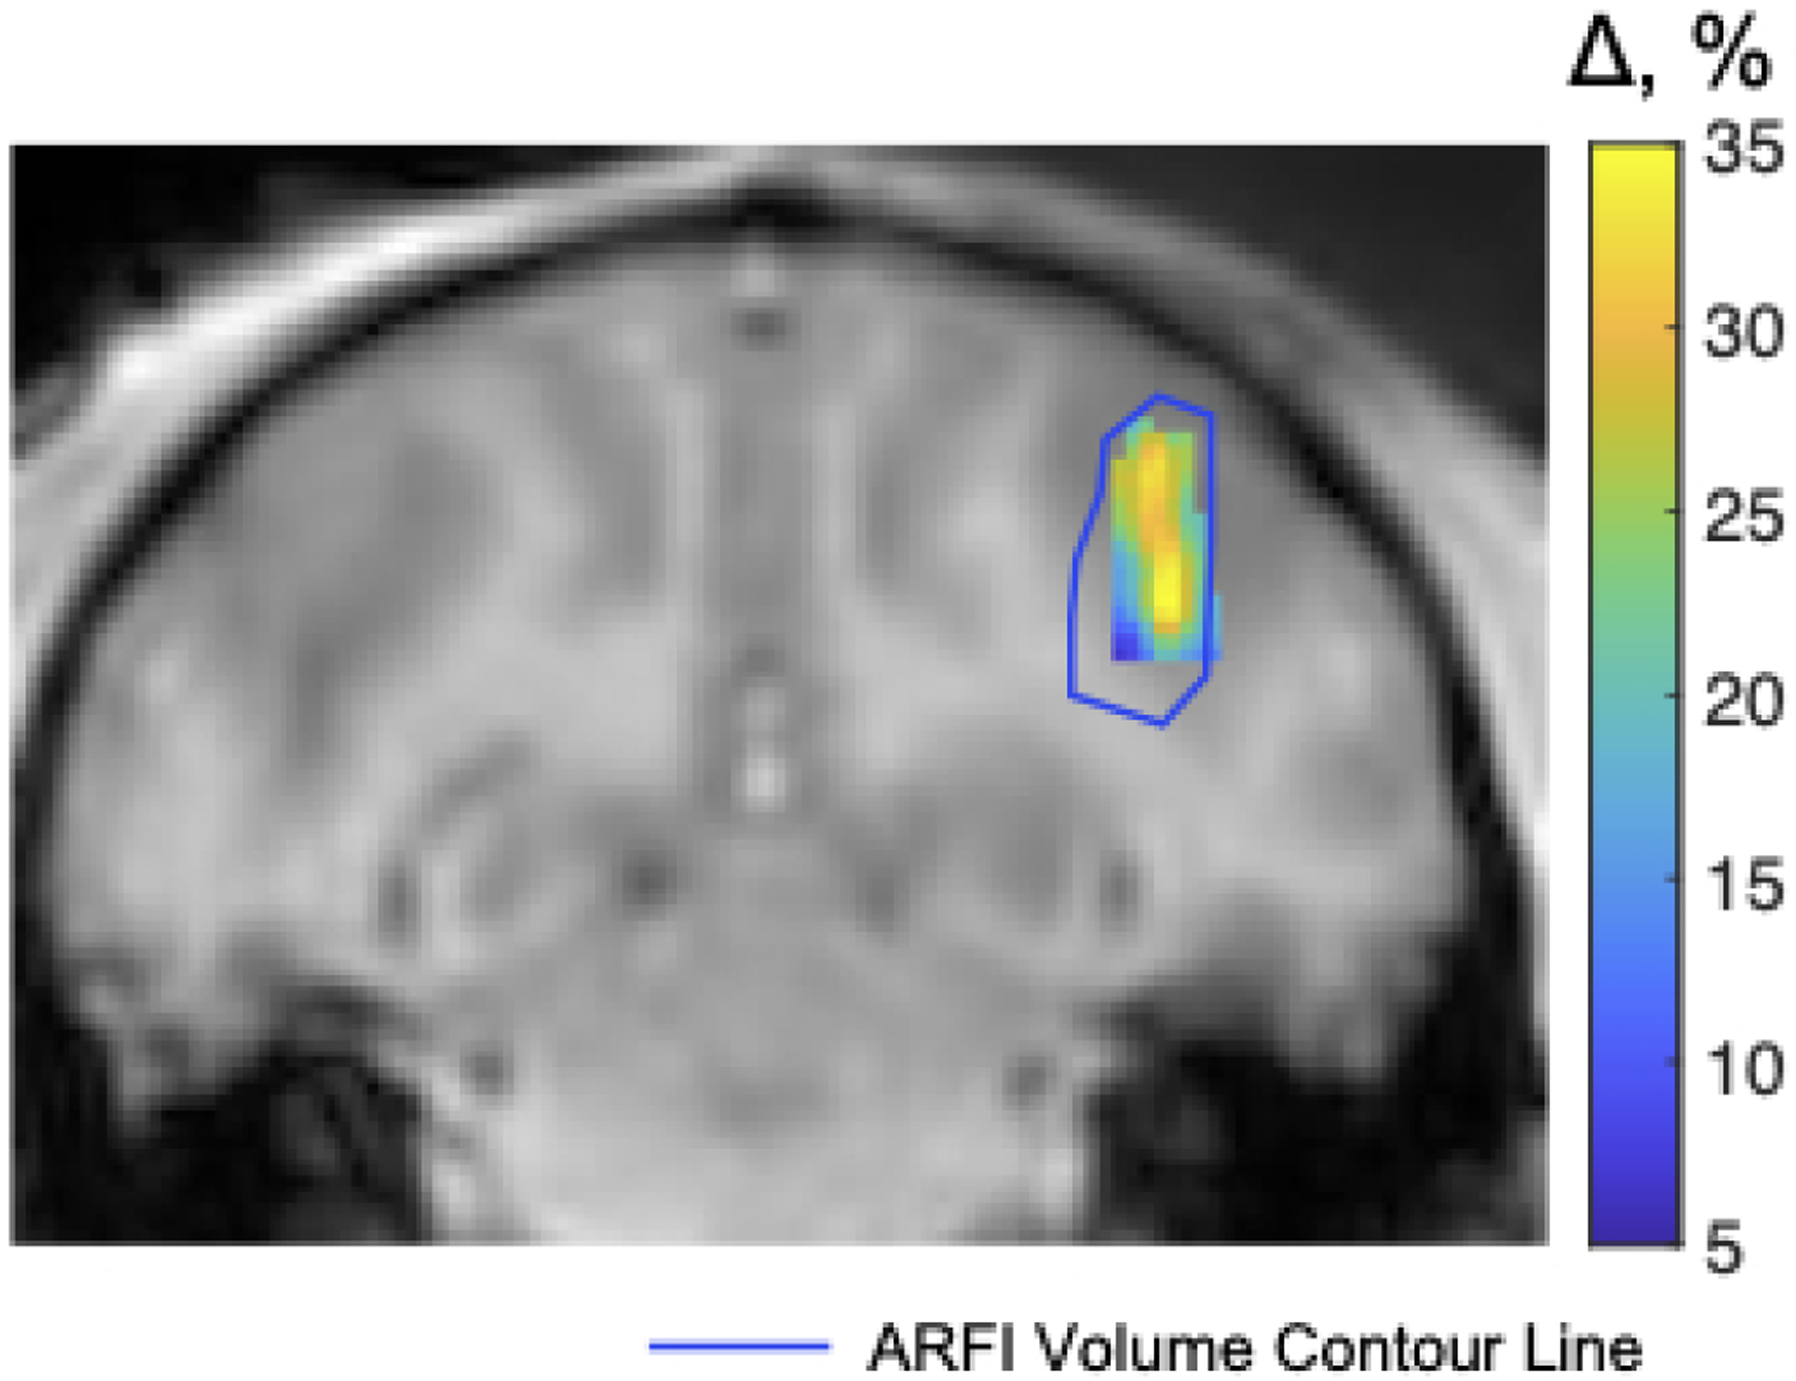
Gadolinium-based signal changes at the region of blood-brain barrier disruption overlaid on a T1-weighted image. The blue contour line indicates the 0.5-μm isocontour of the focus shown in Figure 7.
Discussion
The main goal of this work was to develop an MR-ARFI pulse sequence and image reconstruction that simultaneously minimized scan time and FUS duty cycle, so that the FUS focus can be localized repeatedly in-between targeting adjustments while reducing the effect of FUS on tissue, to compensate focus position errors and distortions caused by the skull and other acoustic inhomogeneities. To this end, a reduced-FOV 3D spin echo MR-ARFI sequence with 2 mm isotropic spatial resolution, a 160×40×40 mm3 FOV, and a 0.85% FUS duty cycle was described and validated in phantom and macaque brain experiments. The scan is ultimately intended for human use, where the long (frequency encoded) axis of the 3D volume should be aligned with the FUS propagation direction, with the nominal focus centered in the volume. The sequence used root-flipping to minimize the duration of the refocusing pulse and reduced TE compared to a conventional linear-phase refocusing pulse. Images were reconstructed using a k-space low-rank reconstruction algorithm that jointly reconstructs undersampled k-spaces for two FUS-ON images with opposite ARFI phase shift polarities, and a third FUS-OFF image. The third FUS-OFF image data were collected ‘for-free’ in-between the FUS-ON segments of the sequence, to maintain a minimal FUS duty cycle. Collecting the FUS-OFF image data improved conditioning of the FUS-ON image reconstruction problem, enabling a shortened scan time with undersampling of the FUS-ON image data. With an overall acceleration factor of 2 × 1 / 0.67 = 3, a scan time of 2 minutes 20 second was achieved. Matching duty cycle, spatial resolution, and EPI factor with the described sequence, and accounting for the fact that existing 3D or 2D multislice-compatible scans would need to encode the entire brain volume in one phase-encoded dimension, the shortest scan time achievable with existing scans [36, 19, 25, 21, 37, 22] is approximately 7 minutes 30 seconds [19].
The phantom results from retrospectively undersampled data described the effects of sampling schemes on the performance of the reconstruction. Those results showed that it is necessary to utilize the spare time to acquire FUS-OFF images as a reference to improve the reconstruction of the FUS-ON images (Figure 5). We found that too large a PF factor can lead to blurring of the focus in the z dimension; at the same time, using an opposite PF sampling pattern in the FUS-OFF acquisition mitigated this blurring. These considerations led to the selection of the PF factor of 0.67 to safely visualize the focus. In vivo macaque imaging results were also shown: one for a focus position determined for a neuromodulation experiment in which the MEGs and imaging volume were well-aligned with the FUS axial dimension, and one in which the MEGs and imaging volume were intentionally misaligned with the FUS axial dimension. In each case the FUS beam was well-localized, and undersampling the k-space data prospectively had minimal effect on the focus characteristics.
There are variations on the proposed sequence that may achieve shorter scan times or improved displacement SNR. For example, we used a low EPI factor of 3 with a small effective echo spacing of 0.0625 ms to minimize distortions due to bulk off-resonance. If off-resonance were not a concern, the EPI factor could be increased and the scan time would shorten in proportion to that increase. Alternatively, if increased SNR were desired the readout bandwidth could be decreased which would also lengthen the EPI echo train. 8 ms MEGs and FUS pulses with a 0.85% duty cycle were used in this work, which produced peak displacement phase shifts of approximately 0.20 radians in the phantom scans and 0.18 to 0.24 radians in the macaque scans. However, there remained considerable ‘dead time’ in the scan (specifically, almost 450 ms of every 500 ms TR) which could be used for additional data collection, at the cost of reduced signal due to reduced longitudinal relaxation between excitations. For example, if the duty cycle could be increased or if the FUS pulses could be driven with higher power and shortened, then additional FUS-ON measurements could be made in the same scan time which could enable reduction in the PF factor or the undersampling (R) factor, without compromising the displacement phase shift. Shorter FUS pulses would also enable a shorter TE in the sequence which would increase SNR further. The reconstruction approach described here would not need to be modified to accommodate these variations. The pressure levels and the very low duty cycle used in this work were informed by Ref. [14] and were selected to minimize heat deposition. However, it remains possible that MR-ARFI could have some neuromodulatory or BBB opening effects which may require further study, and which may further restrict FUS pressure and duty cycle in MR-ARFI. Another variation on the proposed sequence is the choice of whether to alternate the polarity of the MEG’s while keeping the FUS pulse timing the same each TR, or maintaining the polarity of the MEG’s constant while moving the FUS pulse between the two MEG’s. In this work, the latter approach was selected because the lack of gradient polarity switching resulted in more consistent background phase between the FUS-ON+ and FUS-ON− images, but the former approach could also be taken if background phase modulations were small enough or could be accounted for in the image reconstruction model.
Conclusion
The presented 3D rFOV MR-ARFI pulse sequence and the low-rank reconstruction method enable efficient acquisition of a volumetric view of the tissue displacement produced by a focused ultrasound beam with a low FUS duty cycle. In this work, a scan time of two minutes twenty seconds was achieved with 2 mm isotropic resolution over a 160×40×40 mm3 volume, with 0.85% FUS duty cycle. This could enhance the procedure of targeting the FUS focus, especially when it needs to be repeated many times when finding, steering, or phase-correcting the focus.
Supplementary Material
Acknowledgements
The authors would like to thank Abitha Srinivas for help with the phantom holder.
This work was supported by NIH grant U18 EB 029351 (HEAL) and 1S10OD021771-01.
Data Availability Statement:
The code that implements the simulations in this study is openly available at https://github.com/grissomlab/LowRankReconstruction_rFOV_3D_MR_ARFI.
References
- [1].Lozinski T, Filipowska J, Pyka M, Baczkowska M, Ciebiera M. Magnetic resonance-guided high-intensity ultrasound (MR-HIFU) in the treatment of symptomatic uterine fibroidsFive-year experience. Ginekologia polska 2022; 93:185–194. [DOI] [PubMed] [Google Scholar]
- [2].Sridhar D, Kohi MP. Updates on MR-guided focused ultrasound for symptomatic uterine fibroids. Seminars in interventional radiology 2018; 35:017–022. [DOI] [PMC free article] [PubMed] [Google Scholar]
- [3].Catane R, Beck A, Inbar Y, Rabin T, Shabshin N, Hengst S, Pfeffer R, Hanannel A, Dogadkin O, Liberman B et al. MR-guided focused ultrasound surgery (MRgFUS) for the palliation of pain in patients with bone metastasespreliminary clinical experience. Annals of Oncology 2007; 18:163–167. [DOI] [PubMed] [Google Scholar]
- [4].Elias WJ, Huss D, Voss T, Loomba J, Khaled M, Zadicario E, Frysinger RC, Sperling SA, Wylie S, Monteith SJ et al. A pilot study of focused ultrasound thalamotomy for essential tremor. New England Journal of Medicine 2013; 369:640–648. [DOI] [PubMed] [Google Scholar]
- [5].Stavarache MA, Chazen JL, Kaplitt MG. Innovative Applications of MR-Guided Focused Ultrasound for Neurological Disorders. World Neurosurgery 2021; 145:581–589. [DOI] [PubMed] [Google Scholar]
- [6].Kobus T, McDannold N. Update on Clinical Magnetic Resonance–Guided Focused Ultrasound Applications. Magnetic Resonance Imaging Clinics 2015; 23:657–667. [DOI] [PMC free article] [PubMed] [Google Scholar]
- [7].Li Y, Lee J, Long X, Qiao Y, Ma T, He Q, Cao P, Zhang X, Zheng H. A Magnetic Resonance-guided Focused Ultrasound Neuromodulation System with a Whole Brain Coil Array for Nonhuman Primates at 3 T. IEEE Transactions on Medical Imaging 2020; 39:4401–4412. [DOI] [PubMed] [Google Scholar]
- [8].Darrow DP. Focused ultrasound for neuromodulation. Neurotherapeutics 2019; 16:88–99. [DOI] [PMC free article] [PubMed] [Google Scholar]
- [9].Abrahao A, Meng Y, Llinas M, Huang Y, Hamani C, Mainprize T, Aubert I, Heyn C, Black SE, Hynynen K et al. First-in-human trial of blood–brain barrier opening in amyotrophic lateral sclerosis using MR-guided focused ultrasound. Nature communications 2019; 10:1–9. [DOI] [PMC free article] [PubMed] [Google Scholar]
- [10].Sarvazyan AP, Rudenko OV, Swanson SD, Fowlkes JB, Emelianov SY. Shear wave elasticity imaging: a new ultrasonic technology of medical diagnostics. Ultrasound in medicine & biology 1998; 24:1419–1435. [DOI] [PubMed] [Google Scholar]
- [11].McDannold N, Maier SE. Magnetic resonance acoustic radiation force imaging. Medical physics 2008; 35:3748–3758. [DOI] [PMC free article] [PubMed] [Google Scholar]
- [12].Pauly KB. Magnetic resonance acoustic radiation force (impulse) imaging (MR-ARFI). Journal of Therapeutic Ultrasound 2015; 3:1–1.25635224 [Google Scholar]
- [13].Gaur P, Casey KM, Kubanek J, Li N, Mohammadjavadi M, Saenz Y, Glover GH, Bouley DM, Pauly KB. Histologic safety of transcranial focused ultrasound neuromodulation and magnetic resonance acoustic radiation force imaging in rhesus macaques and sheep. Brain stimulation 2020; 13:804–814. [DOI] [PMC free article] [PubMed] [Google Scholar]
- [14].Phipps MA, Jonathan SV, Yang PF, Chaplin V, Chen LM, Grissom WA, Caskey CF. Considerations for ultrasound exposure during transcranial MR acoustic radiation force imaging. Scientific reports 2019; 9:1–11. [DOI] [PMC free article] [PubMed] [Google Scholar]
- [15].Ozenne V, Constans C, Bour P, Santin MD, Valabrégue R, Ahnine H, Pouget P, Lehéricy S, Aubry JF, Quesson B. Mri monitoring of temperature and displacement for transcranial focus ultrasound applications. Neuroimage 2020; 204:116236. [DOI] [PubMed] [Google Scholar]
- [16].Wang H, Wang B, Normoyle KP, Jackson K, Spitler K, Sharrock MF, Miller CM, Best C, Llano D, Du R. Brain temperature and its fundamental properties: a review for clinical neuroscientists. Frontiers in neuroscience 2014; 8:307. [DOI] [PMC free article] [PubMed] [Google Scholar]
- [17].Bour P, Marquet F, Ozenne V, Toupin S, Dumont E, Aubry JF, LepetitCoiffe M, Quesson B. Real-time monitoring of tissue displacement and temperature changes during MR-guided high intensity focused ultrasound. Magnetic resonance in medicine 2017; 78:1911–1921. [DOI] [PubMed] [Google Scholar]
- [18].de Bever JT, Odéen H, Hofstetter LW, Parker DL. Simultaneous MR thermometry and acoustic radiation force imaging using interleaved acquisition. Magnetic resonance in medicine 2018; 79:1515–1524. [DOI] [PMC free article] [PubMed] [Google Scholar]
- [19].Mougenot C, Waspe A, Looi T, Drake JM. Variable ultrasound trigger delay for improved magnetic resonance acoustic radiation force imaging. Physics in Medicine & Biology 2015; 61:712. [DOI] [PubMed] [Google Scholar]
- [20].Auboiroux V, Viallon M, Roland J, Hyacinthe JN, Petrusca L, Morel DR, Goget T, Terraz S, Gross P, Becker CD et al. ARFI-prepared MRgHIFU in liver: simultaneous mapping of ARFI-displacement and temperature elevation, using a fast GRE-EPI sequence. Magnetic resonance in medicine 2012; 68:932–946. [DOI] [PubMed] [Google Scholar]
- [21].Kaye EA, Chen J, Pauly KB. Rapid MR-ARFI method for focal spot localization during focused ultrasound therapy. Magnetic resonance in medicine 2011; 65:738–743. [DOI] [PMC free article] [PubMed] [Google Scholar]
- [22].Holbrook AB, Ghanouni P, Santos JM, Medan Y, ButtsPauly K. In vivo MR acoustic radiation force imaging in the porcine liver. Medical physics 2011; 38:5081–5089. [DOI] [PMC free article] [PubMed] [Google Scholar]
- [23].Odéen H, de Bever J, Hofstetter LW, Parker DL. Multiple-point magnetic resonance acoustic radiation force imaging. Magnetic resonance in medicine 2019; 81:1104–1117. [DOI] [PMC free article] [PubMed] [Google Scholar]
- [24].Paquin R, Vignaud A, Marsac L, Younan Y, Lehéricy S, Tanter M, Aubry JF. Keyhole acceleration for magnetic resonance acoustic radiation force imaging (MR ARFI). Magnetic resonance imaging 2013; 31:1695–1703. [DOI] [PubMed] [Google Scholar]
- [25].de Bever JT, Odéen H, Todd N, Farrer AI, Parker DL. Evaluation of a three-dimensional MR acoustic radiation force imaging pulse sequence using a novel unbalanced bipolar motion encoding gradient. Magnetic resonance in medicine 2016; 76:803–813. [DOI] [PMC free article] [PubMed] [Google Scholar]
- [26].Deshmane A, Gulani V, Griswold MA, Seiberlich N. Parallel MR imaging. Journal of Magnetic Resonance Imaging 2012; 36:55–72. [DOI] [PMC free article] [PubMed] [Google Scholar]
- [27].Pauly J, LeRoux P, Nishimura D, Macovski A. Parameter relations for the Shinnar-Le Roux selective excitation pulse design algorithm (NMR imaging). IEEE transactions on medical imaging 1991; 10:53–65. [DOI] [PubMed] [Google Scholar]
- [28].Sharma A, Lustig M, Grissom WA. Root-flipped multiband refocusing pulses. Magnetic resonance in medicine 2016; 75:227–237. [DOI] [PMC free article] [PubMed] [Google Scholar]
- [29].Haldar JP. Low-rank modeling of local k-space neighborhoods (LORAKS) for constrained MRI. IEEE transactions on medical imaging 2013; 33:668–681. [DOI] [PMC free article] [PubMed] [Google Scholar]
- [30].Jin KH, Lee D, Ye JC. A general framework for compressed sensing and parallel MRI using annihilating filter based low-rank Hankel matrix. IEEE Transactions on Computational Imaging 2016; 2:480–495. [Google Scholar]
- [31].Blaimer M, Gutberlet M, Kellman P, Breuer FA, Köstler H, Griswold MA. Virtual coil concept for improved parallel MRI employing conjugate symmetric signals. Magnetic Resonance in Medicine: An Official Journal of the International Society for Magnetic Resonance in Medicine 2009; 61:93–102. [DOI] [PubMed] [Google Scholar]
- [32].Zhang T, Pauly JM, Vasanawala SS, Lustig M. Coil compression for accelerated imaging with Cartesian sampling. Magnetic resonance in medicine 2013; 69:571–582. [DOI] [PMC free article] [PubMed] [Google Scholar]
- [33].Madsen EL, Zagzebski JA, Banjavie RA, Jutila RE. Tissue mimicking materials for ultrasound phantoms. Medical physics 1978; 5:391–394. [DOI] [PubMed] [Google Scholar]
- [34].Chaplin V, Phipps MA, Caskey CF. A random phased-array for MR-guided transcranial ultrasound neuromodulation in Non-human Primates. Physics in Medicine & Biology 2018; 63:105016. [DOI] [PMC free article] [PubMed] [Google Scholar]
- [35].Treeby BE, Cox BT. k-Wave: MATLAB toolbox for the simulation and reconstruction of photoacoustic wave fields. Journal of biomedical optics 2010; 15:021314. [DOI] [PubMed] [Google Scholar]
- [36].Chen J, Watkins R, Pauly KB. Optimization of encoding gradients for MR-ARFI. Magnetic Resonance in Medicine: An Official Journal of the International Society for Magnetic Resonance in Medicine 2010; 63:1050–1058. [DOI] [PMC free article] [PubMed] [Google Scholar]
- [37].Kaye EA, Pauly KB. Adapting MRI acoustic radiation force imaging for in vivo human brain focused ultrasound applications. Magnetic resonance in medicine 2013; 69:724–733. [DOI] [PMC free article] [PubMed] [Google Scholar]
Associated Data
This section collects any data citations, data availability statements, or supplementary materials included in this article.
Supplementary Materials
Data Availability Statement
The code that implements the simulations in this study is openly available at https://github.com/grissomlab/LowRankReconstruction_rFOV_3D_MR_ARFI.


