

Abstract
Vitrification is a promising cryopreservation technique for complex specimens such as tissues and organs. However, it is challenging to identify mixtures of cryoprotectants (CPAs) that prevent ice formation without exerting excessive toxicity. In this work, we developed a multi-CPA toxicity model that predicts the toxicity kinetics of mixtures containing five of the most common CPAs used in the field (glycerol, dimethyl sulfoxide (DMSO), propylene glycol, ethylene glycol, and formamide). The model accounts for specific toxicity, non-specific toxicity, and interactions between CPAs. The proposed model shows reasonable agreement with training data for single and binary CPA solutions, as well as ternary CPA solution validation data. Sloppy model analysis was used to examine the model parameters that were most important for predictions, providing clues about mechanisms of toxicity. This analysis revealed that the model terms for non-specific toxicity were particularly important, especially the non-specific toxicity of propylene glycol, as well as model terms for specific toxicity of formamide and interactions between formamide and glycerol. To demonstrate the potential for model-based design of vitrification methods, we paired the multi-CPA toxicity model with a published vitrification/devitrification model to identify vitrifiable CPA mixtures that are predicted to have minimal toxicity. The resulting optimized vitrification solution composition was a mixture of 7.4 molal glycerol, 1.4 molal DMSO, and 2.4 molal formamide. This demonstrates the potential for mathematical optimization of vitrification solution composition and sets the stage for future studies to optimize the complete vitrification process, including CPA mixture composition and CPA addition and removal methods.
Keywords: Cryoprotectants, Vitrification, Cryopreservation, Toxicity, Sloppy Models, Optimization
1. INTRODUCTION
Cryopreservation has had a significant impact in many different fields, including animal and human assisted reproduction [23,30,31] by enabling storage of gametes and embryos, and general scientific research by enabling banking of thousands of cell types [2,10,28]. While complex specimens such as tissues and organs are more challenging to cryopreserve [16,19], successful cryopreservation of these specimens would also have a tremendous impact by making tissue and organ banks a reality [16,21,27].
For complex specimens like tissues and organs, vitrification methods have been shown to hold particular promise [20,25,29,35], as the damage associated with extracellular ice formation is eliminated. However, the elimination of extracellular ice requires high concentrations of cryoprotectants (CPAs), which can cause chemical toxicity [9,13,14,19,26]. Thus, a key challenge in the design of vitrification methods is identifying minimally toxic CPA mixtures and methods for adding and removing these mixtures [1,17,19,24].
There are many variables that influence toxicity, including: CPA mixture type, CPA concentration, temperature, and exposure time. Given the many combinations of these variables, and the fact that CPA mixture type is essentially unbounded in regard to possibilities (i.e., any chemical(s) or combinations thereof could be a CPA mixture type), the potential protocol landscape where these variables are manipulated is incredibly vast. It is not feasible to test all potential combinations experimentally. Thus, there is a need for a mathematical model of toxicity that would enable in silico exploration of the protocol landscape. While there have been some previous efforts to develop toxicity models [1,13,17,24,26], a comprehensive toxicity model that can account for all of the previously mentioned variables is not yet available, and most attempts in the field to minimize toxicity can be classified as an empirically driven trial and error approach.
The molecular mechanisms of CPA toxicity are not very well understood, but may be related to destabilization of cell membranes, protein denaturation, oxidative damage, disruption of mitochondrial function or other factors [5,11]. CPA toxicity can be specific or non-specific [17]. Specific toxicity refers to direct effects of a CPA by a mechanism specific to that CPA. All CPAs are thought to exert toxicity non-specifically, due to their overall effects on solution properties that alter the hydrogen bonding around proteins and other biomolecules.
The objective of this work was to develop a mathematical model for the toxicity of CPA mixtures that could be used for the design of less toxic vitrification methods. As a foundation for this model, we used the large CPA toxicity data set that we recently generated using high throughput experiments on cultured bovine pulmonary artery endothelial cells [38]. Specifically, we propose a comprehensive toxicity model that spans five of the most common CPAs used in the field and any combination thereof. The model breaks the toxicity rate into two main contributions that have been discussed within cryobiology—specific and non-specific toxicity [1,17]. Furthermore, we hypothesized that intermolecular interactions resulting in CPA complex formation could modulate both the specific and non-specific toxicity contributions. The resulting model describes a wide range of CPA mixtures, offering clues about mechanisms of CPA toxicity and opening new possibilities for design of less toxic vitrification methods.
2. MODEL FORMALISM
2.1. General Overview
In our previous work [38], we measured the viability of adherent bovine pulmonary artery endothelial cells after exposure to various CPA solutions comprised of five of the most common CPAs (glycerol, DMSO, propylene glycol, ethylene glycol, and formamide). In that work, we leveraged the power of automated liquid handling to increase the speed, robustness, and accuracy of our experiments, enabling the creation of a large CPA toxicity data repository. This data set includes 81 estimates of the toxicity rate for CPA solutions containing one, two, or three CPAs at concentrations ranging from 1 to 10 molal. To determine each toxicity rate, we used four different CPA exposure times, each with 5-6 replicates, resulting in more than 1500 cell viability data points. To complete these experiments required over 12,000 pipetting steps, highlighting the importance of automating the liquid handling process. In this study, we use this large data set to drive the development of novel mathematical models of CPA toxicity.
To quantify toxicity in our previous work, we used a first-order kinetic model to describe the decrease in the number of viable cells N over time t [3,8,9,12,26,38]:
| 1 |
where k is the CPA toxicity rate. In particular, we estimated the toxicity rate of each CPA mixture type and concentration tested. In this work, we seek to identify a functional form that can predict the toxicity rate as a function of CPA mixture type and concentration. We begin by considering models describing specific toxicity and non-specific toxicity on their own, then we examine a more comprehensive model that accounts for specific toxicity, non-specific toxicity, and formation of CPA complexes. The model considers only binary CPA complexes, and we hypothesize that binary interactions dominate compared to higher order interactions. Thus, the model parameters can be determined using CPA mixtures containing up to two CPAs, and the resulting parameters can then be used to predict the toxicity of more complicated mixtures containing more than two CPAs. In this paper, we refer to physiological buffer containing a single CPA as a single CPA solution, and mixtures with two or three CPAs are referred to as binary or ternary mixtures, respectively. We used toxicity data for single CPA solutions and binary CPA mixtures for model training (71 data points), and toxicity data for ternary CPA mixtures for model validation (10 data points).
2.2. Specific Toxicity
We begin by describing the toxicity rate dependence through a power law in the CPA concentration, as we have done in the past for solutions containing a single CPA [3,8,9]:
| 2 |
where M is the CPA molality, ζ and α are constants, and subscript i represents a particular CPA. This form is much like a chemical reaction where ζ can be thought of as the rate constant and α can be thought of as the order of the reaction. As such, for each CPA, we assume that the reaction network leading to cell death is only governed by the CPA concentration and the two parameters ζ and α. For this work, we describe this toxicity as specific toxicity, in that each CPA leads to cell death through its own independent mechanism.
We applied Equation 2 to the five single CPAs that were tested in our previous study [38], resulting in the fits shown in Figure 1. To fit the parameters of Equation 2, we performed nonlinear regression in MATLAB (R2020b; The MathWorks, Natick, MA) using the “fitnlm” function.
Figure 1.

The toxicity rates of the five single CPAs tested from our previous work [38], with the error bars representing the 95% confidence intervals of the experimental toxicity rates. The curves represent fits to Equation 2.
As Figure 1 shows, the fit of Equation 2 for single CPAs is excellent, with an unweighted R2 > 0.99 for each CPA. However, we want to describe multi-CPA toxicity kinetics, because vitrification solutions typically contain multiple CPAs [19,25]. To describe the toxicity of CPA mixtures, we can add versions of Equation 2 together for each CPA, taking a purely additive approach to toxicity, resulting in:
| 3 |
where n is the total number of CPAs in the mixture. The model form of Equation 3 assumes that each CPA has its own independent reaction network leading to cell death (i.e., specific toxicity) and there are no interactions between the CPAs. In Figure 2, we examine how well Equation 3 fits our binary CPA mixture data for a few example cases.
Figure 2.

The toxicity rates of three binary CPA mixtures obtained in our previous work [38] plotted alongside the predicted toxicity rates using Equation 3. (A) CPA mixture with the best agreement between the data and the toxicity rate prediction. (B) CPA mixture exhibiting a gross overestimate of the toxicity rate. (C) CPA mixture exhibiting a gross underestimate of the toxicity rate. The error bars represent the 95% confidence intervals of the experimental toxicity rates.
As shown in Figure 2 and Figure S1, Equation 3 does a poor job of predicting the toxicity rates of binary CPA mixtures. For the overall data set (including both the single and binary CPA solutions), we obtain an overall unweighted R2 of only 0.124.Equation 3 matches the data for DMSO + formamide the best (Figure 2A), but even in this case toxicity is overestimated at low concentrations and slightly underestimated at the highest concentration. However, this CPA mixture is the only one that yields reasonable agreement with the predictions of Equation 3. For glycerol + formamide, toxicity is significantly overestimated over the entire range of concentrations tested (Figure 2B). This is most likely due to the synergistic relationship that we highlighted in our previous work [38]. For 8/10 binary mixtures, Equation 3 significantly underestimated toxicity, as illustrated in Figure 2C for the propylene glycol + ethylene glycol mixture. As such, a different modeling strategy needs to be implemented.
2.3. Non-Specific Toxicity
The specific toxicity model leads to gross underestimation of the toxicity rate of most binary CPA mixtures at higher concentrations (e.g., Figure 2C), which suggests that another mechanism of toxicity predominates under these conditions. To account for this, we define a non-specific toxicity mechanism that is dependent on the total concentration of CPA(s) in the mixture. Fahy et al [17] describes non-specific toxicity as a reduction in the stabilizing effect of water on biomolecules as water is replaced by CPAs and as CPAs change the partitioning of water. As such, any CPA should show non-specific toxicity, and the overall effect should be dependent on the total amount of CPA in the solution. To account for non-specific toxicity, we propose the following model form:
| 4 |
where β is a CPA-dependent coefficient and αn is a constant reaction order to describe non-specific toxicity of all CPA solutions. The coefficient β accounts for potential differences in the tendency of each CPA to alter the stabilizing effect of water.
To examine whether non-specific toxicity alone could explain the observed toxicity trends, we fit Equation 4 to our data set for single CPA solutions and binary CPA mixtures. To fit Equation 4, we performed non-linear regression in MATLAB using the “Isqcurvefit” function, and we accounted for the possibility of local minima by performing a grid search using a wide range of initial parameter guesses. In Figure 3, we examine how well Equation 4 fits our data set for some example cases.
Figure 3.

The toxicity rates of three CPA mixture types obtained in our previous work [38] plotted alongside the predicted toxicity rates using Equation 4. (A) CPA mixture with the best agreement between the data and the toxicity rate prediction. (B) CPA mixture with a gross overestimate of the toxicity rate. (C) CPA mixture with a gross underestimate of the toxicity rate. The error bars represent the 95% confidence intervals of the experimental toxicity rates.
Equation 4 provides a better fit to more CPA mixture types than does Equation 3, and we greatly improve the overall unweighted R2 to 0.916. Overall, 8/15 fits are reasonable (defined as an unweighted R2 ≥ 0.7) for Equation 4 (Figure S2) compared to 6/15 for Equation 3 (Figure S1). As an aside, we are only providing R2 to give some sense of the goodness of fit for the models presented, as the R2 range for the different models reported here is large. We are not using R2 as a metric for nonlinear model determination, as R2 is generally inadequate for such a purpose [36]. In particular, R2 is biased in favor of selection of models with more parameters. The Akaike Information Criterion bias-corrected for small sample sizes (AICc) and the Bayesian Information Criterion (BIC) do a better job of accounting for the effects of increasing the number of model parameters and are considered better metrics for nonlinear model selection [36]. These metrics also point to the superiority of Equation 4 over Equation 3, with an AICc of −56 for Equation 3 and −234 for Equation 4 (i.e., the lowest value is sought). The same can be said for the BIC, with a value of −38 for Equation 3 and −221 for Equation 4.
For Equation 4, though, we still have some cases of poor fits as shown in Figure 3B–C. We again see the overestimation of toxicity in some cases, especially with the synergistic interaction of glycerol + formamide (Figure 3B). Underestimation of toxicity was also observed in a few cases. In fact, the worst case for underestimating toxicity is for formamide solution (Figure 3C), which exhibits more toxicity at low and intermediate concentrations than the other CPAs. This low-concentration toxicity could be because of the specific toxicity of formamide, as reported by Fahy [15].
Given some successes with both the specific and non-specific model forms, the next logical modeling iteration would be to consider both forms combined, which is shown below:
| 5 |
However, Equation 5 fails to provide a substantial leap in the ability to make accurate predictions (yielding 7/15 reasonable fits), even with an increase in the overall unweighted R2 to 0.978 (Figure S3), and both the AICc and BIC indicating the superiority of Equation 5 with values of −300 and −274, respectively. One of the main systematic problems encountered with Equations 3–5 is the overestimation of toxicity for the known synergistic mixture of glycerol + formamide. This suggests that there is some phenomenon that these equations do not capture that is readily apparent for the glycerol + formamide mixture but may also be important for other CPA mixtures as well.
2.4. A new modeling approach
2.4.1. Full Toxicity Model
To account for synergistic effects such as those observed in glycerol + formamide mixtures, we consider the formation of CPA complexes and the resulting effect on specific and non-specific toxicity. Interactions in solution and their subsequent influence on mixing phenomena are of interest for many different fields. For example, mixtures of glycerol + formamide and DMSO + formamide have been shown to form complexes in solution (non-negligible intermolecular interactions), which in turn creates a departure from ideal mixing, resulting in an excess quantity of both physical and thermodynamic properties of solution [32,34].
To incorporate interactions in our model formalism, we hypothesized that any two CPAs in solution have the capacity to form a binary complex, with some CPA pairs having a greater affinity for complex formation over others. To simplify this representation, we only considered the possibility of 1:1 binary complexes forming in solution. Also, we considered the complexes to always be in equilibrium with free solution CPAs. As such, a single equilibrium constant governs the distribution between CPAs in free solution and those in complexes. To incorporate this idea in Equation 5, we allowed for not only free solution CPAs to exhibit specific and non-specific toxicity but the complexes as well. This results in the following proposed full toxicity model with the full derivation presented in Supplementary Material:
| 6 |
| 7 |
| 8 |
| 9 |
where the second index j has been introduced to account for complexes, Kij is the equilibrium constant between CPAs i and j, and the added subscripts of sol and T represent the concentration in free solution and the total concentration (free + complex), respectively.
2.4.2. Parameter Determination
The full toxicity model (Eqs. 6–9) was fit to the data for single CPA solutions and binary mixtures, resulting in the best-fit model predictions shown in Figure 4 (solid lines). The full toxicity model is in good agreement with the data, yielding an unweighted overall R2 > 0.99. However, we obtain an AICc of 154 and a BIC of −175 due to the penalty incurred by the large number of parameters, indicating the inferiority of the full toxicity model based solely on these metrics. However, the full toxicity model incorporates mechanistic principles not incorporated in previous model iterations, and as shown in Figure 4, the best-fit full toxicity model (solid lines) provides reasonable agreement with the data for all of the single CPA solutions and binary CPA mixtures (something not accomplished with Eqs. 3–5), yielding an unweighted R2 ≥ 0.7 in all cases.
Figure 4.

Toxicity rate fits for all single and binary CPA cases. Predictions are shown for the full toxicity model (Eqs. 6–9) using the best-fit model parameters (solid lines), as well as for a reduced version of the model that omits some terms (dashed lines). See text for details on the reduced model. For each individual CPA case, the unweighted R2 is given. CPAs are abbreviated as follows: glycerol (Gly), propylene glycol (PG), ethylene glycol (EG), and formamide (FA). Error bars represent the 95% confidence intervals of the experimental toxicity rates.
As can be seen in Equations 6–9, we have introduced many new parameters with our new model formalism. Specifically, we have 56 parameters and 71 data points, and we have no prior knowledge of the parameter values. The theory of Sloppy Models [6,7,22,37] was specifically developed to try to understand parameter and prediction uncertainty in nonlinear models with many poorly determined degrees of freedom. Sloppy Models often have individual parameters that can vary by orders of magnitude and still maintain a good fit to the data, since a change in one parameter can be compensated for by adjusting other parameters in the model. Sloppy Model analysis uses a combination of Bayesian methods and information geometry to understand and quantify parameter and prediction uncertainty, and we turn to this analysis in order to explore the parameter space of the full toxicity model.
The geometry of Sloppy Model parameter spaces leads to large volumes of parameter space (and large ranges in parameters) generating near-equivalent fits. In order to quantify this parameter uncertainty and propagate it to the model’s predictions (i.e., to place error bars on both model parameters and model output/predictions), we used a Markov Chain Monte Carlo sampling strategy as described previously [6] to obtain an ensemble of parameter sets consistent with the toxicity data. We used a vague (Jeffreys) prior and manipulated step sizes to keep the acceptance ratio near 50-60%. After thinning the resulting parameter ensemble to keep only independent samples, we were left with an ensemble of 10,492 parameter samples. To assess which toxicity mechanisms are most critical for agreement between predictions and the data, we examined this parameter ensemble. In particular, we calculated posterior mean parameter values and 95% posterior confidence intervals. The resulting ensemble means and confidence intervals are presented in Figure 5, alongside the best-fit parameter values (i.e., the specific combination of parameter values that yielded the lowest cost). In many cases, the confidence intervals are large (as expected), indicating that a wide range of parameter values can generate predictions that match the data. However, in a few cases, the confidence intervals are narrow, which indicates that only a narrow range of values for that parameter will yield predictions that match the data.
Figure 5.
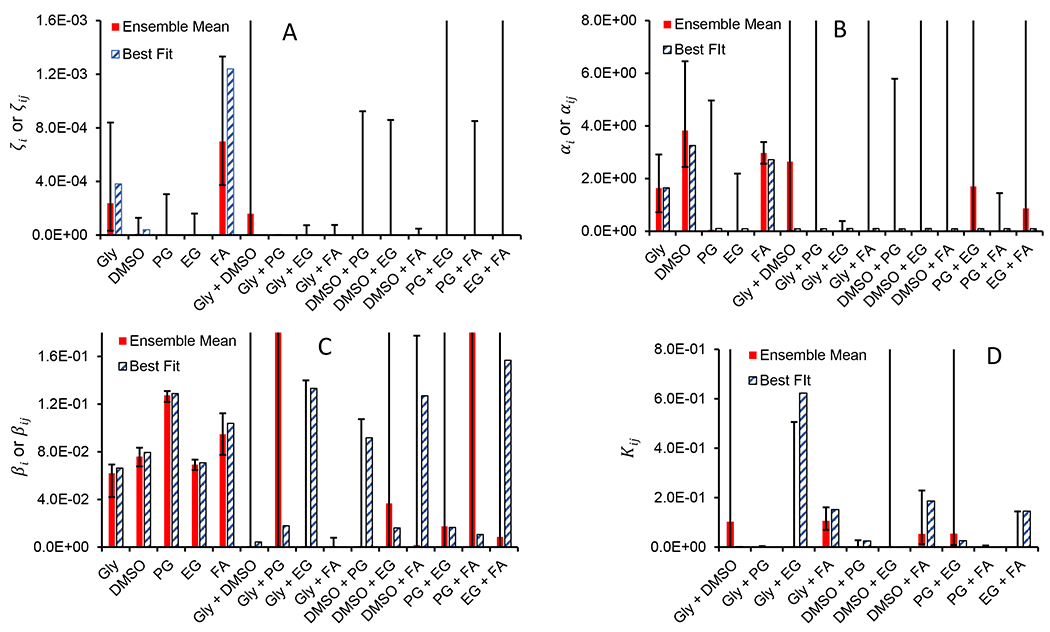
Parameters for the full toxicity model (Eqs. 6–9), showing ensemble means with 95% confidence intervals as well as best-fit parameter values. Panels A and B show specific toxicity parameters, panel C shows non-specific toxicity parameters, and panel D shows the equilibrium constants for CPA complex formation. The non-specific toxicity exponent αn is not shown; it has an ensemble mean of 9.28 (+1.36 for the upper bound and −1.14 for the lower bound) and a best-fit value of 9.66. Note that several upper bounds of the 95% confidence intervals are out of the range of the graphs. Two parameter values are also out of range (βij for Gly + PG and PG + FA). For a comprehensive list of the parameters and 95% confidence intervals see Tables S1 and S2. CPAs are abbreviated as follows: glycerol (Gly), propylene glycol (PG), ethylene glycol (EG), and formamide (FA).
As shown in Figure 5C, narrow confidence intervals were observed for parameters associated with the non-specific toxicity of individual CPAs, highlighting the importance of these non-specific toxicity terms in the model. In particular, the non-specific toxicity coefficients βi all had lower confidence interval bounds that were much greater than zero, and the non-specific toxicity exponent αn had a particularly narrow confidence interval range of 8.14-10.64. Comparison of the non-specific toxicity coefficients between CPAs is also illustrative. The βi value for propylene glycol is substantially higher than the βi values for the other CPAs, and the error bars do not overlap. This suggests that the non-specific toxicity of propylene glycol is particularly pronounced.
The ensemble means of the specific toxicity parameters are shown in Figure 5A–B. In most cases, the specific toxicity coefficients (ζi and ζij) had low ensemble means, suggesting that specific toxicity may be negligible for many CPA mixtures. A notable exception is formamide, which had an ensemble mean ζi at least 3x higher than any of the other CPAs, as well as a lower confidence interval bound that was significantly greater than zero. Formamide also exhibited particularly narrow error bars on the specific toxicity exponent αi. Taken together, this suggests that formamide has relatively high specific toxicity.
Figure 5D shows the ensemble mean equilibrium constants for complex formation. The most notable mixture is glycerol + formamide, which has the highest ensemble mean Kij, as well as the highest lower bound of the confidence interval. This indicates that modeling complex formation between glycerol and formamide is critical for obtaining a good match between the predictions and the data. To make sense out of this, it is useful to examine the values of the specific and non-specific toxicity coefficients for the glycerol + formamide complex. In both cases, the toxicity coefficients for the complex are substantially smaller than the toxicity coefficients for free formamide. This demonstrates that complex formation is expected to decrease the toxicity in glycerol + formamide mixtures, which is consistent with the toxicity neutralization effects observed in our previous study [38].
While the full toxicity model has 56 parameters, it is likely that not all of these parameters are needed to adequately describe the data, and we must also consider the parameter cost incurred in such metrics as the AICc. and BIC. To examine whether reasonable predictions could be obtained using fewer parameters, we eliminated several parameters from the model based on inspection of the results in Figure 5. In particular, we eliminated the terms for the specific toxicity of propylene glycol, ethylene glycol, and all of the CPA complexes, as well as the terms for the non-specific toxicity of complexes of glycerol + propylene glycol, DMSO + ethylene glycol, and propylene glycol + formamide. These non-specific toxicity terms were eliminated by setting the corresponding Kij values to zero. The resulting reduced model has 26 parameters, 30 fewer than the original full toxicity model. This reduced model was fit to the toxicity data, yielding good agreement with the data for the best-fit parameters, as shown in Figure 4 (dashed lines). The overall unweighted R2 was > 0.99, and 14/15 CPA mixture types had an unweighted R2 ≥ 0.7 (only the results for glycerol were lower with a value of 0.66). Also, we obtained a value of −330 for the AICc and −303 for the BIC, which are both superior when comparing to the lowest values obtained thus far through Equation 5. This demonstrates that we can greatly reduce the number of parameters (by more than a factor of two compared to the full model) and still maintain good agreement with the data, suggesting that perhaps even more parameters could be eliminated in future model applications. All parameters from both the full and reduced models can be found in Tables S1 and S2.
2.4.3. Model Validation
Both the full and reduced forms of our proposed toxicity model fit our single and binary CPA solution data well. However, for vitrification solution composition optimization, we seek the ability to predict the toxicity of solutions outside of available data. Our proposed model has this capability, with the only requirement being both single and binary CPA solution training data sets. To test the capability of our model outside of our training data sets, we compared ternary solution predictions with obtained data. Specifically, from our previous work [38], we collected toxicity data for all ten ternary combinations of the five single CPAs we tested. As with our binary CPA solution experiments, we used equi-molal mixtures but only investigated one total CPA concentration, that of 7 molal. In Figure 6, we show our ternary data alongside our toxicity model predictions using the best-fit parameters. In Figure S4, we show ensemble predictions (mean and 95% posterior confidence intervals) for the ternary data. The overall trends are similar in both figures.
Figure 6.

Toxicity rate data for 7 molal (total concentration) equi-molal ternary CPA mixtures compared against both full and reduced toxicity model predictions using the best-fit parameters. CPAs are abbreviated as follows: glycerol (Gly), propylene glycol (PG), ethylene glycol (EG), and formamide (FA). Error bars represent the 95% confidence intervals of the experimental toxicity rates.
From Figure 6, we see reasonable agreement between the validation data and the toxicity model predictions. Quantitatively, we obtain an unweighted R2 of 0.553 for the full model and 0.529 for the reduced model. For the AICc and BIC metrics, considering only the validation data, the reduced model is again superior with an AICc of −95 and a BIC of −4, compared to an AICc of −89 and a BIC of 64 for the full model. We also can quantify the relative error between the data and predictions, with the full model resulting in an average relative error of 42.0% and a maximum relative error of 111.0%, and the reduced model resulting in an average relative error of 40.2% and a maximum relative error of 127.0%. Overall, most predictions fall within a factor of two of the data, while also following the general low to high toxicity ordering trend presented in Figure 6. The predictions of Figure 6 give credence to the idea that binary interactions and general binary solution effects dominate in multi-CPA solutions, highlighting the potential for estimating the toxicity of any CPA solution based on toxicity data for only single and binary CPA solutions. Overall, the predictions in Figure 6 give us confidence that our modeling approach is a reasonable foundation for optimization of vitrification solution composition.
3. MODEL APPLICATION: VITRIFICATION SOLUTION COMPOSITION
A key challenge in the design of vitrification procedures is identification of a non-toxic (or minimally toxic) CPA mixture that will vitrify and remain in a glassy state during cooling and warming. Given that we can describe the toxicity rate of any solution comprised of the five CPAs we have investigated, we only need to pair our toxicity rate model with a model that can predict vitrification/devitrification to identify promising solution compositions. To optimize solution compositions for vitrification, we adopted such a model from Weiss et al [39]. Their work proposed a statistical model for predicting the probability of vitrification during cooling and the probability of reaching a given level of glass stability during the rewarming process for the five CPAs we investigated. More recently, this model was used in Shardt et al [33] to refine articular cartilage vitrification protocols.
By combining the Weiss et al [39] model with our toxicity rate model, we can predict the toxicity of any potential solution at a given probability threshold of vitrification and/or devitrification. To identify promising solution compositions for vitrification, we minimized the value of the toxicity rate under several vitrification/devitrification constraints by varying the concentrations of each of the five CPAs that could be in solution. Specifically, we investigated the following constraints: 50% probability of vitrification, 50% probability of complete devitrification (the lowest glass stability level of Weiss et al [39] and adopted as the threshold of Shardt et al [33]), and 50% probability of no devitrification (the highest glass stability level of Weiss et al [39]). To optimize solution composition, we used the “fmincon” function in MATLAB and minimized both our full and reduced toxicity models under the 3 different constraints for each possible combination of CPAs in solution (i.e., 31 total ranging from single solution to quinary mixture combinations). For each possible combination, we assigned 13 different initial concentration guesses for each CPA, ranging from 0 to 12 molal in 1 molal increments. For a single toxicity model being minimized under a single constraint, there are: 13 “fmincon” function calls for each of the 5 single CPA solutions, 132 “fmincon” function calls for each of the 10 binary CPA mixtures, 133 “fmincon” function calls for each of the 10 ternary CPA mixtures, 134 “fmincon” function calls for each of the 5 quaternary CPA mixtures, and 135 “fmincon” function calls for the 1 quinary CPA mixture. Out of all the “fmincon” function calls (over 500,000), the optimal solution composition was considered to be the one that returned the lowest toxicity rate. In Figure 7, we show these optimization results. We also determined optimal solution compositions excluding formamide, and this is also shown in Figure 7 for comparative purposes.
Figure 7.
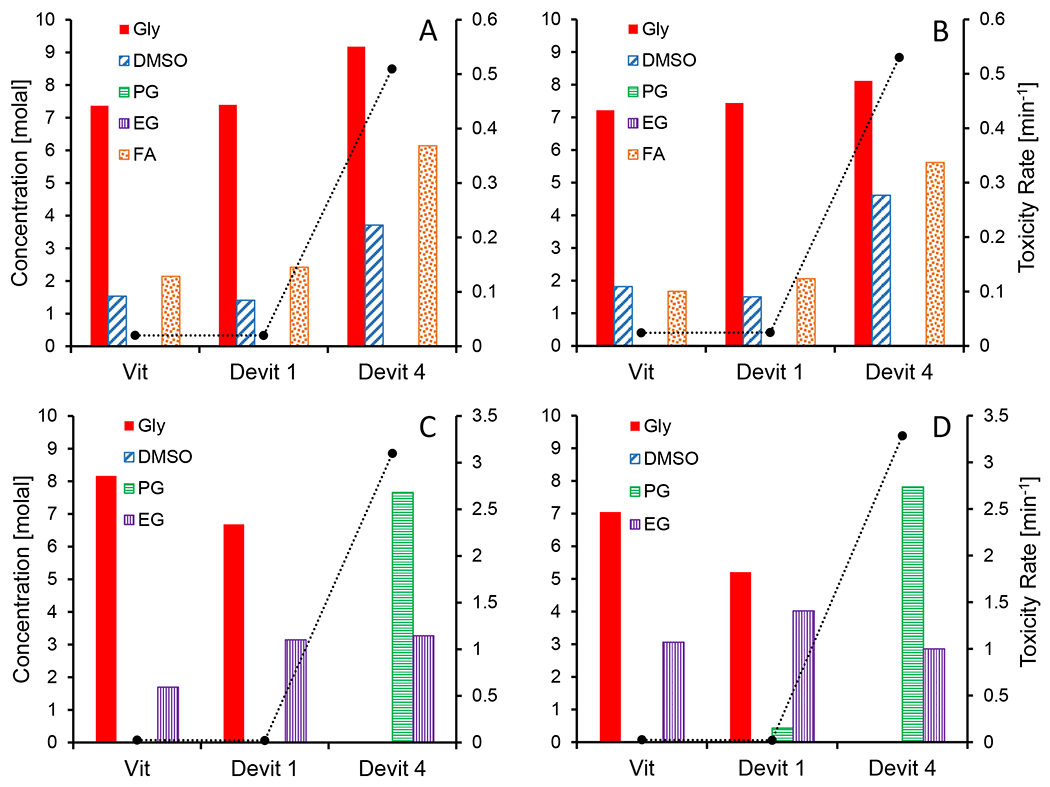
The least toxic vitrification solution compositions predicted using three vitrification/devitrification constraints presented by Weiss et al [39]: 50% probability of vitrification (Vit), 50% probability of complete devitrification (Devit 1), and 50% probability of no devitrification (Devit 4). Panels A and B include formamide as a potential solution constituent, while Panels C and D do not. Panels A and C use the full toxicity model with the best-fit parameters, and Panels B and D use the reduced toxicity model with the best-fit parameters. The predicted toxicity rate (dotted line) of each solution is also shown on the secondary vertical axis. CPAs are abbreviated as follows: glycerol (Gly), propylene glycol (PG), ethylene glycol (EG), and formamide (FA).
From Figure 7, we can see that the optimized solution compositions and toxicity rates are similar for the vitrification and devitrification 1 constraints. For the devitrification 4 constraint (the most stringent constraint), the predicted toxicity rate is substantially higher. Also, when comparing the full and reduced models, we see similar optimized compositions and toxicity rate predictions. When formamide is included as a possible solution constituent, the resulting optimized solution composition is a mixture of glycerol, DMSO, and formamide. This solution composition takes advantage of the toxicity neutralization effects that have been observed in mixtures of DMSO + formamide [15,18] and in mixtures of glycerol + formamide [38]. When formamide is not included as a possible constituent, the predicted toxicity rate is higher. For the vitrification and devitrification 1 constraints, the optimized solution composition is a mixture of ethylene glycol and glycerol, whereas for the devitrification 4 constraint, the optimized composition is a mixture of ethylene glycol and propylene glycol.
Overall, given that Shardt et al [33] used the devitrification 1 constraint to design successful methods for vitrification of articular cartilage, we would recommend using this constraint. For the full model, the resulting optimized composition is 7.39 molal glycerol, 1.41 molal DMSO, and 2.42 molal formamide. The reduced model yielded a very similar composition (7.44 molal glycerol, 1.50 molal DMSO, and 2.06 molal formamide). Importantly, Figure 7 demonstrates the potential to mathematically predict the concentration of each constituent in solution rather than experimentally iterating through each potential composition.
4. CONCLUSIONS AND FUTURE DIRECTIONS
In this work, we developed a multi-CPA toxicity model based on the large data set from our previous work [38]. The model accounts for specific toxicity and non-specific toxicity, as well as modulation of these toxicity mechanisms due to intermolecular interactions between the CPAs in solution. To train the model we used toxicity rate data for 15 different CPA solutions (comprising 5 single and 10 binary solutions), each over a range of CPA concentrations. The model fit the training data well for all 15 CPA solutions, and extension of the model to the ternary solution validation data yielded predictions that were in reasonable agreement with the data. To understand the key parameters of the model, we used Sloppy Model analysis, which revealed that the model terms for non-specific toxicity of individual CPAs, specific toxicity of formamide, and complex formation between formamide and glycerol were particularly important for obtaining good agreement with the data. This analysis also gave us a basis for reparametrizing the model by eliminating over half of the parameters, resulting in a reduced model that still matched the data well. To examine the potential for using the toxicity model for designing vitrification solutions, we combined it with a published vitrification/devitrification model [39], enabling prediction of minimally toxic CPA mixtures for vitrification. The resulting optimized mixture contains formamide, glycerol, and DMSO; this unique mixture composition has the potential to reduce toxicity and should be tested in future studies. Of course, this mixture composition prediction is based on data for bovine pulmonary artery endothelial cells, and it may not be optimal for all cell types; however, the promising toxicity neutralization effect of DMSO + formamide, which our optimal composition leverages, has been shown across different cell types from Fahy and colleagues [15,18] and our previous work [38]. Future studies predicting optimal mixture compositions for other cell types would be useful to look for general composition trends.
Another future direction would be to apply the multi-CPA toxicity model for optimization of the full vitrification process, including CPA addition and removal. In previous studies, we presented a toxicity cost function approach for designing minimally toxic CPA equilibration methods [3,4,8,9], but this approach has been limited to single CPA solutions. The new toxicity model will enable expansion of the cost function approach to multi-CPA solutions, enabling optimization of not only the CPA addition and removal process, but also the composition of the CPA mixture. To realize the full potential of this approach it will be necessary to also characterize the effects of temperature on toxicity and incorporate this into the optimization framework. Experiments are currently underway to quantify the temperature dependence of CPA toxicity for various CPA mixtures. It would also be useful in future studies to quantify the toxicity of other CPAs (including nonpenetrating CPAs such as trehalose), and to examine the effects of CPA carrier solution on toxicity.
Supplementary Material
ACKNOWLEDGMENTS
This work was supported from funding from the Hirsch Foundation and the National Institutes of Health (R01 EB027203). K.B. received support from the National Science Foundation (MCB 1715342).
ABBREVIATIONS
- CPAs
cryoprotectants
- DMSO
dimethyl sulfoxide
- EG
ethylene glycol
- FA
formamide
- Gly
glycerol
- PG
propylene glycol
Footnotes
Publisher's Disclaimer: This is a PDF file of an unedited manuscript that has been accepted for publication. As a service to our customers we are providing this early version of the manuscript. The manuscript will undergo copyediting, typesetting, and review of the resulting proof before it is published in its final form. Please note that during the production process errors may be discovered which could affect the content, and all legal disclaimers that apply to the journal pertain.
CONFLICTS OF INTEREST
The authors have no conflicts of interest.
REFERENCES
- [1].Almansoori KA, Prasad V, Forbes JF, Law GK, McGann LE, Elliott JA, Jomha NM, Cryoprotective agent toxicity interactions in human articular chondrocytes, Cryobiology 64 (2012) 185–191. [DOI] [PubMed] [Google Scholar]
- [2].Beier AF, Schulz JC, Dorr D, Katsen-Globa A, Sachinidis A, Hescheler J, Zimmermann H, Effective surface-based cryopreservation of human embryonic stem cells by vitrification, Cryobiology 63 (2011) 175–185. [DOI] [PubMed] [Google Scholar]
- [3].Benson JD, Kearsley AJ, Higgins AZ, Mathematical optimization of procedures for cryoprotectant equilibration using a toxicity cost function, Cryobiology 64 (2012) 144–151. [DOI] [PubMed] [Google Scholar]
- [4].Benson JD, Higgins AZ, Desai K, Eroglu A, A toxicity cost function approach to optimal CPA equilibration in tissues, Cryobiology 80 (2018) 144–155. [DOI] [PMC free article] [PubMed] [Google Scholar]
- [5].Best BP, Cryoprotectant Toxicity: Facts, Issues, and Questions, Rejuvenation Res 18 (2015) 422–436. [DOI] [PMC free article] [PubMed] [Google Scholar]
- [6].Brown KS, Sethna JP, Statistical mechanical approaches to models with many poorly known parameters, Physical Review E 68 (2003). [DOI] [PubMed] [Google Scholar]
- [7].Brown KS, Hill CC, Calero GA, Myers CR, Lee KH, Sethna JP, Cerione RA, The statistical mechanics of complex signaling networks: nerve growth factor signaling, Physical Biology 1 (2004) 184–195. [DOI] [PubMed] [Google Scholar]
- [8].Davidson AF, Benson JD, Higgins AZ, Mathematically optimized cryoprotectant equilibration procedures for cryopreservation of human oocytes, Theoretical Biology and Medical Modelling 11 (2014). [DOI] [PMC free article] [PubMed] [Google Scholar]
- [9].Davidson AF, Glasscock C, McClanahan DR, Benson JD, Higgins AZ, Toxicity Minimized Cryoprotectant Addition and Removal Procedures for Adherent Endothelial Cells, PLoS One 10 (2015) e0142828. [DOI] [PMC free article] [PubMed] [Google Scholar]
- [10].El-Shewy HM, Kendall WF, Darrabie M, Collins BH, Opara EC, Polyvinyl pyrrolidone: A novel cryoprotectant in islet cell cryopreservation, Cell Transplantation 13 (2004) 237–243. [DOI] [PubMed] [Google Scholar]
- [11].Elliott GD, Wang S, Fuller BJ, Cryoprotectants: A review of the actions and applications of cryoprotective solutes that modulate cell recovery from ultra-low temperatures, Cryobiology 76 (2017) 74–91. [DOI] [PubMed] [Google Scholar]
- [12].Elmoazzen HY, Poovadan A, Law GK, Elliott JA, McGann LE, Jomha NM, Dimethyl sulfoxide toxicity kinetics in intact articular cartilage, Cell Tissue Bank 8 (2007) 125–133. [DOI] [PubMed] [Google Scholar]
- [13].Fahmy MD, Almansoori KA, Laouar L, Prasad V, McGann LE, Elliott JA, Jomha NM, Dose-injury relationships for cryoprotective agent injury to human chondrocytes, Cryobiology 68 (2014) 50–56. [DOI] [PubMed] [Google Scholar]
- [14].Fahy GM, Cryoprotectant Toxicity - Biochemical or Osmotic, Cryo-Letters 5 (1984) 79–90. [Google Scholar]
- [15].Fahy GM, Cryoprotectant toxicity neutralization, Cryobiology 60 (2010) S45–53. [DOI] [PubMed] [Google Scholar]
- [16].Fahy GM, Wowk B, Wu J, Cryopreservation of complex systems: The missing link in the regenerative medicine supply chain, Rejuvenation Research 9 (2006) 279–291. [DOI] [PubMed] [Google Scholar]
- [17].Fahy GM, Wowk B, Wu J, Paynter S, Improved vitrification solutions based on the predictability of vitrification solution toxicity, Cryobiology 48 (2004) 22–35. [DOI] [PubMed] [Google Scholar]
- [18].Fahy GM, da Mouta C, Tsonev L, Khirabadi BS, Mehl P, Meryman HT, Cellular Injury Associated with Organ Cryopreservation: Chemical Toxicity and Cooling Injury, in: Lemasters JJ, Oliver C (Eds.), Cell Biology of Trauma, CRC Press, Boca Raton, 1995, pp. 333–356. [Google Scholar]
- [19].Fahy GM, Wowk B, Wu J, Phan J, Rasch C, Chang A, Zendejas E, Cryopreservation of organs by vitrification: perspectives and recent advances, Cryobiology 48 (2004) 157–178. [DOI] [PubMed] [Google Scholar]
- [20].Fahy GM, Wowk B, Pagotan R, Chang A, Phan J, Thomson B, Phan L, Physical and biological aspects of renal vitrification, Organogenesis 5 (2009) 167–175. [DOI] [PMC free article] [PubMed] [Google Scholar]
- [21].Giwa S, Lewis JK, Alvarez L, Langer R, Roth AE, Church GM, Markmann JF, Sachs DH, Chandraker A, Wertheim JA, Rothblatt M, Boyden ES, Eidbo E, Lee WPA, Pomahac B, Brandacher G, Weinstock DM, Elliott G, Nelson D, Acker JP, Uygun K, Schmalz B, Weegman BP, Tocchio A, Fahy GM, Storey KB, Rubinsky B, Bischof J, Elliott JAW, Woodruff TK, Morris GJ, Demirci U, Brockbank KGM, Woods EJ, Ben RN, Baust JG, Gao DY, Fuller B, Rabin Y, Kravitz DC, Taylor MJ, Toner M, The promise of organ and tissue preservation to transform medicine, Nature Biotechnology 35 (2017) 530–542. [DOI] [PMC free article] [PubMed] [Google Scholar]
- [22].Gutenkunst RN, Waterfall JJ, Casey FP, Brown KS, Myers CR, Sethna JP, Universally sloppy parameter sensitivities in systems biology models, Plos Computational Biology 3 (2007) 1871–1878. [DOI] [PMC free article] [PubMed] [Google Scholar]
- [23].Hezavehei M, Sharafi M, Kouchesfahani HM, Henkel R, Agarwal A, Esmaeili V, Shahverdi A, Sperm cryopreservation: A review on current molecular cryobiology and advanced approaches, Reproductive Biomedicine Online 37 (2018) 327–339. [DOI] [PubMed] [Google Scholar]
- [24].Jomha NM, Weiss AD, Fraser Forbes J, Law GK, Elliott JA, McGann LE, Cryoprotectant agent toxicity in porcine articular chondrocytes, Cryobiology 61 (2010) 297–302. [DOI] [PubMed] [Google Scholar]
- [25].Jomha NM, Elliott JA, Law GK, Maghdoori B, Forbes JF, Abazari A, Adesida AB, Laouar L, Zhou X, McGann LE, Vitrification of intact human articular cartilage, Biomaterials 33 (2012) 6061–6068. [DOI] [PubMed] [Google Scholar]
- [26].Lawson A, Mukherjee IN, Sambanis A, Mathematical modeling of cryoprotectant addition and removal for the cryopreservation of engineered or natural tissues, Cryobiology 64 (2012) 1–11. [DOI] [PMC free article] [PubMed] [Google Scholar]
- [27].Lewis JK, Bischof JC, Braslavsky I, Brockbank KGM, Fahy GM, Fuller BJ, Rabin Y, Tocchio A, Woods EJ, Wowk BG, Acker JP, Giwa S, The Grand Challenges of Organ Banking: Proceedings from the first global summit on complex tissue cryopreservation, Cryobiology 72 (2016) 169–182. [DOI] [PubMed] [Google Scholar]
- [28].Lusianti RE, Higgins AZ, Continuous removal of glycerol from frozen-thawed red blood cells in a microfluidic membrane device, Biomicrofluidics 8 (2014) 054124. [DOI] [PMC free article] [PubMed] [Google Scholar]
- [29].Malpique R, Tostoes R, Beier AF, Serra M, Brito C, Schulz JC, Bjorquist P, Zimmermann H, Alves PM, Surface-based cryopreservation strategies for human embryonic stem cells: a comparative study, Biotechnol Prog 28 (2012) 1079–1087. [DOI] [PubMed] [Google Scholar]
- [30].Porcu E, Ciotti P, Venturoli S, Handbook of Human Oocyte Cryopreservation, Cambridge University Press, Cambridge, United Kingdom, 2012. [Google Scholar]
- [31].Saragusty J, Arav A, Current progress in oocyte and embryo cryopreservation by slow freezing and vitrification, Reproduction 141 (2011) 1–19. [DOI] [PubMed] [Google Scholar]
- [32].Sengwa RJ, Choudhary S, Khatri V, Characterization of Dominant Hydrogen Bonded Complex Structures of Dielectric Polarization and Viscous Flow Processes in Glycerol-Formamide Binary Mixtures, Journal of Solution Chemistry 40 (2011) 154–163. [Google Scholar]
- [33].Shardt N, Chen ZR, Yuan SC, Wu KZ, Laouar L, Jomha NM, Elliott JAW, Using engineering models to shorten cryoprotectant loading time for the vitrification of articular cartilage, Cryobiology 92 (2020) 180–188. [DOI] [PubMed] [Google Scholar]
- [34].Singh RD, Gupta M, Molecular interaction Study in binary mixture of DMSO with formamide and N, N-dimethylformamide, Indian Journal of Pure & Applied Physics 55 (2017) 729–736. [Google Scholar]
- [35].Song YC, Khirabadi BS, Lightfoot F, Brockbank KGM, Taylor MJ, Vitreous cryopreservation maintains the function of vascular grafts, Nature Biotechnology 18 (2000) 296–299. [DOI] [PubMed] [Google Scholar]
- [36].Spiess AN, Neumeyer N, An evaluation of R2 as an inadequate measure for nonlinear models in pharmacological and biochemical research: a Monte Carlo approach, BMC Pharmacol 10 (2010) 6. [DOI] [PMC free article] [PubMed] [Google Scholar]
- [37].Transtrum MK, Machta BB, Brown KS, Daniels BC, Myers CR, Sethna JP, Perspective: Sloppiness and emergent theories in physics, biology, and beyond, Journal of Chemical Physics 143 (2015). [DOI] [PubMed] [Google Scholar]
- [38].Warner RM, Ampo E, Nelson D, Benson JD, Eroglu A, Higgins AZ, Rapid quantification of multi-cryoprotectant toxicity using an automated liquid handling method, Cryobiology 98 (2021) 219–232. [DOI] [PMC free article] [PubMed] [Google Scholar]
- [39].Weiss AD, Forbes JF, Scheuerman A, Law GK, Elliott JA, McGann LE, Jomha NM, Statistical prediction of the vitrifiability and glass stability of multi-component cryoprotective agent solutions, Cryobiology 61 (2010) 123–127. [DOI] [PubMed] [Google Scholar]
Associated Data
This section collects any data citations, data availability statements, or supplementary materials included in this article.