Abstract
Purpose:
We sought to evaluate inter-scan and inter-reader agreement of coronary calcium (CAC) scores obtained from dedicated, ECG-gated CAC scans (standard CAC scan) and ultra-low-dose, ungated computer tomography attenuation correction (CTAC) scans obtained routinely during cardiac PET/CT imaging.
Methods:
From 2928 consecutive patients who underwent same-day 82Rb cardiac PET/CT and gated CAC scan in the same hybrid PET/CT scanning session, we have randomly selected 200 cases with no history of revascularization. Standard CAC scans and ungated CTAC scans were scored by two readers using quantitative clinical software. We assessed the agreement between readers and between two scan protocols in 5 CAC categories (0, 1–10, 11–100; 101–400 and >400) using Cohen’s Kappa and concordance.
Results:
Median age of patients was 70 (inter-quartile range: 63–77), 46% were male. The inter-scan concordance index and Cohen’s Kappa for Reader 1 and 2 were 0.69; 0.75 (0.69, 0.81) and 0.72; 0.8 (0.75, 0.85) respectively. The inter-reader concordance index and Cohen’s Kappa (95% confidence interval [CI]) was higher for standard CAC scans: 0.9 and 0.92 (0.89, 0.96), respectively, vs. for CTAC scans: 0.83 and 0.85 (0.79, 0.9) for CTAC scans (p=0.02 for difference in Kappa). Most discordant readings between two protocols occurred for scans with low extent of calcification (CAC score <100).
Conclusion:
CAC can be quantitatively assessed on PET CTAC maps with good agreement with standard scans, however with limited sensitivity for small lesions. CAC scoring of CTAC can be performed routinely without modification of PET protocol and added radiation dose.
Keywords: positron emission tomography, computed tomography, attenuation correction, coronary artery calcium
Introduction
Coronary artery calcium (CAC) scoring is well established as a tool to stratify the risk of future cardiac events. It has been shown to provide independent incremental information in addition to traditional risk factors for coronary artery disease (CAD) in the prediction of risk of future cardiac events and all-cause mortality[1, 2] and provides guidance for therapy and patient lifestyle changes[3]. Standard CAC scoring[4] requires a specific imaging protocol that includes ECG-gating [5]. While CAC can be seen on any non-contrast cardiac CT, motion artifacts[5] and partial volume effect[6] may contribute to the lower reproducibility of CAC scores obtained with alternative protocols. Nonetheless, previous studies have shown that CAC scoring is feasible and provides acceptable agreement with standard protocol in low-dose chest CT scans for cancer screening purposes[7].
Contemporary hybrid PET/CT scanners incorporate multidetector computed tomography (CT) scanners. Low-dose CT attenuation correction (CTAC) for myocardial perfusion imaging (MPI) is always performed for the PET/CT scans and is obtained without ECG-gating. It has been shown that visual CAC estimation is possible for CTAC scans and can allow for more informed decision-making [8, 9] after MPI. However, quantitative CAC scoring in CTAC scans, which could provide a more objective assessment of CAC, is currently not performed clinically. While separate ECG-gated CAC scans (standard CAC scans) studies are performed clinically in some centers at the time of PET MPI in some patients, they come with the cost of increased radiation dose for the patient and are not currently reimbursed in most cases. Importantly, the possibility of quantitative CAC scoring in CTAC is not limited to PET MPI but could be performed using CT attenuation maps of all thoracic and whole-body PET/CT.
In this study, we aimed to test the agreement between CAC scores obtained from standard CAC scans and PEET/CT CTAC scans by two independent readers.
Materials and methods
Study population
We considered 4761 consecutive patients who underwent clinical Rubidium-82 (82Rb) cardiac PET/CT scans between 2010 and 2018. From this cohort, 2928 patients also underwent ECG-gated, dedicated CT CAC scan (standard CAC scan) at the time of cardiac PET/CT scan acquisition. At the time of acquisition, all standard CAC scans were scored by expert readers, and the resulting scores were verified by the attending physician (clinical CAC scores). We excluded 1450 patients who underwent prior revascularization: either coronary artery bypass surgery (CABG) or percutaneous coronary intervention (PCI).
Acquisition protocols
Standard CAC scan
Patients were scanned using a Siemens Biograph 64 PET/CT scanner. Standard CAC scans were performed before the PET acquisition using an end-inspiratory breath-hold with prospective ECG gating, tube voltage 120 kVp, tube current-time product 85–150 mAs. The scans were reconstructed with the full field-of-view in 190 patients and a field-of-view zoomed to the heart in 10 patients. All scans were reconstructed with a slice thickness of 3 mm. Typical radiation dose ranged from 1 to 3 mSv per scan.
CTAC scan
CTAC scans were performed as a part of the cardiac PET/CT protocol with normal breathing, without ECG gating, spiral mode with pitch 1.5, tube voltage 100 kVp, tube current-time product 11–13 mAs, and a full field-of-view. Reconstruction was performed with a slice thickness of 3 mm. The typical radiation dose was 0.2–0.3mSv per scan.
Dataset
The clinical CAC scores were used to divide the cohort into CACs categories (CAC score = 0, CAC score 1–10, CAC score 11–100, CAC score 101–400, CAC score>400)[10]. We then randomly selected 40 patients from each category (using a random number generator). The final cohort consisted of 200 cases. The patient selection process is illustrated in Figure 1. The overview of the study design is presented in Figure 2.
Fig. 1. Flowchart describing the data selection process.
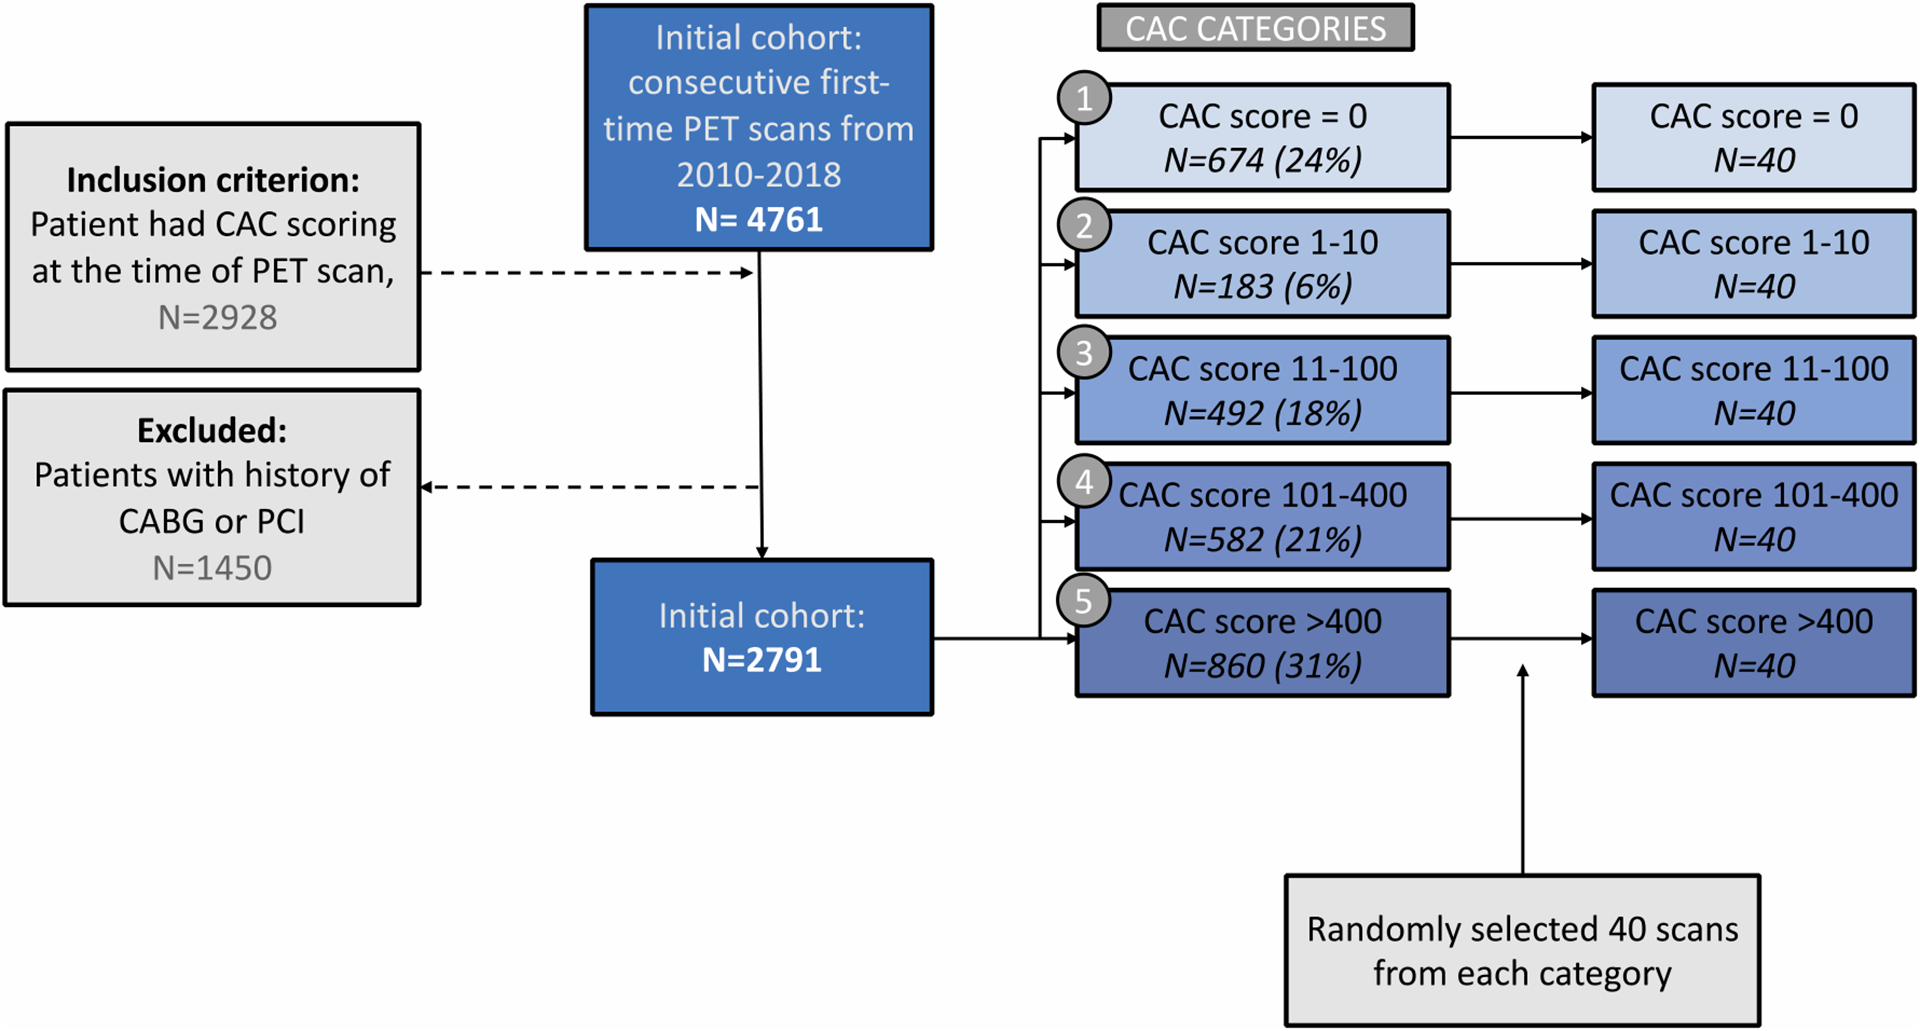
Abbreviations: PET - positron emission tomography, CAC - coronary artery calcium, CTAC - computed tomography attenuation correction, CABG - coronary artery bypass grafting, PCI - percutaneous coronary intervention
Fig. 2.
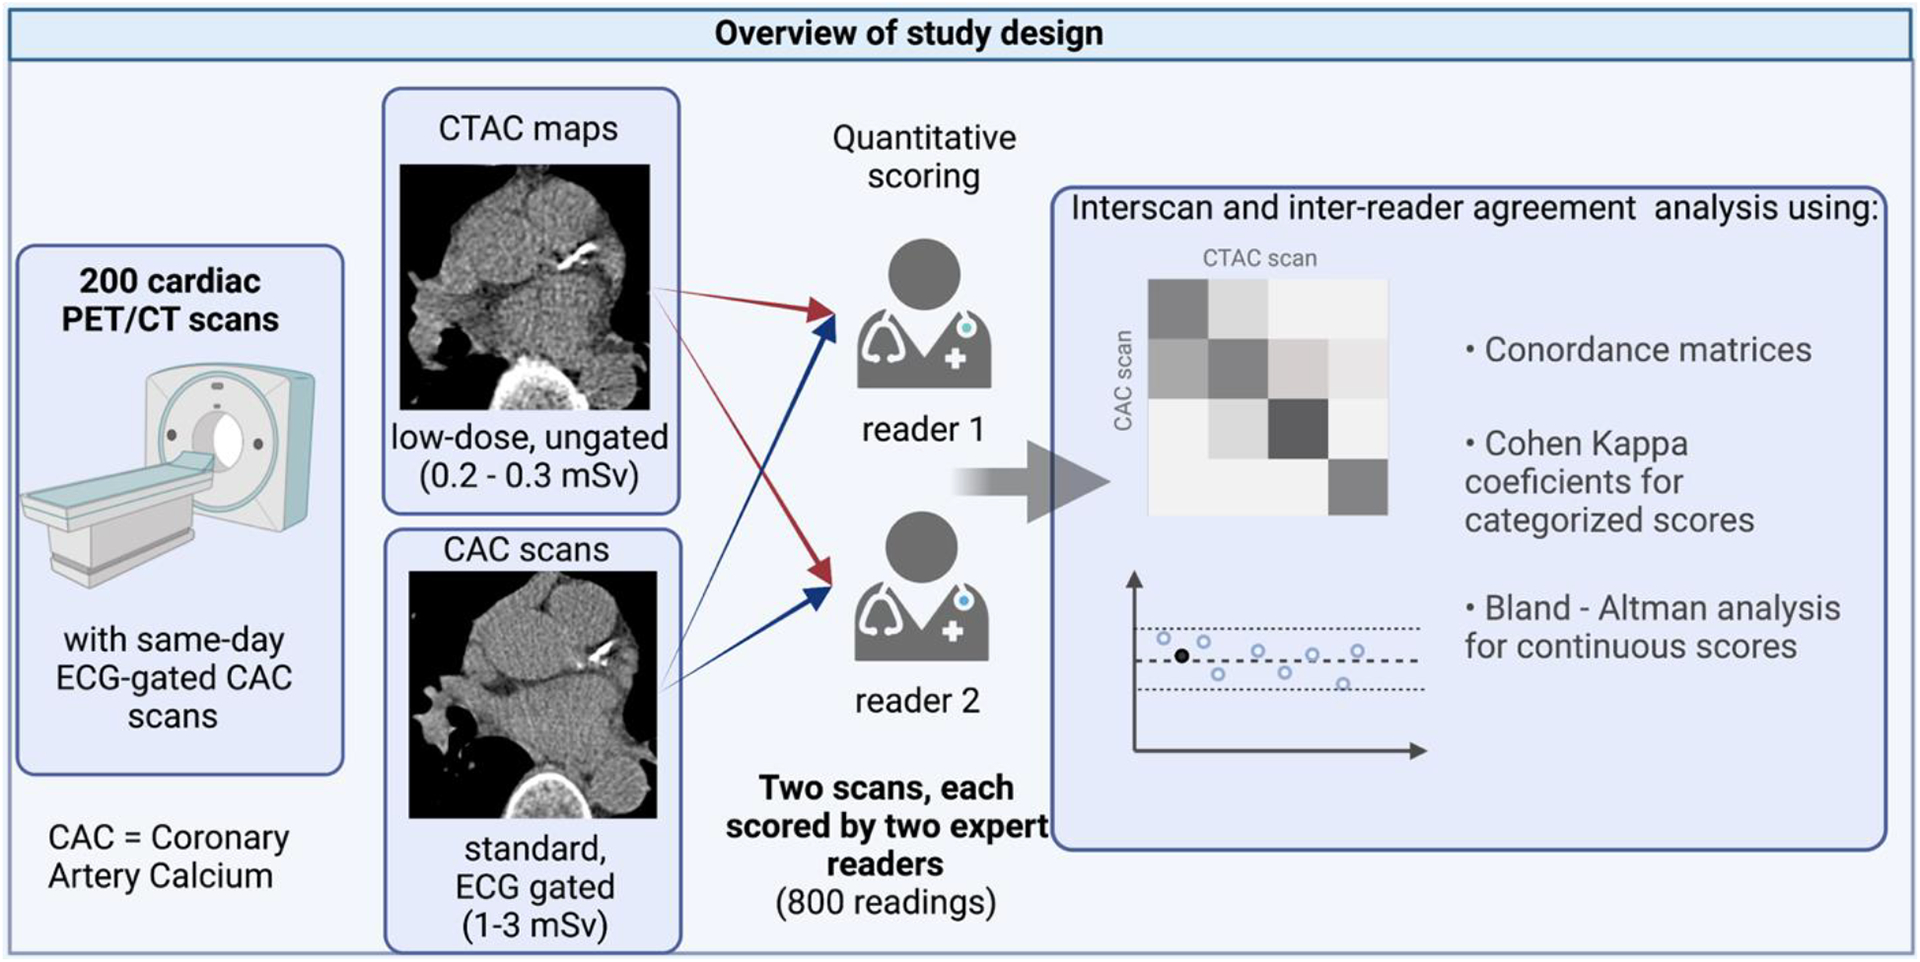
Overview of study design and methods
Quantitative CAC scoring
Two experienced readers (MH and ML, with 5 and 3 years of experience in quantitative CAC scoring, respectively) independently obtained CAC scores for both the standard CAC scans (standard CAC scores) and the ungated CTAC scans (CTAC scores). Stress PET/CT CTAC maps were used for the CTAC scoring. The readers were blinded to the clinical CAC scores and to each other’s reading. CAC scores (Agatston method) were calculated with the clinical CAC scoring software (Cardiac Suite, Cedars Sinai Medical Center, CA, USA). CAC scores were calculated separately for the left main coronary artery (LM), left anterior descending (LAD), left circumflex (LCX), and right coronary arteries (RCA). Additionally, the readers’ scoring time was recorded in a set of randomly selected 20 patients.
Data analysis
CAC score comparison
Scores were categorized using 5 categories (CAC score = 0, CAC score 1–10, CAC score 11–100, CAC score 101–400, CAC score>400). The correlation between CAC scores was assessed in CAC categories with interclass correlation coefficient (ICC). Concordance matrices were used to show the number of concordant and discordant pairs in each CAC score category, and a linearly weighted Kappa score was used to assess agreement in categories.
Inter-reader agreement
Interobserver agreement and correlation analyses were performed separately for gated and ungated scans by comparing CAC scores obtained by two readers for each scan.
Inter-scan agreement
Inter-scan agreement and correlation were assessed by comparing CAC scores obtained for a single patient using gated and ungated CTAC scans. CAC scoring of the standard CAC scans was performed separately from CAC scoring of CTAC scans.
Statistical analysis
Qualitative variables were expressed by median and interquartile ranges (IQR), and the medians between groups were compared using the Kruskal-Wallis test. Qualitative variables were expressed as n (%), and the differences in frequencies were studied using Fisher’s exact test. Bland-Altman plots were created for inter-reader and inter-scan comparisons. Bland-Altman statistics (bias with 95% confidence interval [CI] and limits of agreement) were calculated on a per-patient and per-vessel basis. The mean absolute inter-reader differences in scores (bias) between CAC scans and ungated CTAC maps and scoring times were compared with Welch’s unequal variances t-test. Comparisons between Kappa values were performed using the Z-score test. P-values lower than 0.05 were considered statistically significant. Statistical analysis was performed using R and R Studio software except for the confidence intervals and standard errors for Kappa values that were calculated using VassarStats (http://vassarstats.net/kappa.html). The detailed listing of used packages is in Supplemental Table 1.
Results
Clinical characteristics of the studied cohort are summarized according to the clinical CAC score category in Table 1. Higher categories were associated with a higher prevalence of risk factors, including hypertension, dyslipidemia, smoking, and age. The typical effective radiation dose for a CTAC scan was 0.2–0.3 mSv, while a typical dose for a standard CAC scan was 1–3 mSv. The average times to score standard CAC and CTAC scans were similar (148±105 seconds and 147±109 seconds, respectively, p=0.96). Reading times for both readers and two scan protocols are summarized in Supplemental Table 2.
Table 1.
Baseline characteristics of the studied population by clinical CAC score category
| Overall, N = 200 | CAC = 0, N = 40 | CAC 1–10, N = 40 | CAC 11–100, N = 40 | CAC 101–400, N = 40 | CAC > 400, N = 40 | p-value | |
|---|---|---|---|---|---|---|---|
| Age | 70 (63, 77) | 61 (53, 72) | 70 (65, 73) | 70 (66, 75) | 75 (65, 79) | 74 (69, 79) | <0.001 a |
| Sex male | 93 (46%) | 16 (40%) | 13 (32%) | 19 (48%) | 16 (40%) | 29 (72%) | 0.004 b |
| BMI | 28 (24, 32) | 30 (25, 34) | 27 (24, 32) | 28 (25, 32) | 27 (24, 33) | 26 (23, 29) | 0.13a |
| Hypertension | 141 (70%) | 24 (60%) | 26 (65%) | 36 (90%) | 27 (68%) | 28 (70%) | 0.037 b |
| Diabetes | 53 (26%) | 12 (30%) | 12 (30%) | 10 (25%) | 9 (22%) | 10 (25%) | >0.9b |
| Dyslipidemia | 107 (54%) | 15 (38%) | 21 (52%) | 20 (50%) | 24 (60%) | 27 (68%) | 0.086b |
| Renal failure | 13 (7%) | 0 (0%) | 4 (10%) | 5 (12%) | 2 (5%) | 2 (5%) | 0.2b |
| Atrial fibrillation during scan | 10 (5%) | 0 (0%) | 0 (0%) | 3 (8%) | 4 (10%) | 3 (7%) | 0.064b |
| Smoking | 21 (10%) | 8 (20%) | 1 (3%) | 3 (8%) | 1 (3%) | 8 (20%) | 0.008 b |
| Clinical Calcium Score | 47 (3, 296) | 0 (0, 0) | 6 (3, 7) | 47 (27, 62) | 249 (164, 296) | 919 (622, 1432) | <0.001 a |
Statistics presented: Median (interquartile range), n (%)
Kruskal-Wallis test
Fisher’s exact test
Abbreviations: CAC – coronary artery calcium, BMI – body mass index
Inter-reader agreement
For standard CAC scans, we observed a very high inter-reader agreement in 5 CAC score categories with only 4 cases differing by more than one class, as shown on concordance matrices and Bland-Altman plots of percentage differences between the scores in Figure 3). Total and per-vessel CAC agreement measures between two readers are presented in Table 2, both for standard CAC scans and CTAC scans. The inter-reader agreement expressed in concordance indices and Cohen’s Kappa was worse in case of CTAC scans than in standard CAC scans (0.89, [95% CI 0.79,0.9] vs 0.92 [95% CI 0.89, 0.96], p-value – 0.016). The mean absolute difference in scores by two readers was larger in CTAC scans (41.8) than in standard CAC scans (12.2, p<0.001). Interestingly, in per-vessel analysis, the mean absolute difference in scores was significantly larger in CTAC scans for LCx artery (22.5 vs. 6.3, p=0.03) and RCA (26.8 vs. 4.5, p=0.02) but not for LAD (17.8 vs. 15.9, p=0.77) or LM artery (11.3 vs. 6.7, p=0.08). The inter-reader limits of agreement were also wider in CTAC scans than in standard CAC scans for all vessels except LAD (Table 2).
Fig. 3.
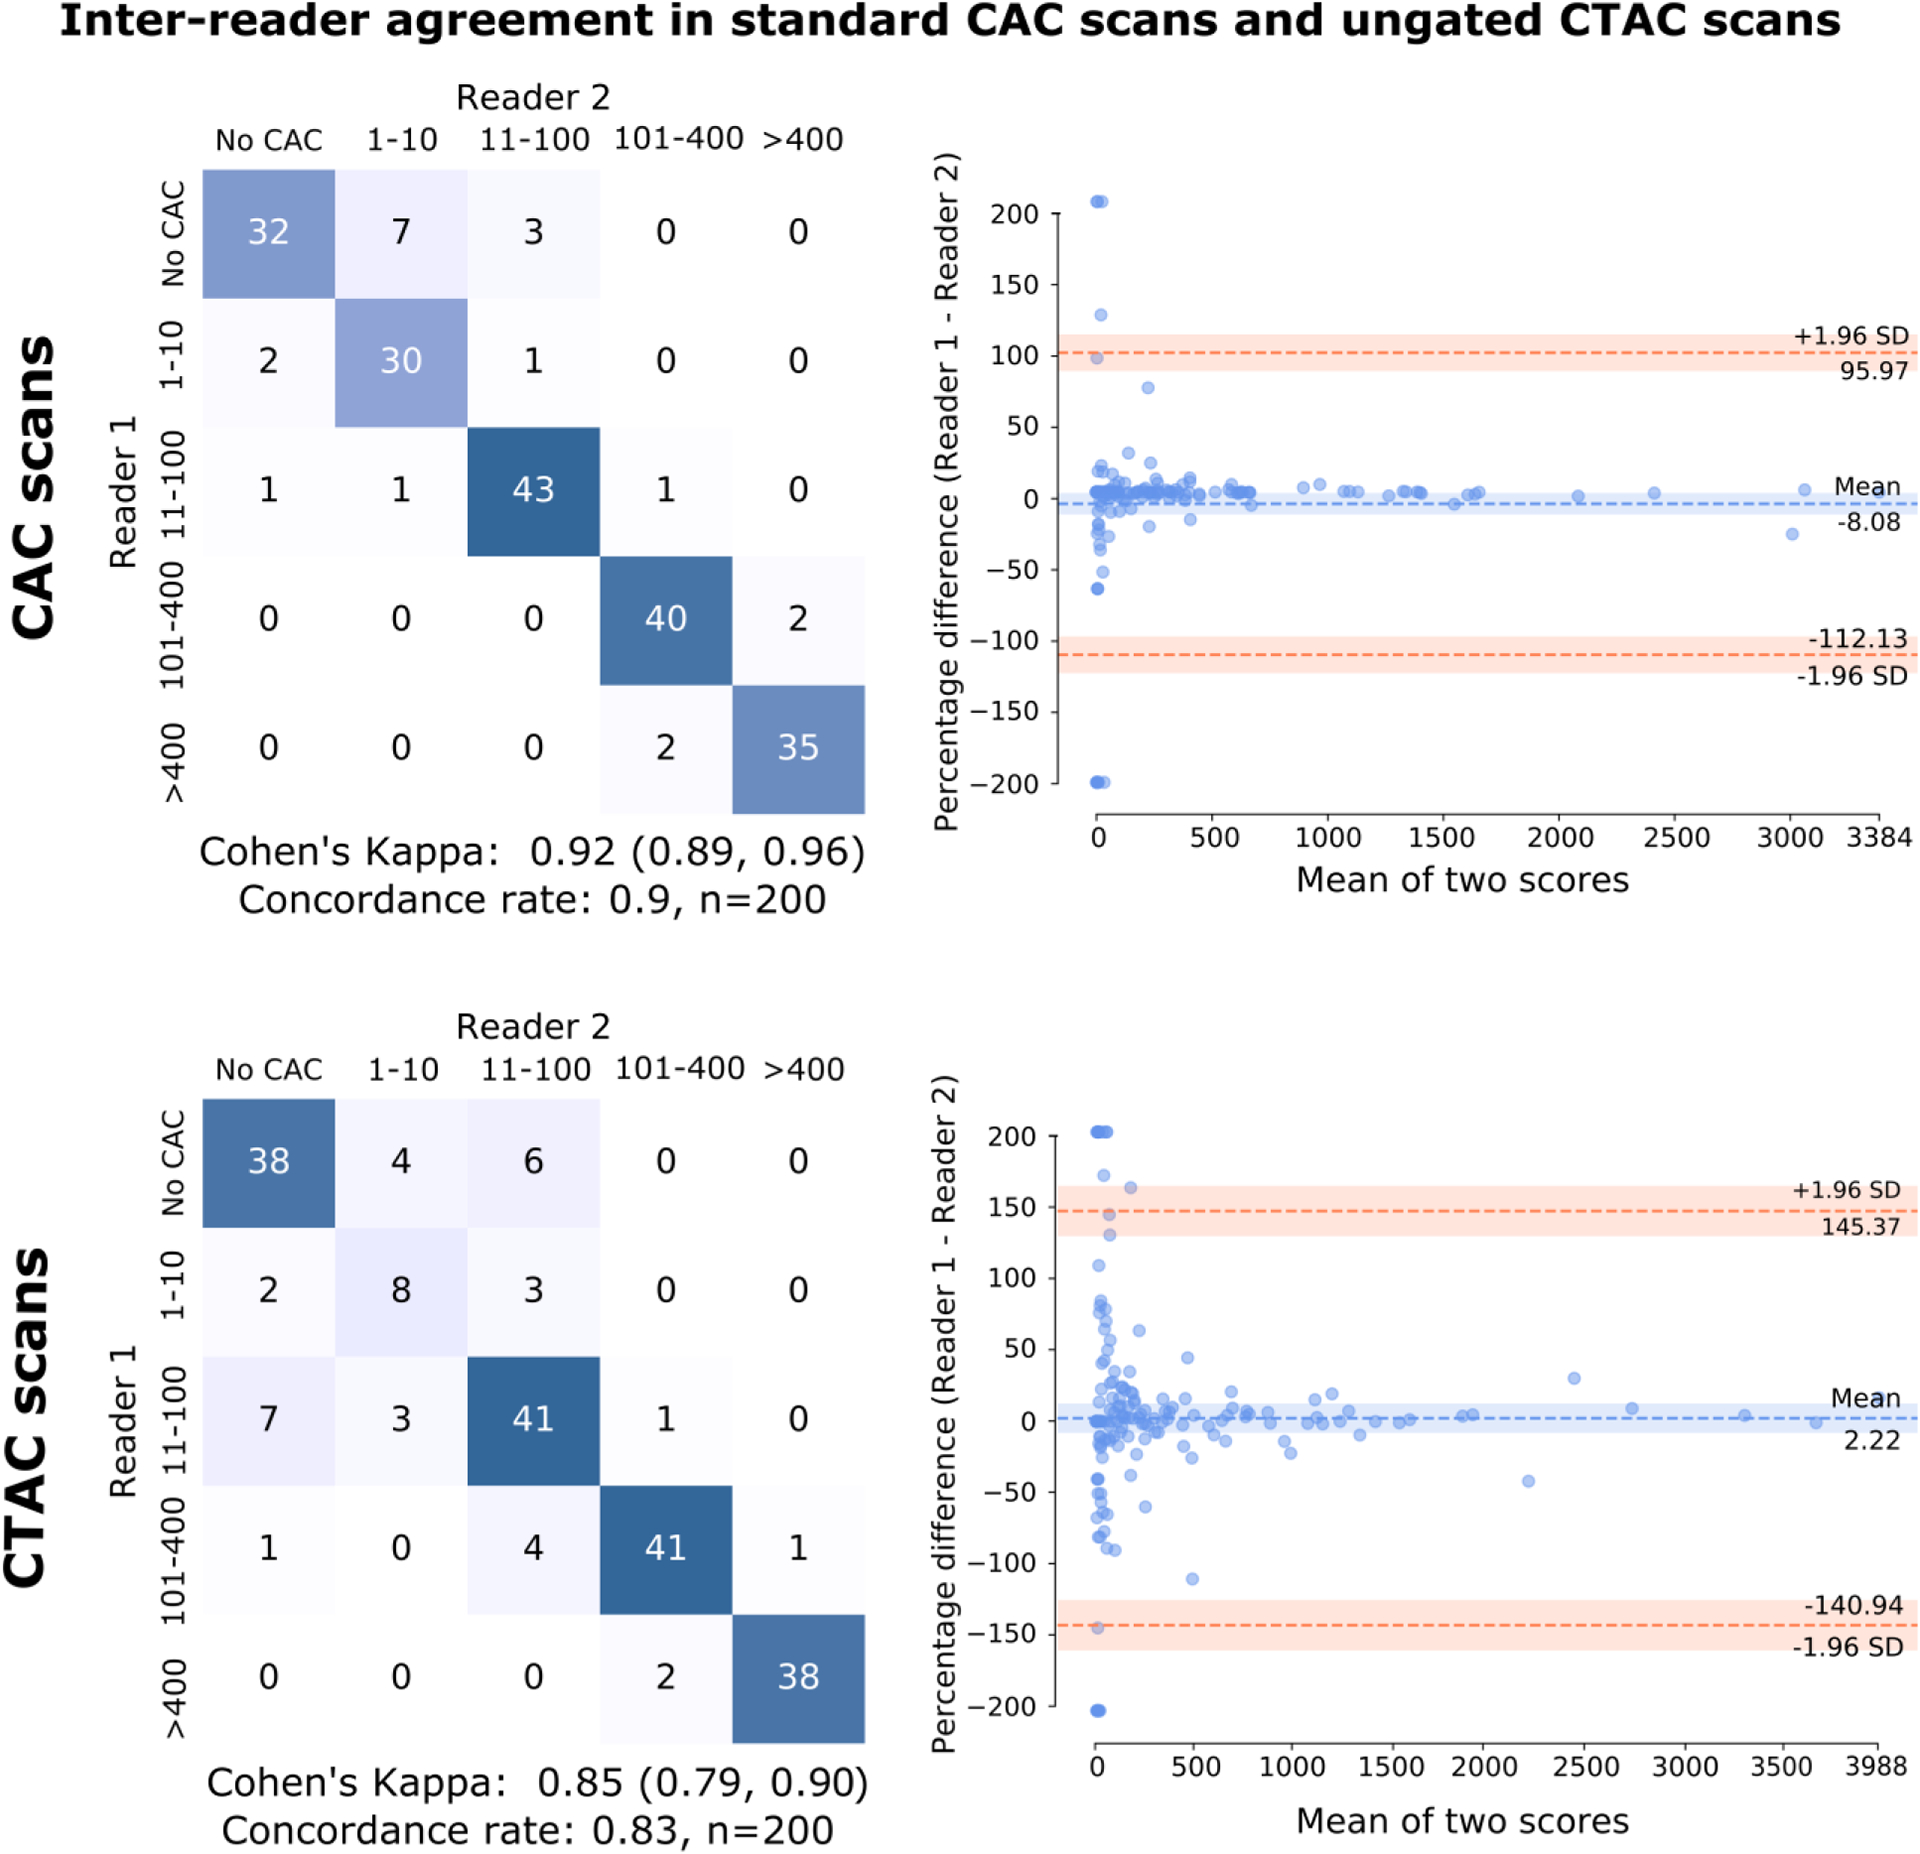
Inter-reader concordance matrices and Bland-Altman plots for ECG-gated CAC scans and ungated CTAC scans. Bland-Altman plots are composed using the percentage of difference vs. mean to better illustrate the agreement in clinically important low-calcium ranges. CAC categories: No CAC: 0, Very Low: 1–10, Low: 11–100, Moderate: 101–400, High: >400; CAC – coronary artery calcium, CTAC – computed tomography attenuation correction
Table 2.
Per-vessel inter-reader agreement (Reader 1 - Reader 2) for standard CAC scans and ungated CTAC scans.
| Compared value | Bias (95% CI) | Mean absolute difference in scores | Limits of agreement | ICC |
|---|---|---|---|---|
| CAC scans | ||||
| Total CAC score | −5.3 (−14.3, 3.8) | 12.2 | (−132.6 – 122.1) | 0.96 (0.95,0.97) |
| LM score | −3.8 (−6.7, −0.9) | 6.7 | (−44.4 – 36.9) | |
| LAD score | −0.5 (−12.1, 11.1) | 15.9 | (−163.0 – 162.1) | |
| LCX score | −1.9 (−7.5, 3.7) | 6.3 | (−80.8 – 77.0) | |
| RCA score | 0.9 (−1.5, 3.3) | 4.5 | (−32.6 – 34.4) | |
| CTAC scans | ||||
| Total CAC score | 9.0 (−7.0, 25.0) | 41.8 | (−216.1 – 234.0) | 0.90 (0.87,0.92) |
| LM score | −3.9 (−8.5, 0.7) | 11.3 | (−68.3 – 60.6) | |
| LAD score | −1.3 (−9.3, 6.8) | 17.8 | (−113.7 – 111.1) | |
| LCX score | −7.3 (−21.8, 7.3) | 22.5 | (−211.3 – 196.8) | |
| RCA score | 21.4 (2.6, 40.0) | 26.8 | (−242.3 – 285.0) |
Abbreviations: BA – Bland-Altmann, ICC – interclass correlation coefficient, CTAC – CT attenuation correction. LM – left main coronary artery, LAD – left anterior descendent coronary artery, LCX – left circumflex coronary artery, RCA – right coronary artery
Inter-scan agreement
The agreement between two different scan types for a given reader is presented in Table 3. Concordance matrices and Bland-Altman plots of percentage differences between the CTAC and standard scans are shown in Figure 4. The inter-scan agreement was not different between the two readers (Cohen’s Kappa 0.75 vs. 0.8 for Reader 1 vs. 2, p-value = 0.28). Similarly, the mean absolute difference in scores from two types of scans did not differ between readers (82.3 vs. 66.4, p=0.3). The inter-scan agreement for each reader was similar to the inter-reader agreement for CTAC scans which achieved the Kappa of 0.85 (p=0.65 and 0.63 for Reader 1 and 2, respectively).
Table 3.
Per-vessel inter-scan agreement (standard CAC scan – ungated CTAC scan) for Reader 1 and Reader 2.
| Compared value | BA bias (95% CI) | Mean absolute difference in scores | Limits of agreement | ICC |
|---|---|---|---|---|
| Reader 1 | ||||
| Total CAC score | −32.6 (−58.4, −6.8) | 82.3 | (−394.5 – 329.2) | 0.86 (0.81,0.89) |
| LM score | −0.4 (−5.0, 4.2) | 12.2 | (−64.8 – 64.0) | |
| LAD score | −15.3 (−31.1, 0.6) | 48.6 | (−237.5 – 207.0) | |
| LCX score | −9.1 (−17.9, −0.4) | 26.4 | (−131.4 – 113.2) | |
| RCA score | −7.8 (−23.8, 8.2) | 36.6 | (−232.6 – 217.0) | |
| Reader 2 | ||||
| Total CAC score | −18.4 (−39.4, 2.5) | 66.4 | (−311.9 – 275.1) | 0.90 (0.87,0.92) |
| LM score | −0.5 (−4.7, 3.7) | 10.7 | (−58.9 – 57.8) | |
| LAD score | −16.1 (−31.4, −0.8) | 45.9 | (−230.9 – 198.8) | |
| LCX score | −14.5 (−30.9, 1.9) | 30.7 | (−244.5 – 215.5) | |
| RCA score | 12.7 (−1.9, 27.2) | 34.1 | (−191.6 – 217.0) |
Abbreviations: BA – Bland-Altmann, ICC – interclass correlation coefficient, CTAC – CT attenuation correction. LM – left main coronary artery, LAD – left anterior descendent coronary artery, LCX – left circumflex coronary artery, RCA – right coronary artery
Fig. 4.
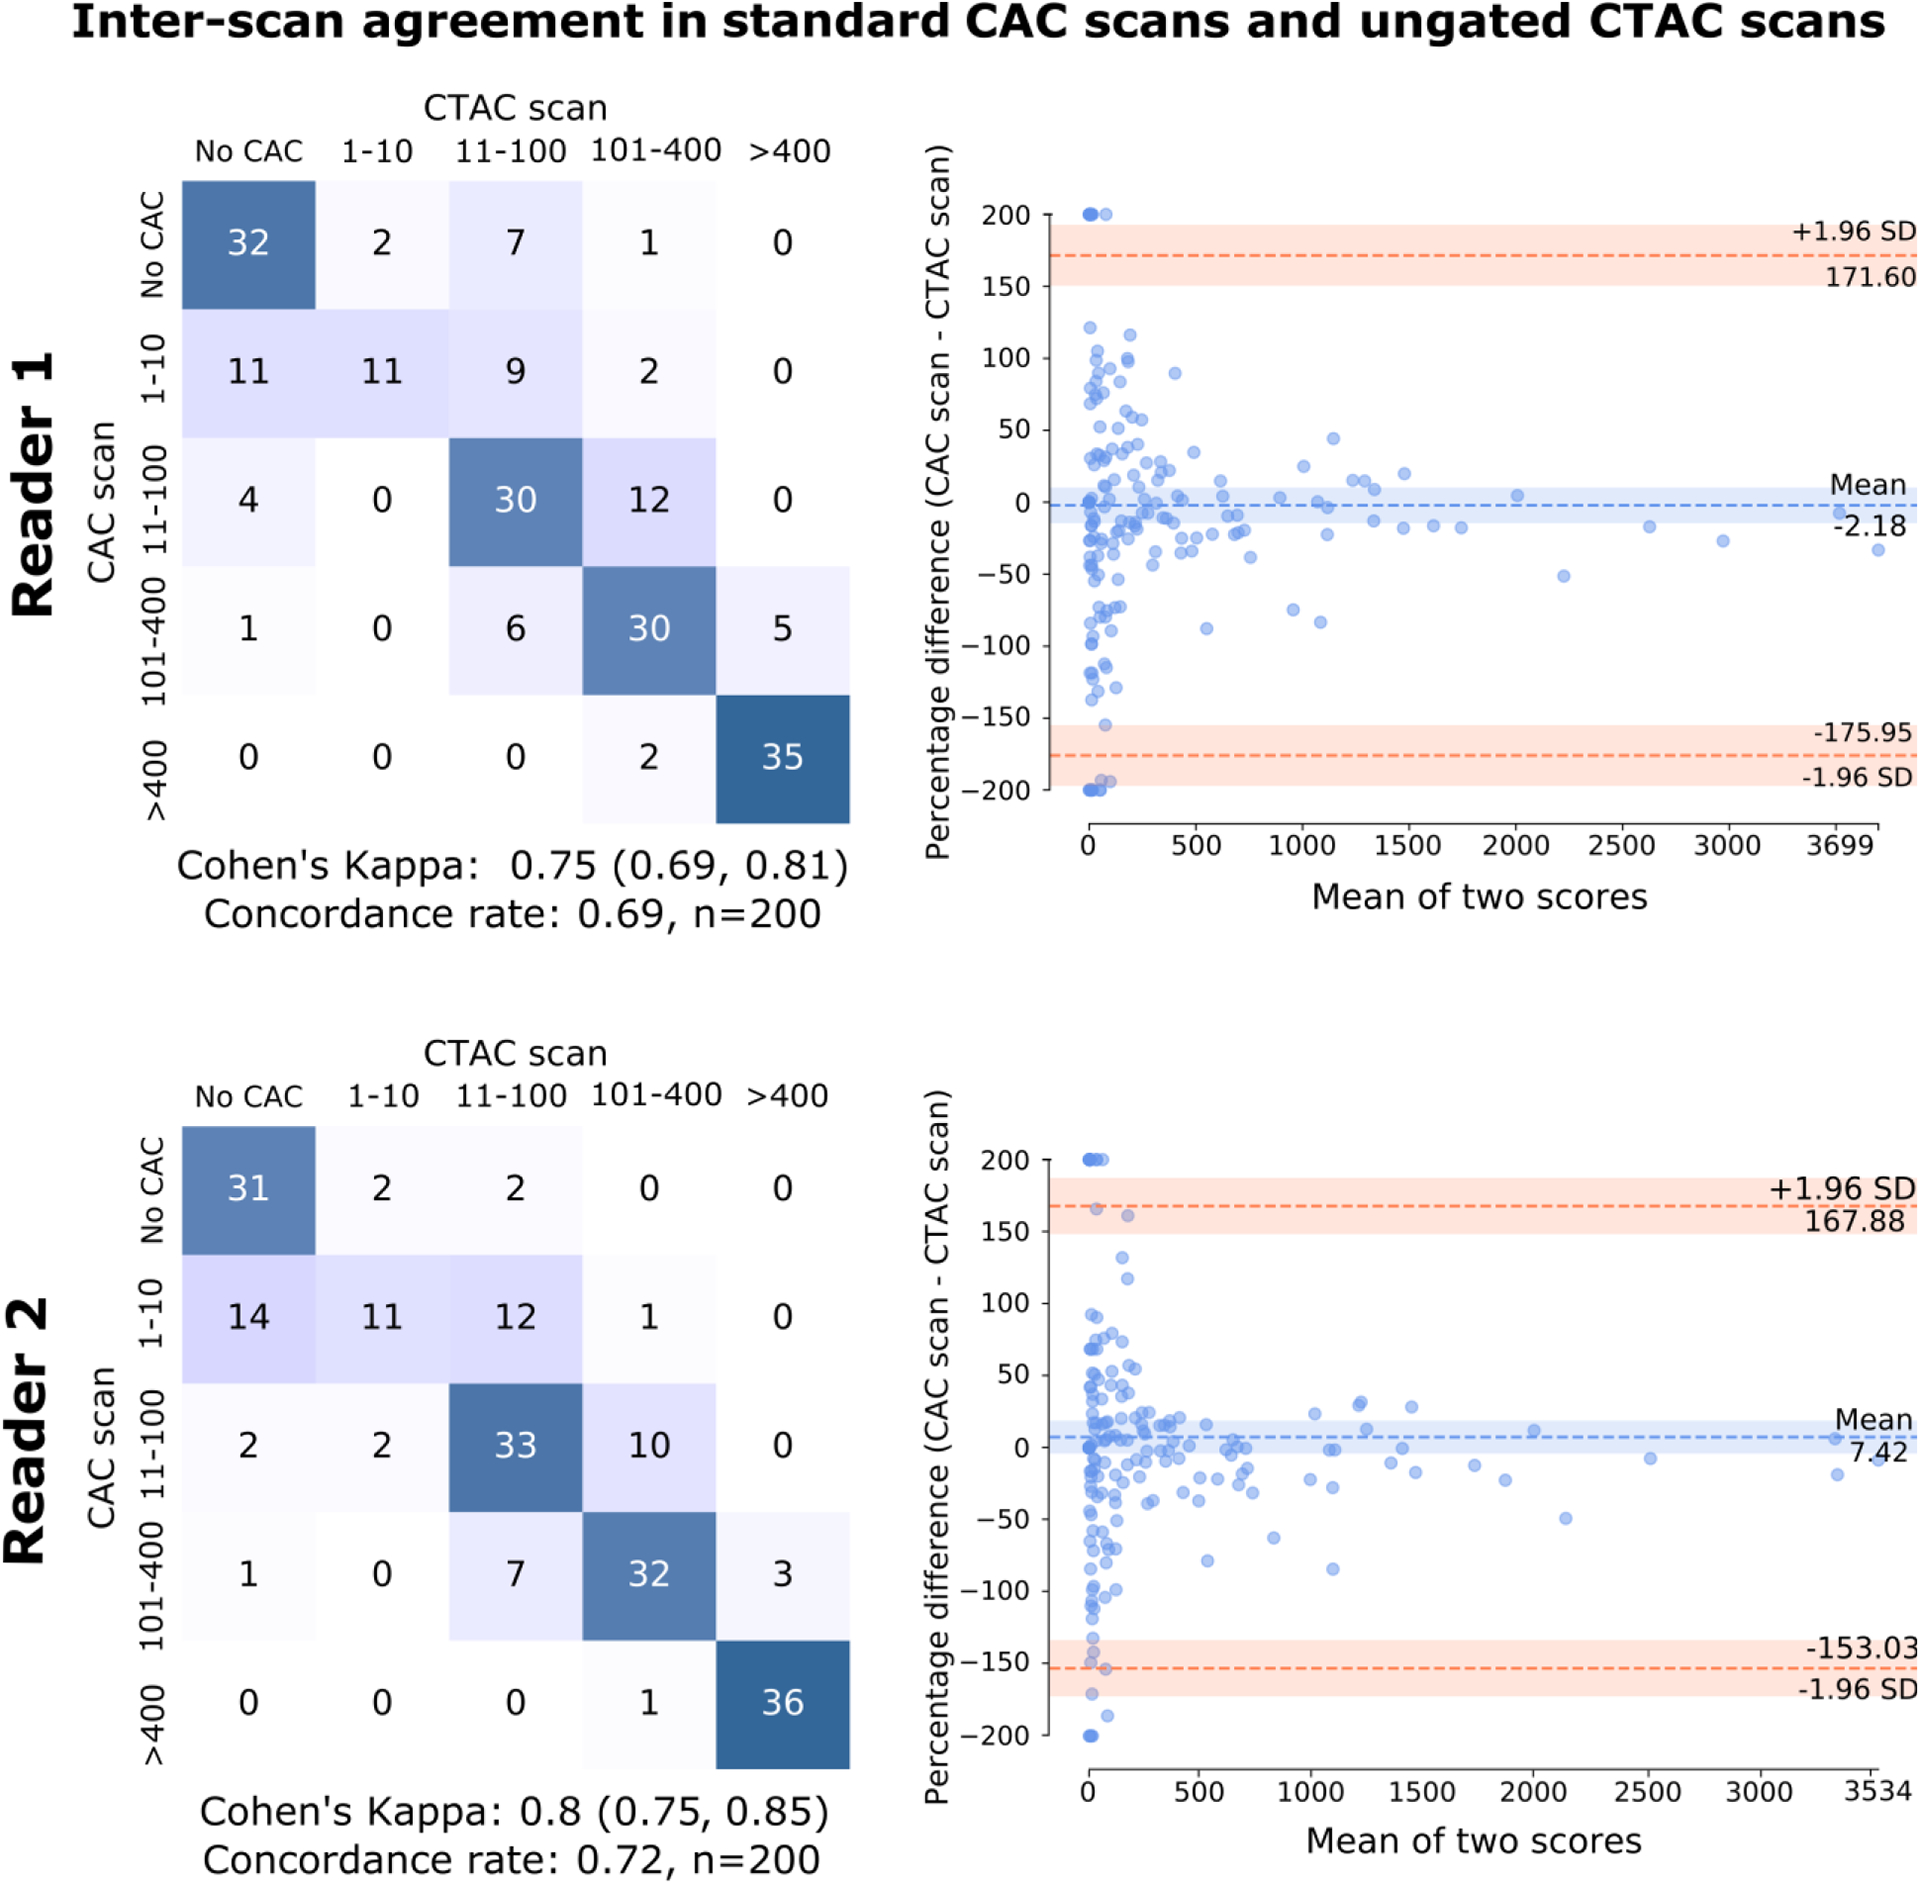
Inter scan concordance matrices and Bland-Altman plots for ECG-gated CAC scan and low-dose ungated CTAC scan by the same reader. Bland-Altman plots are composed using the percentage of difference vs. mean to better illustrate the agreement in clinically important low-calcium ranges. CAC categories: No CAC: 0, Very Low: 1–10, Low: 11–100, Moderate: 101–400, High: >400; CAC – coronary artery calcium, CTAC – computed tomography attenuation correction
In general, reader scores on CTAC overestimated the standard CAC scores (Table 3). The most frequent misclassification was missing calcium in cases where the score in standard CAC scan was between 1 and 10.
Image review
Examples of CTAC and standard CAC scans with expert readers’ scores are shown for the cases with very high calcium scores (Figure 5) and cases with moderate to low calcium scores (Figure 6).
Fig. 5.
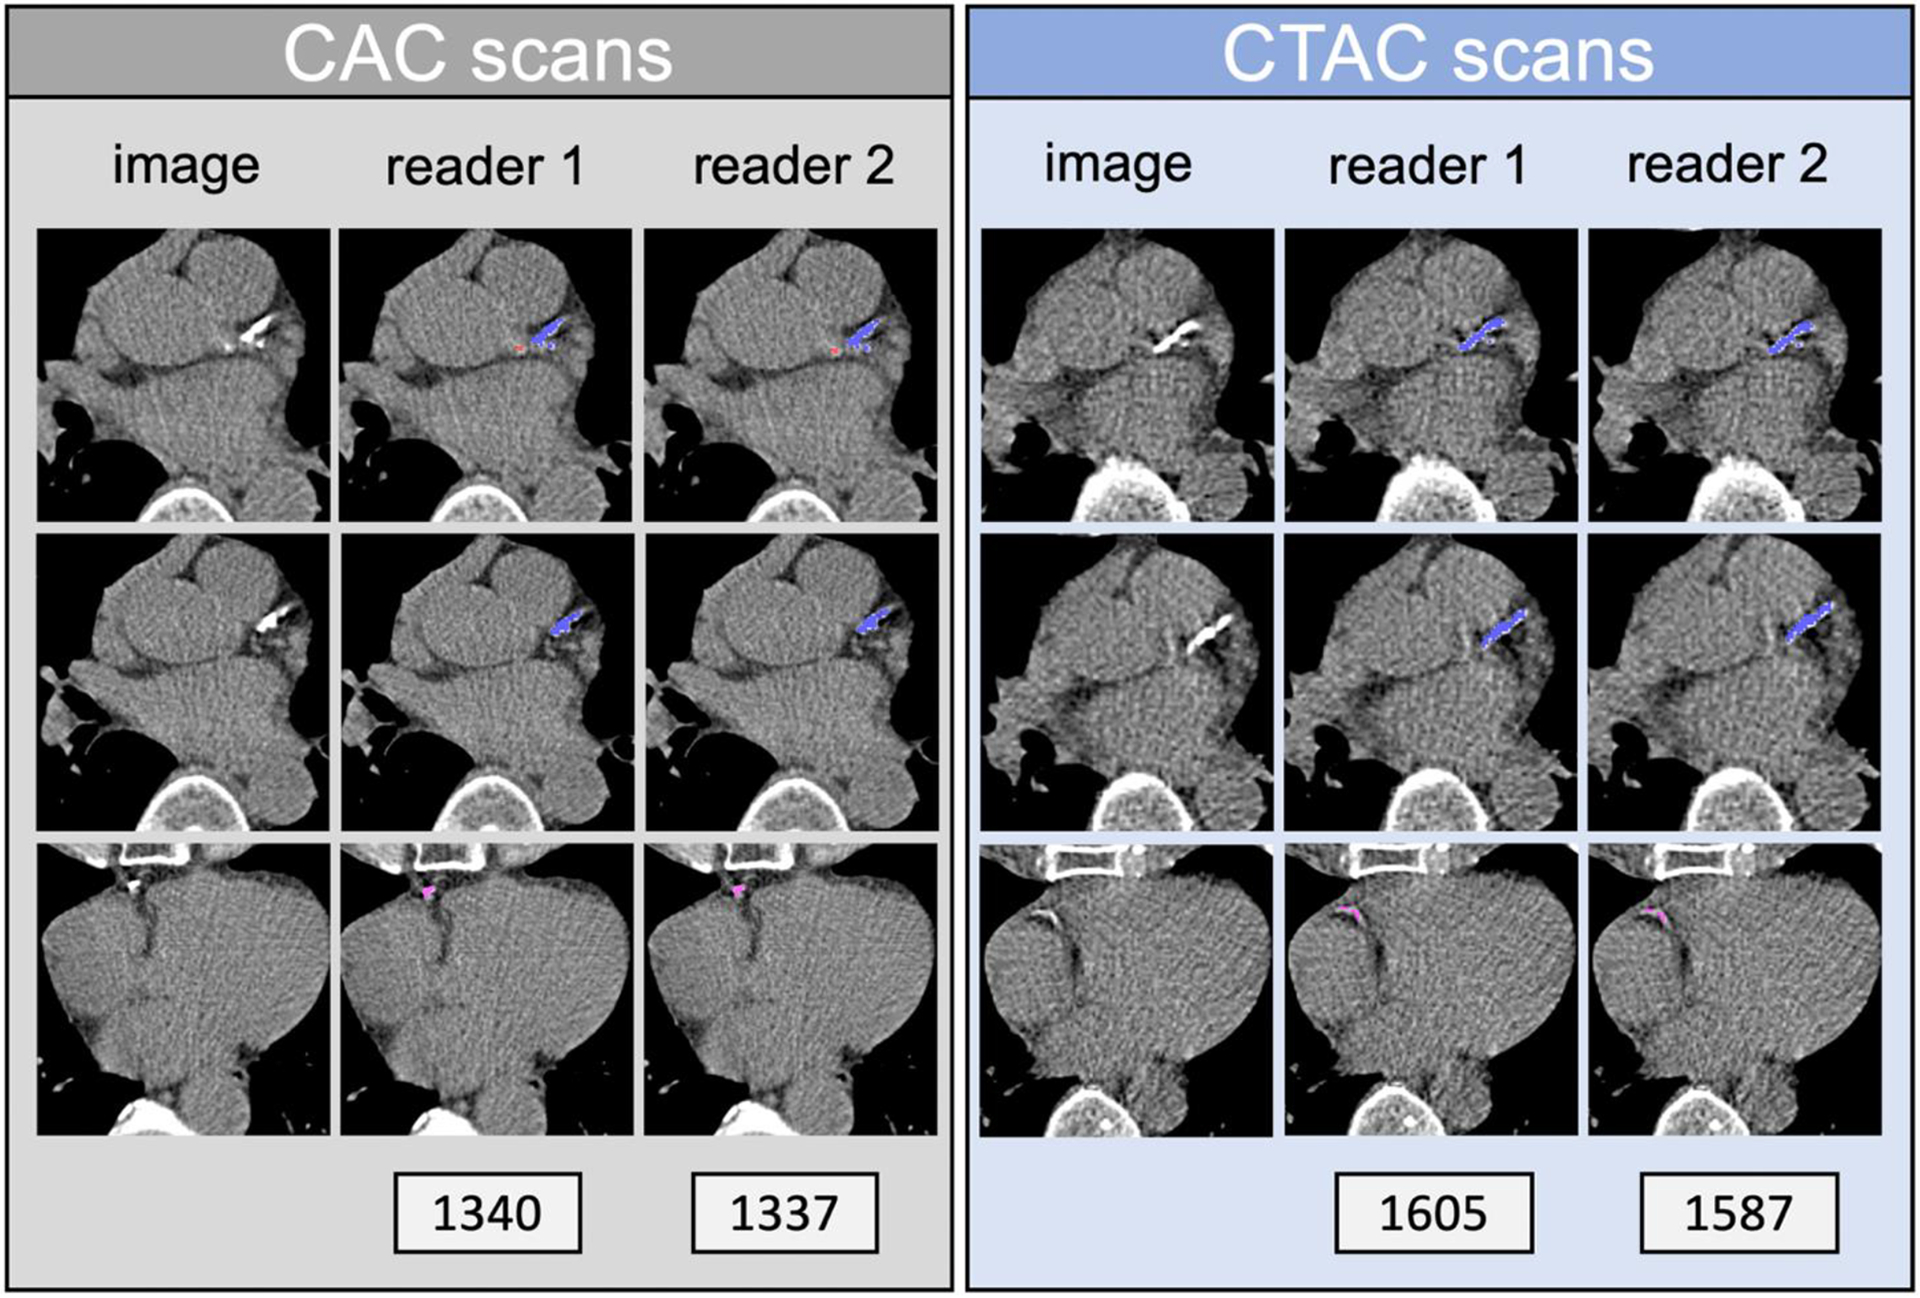
CAC and CTAC scans scored by two readers. The patient is a 76-year-old male (BMI 24). CAC scores are given for CAC (grey) and CTAC (blue) readings, Reader 1 and 2, respectively. The color of the calcium mask corresponds with the coronary artery identified by the reader: red – left main coronary artery; dark blue – left anterior descendent; pink – right coronary artery. BMI: body mass index.
Fig. 6.
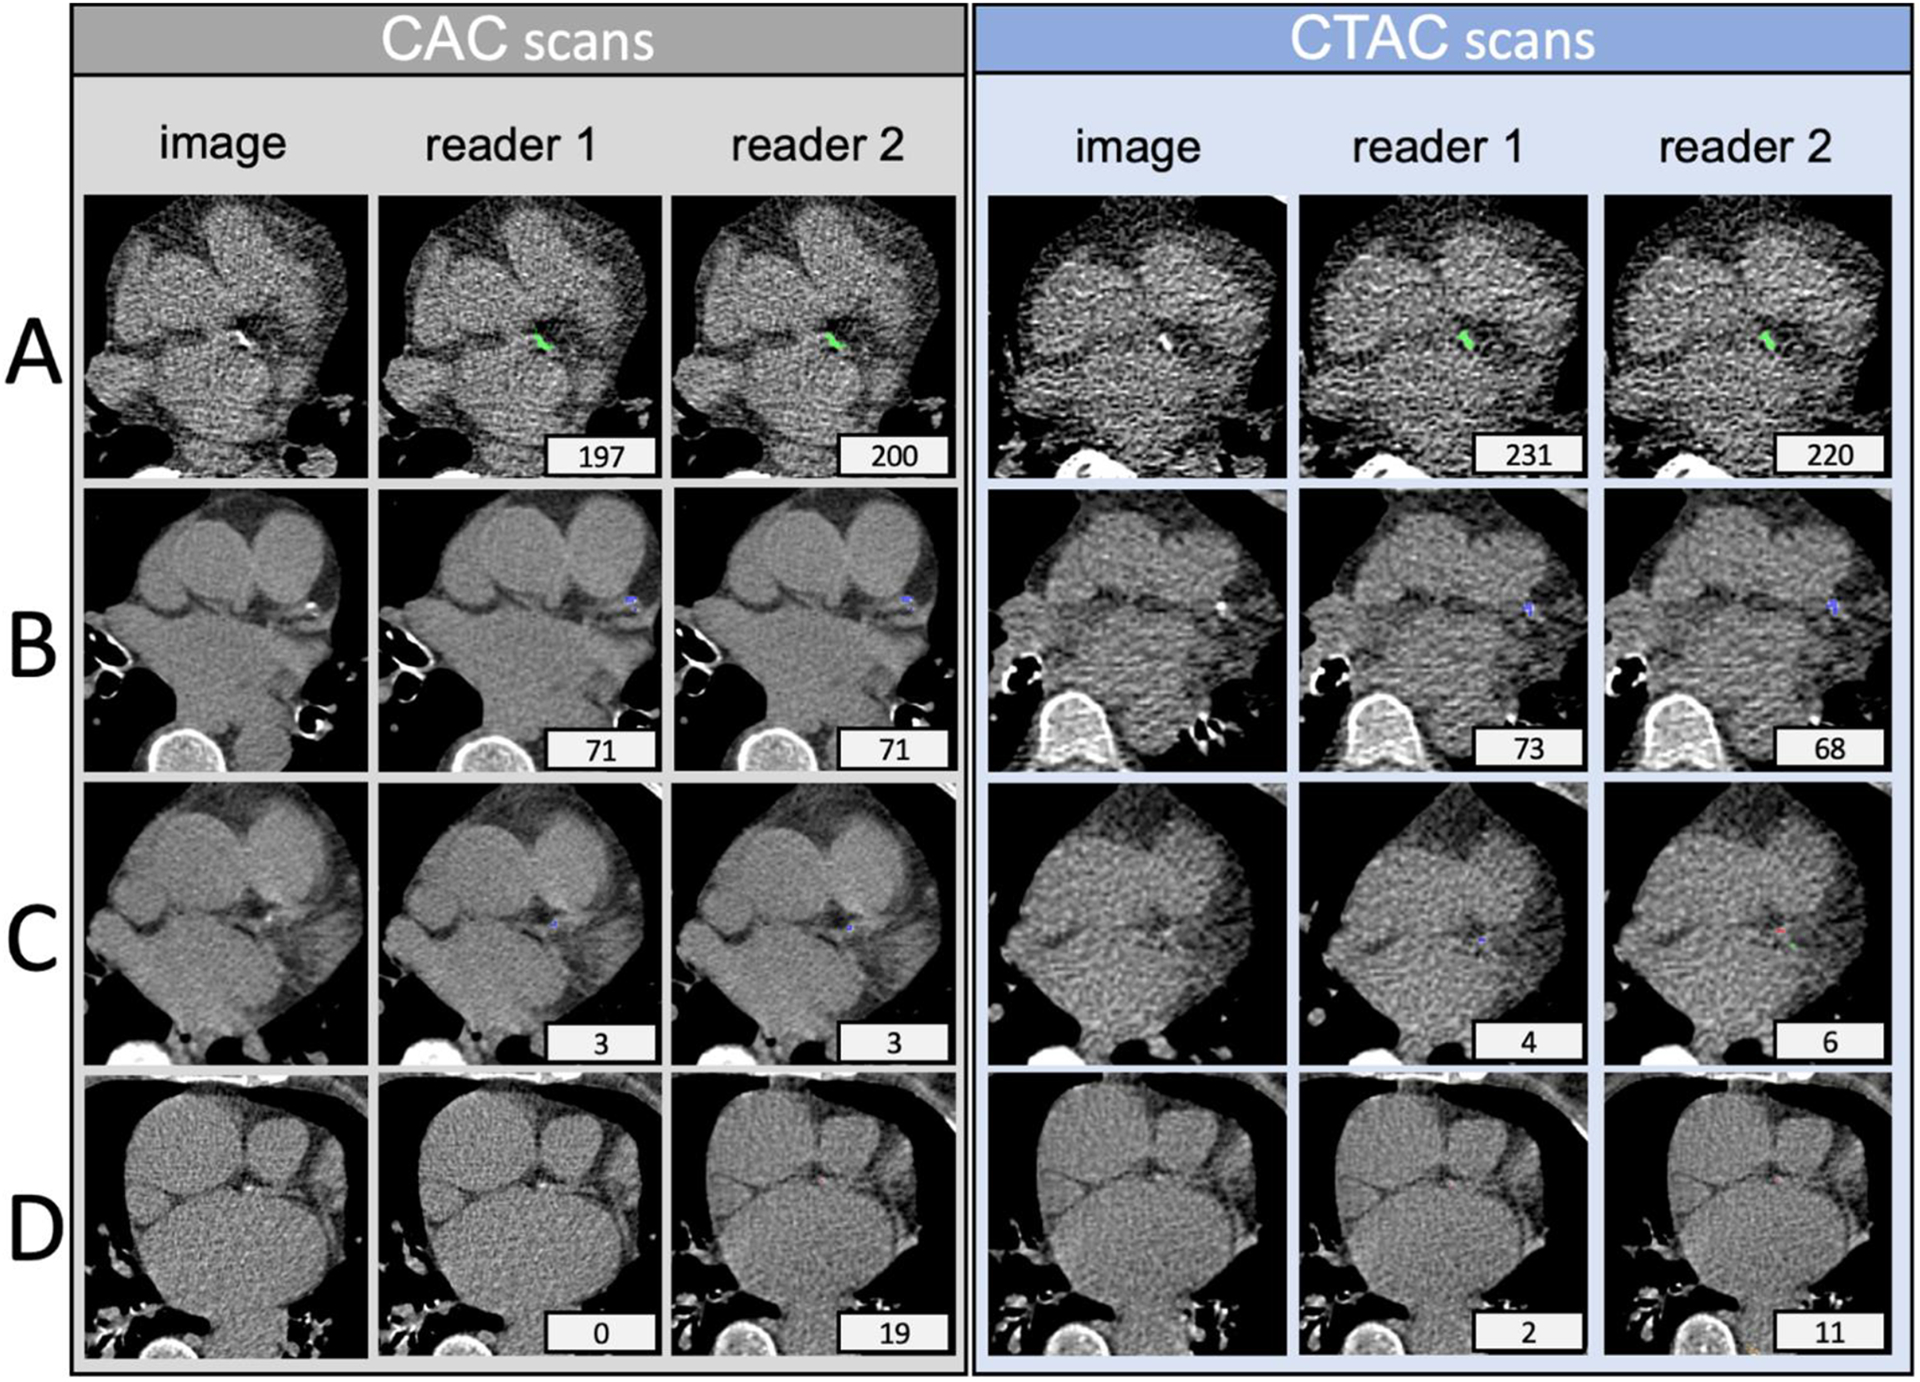
CAC and CTAC scan scored by two readers. Patient A is a 76-year-old male (BMI 39); patient B is a 70-year-old female (BMI 28); Patient C is a 69-year-old female (BMI 25); patient D is a 73-year-old female (BMI 24); Standard CAC scores are given for standard CAC (grey) and CTAC (blue) readings, Reader 1 and 2, respectively. The color of the calcium mask corresponds to the coronary artery as identified by the reader: red – left main coronary artery; dark blue – left anterior descendent; green – circumflex artery. BMI: body mass index.
Discussion
We show that the CTAC scan, which is routinely acquired with every PET MPI, can be successfully used for quantitative CAC scoring. The role of CAC quantification in non-contrast, ungated CT scans had been previously studied[11–13]. CAC scores from ungated CT scans were shown to have good correlation and agreement with standard CAC scores[11] and discriminate the mortality risk similarly[13]. Furthermore, integration of quantitative CAC scores from CTAC scans with myocardial perfusion and flow was shown to improve the accuracy of 82Rb PET/CT myocardial perfusion imaging for regional prediction of CAD[12]. As a result, it is currently recommended to include CAC information in lung cancer screening reports when moderate to severe calcifications are observed[14]. However, no prior study has directly compared both inter-reader and inter-scan agreement between standard CAC scores and CTAC scores.
Category-wise, the inter-reader agreement in CTAC scans was comparable to the inter-scan agreement, albeit worse than that between readers in standard CAC scans. Importantly, the CTAC scan is associated with a minimal radiation dose of 0.2–0.3 mSv, while a standard CAC scan involves up to an order of magnitude larger dose. The results of our study show that the quantitative scoring from CTAC is a viable alternative to performing a dedicated standard CAC scan during PET/CT scan for this purpose. Notably, the balanced dataset with a sample size larger than in any previous studies that analyzed the inter-scan agreement of CTAC[15, 16] allowed for reliable analysis in all CAC score categories.
In the US alone, there are over 2 million PET/CT scans performed annually[17]. In this context, CAC scoring from CTAC could be performed for every whole body or thoracic PET/CT, potentially providing additional information for risk stratification of CAD for millions of patients. Indeed, CAC scores were shown to provide valuable prognostic information for populations of oncologic patients as well as patients at high risk of cancer. For instance, it was shown that visual CAC score obtained from low-dose CT performed for cancer screening as a part of the National Lung Screening Trial (NLST) was an independent predictor of all-cause mortality and cardiovascular events[18, 19]. Similar results were reported using quantitative CAC scores in the Dutch-Belgian Randomized Lung Cancer Screening Trial (NELSON)[20]. Furthermore, quantitative CAC scores stratified the risk of acute coronary events in patients undergoing radiotherapy for breast cancer[21]. We demonstrate that ubiquitous CTAC scans available in millions of patients undergoing PET studies can be used for quantitative CAC analysis, allowing assessment of individual cardiovascular risk and potentially affecting patient management. In contrast, the lack of reimbursement for standard CAC scans with MPI studies and additional radiation makes it unlikely to perform standard CAC scans routinely in PET/CT patients.
Our findings remain in line with investigations that showed good agreement of visually estimated CAC scores in PET and SPECT CTAC scans [22] as well as quantitative CAC scoring in low-dose CT for cancer screening[23]. Previous studies investigating the agreement in quantitative CAC scores from PET CTAC used standard CAC scans that were either acquired on a separate occasion within 6 months from PET/CT[15] or originated from several different readers[16], which might have introduced some additional inter-observer variability. However, none of the studies to date evaluated both inter-reader agreement. We compared scores by two independent readers on two different scan protocols and the variability between readers, allowing for the comparison of inter-scan and inter-reader agreements.
While we demonstrate good inter-reader agreement from both CTAC and standard CT scans, the agreement is nevertheless lower for CTAC scans than for the standard CAC scans (Cohen’s Kappa 0.89 vs. 0.92, p=0.016). For the inter-scan agreement, we show that categories of CAC scores quantitatively obtained from CTAC maps are concordant with scores standard CAC scans assessed by the same reader in up to 72% of cases, with Cohen’s Kappa of 0.8, with only 6 cases disagreeing by more than one class. Some inter-scan disagreement is understandable, as the lower tube voltage and lack of ECG-triggering contribute to more noise, partial volume effects, and motion artifacts[24]. The difference in overall quality and image characteristics between standard CAC and CTAC scans is visible in Figures 4 and 5. Nevertheless, the inter-scan agreement is not significantly different on CTAC scans as compared to standard CAC scans.
Our study has some limitations. Our cohort was selected from a single site using a scanner from a single vendor and single quantitative software. Previous studies have shown that different quantitative software tools have a greater impact on inter-reader variability on CAC scan readings than the use of different CT scanners[25]. Our study focused on assessing the inter-scan variability due to the protocol difference on the same scanner and inter-reader variability for the same scan. We also did not analyze the interplay between CAC, coronary perfusion, and flow measurements PET and patient outcomes; this topic has been covered in other studies[26].
Conclusions
CAC can be quantitatively assessed on PET ultra-low-dose CTAC maps without modifying standard thoracic PET/CT protocols. The CTAC CAC scores show good agreement with standard CAC scoring protocol, albeit worse than the agreement between two readers on standard CAC scan.
Supplementary Material
Acknowledgments
This research was supported in part by grant R01HL089765 from the National Heart, Lung, and Blood Institute/ National Institutes of Health (NHLBI/NIH) (PI: Piotr Slomka). The content is solely the responsibility of the authors and does not necessarily represent the official views of the National Institutes of Health.
Conflict of Interest
Drs. Berman, Slomka, and Van Kriekinge participate in software royalties for nuclear cardiology software at Cedars-Sinai Medical Center. Dr. Slomka has received research grant support from Siemens Medical Systems. Drs. Berman has served as a consultant for GE Healthcare. Dr. Pieszko was supported by the Polish Agency of International Academic Exchange (NAWA). The remaining authors have no relevant disclosures.
Abbreviations
- CAC
coronary artery calcium
- CABG
coronary artery bypass grafting
- CT
computed tomography
- CTAC
computed tomography attenuation correction
- ECG
electrocardiogram
- IQR
inter-quartile range
- LAD
left anterior descending coronary artery
- LCX
left circumflex coronary artery
- LM
left main coronary artery
- MPI
myocardial perfusion imaging
- PET/CT
positron emission tomography/ computed tomography
- RCA
right coronary artery
- SPECT
single-photon emission computed tomography
- PCI
percutaneous coronary intervention
Footnotes
Ethical approval
This study complies with the Declaration of Helsinki. The institutional review board at Cedars-Sinai as well as at the participating sites approved the collection of data for the registry. Informed consent has been obtained from the subjects (or their legally authorized representative).
Data availability
The imaging protocols, and results generated and analysed in the course of the study are available from the corresponding author on reasonable written request. The imaging data are not currently publicly available due to IRB, data sharing agreements’ restrictions.
References:
- 1.Shaw LJ, Raggi P, Schisterman E, Berman DS, Callister TQ. Prognostic value of cardiac risk factors and coronary artery calcium screening for all-cause mortality. Radiology. 2003;228:826–33. doi: 10.1148/radiol.2283021006. [DOI] [PubMed] [Google Scholar]
- 2.Budoff MJ, Gul KM. Expert review on coronary calcium. Vascular Health and Risk Management. 2008;4:315–24. doi: 10.2147/vhrm.s1160. [DOI] [PMC free article] [PubMed] [Google Scholar]
- 3.Engbers EM, Timmer JR, Mouden M, Knollema S, Jager PL, Ottervanger JP. Changes in cardiovascular medication after coronary artery calcium scanning and normal single photon emission computed tomography myocardial perfusion imaging in symptomatic patients. American Heart Journal. 2017;186:56–62. doi: 10.1016/j.ahj.2017.01.009. [DOI] [PubMed] [Google Scholar]
- 4.Agatston AS, Janowitz WR, Hildner FJ, Zusmer NR, Viamonte M, Detrano R. Quantification of coronary artery calcium using ultrafast computed tomography. Journal of the American College of Cardiology. 1990;15:827–32. doi: 10.1016/0735-1097(90)90282-T. [DOI] [PubMed] [Google Scholar]
- 5.Alluri K, Joshi PH, Henry TS, Blumenthal RS, Nasir K, Blaha MJ. Scoring of coronary artery calcium scans: History, assumptions, current limitations, and future directions. Atherosclerosis. 2015;239:109–17. doi: 10.1016/j.atherosclerosis.2014.12.040. [DOI] [PubMed] [Google Scholar]
- 6.Kajinami K, Seki H, Kakekoshi N, Mabuchi H. Quantification of coronary artery calcification using ultrafast computed tomography: Reproducibility of measurments. Coronary Artery Disease. 1993;4:1103–8. [DOI] [PubMed] [Google Scholar]
- 7.Budoff MJ, Nasir K, Kinney GL, Hokanson JE, Barr RG, Steiner R, et al. Coronary artery and thoracic calcium on noncontrast thoracic CT scans: Comparison of ungated and gated examinations in patients from the COPD Gene cohort. Journal of Cardiovascular Computed Tomography. 2011;5:113–8. doi: 10.1016/j.jcct.2010.11.002. [DOI] [PMC free article] [PubMed] [Google Scholar]
- 8.Engbers EM, Timmer JR, Ottervanger JP, Mouden M, Knollema S, Jager PL. Prognostic value of coronary artery calcium scoring in addition to single-photon emission computed tomographic myocardial perfusion imaging in symptomatic patients. Circulation: Cardiovascular Imaging. 2016;9:1–9. doi: 10.1161/CIRCIMAGING.115.003966. [DOI] [PubMed] [Google Scholar]
- 9.Trpkov C, Savtchenko A, Liang Z, Feng P, Southern DA, Wilton SB, et al. Visually estimated coronary artery calcium score improves SPECT-MPI risk stratification. IJC Heart & Vasculature. 2021;35:100827-. doi: 10.1016/j.ijcha.2021.100827. [DOI] [PMC free article] [PubMed] [Google Scholar]
- 10.Rumberger JA, Brundage BH, Rader DJ, Kondos G. Electron Beam Computed Tomographic Coronary Calcium Scanning: A Review and Guidelines for Use in Asymptomatic Persons. Mayo Clinic Proceedings. 1999;74:243–52. doi: 10.4065/74.3.243. [DOI] [PubMed] [Google Scholar]
- 11.Almeida SO, Honoris L, Defranco A, Port S, Li D, Nasir K, et al. Reliability of CAC Scoring on Nongated Compared With Gated Cardiac CT Scans From MESA. JACC Cardiovascular imaging. 2020;13:177–8. doi: 10.1016/j.jcmg.2019.08.007. [DOI] [PMC free article] [PubMed] [Google Scholar]
- 12.Zampella E, Acampa W, Assante R, Nappi C, Gaudieri V, Mainolfi CG, et al. Combined evaluation of regional coronary artery calcium and myocardial perfusion by 82Rb PET/CT in the identification of obstructive coronary artery disease. European Journal of Nuclear Medicine and Molecular Imaging. 2018;45:521–9. doi: 10.1007/s00259-018-3935-1. [DOI] [PubMed] [Google Scholar]
- 13.Hughes-Austin JM, Dominguez A 3rd, Allison MA, Wassel CL, Rifkin DE, Morgan CG, et al. Relationship of Coronary Calcium on Standard Chest CT Scans With Mortality. JACC Cardiovascular imaging. 2016;9:152–9. doi: 10.1016/j.jcmg.2015.06.030. [DOI] [PMC free article] [PubMed] [Google Scholar]
- 14.Hecht HS, Cronin P, Blaha MJ, Budoff MJ, Kazerooni EA, Narula J, et al. 2016 SCCT/STR guidelines for coronary artery calcium scoring of noncontrast noncardiac chest CT scans: A report of the Society of Cardiovascular Computed Tomography and Society of Thoracic Radiology. Journal of cardiovascular computed tomography. 2017;11:74–84. doi: 10.1016/j.jcct.2016.11.003. [DOI] [PubMed] [Google Scholar]
- 15.Mylonas I, Kazmi M, Fuller L, De Kemp RA, Yam Y, Chen L, et al. Measuring coronary artery calcification using positron emission tomography-computed tomography attenuation correction images. European Heart Journal Cardiovascular Imaging. 2012;13:786–92. doi: 10.1093/ehjci/jes079. [DOI] [PubMed] [Google Scholar]
- 16.Išgum I, de Vos BD, Wolterink JM, Dey D, Berman DS, Rubeaux M, et al. Automatic determination of cardiovascular risk by CT attenuation correction maps in Rb-82 PET/CT. Journal of Nuclear Cardiology. 2018;25:2133–42. doi: 10.1007/s12350-017-0866-3. [DOI] [PMC free article] [PubMed] [Google Scholar]
- 17.Czernin J, Allen-Auerbach M, Nathanson D, Herrmann K. PET/CT in Oncology: Current Status and Perspectives. Curr Radiol Rep. 2013;1:177–90. doi: 10.1007/s40134-013-0016-x. [DOI] [PMC free article] [PubMed] [Google Scholar]
- 18.Chiles C, Duan F, Gladish GW, Ravenel JG, Baginski SG, Snyder BS, et al. Association of Coronary Artery Calcification and Mortality in the National Lung Screening Trial: A Comparison of Three Scoring Methods. Radiology. 2015;276:82–90. doi: 10.1148/radiol.15142062. [DOI] [PMC free article] [PubMed] [Google Scholar]
- 19.Al-Salem AH, Nawaz A, Matta H, Jacobsz A. Herniation through the foramen of Morgagni: early diagnosis and treatment. Pediatric surgery international. 2002;18:93–7. doi: 10.1007/s003830100653. [DOI] [PubMed] [Google Scholar]
- 20.Jacobs PC, Gondrie MJ, van der Graaf Y, de Koning HJ, Isgum I, van Ginneken B, et al. Coronary artery calcium can predict all-cause mortality and cardiovascular events on low-dose CT screening for lung cancer. AJR Am J Roentgenol. 2012;198:505–11. doi: 10.2214/ajr.10.5577. [DOI] [PubMed] [Google Scholar]
- 21.Roos CTG, van den Bogaard VAB, Greuter MJW, Vliegenthart R, Schuit E, Langendijk JA, et al. Is the coronary artery calcium score associated with acute coronary events in breast cancer patients treated with radiotherapy? Radiother Oncol. 2018;126:170–6. doi: 10.1016/j.radonc.2017.10.009. [DOI] [PubMed] [Google Scholar]
- 22.Einstein AJ, Johnson LL, Bokhari S, Son J, Thompson RC, Bateman TM, et al. Agreement of visual estimation of coronary artery calcium from low-dose CT attenuation correction scans in hybrid PET/CT and SPECT/CT with standard agatston score. Journal of the American College of Cardiology. 2010;56:1914–21. doi: 10.1016/j.jacc.2010.05.057. [DOI] [PMC free article] [PubMed] [Google Scholar]
- 23.Wu MT, Yang P, Huang YL, Chen JS, Chuo CC, Yeh C, et al. Coronary arterial calcification on low-dose ungated MDCT for lung cancer screening: Concordance study with dedicated cardiac CT. American Journal of Roentgenology. 2008;190:923–8. doi: 10.2214/AJR.07.2974. [DOI] [PubMed] [Google Scholar]
- 24.Horiguchi J, Fukuda H, Yamamoto H, Hirai N, Alam F, Kakizawa H, et al. The impact of motion artifacts on the reproducibility of repeated coronary artery calcium measurements. European Radiology. 2007;17:81–6. doi: 10.1007/s00330-006-0278-2. [DOI] [PubMed] [Google Scholar]
- 25.Ghadri JR, Goetti R, Fiechter M, Pazhenkottil AP, Kest SM, Nkoulou RN, et al. Inter-scan variability of coronary artery calcium scoring assessed on 64-multidetector computed tomography vs. dual-source computed tomography: A head-to-head comparison. European Heart Journal. 2011;32:1865–74. doi: 10.1093/eurheartj/ehr157. [DOI] [PubMed] [Google Scholar]
- 26.Naya M, Murthy VL, Foster CR, Gaber M, Klein J, Hainer J, et al. Prognostic interplay of coronary artery calcification and underlying vascular dysfunction in patients with suspected coronary artery disease. Journal of the American College of Cardiology. 2013;61:2098–106. doi: 10.1016/j.jacc.2013.02.029. [DOI] [PMC free article] [PubMed] [Google Scholar]
Associated Data
This section collects any data citations, data availability statements, or supplementary materials included in this article.
Supplementary Materials
Data Availability Statement
The imaging protocols, and results generated and analysed in the course of the study are available from the corresponding author on reasonable written request. The imaging data are not currently publicly available due to IRB, data sharing agreements’ restrictions.


