

Abstract
Purpose:
The spatial distribution of radiopharmaceuticals within multicellular clusters is known to have a significant effect on their biologic response. Most therapeutic radiopharmaceuticals distribute nonuniformly in tissues which makes predicting responses of micrometastases challenging. The work presented here analyzes published temporally-dependent nonuniform activity-distributions within tumor spheroids treated with actinium-225-DOTA encapsulating liposomes (225Ac-liposomes) and uses these data in MIRDcell V3.11 to calculate absorbed-dose distributions and predict biologic response. The predicted responses are compared with experimental responses.
Methods:
Four types of liposomes were prepared having membranes with different combinations of release (R) and adhesion (A) properties. The combinations were R−A−, R−A+, R+A−, and R+A+. These afford different penetrating properties into tissue. The liposomes were loaded with either carboxyfluorescein diacetatesuccinimidyl ester (CFDA-SE) or 225Ac. MDA-MB-231 spheroids were treated with the CFDA-SE-liposomes, harvested at different times, and the time-integrated CFDA-SE concentration at each radial position within the spheroid was determined. This was translated into mean 225Ac decays/cell versus radial position, uploaded to MIRDcell, and the surviving fraction of cells in spherical multicellular clusters was simulated. The MIRDcell-predicted surviving fractions were compared with experimental fractional-outgrowths of the spheroids following treatment with 225Ac-liposomes.
Results:
The biologic responses of the multicellular clusters treated with 225Ac-liposomes with physicochemical properties R+A+, R−A+, and R−A− were predicted by MIRDcell with statistically significant accuracy. The prediction for R+A− was not predicted accurately.
Conclusion:
In most instances, MIRDcell predicts responses of spheroids treated with 225Ac-liposomes that result in different tissue-penetrating profiles of the delivered radionuclides.
Introduction
The Medical Internal Radiation Dose (MIRD) formalism is used to calculate absorbed dose to organs, subregions of organs, multicellular tissues, and cells from radiations emitted by radiopharmaceuticals [1, 2]. While originally conceived for calculating absorbed doses for estimating risk to normal organs from radiopharmaceuticals, the MIRD Committee later stated the importance of developing dosimetry models within the MIRD schema that can predict biological responses to radiopharmaceutical therapy (RPT) [3]. The present work focusses on modelling the response of spheroids (multicellular clusters), grown in vitro, which were treated with 225Ac-DOTA encapsulating liposome radiopharmaceuticals (225Ac-liposomes) having different physicochemical properties [4]. The spheroids, used as surrogates for micrometastases and/or tumor avascular regions, were treated with liposomes having “release” and “adhesion” properties which were designed to release their radioactive contents in the tumor interstitium and to increase the intratumoral residence times of liposomes, respectively.
The initial development of the liposomes with “release” and “adhesion” was done by Stras et al. where pH-releasing liposomal cisplatin had been used to treat spheroids made with MDA-MB-231 human triple negative breast cancer (TNBC) cells [5]. There it was demonstrated that the direct interstitial release of the drug (cisplatin), using pH-releasing liposomes that adhered on the tumor interstitium and prolonged their residence time in tumors, improved the penetration profile and the efficacy of tumor control. Furthermore, the work done by Zhu et al. with 225Ac-liposomes demonstrated the advantages of using pH-tunable liposomes to achieve more homogenous distribution of released 225Ac within the spheroids [6]. Limited and inhomogeneous drug penetration deeper into micrometastases and tumors have reduced the therapeutic efficacy of radionuclides that emit radiations with short-ranges in tissue, particularly Auger-electron and alpha-particle emitters [6–11]. Different techniques have been adopted to mitigate the concern such as altering the size of nanoparticles and use of pH-releasing liposomes [12].
The main objective of the work presented here is to evaluate the accuracy of the MIRDcell software tool to predict the biologic response of spheroids to varying spatial distributions of radiopharmaceuticals. Developed in collaboration with the MIRD Committee [13], MIRDcell provides a graphic user interface to guide the user in the selection of radionuclide, cell size, multicellular cluster geometry, and bioeffect model to calculate absorbed dose on a cell-by-cell basis and predict the surviving fraction (SF) of cells in the multicellular cluster. Here, MIRDcell V3.11 [14] is used to predict responses of tumor spheroids to 225Ac-liposomes, and compare the predictions with experimental outcomes [15].
Materials and Methods
Most of the experimental data for the spheroids analyzed in this study was published in two articles by the Sofou lab [4, 5]. Experimental responses to225Ac-DOTA-encapsulating liposomes are from Prasad et al. [4]. Spatiotemporal kinetics data for the liposomes are from Stras et al. [5]. The methods used are relevant to the dosimetry calculations and bioeffect analysis undertaken in the present work and are therefore briefly summarized below.
Preparation of 225Ac-Liposomes and Response of Spheroids
The preparation of 225Ac-DOTA-encapsulating liposomes is described elsewhere [4]. Briefly, four types of liposomes were prepared having membranes with different combinations of release and adhesion properties. The combinations of releasing (R+), non-releasing (R−), adhesion (A+), and non-adhesion (A−) membrane properties were R−A−, R−A+, R+A−, and R+A+. These liposomes were loaded with 225Ac as previously described using an ionophore (A23187) mediated active loading method [16]. The release and adhesion properties were designed to improve intratumoral uniformity of the liposomes and/or its radioactive contents, and increase the exposure times of the tumor cells to the delivered therapeutics [12].
Spheroids were formed by seeding MDA-MB-231 human breast cancer cells (in Matrigel™) as described before [4, 17]. The Sofou lab has found that these are essentially spherical with the short and long axes typically differing by less than 5%. When spheroids reached 400 μm-diameter, they were treated with 0 or 9.25 kBq/mL 225Ac-liposomes (R−A−, R−A+, R+A−, and R+A+) for 6 h, and then transferred into fresh media. The spheroid volume (V=4*π*a*b2/3) was monitored until the volume of untreated spheroids reached an asymptote. The spheroids were then plated on adherent 96-well plates (1/well) for evaluation of the extent of outgrowth. Extent of outgrowth was quantified by waiting until the untreated condition reached confluency. Spheroids were then trypsinized and the number of cells in each well were counted. The cell counts were normalized by the number of cells in the untreated condition, and this was taken as the %outgrowth for that treatment. The fractional outgrowth, extracted from Fig. 2C in Ref. [4], was 0.60, 0.50, 0.36, and 0.09 for R−A−, R−A+, R+A−, and R+A+, respectively.
Figure 2:
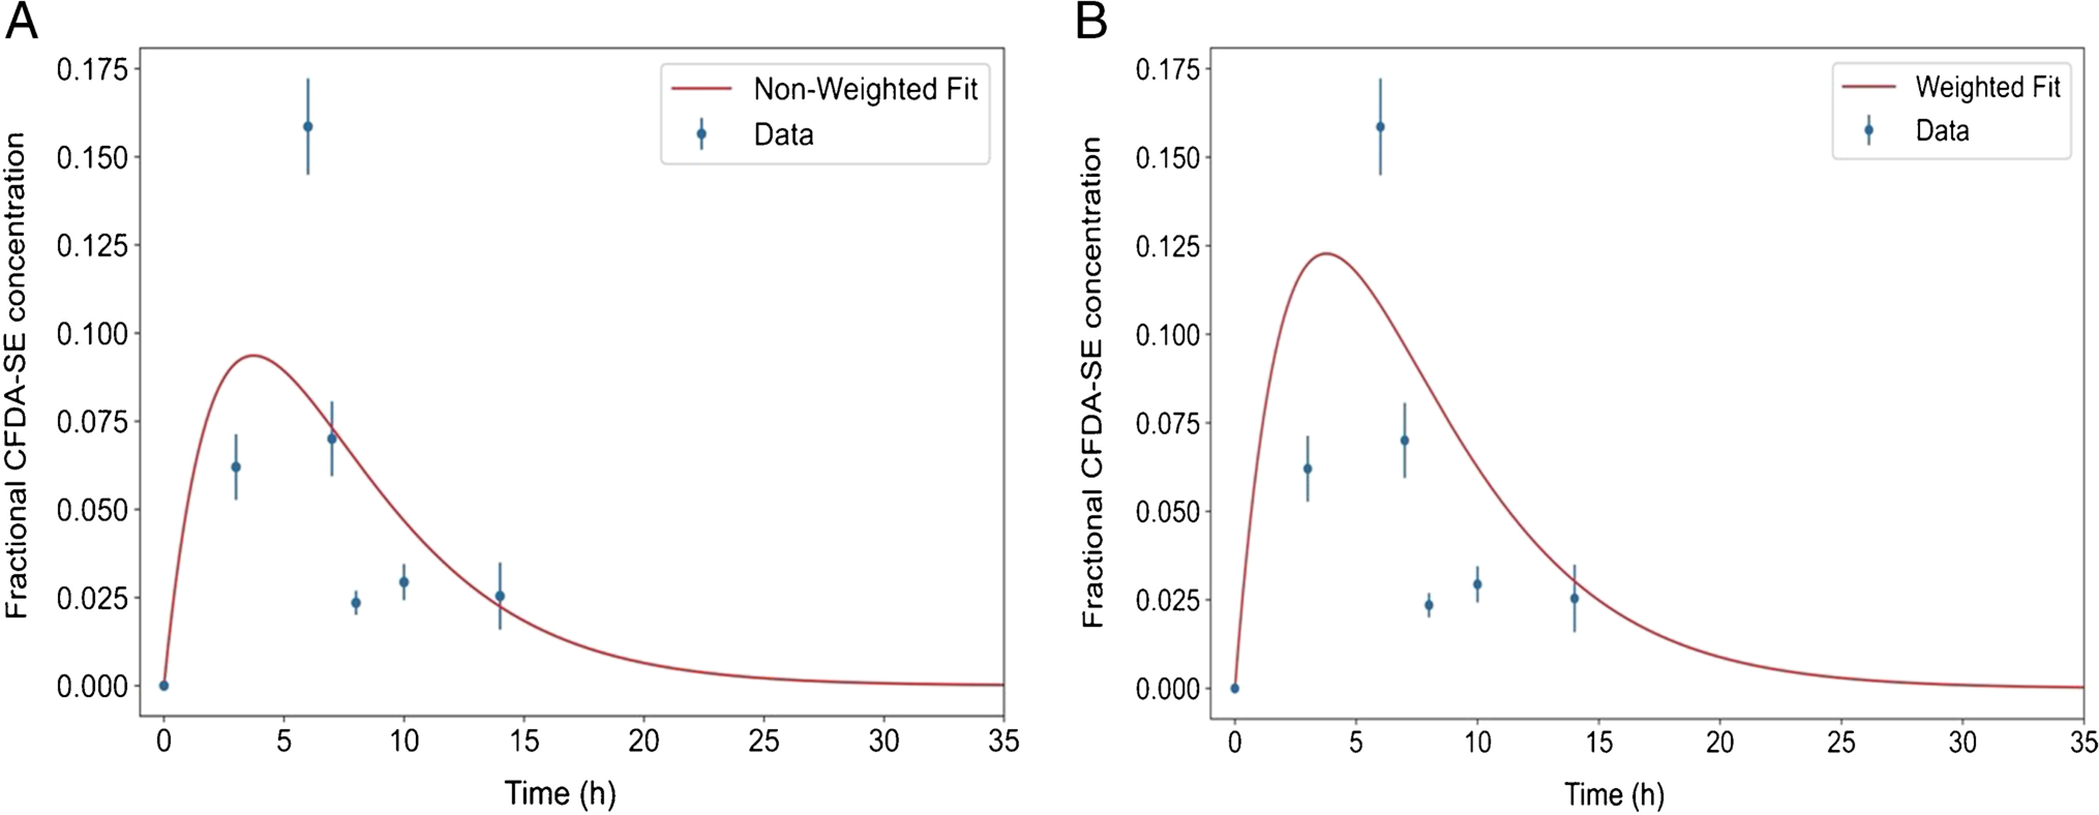
Example of non-weighted (A: R2 = 0.47) and weighted (B: R2 = 0.31) fits for the liposome-delivered average fractional CFDA-SE concentration, , at a single depth position i in the spheroid. Note that both curves (red) fail to properly fit the data points, thereby underestimating the area under the curves (). The error bars are the standard deviation of of 3–4 spheroids at each time point.
Spatial Distribution CFDA-SE-Liposomes in Spheroids
To measure the spatial distribution of the liposomes in the spheroids as a function of time, liposomes (R−A−, R−A+, R+A−, and R+A+) were loaded with CFDA-SE [17]. Spheroids (~ 400 μm) were treated with the CFDA-SE-liposomes and harvested directly into optimal cutting temperature compound (OCT) at 3 and 6 h after adding the CFDA-SE-liposomes to the culture medium. At the 6-h point, additional groups of spheroids were transferred to fresh medium and harvested directly into OCT compound at 1, 2, 4, and 8 h after the transfer to fresh medium. Thus, taking the time of addition of the CFDA-SE-liposomes to the medium as t=0, data points were acquired at 0, 3, 6, 7, 8, 10, and 14 h. The spheroids in OCT compound were frozen immediately at −80°C, cryosectioned, and the radial distributions of fluorescence intensity (FI) in the equatorial plane was measured in fluorescence intensity units (FIU) with a confocal microscope. The radial positions were selected by dividing each spheroid into concentric shells with 2.5-μm thickness. As indicated in Supplemental Figure 1, the FI map was translated to a CFDA-SE concentration (μM) map according to CFDA-SE concentration (μM) = (FI−b)/s, where b = 11 FIU and s = 751 FIU μM−1.
Preparation of Experimental Raw Data for MIRDcell
MIRDcell permits the user to import radial activity distributions for spherical multicellular clusters. The input data is required to be in CSV format wherein the number of decays (time integrated activity) per cell or the relative activity per cell is tabulated as a function of radial position. Different methods were used to convert raw data to this format, and the following subsections describe each step of the analysis. The processing of raw data and subsequent analysis were performed with an in-house Python script.
General Analysis.
As expected, due to natural variations in growth, the spheroids that were used for a given treatment group at a given time point had a distribution of radii. Furthermore, the mean radius of the spheroids differed statistically from one time point to another. Given this, and that the CFDA-SE-liposomes diffuse into the spheroid from the culture medium, the raw data were analyzed by determining the CFDA-SE concentration as a function of distance from the outer edge of each spheroid, as opposed to the radial distance from the center (Supplemental Fig. 2). The fractional CFDA-SE concentrations (f, fraction of the medium concentration) at each depth position were averaged for each group. Individual spheroids were of different radii so the smaller spheroids within a given group lacked depth positions corresponding to the deepest points in the largest spheroids. Therefore, at some depth positions, the average fractional CFDA-SE concentration () would be calculated from just one or two values (as opposed to 3–4 values). The uncertainties in the averages for the limited number of some interior positions was handled as follows. The average values for depths less than 150 μm, based on 4–5 spheroids, were used directly. Averages for deeper positions were calculated using all the data available (1–5 spheroids) for each depth position greater than 150 μm; a linear least-squares fit to these data was then performed and used to assign concentration values at depth points for which there were only 0 or 1 spheroid. This approach provided a complete () versus depth data-set for each time point (e.g. Figure 1). It should be noted that, for a given time point of a given liposome, only a maximum of six or seven () values out of the 24 depth positions that were located > 150 μm comprising the fit, were required to be determined from the linear fit.
Figure 1:

Linear fit (red line, R2 = 0.87) of average liposome-delivered fractional CFDA-SE concentration, , at depths >150 μm into MDA-MB-231 spheroids that have an average radius of 200 μm. Experimental data (circles) are from Stras et al. [17] and the error bars are standard deviations of the 3–4 spheroids at each depth position.
Time-Integrated Fractional Concentration of the Fluorophore
The time-integrated fractional concentration, , of liposome-delivered CFDA-SE at the ith depth position (from the edge of the spheroid) was calculated using several different techniques. This was done to find the technique that best fit the time variation of () at each depth position from the edge of the spheroid. In several instances, the () measured at the final time point (t=14 h) were unexpectedly much higher than any other values making curve fitting of the data corresponding to that radial position impossible. These were considered anomalies and such points were eliminated from the fit when the value at t=14 h exceeded the values at both t=8 and 10 h. This occurred at approximately 29%, 17%, 6% and 8% of the 86 radial positions that were measured for R+A+, R+A−, R−A+, and R−A− respectively. Most of these points were at radial positions close to the periphery of the spheroid. Examples of the eliminated points are provided in Supplemental Figure 3.
Weighted and Non-Weighted Fits.
First, the time variation of average fractional CFDA-SE concentration, , during the uptake and clearance phases, at each depth position, was fitted with Equation 1.
| (1) |
Here, f0,i, λbc,i and λbu,i are the gain parameter, biological-clearance rate constant, and biological-uptake rate constant of the ith depth position. Both weighted fits and a non-weighted fits were performed. The weighted fits were weighted by the uncertainty of each point. This uncertainty was taken as the ratio of the standard deviation of (mean of 3–4 spheroids) and at a given depth from the edge. However, both the weighted and non-weighted fits did not accurately estimate across all time points at every depth position. At some depth positions, both the weighted and non-weighted fits underestimated (Figure 2). Accordingly, this method was eliminated for further consideration.
Pure Trapezoidal Integration.
In this method, was calculated using trapezoidal integration from the raw data points. Here, was assumed to go to zero at 24 h. This assumption was based on the fast biological clearance. One such plot is shown in Figure 3; this method overestimated . Accordingly, this method was eliminated for further consideration.
Figure 3:

Trapezoidal + Clearance-Fit (R2 = 0.83) Hybrid. Pure trapezoidal integration using only the raw data points (green circles) assuming the liposome-delivered fractional CFDA-SE concentration () goes to zero at 24 h (dashed green line). The blue curve represents the tail (t > 14 h) of an exponential fit to just the clearance data (t=6, 7, 8, 10, 14 h). In the Trapezoidal + Clearance-Fit Hybrid method, the combined area under the solid green line (up to t=14 h) and the blue line (for t >14 h) was taken as the time-integrated fractional CFDA-SE concentration, .
Trapezoidal + Clearance-Fit Hybrid.
This integration approach for used a combination of the trapezoidal method using only the raw data out to t=14 h, and a non-weighted exponential fit to the clearance data (t=6, 7, 8, 10, 14 h) to extrapolate the clearance over the period 14 h ≤ t ≤ ∞. The intention behind this hybrid method was to both avoid the error of the area under the curve when a weighted/non-weighted fit was used, and to obtain a reliable estimate of the area under the curve from the last data point to infinity. This is illustrated in Figure 3. This approach was adopted for the analyses below.
Time Integrated Activity per Cell
The cells are the source regions in the multicellular cluster model provided by MIRDcell. Therefore, the continuous distributions of concentration measured in the spheroids needs to be translated to a radial activity distribution among the cells. This is achieved by translating the as function of radial position (Supplemental Fig. 4A) to time-integrated activity per cell (i.e. decays, ) as a function of radial position (Supplemental Fig. 4B). First, the were multiplied by the 225Ac activity concentration in the medium. This scaled the activity concentration according to the within the spheroid under the assumption that distribution of encapsulated CFDA-SE delivered by the liposomes is similar to that of encapsulated 225Ac delivered by liposomes with the same adhesion and release characteristics. It was necessary to adjust the to account for physical decay of 225Ac. The downward adjustments were dictated by where λp=ln(2)/Tp and Tp=9.92 d. The adjusted (kBq/mL) were then integrated, using the trapezoidal + clearance-fit hybrid approach, over 20 d to yield the adjusted time integrated activity concentration in the ith shell, (kBq s mL−1). The 20 d was consistent with the growth time used in the experiments (Fig. 2C in Ref. [4]). Equation 2 was then used to obtain the time integrated activity (decays) in the spheroid, ,
| (2) |
where Vi is the volume of the ith shell.
Cell packing densities were evaluated by seeding the appropriate number of cells and allowing the spheroids to reach 400-μm diameter. Spheroids were then transferred to wells containing trypsin (5/well). The spheroids were trypsinized for 30 min, or until complete disaggregation, and the cells were counted. There were 6357±502 cells within a spheroids of diameter 400±40 μm. The number of cells within a spheroid of a different, but similar, diameter was calculated assuming a constant cell density. In a selected spheroid, the number decays in each shell () was divided by the number of cells in that shell and saved as a function of radial position in a csv file. Finally, the mean decays/cell in the spheroid was calculated by dividing by the calculated number of cells in the spheroid (Table 1).
Table 1:
Mean decays/cell for each type of 225Ac-liposome for three different sized spheroids whose radii span the range of initial radii in the experiments. Values were calculated using the trapezoidal + clearance-fit hybrid method.
| 225Ac-liposome | Mean Decays/Cell Spheroid radius=214 μm 8385 cells |
Mean Decays/Cell Spheroid radius=200 μm 6859 cells |
Mean Decays/Cell Spheroid radius=180 μm 4169 cells |
|---|---|---|---|
| R+A+ | 0.42 | 0.50 | 0.63 |
| R+A− | 0.34 | 0.41 | 0.48 |
| R−A+ | 0.26 | 0.26 | 0.21 |
| R−A− | 0.04 | 0.04 | 0.04 |
MIRDcell Simulation
Spherical multicellular cluster models were generated in MIRDcell to represent the experimental spheroid morphology and activity distribution, and the activity in the culture medium. The SFs of cells within spheroids that were treated with 225Ac-liposomes were simulated. To account for the experimental distribution of initial spheroid diameters (400 ± 40 μm), simulations were conducted for three spheroid radii (180 μm, 200 μm and 214 μm). Absorbed doses to cells in the spheroid from decays within the spheroid and culture medium were included. This was accomplished with a new version of MIRDcell, V3.11, created at the writing of this manuscript. MIRDcell V3.11 permits calculations for a cocktail of radiopharmaceuticals (drugs). This new “Multi Drug” option in MIRDcell V3.11 was used to create multicellular spheroids containing two drugs, one representing activity in the spheroid and the other representing activity in the medium surrounding the spheroid.
The cells were modeled in MIRDcell as two concentric spheres representing the cell nucleus and the cell. All cells within the cluster were of the same size and in close packed cubic geometry. The clusters were assembled with MDA-MB-231 cells having cellular radius 6 μm and nuclear radius 4 μm [18], and the spacing between their centers was adjusted to 17 μm to match the experimental packing density of 0.19. A multicellular cluster with a 350-μm radius was created. The first drug, representing 225Ac-liposomes within the spheroid, was constrained to cells within a 200-μm radius; the csv file containing decays/cell, prepared as described above in Time Integrated Activity, was uploaded for Drug 1 after appending 0 values for radial positions between 200 and 350 μm. The second drug, representing 225Ac in the culture medium, was constrained to the “cells” located within a region comprising radial positions between 200 and 350 μm by setting the penetration depth to 149-μm. The thickness of this region was selected to encompass more than the range of the alpha particles. While a thicker region could have been selected to accommodate the range of the beta particles emitted by the 225Ac daughters, the large increase in computation time is not warranted relative to the small absorbed-doses that they deliver to cells in the spheroid. The activity in the medium was then apportioned equally among the “cells” in the region representing the medium. Activity per “cell” was obtained by taking the product of the activity concentration in the medium (9.25 kBq/mL) and the regional medium volume and dividing by the number of “cells” in the medium region. The number of cells was determined with MIRDcell by taking the difference in calculated cell numbers for clusters with radii . With the mean activity per “cell” in hand, the new “Multi Drug” option in MIRDcell V3.11 was used to add a second drug with a 200-μm radius “Cold Region” and a uniform distribution in the region from 200 to 350 μm (Supplemental Fig. 5). Because the spheroids were incubated for 6 h in culture medium containing the 225Ac-liposomes, the time integrated activity coefficient for the medium was set to , where Tp = 9.92 d. The absorbed doses to the cells in the spheroid from “cells” in the shell were then included in the analysis as described next.
The simulation in MIRDcell was performed using the LQ parameter values summarized in Table 2. The “β Average Energy Spectrum” of “225Ac + daughters” was selected as the source radionuclide. As in previous versions of MIRDcell, photon radiations were ignored. Cell activity was assigned to the cell surface (CS) because the liposomes are not significantly bound and/or internalized by cancer cells [4]. Furthermore, 30–35% of the 225Ac is released from the liposomes in up to five hours and then it diffuses within the interstitium.
Table 2:
Linear-Quadratic parameters used for 225Ac+daughters in MIRDcell
| Parameter | Value |
|---|---|
| αN <−CS(alpha particles) | 3.7 Gy−1 |
| βN <−CS(alpha particles) | 0 Gy−2 |
| αN <−CS(beta particles) | 0.25 Gy−1 |
| βN <−CS(beta particles) | 0 Gy−2 |
| αN <−CS(Auger electrons) | 0.25 Gy−1 |
| βN <−CS(Auger electrons) | 0 Gy−2 |
The SF of the cells were calculated by MIRDcell using the Complex Radiobiological Parameters feature in MIRDcell which assumes that the probability, P, that a given cell survives follows a modified linear quadratic (LQ) model [15, 19], where lesion interactions are ignored. When the cell nucleus is taken as the target region, the probability of the k cell to survive after irradiation by a given radiation type ICODE is [15]:
| (3) |
where j ≠ k and the cross-doses arise from all surrounding cells (numcell, j ≠ k). The probability that the kth cell survives being irradiated by the totality of all radiation types emitted is:
| (4) |
Here, for a given radiation type (ICODE), αself and βself are the LQ model parameters associated with the self-dose to the cell (Dself), and αcross and βcross are those associated with the cross-dose to the cell (Dcross) [13, 15, 20]. The LQ parameters for alpha particles (Table 2) were derived from colony forming assays conducted in the Sofou laboratory with monolayers of MDA-MB-231 cells irradiated with 225Ac-labeled isotype control antibody in the medium (reported in the supplement of Ref. [6]), and for the other LQ parameters, the defaults given in MIRDcell were used. After entering the lower and upper bounds over which the SF is to be calculated (0–200 μm), the “Compute” button was then clicked in MIRDcell V3.11 to calculate the SFs. This process was repeated for spheroids with radii of 180- and 214-μm and the average of the SFs obtained for the three cluster sizes was calculated for each liposome type.
Results
Comparison of MIRDcell Results with Experimental Observations
As reported by Prasad et al., the fractional outgrowth of spheroids relative to the untreated controls was taken as a surrogate for SF [4]. Figure 4 shows the experimental fractional outgrowths and the SFs predicted by MIRDcell. The raw fractional outgrowth and SF values were subject to a 2-way ANOVA using Sigmaplot V14.5 (Inpixon: Palo Alto, CA). A significant difference (p<0.05) between the experimental and MIRDcell values was only found for 225Ac-liposomes with R+A−. Therefore, MIRDcell predictions are in good agreement with the experimental outgrowth for R+A+, R−A+ and R−A−.
Figure 4:

Comparison of experimental fractional outgrowth relative to untreated controls (gray) and surviving fraction from MIRDcell (black). Error bars of the outgrowth data are the standard deviations of ten values (ten spheroids) for each 225Ac-liposome type [4], and the error bars for the MIRDcell results are the standard deviations of the SFs from three spheroid radii (180 μm, 200 μm, and 214 μm) that were modeled for each drug. * denotes a significant (p < 0.05) difference between experiment and MIRDcell prediction.
Figure 5 shows cross sectional slices from the multicellular clusters modeled with MIRDcell. Dead and alive cells are shown for each 225Ac-liposome type. Consistent with the SFs and DVHs, R+A+ has the smallest number of alive cells and R−A− has the highest number of alive cells.
Figure 5:

MIRDcell simulation of dead (light circles) and alive (dark circles) cells in a selected plane of the spheroid for each 225Ac-liposome type.
Figure 6 illustrates the mean absorbed dose distribution within the spheroids from the four liposome types. R+A+ and R+A− have delivered a relatively high absorbed dose all the way to the center of the spheroids and hence the low SF of the cells predicted by MIRDcell. The other two liposomes (R−A+ and R−A) did not penetrate deeper into the spheroid and hence delivered a relatively lower absorbed dose to the center regions of the spheroid. The rise in absorbed dose near the periphery of each spheroid is due to the absorbed dose from the medium which was delivered during the first 6 h while incubating in the culture medium containing 225Ac-liposomes. A comparison of the absorbed dose to the cells within the spheroid and to those in the medium is shown in Supplemental Figure 6. Figure 7 depicts the dose volume histograms (DVH) for each of the four liposome types. Supplemental Figure 7 presents the DVH’s as a function of relative absorbed dose, normalized to the highest absorbed dose.
Figure 6:

Mean absorbed dose to cell nucleus versus radial position within the spheroid for the four 225Ac-liposome types as calculated with MIRDcell. Absorbed doses include contributions from activity within the spheroid (red) and activity in the culture medium (blue).
Figure 7:

DVH of the spheroids treated with the four types of 225Ac-liposomes.
Discussion
Planning radiopharmaceutical treatments for micrometastatic disease requires consideration of numerous variables [21–25]. A sampling of the relevant variables includes the number and distribution of target receptors on the cells comprising the micrometastases, shapes and sizes of the metastases penetration and resulting nonuniform activity distribution, subcellular distribution of the radiopharmaceutical, radiations emitted (type, energy, range), radiosensitivity of the cells, radiation-induced bystander effects, biological uptake and clearance half-times, physical half-life, dose rate and its temporal variations, and other factors. Although a daunting task at first glance, great progress has been made on understanding many of the variables. Accordingly, MIRDcell has been designed to account for many of them when simulating responses of multicellular clusters to different activity distributions of radiopharmaceuticals. For example, Figure 5 show that spheroids treated with the same concentration of 225Ac-liposomes R+A+ and R+A− cause more cell killing than what was observed for R−A+ and R−A−. This can be attributed to the poor penetration of the drugs R−A+ and R−A− into the spheroid (Supplemental Fig. 2). It is notable that a considerable fraction of the mean absorbed dose to the cells in the spheroids treated with R−A+ and R−A− was delivered by the medium ( Figure 6). The liposomes which had the release property R+ resulted in deeper penetration into the spheroid, and liposomes were retained longer, thereby delivering higher absorbed dose distributions (Figure 6) and more favorable DVHs (Figure 7).
While the agreements between the experimental outgrowth and the calculated MIRDcell SFs are generally quite good (Figure 4), with the exception of R+A−, one should be cognizant of the assumptions that were made. First, the spatiotemporal distributions of CFDA-SE and 225Ac-DOTA are assumed to be the same for a given liposome type. This assumption is reasonable when they are encapsulated within the liposome because the kinetics of the liposome itself is invariant to its cargo. However, it is not as clear when CFDA-SE and 225Ac-DOTA are released from the liposomes. The molecular weights of CFDA-SE (MW=460) and 225Ac-DOTA (MW=750) are similar, so they may have similar diffusivities. However, their molecular characteristics may impact their transport through the biological milieu. In that event, the use of CFDA-SE as a surrogate for unencapsulated 225Ac-DOTA would affect the accuracy of our time integrated activities. Furthermore, the ongoing irradiation of the cells may also have some impact that may lead to differences in spatiotemporal kinetics of CFDA-SE versus 225Ac-DOTA in both encapsulated and released forms. While our existing alpha camera could potentially discern this issue, the spatial resolution of our camera model is not likely to be adequate to discern such differences (see Zhu et al. [6] for example images). One important thing to note is that low CFDA-SE-liposome concentrations were observed close to the edge (shallow depths) of the spheroids (Figure 1). This may be due to leaching of liposomes close to the edge of the spheroid when they were harvested and transferred directly into OCT compound.
The MIRDcell simulation was run using spheroid dimensions at the time of initial administration of 225Ac-liposomes. Therefore, the effect of dynamic tumor mass on the absorbed dose was not considered. Howell et al. reported a factor of ~20 larger absorbed dose values for static spheroids compared to values when spheroid growth was accounted for [26]. Goddu et al. further developed the theoretical formalism by factoring in tumor shrinkage due to therapy [27]. We have extracted the tumor growth data given in Fig. 2a in Ref. [4] and fitted them to the functional form given in Ref. [27] for the time-dependent tumor mass. The extracted specific growth rate parameters from the fits were found to be small compared to the effective clearance rates of the 225Ac-liposomes from the spheroids considered in this work; the biologic clearance was essentially complete by ~ 24 h (Figure 3), and the physical half-life of 225Ac is 9.92 d. As a result, the absorbed dose was delivered within 24 h postadministration. Therefore, the effect of dynamic tumor mass over 24 h on mean absorbed dose would be minimal.
The decays/cell as a function of radial position was uploaded to MIRDcell. Therefore, the dependence of SF on absorbed dose rate [28] has not been explicitly accounted for, although dose rate is not anticipated to be a significant factor given that most of the absorbed dose is delivered by alpha particles. Radiation-induced bystander effects have not been considered in the current version of MIRDcell and these can be substantial for alpha particles [24, 25, 29]. Furthermore, to be consistent with the experimental conditions, the packing density of cells in the MIRDcell multicellular clusters had to be lowered to match the experimental packing density. The effect of distribution of cell sizes and packing density on SF in spherical clusters has been studied in the literature [30]. We repeated our calculations for a cell radius = 7 μm. When compared to our results for 6 μm, this caused an increase in the SF by 7.1%, 1.8%, 0.8% and 1.1% for R+A+, R+A−, R−A+ and R−A−, respectively. This analysis also does not account for the stochastic nature of the number of hits and energy depositions of the alpha particles [31]. However, it does calculate the absorbed dose to each cell in the cluster and uses a stochastic approach to determine the life or death of each cell. Furthermore, DNA repair was not accounted for, however, this was likely negligible for alpha irradiation. All these phenomena may affect the SF. As expected, the calculated SF is sensitive to the radiobiological parameters. A rerun of MIRDcell using α = 3.33 Gy−1, a value 10% lower than the 3.7 Gy−1 we used for alpha particles, gave SF that were 22%, 18%, 5%, and 4% higher for R+A+, R+A−, R−A+ and R−A−, respectively.
Nevertheless, the predictive capacity of MIRDcell was very good for R+A+, R−A+ and R−A−. However, the lack of accuracy in the case of R+A− remains unclear. A closer review of the 2-way ANOVA reveals p = 0.006 when comparing the MIRDcell SFs for R+A+ and R+A−. This is supported by the similarity of their spatial absorbed-dose profiles (Figure 6). However, it is important to point out that the published clearance data for this analysis only cover 8 h. This required us to make assumptions regarding the nature of the clearance after that time (see Materials and Methods). Absorbed doses could be considerably higher depending on the biological clearance beyond 8 h. Perhaps some clarity will emerge when MIRDcell is applied to new data sets that arise in the years to come.
Conclusions
The prediction of the biologic response of spheroids to 225Ac-liposomes that differ in their spatiotemporal distributions has been carried out using MIRDcell V3.11 with satisfactory accuracy in most instances.
Supplementary Material
Financial Support:
This study was supported in part by grant 1R01CA245139 from NCI.
Footnotes
Conflict of Interest: Sumudu Katugampola (SK), Jianchao Wang (JW), and Roger W. Howell (RWH) declare they have financial interests. RWH holds patent US 9,623,262 patent for MIRDcell V2. SK, JW, and RWH have petitioned Rutgers University to apply for a patent for MIRDcell V3.
Compliance with Ethical Standards
Ethical approval: This article does not contain any studies with human participants or animals performed by any of the authors.
References
- 1.Howell RW. The MIRD schema: From organ to cellular dimensions. J Nucl Med. 1994;35:531–3. [PubMed] [Google Scholar]
- 2.Loevinger R, Budinger TF, Watson EE. MIRD Primer for Absorbed Dose Calculations. Revised ed. New York: The Society of Nuclear Medicine; 1991. [Google Scholar]
- 3.Howell RW, Wessels BW, Loevinger R, Watson EE, Bolch WE, Brill AB, et al. The MIRD perspective 1999. J Nucl Med. 1999;40:3S–10S. [PubMed] [Google Scholar]
- 4.Prasad A, Nair R, Bhatavdekar O, Howe A, Salerno D, Sempkowski M, et al. Transport-driven engineering of liposomes for delivery of alpha-particle radiotherapy to solid tumors: effect on inhibition of tumor progression and onset delay of spontaneous metastases. European journal of nuclear medicine and molecular imaging. 2021. doi: 10.1007/s00259-021-05406-z. [DOI] [PubMed] [Google Scholar]
- 5.Stras S, Holleran T, Howe A, Sofou S. Interstitial release of cisplatin from triggerable liposomes enhances efficacy against triple negative breast cancer solid tumor analogues. Molecular pharmaceutics. 2016;13:3224–33. doi: 10.1021/acs.molpharmaceut.6b00439. [DOI] [PubMed] [Google Scholar]
- 6.Zhu C, Sempkowski M, Holleran T, Linz T, Bertalan T, Josefsson A, et al. Alpha-particle radiotherapy: for large solid tumors diffusion trumps targeting. Biomaterials. 2017;130:67–75. doi: 10.1016/j.biomaterials.2017.03.035. [DOI] [PubMed] [Google Scholar]
- 7.Sofou S Radionuclide carriers for targeting of cancer. International Journal of Nanomedicine. 2008;3:181–99. [DOI] [PMC free article] [PubMed] [Google Scholar]
- 8.Howell RW, Rajon D, Bolch WE. Monte Carlo simulation of irradiation and killing in three-dimensional cell populations with lognormal cellular uptake of radioactivity. International journal of radiation biology. 2012;88:115–22. doi: 10.3109/09553002.2011.602379. [DOI] [PMC free article] [PubMed] [Google Scholar]
- 9.Neti PVSV, Howell RW. Biological response to nonuniform distributions of 210Po in multicellular clusters. Radiation research. 2007;168:332–40. [DOI] [PMC free article] [PubMed] [Google Scholar]
- 10.Neti PV, Howell RW. Log normal distribution of cellular uptake of radioactivity: implications for biologic responses to radiopharmaceuticals. J Nucl Med. 2006;47:1049–58. doi:47/6/1049 [pii]. [PMC free article] [PubMed] [Google Scholar]
- 11.Neti PV, Howell RW. Lognormal distribution of cellular uptake of radioactivity: statistical analysis of alpha-particle track autoradiography. J Nucl Med. 2008;49:1009–16. doi: 10.2967/jnumed.107.048843. [DOI] [PMC free article] [PubMed] [Google Scholar]
- 12.Minchinton AI, Tannock IF. Drug penetration in solid tumours. Nature reviews Cancer. 2006;6:583–92. doi: 10.1038/nrc1893. [DOI] [PubMed] [Google Scholar]
- 13.Vaziri B, Wu H, Dhawan AP, Du P, Howell RW. MIRD Pamphlet No. 25: MIRDcell V2.0 software tool for dosimetric analysis of biologic response of multicellular populations. J Nucl Med. 2014;55:1557–64. doi: 10.2967/jnumed.113.131037. [DOI] [PubMed] [Google Scholar]
- 14.Wang J, Rosen A, Katugampola S, Howell RW, He H. MIRDcell. In: Howell RW, editor. MIRDcell. 3.10 ed. Newark, NJ: Rutgers University; 2021. [Google Scholar]
- 15.Katugampola S, Wang J, Howell RW. MIRD Pamphlet No. 27: MIRDcell V3, a revised software tool for multicellular dosimetry and bioeffect modeling. 2021;In press. [DOI] [PMC free article] [PubMed] [Google Scholar]
- 16.Chang MY, Seideman J, Sofou S. Enhanced loading efficiency and retention of 225Ac in rigid liposomes for potential targeted therapy of micrometastases. Bioconjugate chemistry. 2008;19:1274–82. doi: 10.1021/bc700440a. [DOI] [PubMed] [Google Scholar]
- 17.Stras S, Howe A, Prasad A, Salerno D, Bhatavdekar O, Sofou S. Growth of metastatic triple-negative breast cancer Is inhibited by deep tumor-penetrating and slow tumor-clearing chemotherapy: The case of tumor-adhering liposomes with interstitial drug release. Molecular pharmaceutics. 2020;17:118–31. doi: 10.1021/acs.molpharmaceut.9b00812. [DOI] [PubMed] [Google Scholar]
- 18.Akudugu JM, Azzam EI, Howell RW. Induction of lethal bystander effects in human breast cancer cell cultures by DNA-Incorporated Iodine-125 depends on phenotype. International journal of radiation biology. 2012;88:1028–38. doi: 10.3109/09553002.2012.683511. [DOI] [PMC free article] [PubMed] [Google Scholar]
- 19.Neti PV, Howell RW. Isolating effects of microscopic nonuniform distributions of 131I on labeled and unlabeled cells. J Nucl Med. 2004;45:1050–8. [PMC free article] [PubMed] [Google Scholar]
- 20.Goddu SM, Rao DV, Howell RW. Multicellular dosimetry for micrometastases: dependence of self-dose versus cross-dose to cell nuclei on type and energy of radiation and subcellular distribution of radionuclides. J Nucl Med. 1994;35:521–30. [PubMed] [Google Scholar]
- 21.O’Donoghue JA, Bardies M, Wheldon TE. Relationships between tumor size and curability for uniformly targeted therapy with beta-emitting radionuclides. J Nucl Med. 1995;36:1902–9. [PubMed] [Google Scholar]
- 22.Howell RW, Rao DV, Sastry KSR. Macroscopic dosimetry for radioimmunotherapy: nonuniform activity distributions in solid tumors. Med Phys. 1989;16:66–74. [DOI] [PMC free article] [PubMed] [Google Scholar]
- 23.Solanki JH, Tritt T, Pasternack JB, Kim JJ, Leung CN, Domogauer JD, et al. Cellular response to exponentially Increasing and decreasing dose rates: Implications for treatment planning in targeted radionuclide therapy. Radiation research. 2017;188:221–34. doi: 10.1667/RR14766.1. [DOI] [PMC free article] [PubMed] [Google Scholar]
- 24.Leung CN, Canter BS, Rajon D, Back TA, Fritton JC, Azzam EI, et al. Dose-dependent growth delay of breast cancer xenografts in the bone marrow of mice treated with radium-223: the role of bystander effects and their potential for therapy. J Nucl Med. 2020;61:89–95. doi: 10.2967/jnumed.119.227835. [DOI] [PMC free article] [PubMed] [Google Scholar]
- 25.Canter BS, Leung CN, Fritton JC, Back T, Rajon D, Azzam EI, et al. Radium-223-induced bystander effects cause DNA damage and apoptosis in disseminated tumor cells in bone marrow. Molecular cancer research : MCR. 2021;19:1739–50. doi: 10.1158/1541-7786.MCR-21-0005. [DOI] [PMC free article] [PubMed] [Google Scholar]
- 26.Howell RW, Narra VR, Rao DV. Absorbed dose calculations for rapidly growing tumors. J Nucl Med. 1992;33:277–81. [PubMed] [Google Scholar]
- 27.Goddu SM, Howell RW, Rao DV. A generalized approach to absorbed dose calculations for dynamic tumor and organ masses. J Nucl Med. 1995;36:1923–7. [PubMed] [Google Scholar]
- 28.Malaroda A, Flux GD, Buffa FM, Ott RJ. Multicellular dosimetry in voxel geometry for targeted radionuclide therapy. Cancer Biotherapy and Radiopharmaceuticals. 2003;18:451–61. [DOI] [PubMed] [Google Scholar]
- 29.Rajon DA, Canter BS, Leung CN, Back TA, Fritton JC, Azzam EI, et al. Modeling bystander effects that cause growth delay of breast cancer xenografts in bone marrow of mice treated with radium-223. International journal of radiation biology. 2021;97:1217–28. doi: 10.1080/09553002.2021.1951392. [DOI] [PMC free article] [PubMed] [Google Scholar]
- 30.Charlton DE. Radiation effects in spheroids of cells exposed to alpha emitters. International journal of radiation biology. 2000;76:1555–64. [DOI] [PubMed] [Google Scholar]
- 31.Roeske JC, Stinchcomb TG. The average number of alpha-particle hits to the cell nucleus required to eradicate a tumour cell population. Physics in medicine and biology. 2006;51:N179–86. doi:S0031–9155(06)15357–9 [pii] 10.1088/0031-9155/51/9/N02. [DOI] [PubMed] [Google Scholar]
Associated Data
This section collects any data citations, data availability statements, or supplementary materials included in this article.