

Abstract
Background:
Patients with head and neck cancer (HNC) experience psychoneurological symptoms (PNS, i.e., depression, fatigue, sleep disturbance, pain, and cognitive dysfunction) during intensity-modulated radiotherapy (IMRT) that decrease their functional status, quality of life, and survival rates. The purposes of this study were to examine and visualize the relationships among PNS within networks over time and evaluate for demographic and clinical characteristics associated with symptom networks.
Methods:
A total of 172 patients (mean age 59.8±9.9 years, 73.8% male, 79.4% White) completed symptom questionnaires four times, namely, prior to IMRT (T1), one month (T2), three months (T3), and 12 months (T4) post IMRT. Network analysis was used to examine the symptom-symptom relationships among PNS. Centrality indices, including strength, closeness, and betweenness, were used to describe the degrees of symptom network interconnections. Network comparison test was used to assess the differences between two symptom networks.
Results:
Depression was associated with the other four symptoms, and fatigue was associated with the other three symptoms across the four assessments. Based on the centrality indices, depression (rstrength=1.3–1.4, rcloseness=0.06–0.08, rbetweeness=4–10) was the core symptom in all symptom networks, followed by fatigue. Female gender, higher levels of stress, and no alcohol use were associated with stronger symptom networks in network global strength prior to IMRT.
Conclusion:
Network analysis provides a novel approach to gain insights into the relationships among self-reported PNS and identify the core symptoms and associated characteristics. Clinicians may use this information to develop symptom management interventions that target core symptoms and interconnections within a network.
Keywords: Depression, fatigue, neck and head cancer, network analysis, radiotherapy, symptoms
Lay Summaries:
The study described the symptom-symptom relationships for five common symptoms in patients with head and neck cancer receiving radiotherapy. Depression and fatigue appeared to be two core symptoms that were connected with sleep disturbance, pain, and cognitive dysfunction within a network. Several characteristics (i.e., female, higher stress, no alcohol use) were associated with stronger symptom networks.
Precis:
Depression and fatigue appear to be two core symptoms that are connected with other psychoneurological symptoms. Female gender, higher levels of stress, and no alcohol use are associated with stronger psychoneurological symptom networks.
INTRODUCTION
Patients with head and neck cancer (HNC) are a significantly growing population with more than 68,000 new cases in the United States in 2021.1 Most patients with HNC receive intensity-modulated radiotherapy (IMRT) that targets tumors with higher doses and reduces normal tissue complications.2 Psychoneurological symptoms (PNS) that include depression, fatigue, sleep disturbance, pain, and cognitive dysfunction are among the most common and distressing symptoms reported by patients with HNC undergoing IMRT.3,4 These multiple co-occurring symptoms can negatively impact patients’ functional status, quality of life (QOL), and survival rates.5,6 In a mixed methods study, patients with HNC experienced varying levels of PNS that affected their functional well-being and QOL.7 In another national cohort study of 1589 patients with HNC,6 patients with one symptom had a median survival of 5.3 years compared to only 1.1 years for patients with three symptoms. These findings suggest that a critical need exists to understand the relationships among PNS in patients with HNC, especially during IMRT.
Previous studies of PNS in patients with HNC focused on the identification of symptom clusters. In two studies of patients with HNC undergoing radiotherapy, fatigue, sleep disturbance, depression, cognitive dysfunction, and pain were identified as a symptom cluster.3,8 However, in one cross-sectional study,5 PNS occurred in two symptom clusters (i.e., fatigue and sleep disturbance, depression and pain). In addition, while risk factors of PNS among HNC are largely unknown, in patients with heterogeneous cancer diagnoses, younger age, poorer performance status, higher levels of stress, and receipt of chemotherapy were associated with more severe PNS.9,10 While these studies provided important information about PNS, several limitations warrant consideration. First, inconsistent results were found for the PNS cluster. Second, most of these studies used a cross-sectional design. In addition, no studies focused on an evaluation of risk factors associated with PNS in patients with HNC. Lastly, none of them identified the symptom-symptom relationships among the five PNS in patients with HNC.
Network analysis is an innovative approach to describe and visualize symptom-symptom interactions. Each symptom was defined as “node” and relationships between two nodes were defined as “edges”. The thickness of the edges represents the magnitude of the relationships.11 Three centrality indices were used for estimating network structures: strength (network connectivity), closeness (the average distance from one node to all other nodes), and betweenness (the number of times a node being the shortest path among nodes).12 The most common model to estimate symptom networks is the partial correlation network using regularization techniques.13 Network analysis allows one to visualize the network structures and provides centrality indices to evaluate the networks (e.g., strength, closeness).11 In addition, core symptoms within a network present the strongest associations with the other symptoms and may play a critical role in activating other symptoms.14 Targeting core symptoms is the key to successful symptom management interventions. The use of network analysis will assist clinicians and researchers to understand symptom interconnections and develop more efficacious interventions. While network analysis was used to examine psychosocial symptoms,14,15 no studies have used this approach to identify the network associated with PNS in patients with HNC. Given the paucity of research on network analysis in PNS and the relationships among these self-reported symptoms in patients with HNC, the purposes of this study were to examine and visualize the relationships among PNS within networks over time and evaluate for demographic and clinical characteristics associated with these networks.
METHODS
Patients and settings
This prospective longitudinal study included patients with HNC who received IMRT. Details were described in our previous publications.16,17 In brief, eligible patients included: ≥21 years of age; histological proof of squamous cell carcinoma of head and neck region; clinical stage T1–T4, any N with no distant metastasis; receiving IMRT with or without concurrent chemotherapy; having adequate major organ function; and being able to read, write, and understand English. Exclusion criteria included: simultaneous primary cancer; previous invasive malignancies of less than 3 years; pregnant women; major psychiatric disorders; and chronic medical conditions involving the immune system (e.g., HIV, hepatitis B or C) or regular use of immunosuppressive medications (e.g., glucocorticoids, methotrexate). Patients were recruited at the Oncology Clinics of Emory Winship Cancer Institute, Atlanta, GA. A total of 172 patients provided informed consents to participate in the study. A priori sample size analysis was used to determine that our sample provided sufficient power.15
Instruments
Demographic characteristics (e.g., age, gender, race, marital status, education, and income) were collected through a standard patient-reported questionnaire. Lifestyle characteristics included history of tobacco use, years since quitting tobacco, history of alcohol use, and body mass index (BMI). All of these data were collected using questionnaires or medical record review. Clinical characteristics consisted of functional status (Eastern Cooperative Oncology Group [ECOG] Scale of Performance Status),18 comorbidities (Charlson Comorbidity Index [CCI]),19 stress (Perceived Stress Scale),20 cancer sites, cancer stage (TNM), human papillomavirus (HPV) status, treatment types, radiation dose, and feeding tubes, obtained through medical record review.
The five PNS were measured by the self-reported symptom instruments with well-established validity and reliability.21–24 The symptoms that were assessed included: depression (the 8-item Patient Health Questionnaire (PHQ-8)22 with a cutoff score ≥10 indicating clinical diagnosis of depression)25; fatigue (the 20-item Multidimensional Fatigue Inventory (MFI)-2024 with a cutoff score ≥43.5 indicating moderate-to-severe fatigue)26; sleep disturbance (the 19-item Pittsburgh Sleep Quality Index (PSQI)23 with a cutoff score ≥5 indicating sleep disturbance)27; and cognitive dysfunction and pain (one-item pain and two-item cognitive dysfunction measures from the Patient-Reported Outcomes version of the Common Terminology Criteria for Adverse Events (PRO-CTCAE)28) (see the Supplementary Files for more details).
Study procedures
This study was approved by the Emory Institutional Review Board. Patients’ electronic medical records were used to determine eligibility. Eligible, consented patients were enrolled before the start of IMRT. If surgery was performed, it typically took place approximately 1 month prior to IMRT. Demographic and clinical characteristics were collected at baseline (prior to IMRT) and/or follow-up as appropriate through chart review and standardized questionnaires. All other data, including patients-reported questionnaires, were collected prior to IMRT (T1) and 1 month (T2), 3 months (T3), and 12 months (T4) post IMRT.
Data analysis
The symptom scores were standardized using z-scores and transformed to t-scores for visualization. Expectation-Maximization (EM) algorithm was used for imputing missing data.29,30 Descriptive statistics and frequency distributions were calculated for demographic and clinical characteristics. One-way repeated measures ANOVA was performed to determine if there were significant differences in PNS severity over time. Due to the inconsistency in the PNS cluster in previous studies, exploratory factor analysis (EFA) was used to identify the cluster(s) among PNS, and confirmatory factor analysis (CFA) was used to confirm the cluster(s) identified. Data at each time point were randomly split into halves for EFA and CFA, respectively. The details for EFA and CFA can be found in the Supplementary Files. IBM SPSS 28.0 and IMB AMOS 26.0 (IBM Corp., Armonk, NY) were used to support the data analysis.
Network analysis was used to identify the relationships among the five PNS. We estimated a regularized partial correlation network using the least absolute shrinkage and selection operator (LASSO) algorithm and Extended Bayesian Information Criterion (EBIC) model selection using the R 4.1 package qgraph.11,13 The coefficient parameters rstrength, rcloseness, and rbetweenness were used to indicate the degrees of symptom network interconnections.
We examined the accuracy and stability of the network model to assess the rigorousness of the results over time. Accuracy was assessed by computing confidence intervals (CIs) of edge-weights using the non-parametric bootstrapping method (resampling rows from the data with replacement).15 Stability was assessed by correlation stability coefficients (CS-Cs) of centrality indices using subset bootstraps (dropping rows from the data).15 If CS-Cs did not change significantly after excluding part of the sample in the dataset, the network structure was considered stable. The R-package bootnet was used to perform these analyses.
The Network Comparison Test (NCT) was used to assess for differences between two networks as well as for networks over time (i.e., T1 vs. T2, T2 vs. T3, T3 vs. T4). First, we performed generalized estimating equation models to identify potential characteristics that were associated with PNS (p < .1) among our patients. In addition, we searched publications for characteristics associated with PNS.31,32 Several characteristics were included: age, gender, tobacco use, alcohol use, HPV status, stress, receipt of surgery, and receipt of chemotherapy. We carried out the NCT to examine network differences among subgroups with different characteristics separately. The NCT was performed on subsamples using 1000 permutations as recommended previously.11 The NCT tested invariant network structure, invariant global strength, and invariant edge strength between two networks. All the tests were performed with the R-package NetworkComparisonTest.
RESULTS
Demographic and clinical characteristics of patients
A total of 172 patients with HNC receiving IMRT participated in the study starting from baseline (T1) and during three follow-up assessments (T2, T3, and T4). As shown in Table 1, patients were middle aged (mean age 59.8±9.9 years), mostly male (73.8%), non-Hispanic White (79.4%), and married (69.8%). Most patients had no history of alcohol use (58.1%), had a history of tobacco use (60.9%), did not receive surgery (61.6%), and received concurrent chemotherapy (79.7%). Half of the patients were HPV positive.
Table 1.
Baseline demographic and clinical characteristics of the participants (n = 172)
| Variables | Mean ± SD or N (%) | |
|---|---|---|
| Age (years) | 59.8 ± 9.9 | |
| Gender | Male | 127 (73.8) |
| Female | 45 (26.2) | |
| Race | White | 135 (79.4) |
| Non-White | 35 (20.6) | |
| Marital status | Married | 118 (69.8) |
| Unmarried | 51 (30.2) | |
| History of tobacco use | No | 66 (39.1) |
| Yes | 103 (60.9) | |
| History of alcohol use | No | 97 (58.1) |
| Yes | 70 (41.9) | |
| Antidepressant use | No | 140 (81.9) |
| Yes | 31 (18.1) | |
| Stage | ≤ III | 37 (21.6) |
| IV | 134 (78.4) | |
| Human papillomavirus status | Negative | 86 (50) |
| Positive | 86 (50) | |
| Treatment | IMRT | 8 (4.7) |
| IMRT + surgery | 27 (15.7) | |
| IMRT + chemotherapy | 98 (57.0) | |
| IMRT + surgery + chemotherapy | 39 (22.7) | |
| Concurrent chemotherapy | No | 35 (20.3) |
| Yes | 137 (79.7) | |
| Surgery | No | 106 (61.6) |
| Yes | 66 (38.4) | |
| Body Mass Index | 27.9 ± 5.8 | |
| Stress scores | 14.5 ± 8.1 | |
| Radiation dose (Gy) | 66.1 ± 7.5 |
Note: IMRT = intensity-modulated radiotherapy
Symptom severity trajectories
As shown in Figure 1, depression and fatigue severity scores increased from baseline (T1) and peaked at T2 (p = .016 and p < .001, T1 vs. T2) and gradually decreased at T3 (p = .01 and p = .002, T2 vs. T3) and T4 (both p values > .05, T3 vs. T4). Sleep disturbance severity scores increased at T2 and dramatically decreased at T3 and T4 (p = .024, T2 vs. T3; both p values > .05, T1 vs. T2 and T3 vs. T4). Pain severity scores continually decreased after IMRT across four time points (p = .004, T2 vs. T3; both p values > .05, T1 vs. T2 and T3 vs. T4). However, cognitive dysfunction had a different pattern and demonstrated a tendency of increased severity over time (all p values > .05) that may be attributed to the long-term effects of radiotherapy and continued alcohol use.
Figure 1.
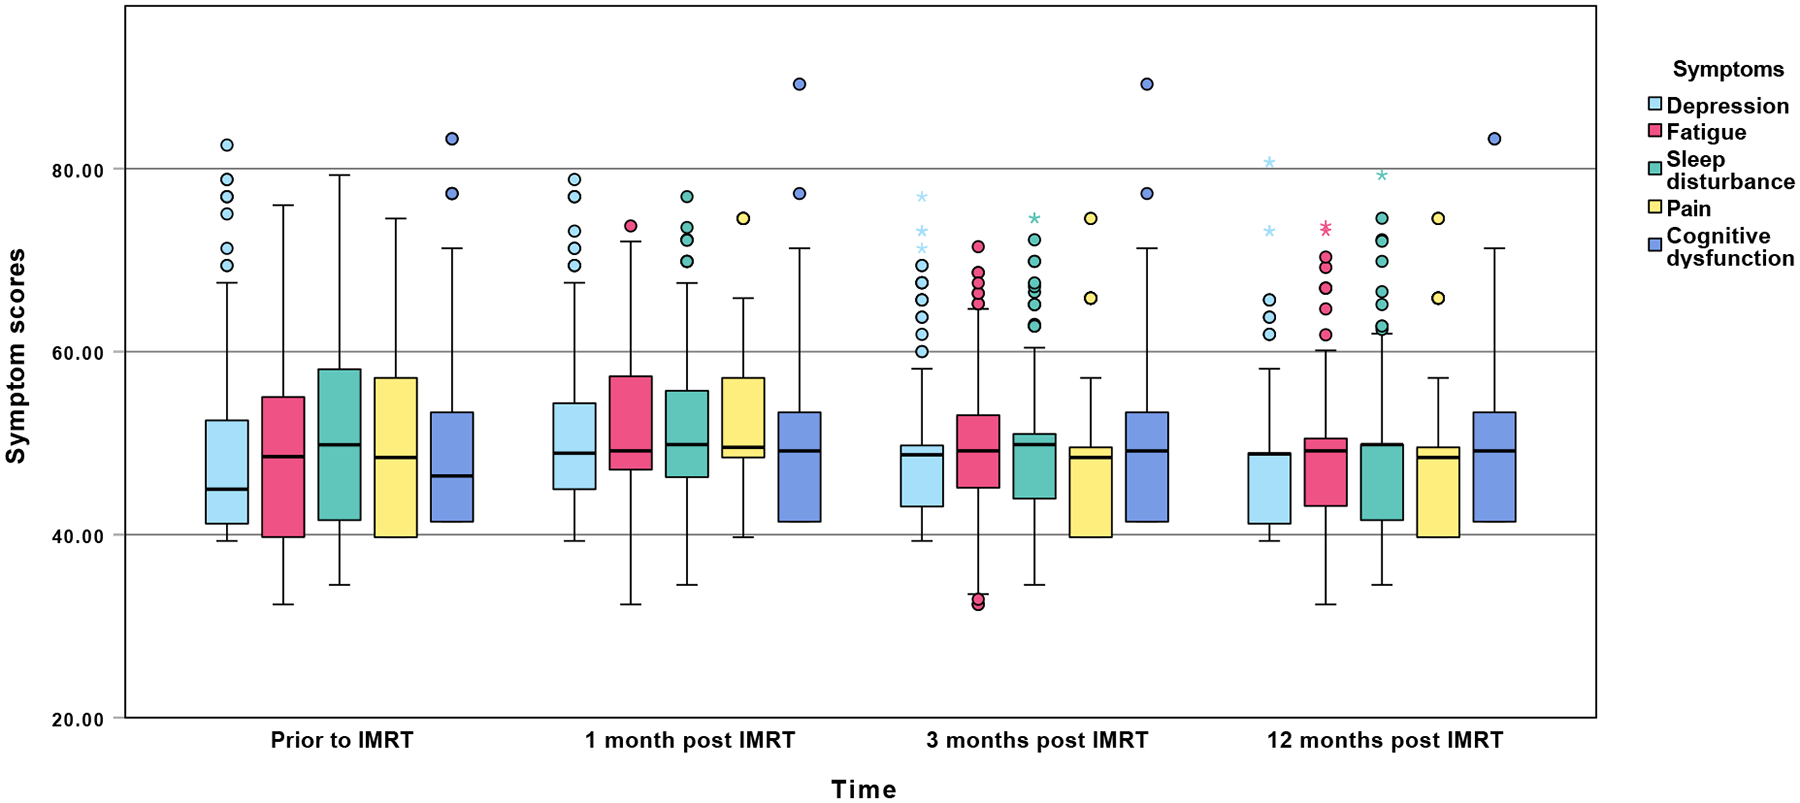
Mean symptom severity t-scores across the four assessments
Factor analysis
One symptom cluster was identified by the EFA, namely, the PNS cluster. The item loadings at each time point are shown in Supplementary Table 1. Similar loading patterns were observed for all time points for the EFA. The results from the CFA confirmed the final one-cluster structure (Supplementary Figure 1). Consistent results were found for all time points, which suggested that the PNS cluster remained stable over time.
Symptom networks and centrality indices
Figure 2 illustrates the symptom networks at each of the four assessments. Figure 3 shows the centrality indices for the symptom networks. For the nodes (symptoms), depression (reported by 14%−25% of patients) was highly connected with the other four symptoms, and fatigue (reported by 54%−75% of patients) was connected with the other three symptoms across the four assessments. The closest relationships are illustrated by the thickest edges. These relationships include: between depression and sleep disturbance at T1, T3, and T4, between depression and fatigue at T2, T3, and T4, and between depression and cognitive dysfunction at T4. Based on the centrality indices for all four assessments, depression showed the highest strength (rstrength=1.3–1.4), closeness (rcloseness=0.06–0.08), and betweenness (rbetweeness=4–10). Depression was the most core symptom in all four networks and was most closely associated with sleep disturbance at T1 and T4, fatigue at T2, and sleep disturbance and fatigue at T3. Fatigue was the second most core symptom (rstrength=0.8–1.0, rcloseness=0.06, rbetweeness=0–2) and was most closely associated with depression across the four assessments.
Figure 2.
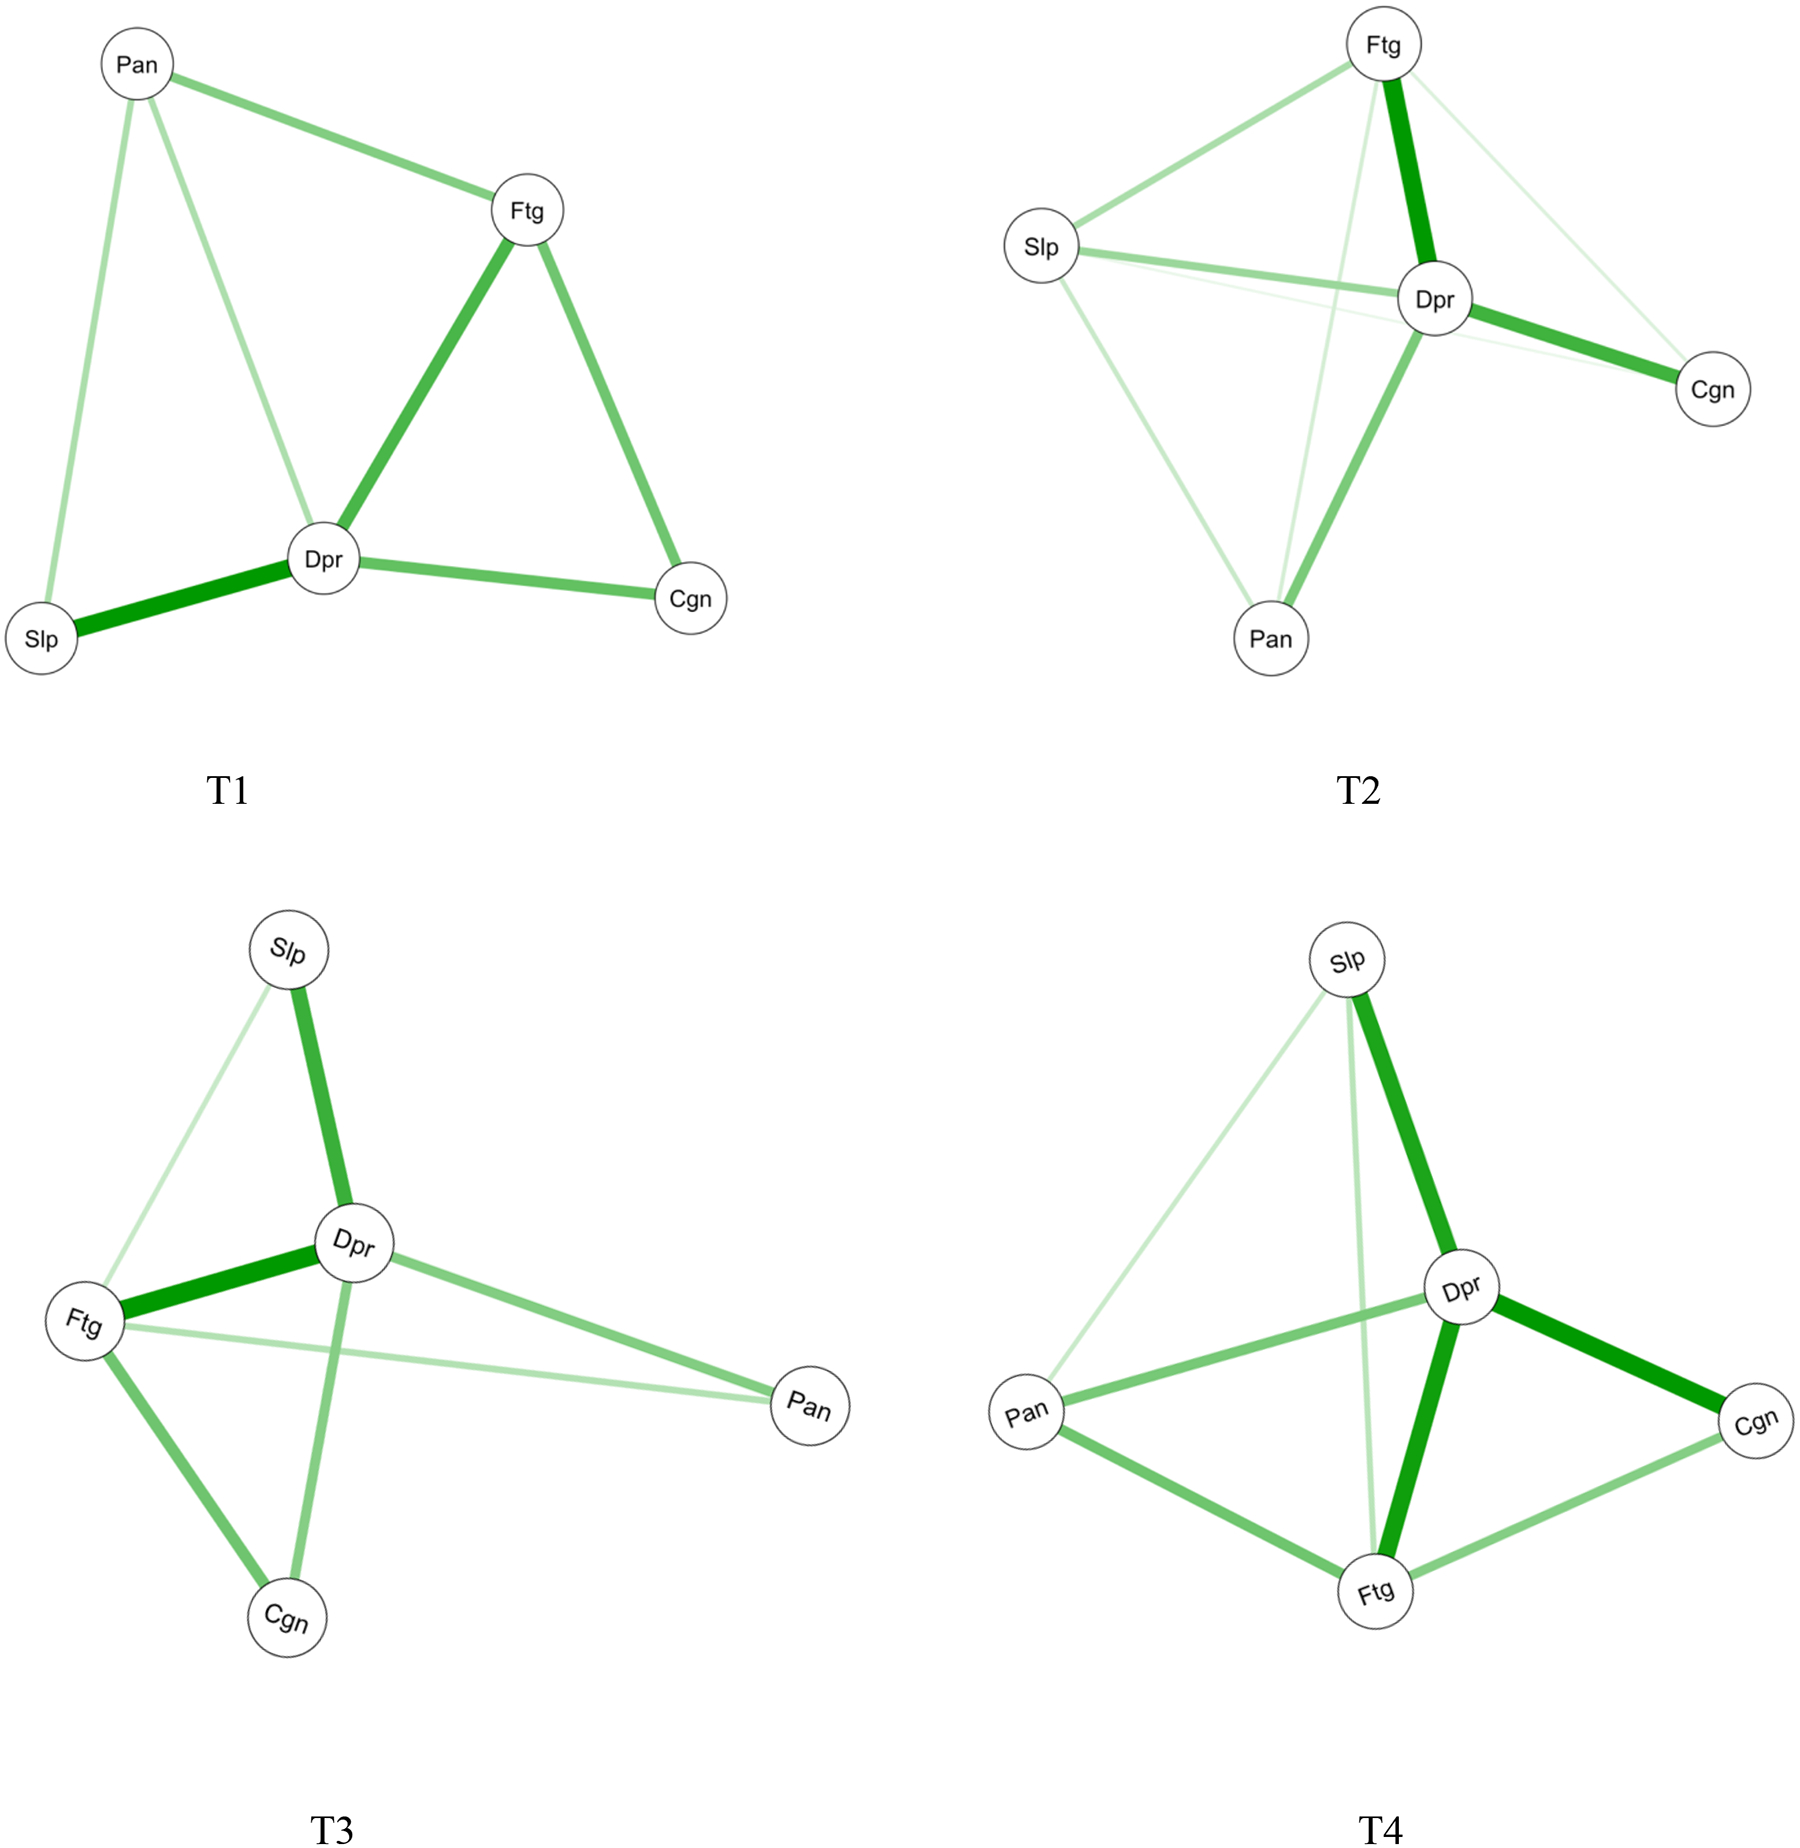
Estimated network structures for psychoneurological symptoms across the four assessments
Figure 3.
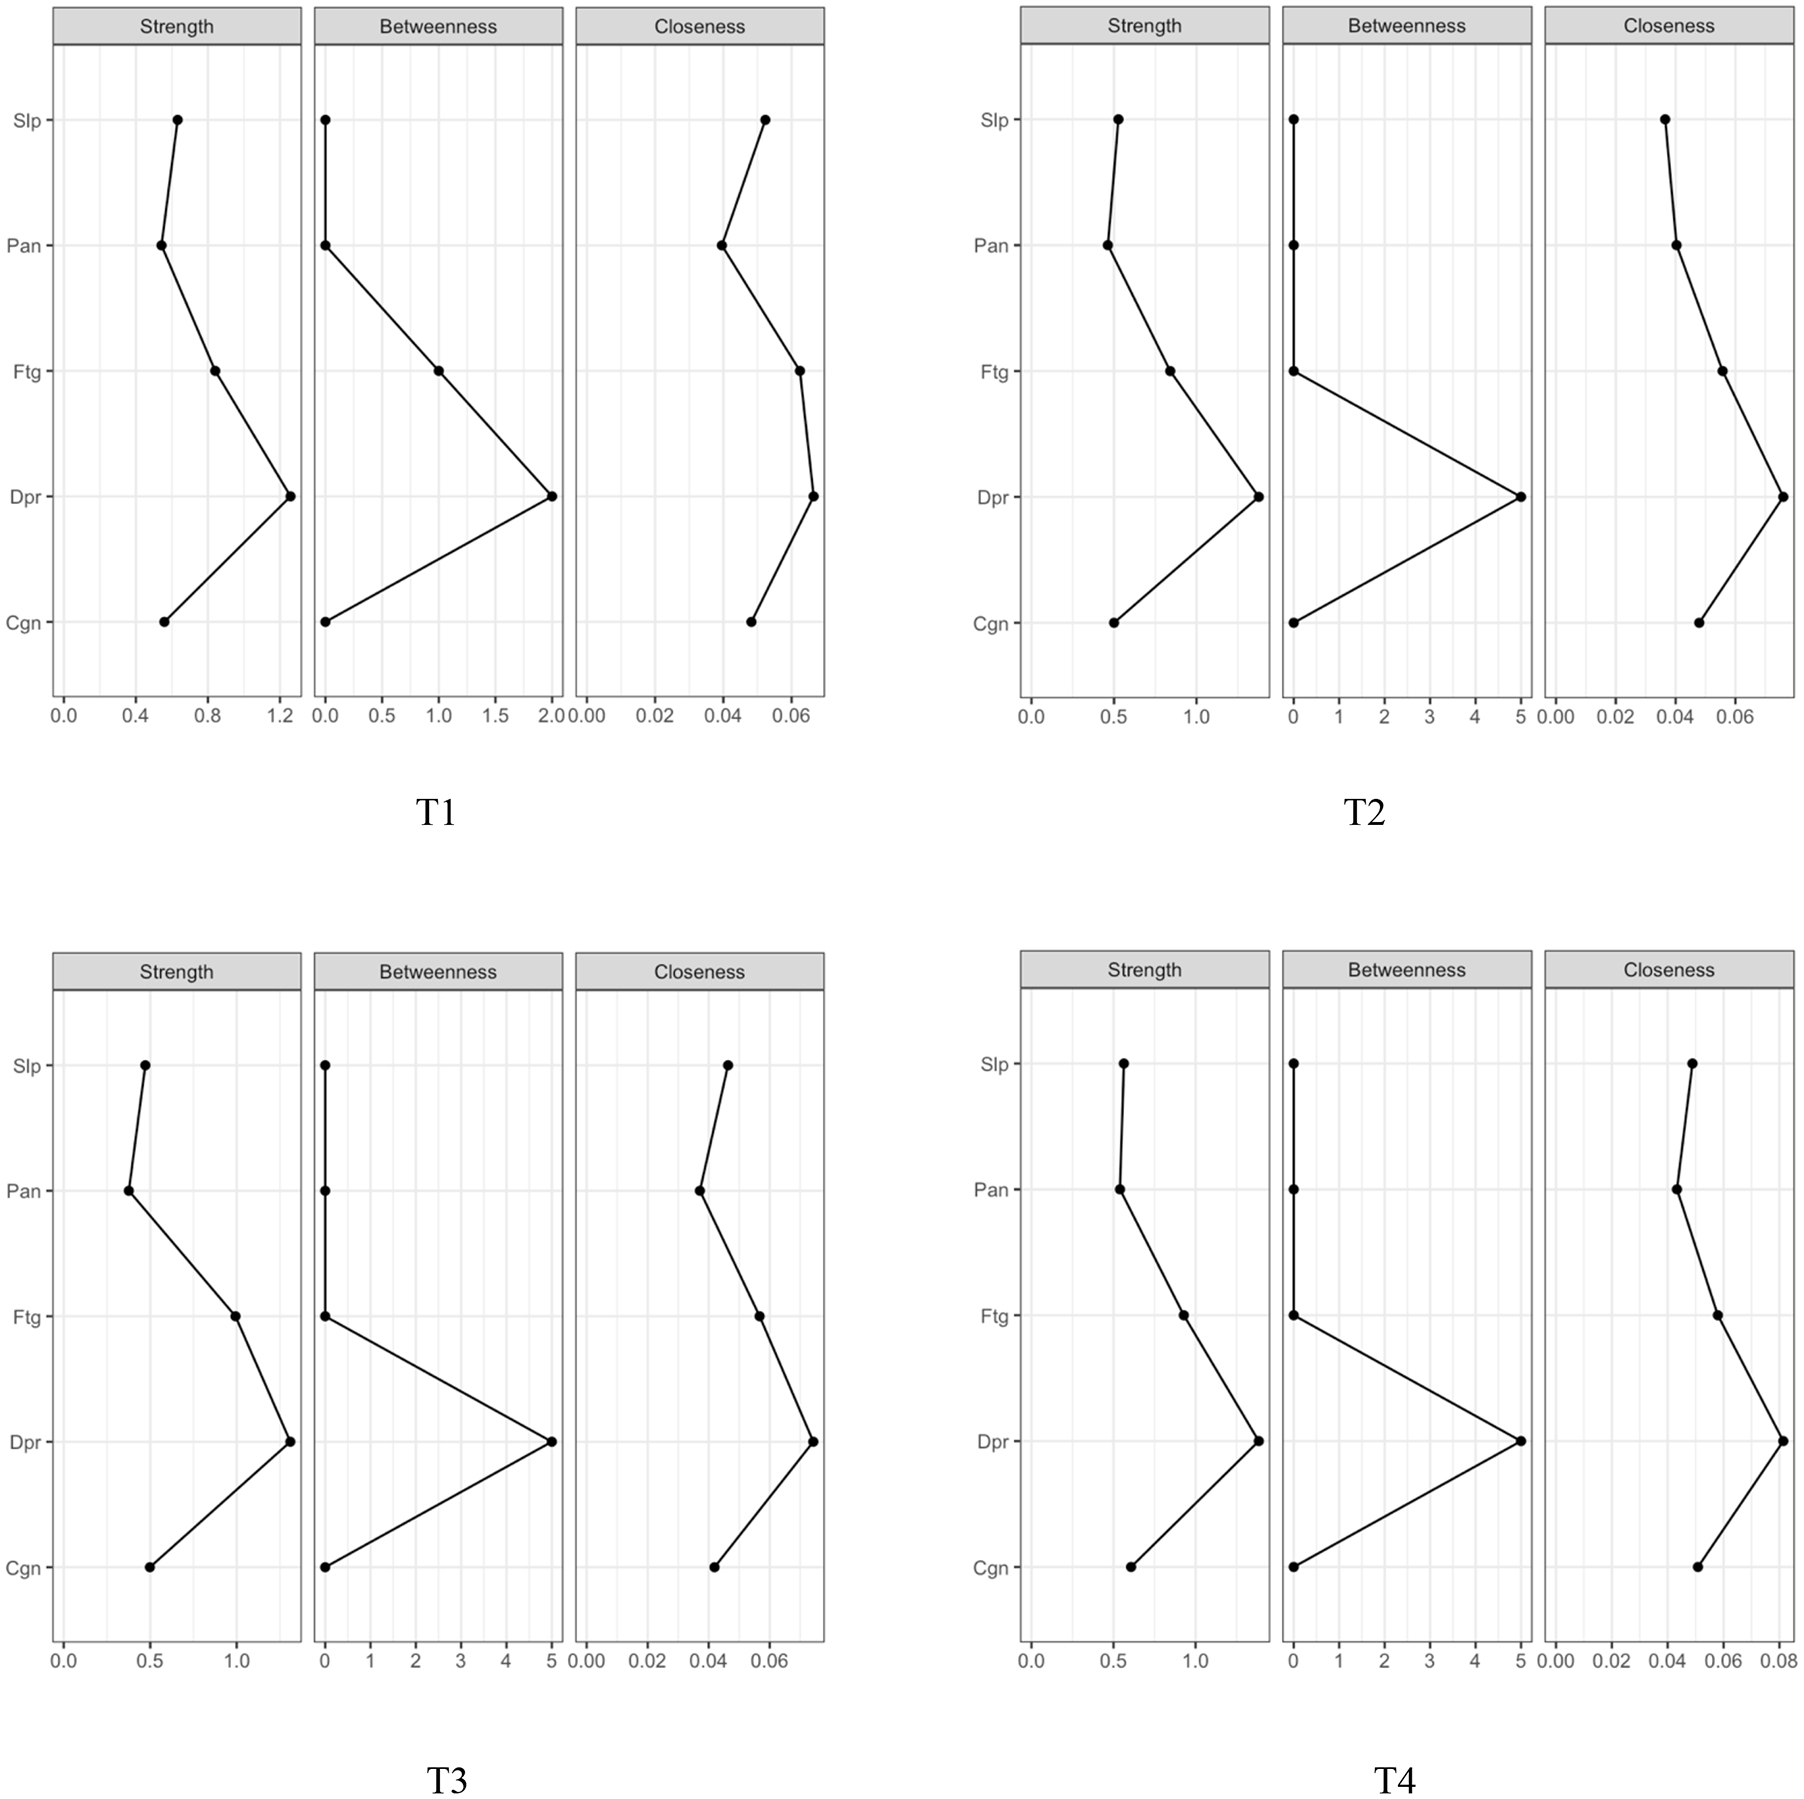
Centrality indices for psychoneurological symptoms within the networks across the four assessments
Notes: Cgn = cognitive dysfunction, Dpr = depression, Ftg = fatigue, IMRT = intensity-modulated radiotherapy, Pan=pain, Slp=sleep disturbance
Accuracy and stability of symptom networks
The edge weights in the current sample were consistent with the bootstrapped sample, which suggests that the network structure was accurate (Supplementary Figure 2). The case-dropping subset bootstrap procedure showed that the values for strength, closeness, and betweenness remained stable even after dropping large portions of the sample. The strength indices in this sample were relatively high (i.e., CS-C = .52 to .67). After dropping up to 75% of the sample, the order of the symptoms in strength was still correlated with the original network (r = .70). Therefore, we focused on the interpretation of symptom strength based on this network analysis.
Symptom network comparisons
When the symptom networks were compared at four time points, no significant differences were found among these networks (all p values > .05). In addition, we compared the symptom networks between subgroup patients who were male (n=127) vs. female (n=45), young to middle aged (n=112) vs. older aged (n=60), had no tobacco use (n=66) vs. tobacco use (n=103), had no alcohol use (n=97) vs. alcohol use (n=70), were HPV negative (n=86) vs. HPV positive (n=86), had low levels of stress (n=83) vs. moderate to high levels of stress (n=86), had surgery (n=66) vs. no surgery (n=106), and had concurrent chemotherapy (n=137) vs. no chemotherapy (n=35). Significant differences between the networks prior to IMRT were found for gender (male: 1.79 vs. female: 2.48; p = .02), stress levels (low: 1.47 vs. moderate to high: 1.85; p = .04), and alcohol use (no alcohol use: 2.41 vs. alcohol use: 1.74; p = .01) for network global strength, but not for network structure. In contrast, no significant differences were found between the networks prior to IMRT for age, smoking status, HPV status, receipt of surgery, and receipt of chemotherapy (all p values > .05). No significant differences were found at the other time points. Of note, statistical significance should be interpreted with caution due to multiple comparisons and hypotheses testing.
DISCUSSION
This study is the first to examine the relationships among PNS within networks over time and evaluate for demographic and clinical characteristics associated with symptom networks in patients with HNC. Network analysis increases our understanding of the interconnections among the five PNS and identified the core symptoms and the characteristics associated with stronger symptom networks.
Depression was the most core symptom in the network at each time point. In our study, depression was reported by 14% to 25% of patients across the four time points. While depression rates were relatively low in our patients with HNC, this finding suggests that it may play a central role among all symptoms in the PNS network. Previous studies found that depression acts as a “bridge symptom” that mediates the relationships among anxiety, posttraumatic stress disorder symptoms, and sleep disturbance.33,34 Further investigations are needed to confirm the central role that depression plays in the PNS network.
Fatigue was the second most core symptom and was reported by 54% to 75% of our patients across the four time points. While fatigue being the most prevalent symptom among our patients with HNC is consistent with previous literature,32 the interconnections between fatigue and the other PNS were relatively weaker than those for depression. However, a recent systematic review found that fatigue was the core symptom among pain, sleep disturbance, and distress.4 Compared to previous studies where fatigue was associated with sleep disturbance in patients with cancer,35,36 fatigue had no or weak relationships with sleep disturbance in our study. This weak association in our study may explain the discrepancy for regulating its central role among PNS. This inconsistency may be related to differences in cancer diagnoses and treatments. Additional research is warranted to investigate the relationships between fatigue and sleep disturbance within the PNS network among different cancer diagnoses. Taken together, depression and fatigue appear to be two core symptoms in the PNS network. Given the low occurrence rate of depression in patients with HNC, clinicians should focus more on fatigue in clinical practice because it has the highest prevalence and is the second most core symptom within PNS.
Prior research suggests that targeting a core symptom(s) may be a more effective approach for symptom interventions because it can affect multiple co-occurring symptoms.37,38 Our findings inform the field of symptom clusters research by testing a new method to identify the core symptoms for future directions. This approach may guide the development of interventional studies based on the hypothesis that treatment of either depression or fatigue may decrease the other symptoms in the PNS cluster. Clinicians may target depression and fatigue together for multi-level symptom management for patients with HNC. For example, clinicians may refer patients with higher depression or/and fatigue severity for psychological counseling39 that target both symptoms, which may decrease the other symptoms (i.e., sleep disturbance, pain, and cognitive dysfunction). In addition, clinicians may encourage patients to exercise (e.g., 80–150 minutes per week)40 during and after cancer treatment to improve depression and fatigue, as well as other symptoms.
Symptom-symptom relationships were described within each of the symptom networks over time in the present study. Our findings suggest that depression-sleep disturbance (T1, T3, and T4), depression-fatigue (T2, T3, and T4), and depression-cognitive dysfunction (T4) have the strongest relationships compared to the other symptom interconnections. The findings across difference times suggest that the interactions among these symptoms remained relatively stable during and following IMRT. Therefore, once patients’ symptom combinations are defined, the interventional strategies may be able to be used for a relatively longer period of time for multiple symptoms. Additionally, given the symptom-symptom relationships, patients may benefit from different combinations of symptom interventions, such as psychotherapy41 with sleep hygiene education35 or cognitive behavioral therapy42.
Previous studies suggested several potential underlying mechanisms for PNS, including increases in pro-inflammatory responses, dysregulation of the hypothalamic-pituitary-adrenal (HPA) axis, and neurotransmitter alterations.43,44 Additional research is warranted to determine if a primary common mechanism exists or if multiple mechanisms interact to increase symptom burden or severity. Omics approaches (e.g., genomics, transcriptomics), with their potential for exploring multiple pathways at the same time, can be used to investigate the underlying biological mechanisms of PNS. Understanding these mechanism(s) is essential to developing effective treatments across cancer types and other chronic conditions.
Three demographic and clinical characteristics were associated with stronger symptom networks prior to IMRT. While findings are inconsistent regarding gender differences in PNS among oncology patients,45,46 in our study, women were more likely to have stronger symptom networks. In addition, higher levels of stress were associated with stronger symptom networks for patients with HNC. This finding can be partially explained by repeated stressful events (e.g., cancer diagnosis and coming treatments) increasing patients’ allostatic load that results in increased symptom interactions within a network.47 Clinicians may need to teach patients different coping strategies to improve symptom management. While previous research found that alcohol use was associated with a higher symptom burden,48 in our study, no alcohol use was associated with stronger symptom networks. One hypothesis is that alcohol use dulled the patients’ experience of PNS that led to decreases in symptom interactions.49 In contrast, no significant differences in the networks were found for age, smoking status, HPV status, receipt of surgery, and receipt of chemotherapy over time. Larger studies are needed to confirm or refute these findings.
While our study is the first to examine the relationships among PNS within networks over time and evaluate for associated characteristics, several limitations warrant consideration in future studies. First, while we used the split-half sample method of exploratory and confirmatory factor analysis for symptom clusters, confirmatory factor analysis with an independent sample would be an ideal approach to determine the symptom clusters. Second, we used the regularized network estimation method and network comparison tests to evaluate for variations in the symptom networks over time which did not take temporal dependence into account. Advanced methods such as temporal network analysis50 may better investigate how symptom networks change over time. Third, we did not take treatments or medications for the PNS into account. These data should be collected in future studies (e.g., use of pain medications). Lastly, we compared the characteristics that were likely associated with PNS based on our data and literature review. Several other characteristics, such as social determinants of health, warrant additional investigation.
In conclusion, using network analysis, we characterized the symptom-symptom relationships for PNS and identified the core symptoms and associated characteristics. Depression and fatigue appeared to be two core symptoms that were connected with other PNS. With our longitudinal design, we found that the PNS networks were relatively stable over time from pre-radiotherapy to one-year post-treatment. Female gender, higher levels of stress, and no alcohol use were associated with stronger symptom networks. Future research should validate these findings. Additional work may help guide the testing of interventions to treat the PNS networks and decrease the multi-symptom burden.
Supplementary Material
Acknowledgments:
The authors appreciate the support from Emory University School of Nursing, School of Medicine, and Winship Cancer Institute. The authors are also grateful for the support from participants and research staff and students.
Funding:
The study was supported by NIH/NINR K99/R00NR014587, NIH/NINR R01NR015783, NIH/NCI P30CA138292
Footnotes
Conflict of Interest Statement:
The authors have no funding or conflicts of interest to disclose.
REFERENCES
- 1.Siegel RL, Miller KD, Fuchs HE, Jemal A. Cancer Statistics, 2021. CA Cancer J Clin. 2021;71:7–33. doi: 10.3322/caac.21654 [DOI] [PubMed] [Google Scholar]
- 2.O’Sullivan B, Rumble RB, Warde P, Members of the IIEP. Intensity-modulated radiotherapy in the treatment of head and neck cancer. Clin Oncol (R Coll Radiol). 2012;24:474–87. doi: 10.1016/j.clon.2012.05.006 [DOI] [PubMed] [Google Scholar]
- 3.Xiao W, Chan CWH, Fan Y, et al. Symptom clusters in patients with nasopharyngeal carcinoma during radiotherapy. Eur J Oncol Nurs. 2017;28:7–13. doi: 10.1016/j.ejon.2017.02.004 [DOI] [PubMed] [Google Scholar]
- 4.Mathew A, Tirkey AJ, Li H, et al. Symptom clusters in head and neck cancer: a systematic review and conceptual model. Semin Oncol Nurs. 2021;37:151215. doi: 10.1016/j.soncn.2021.151215 [DOI] [PMC free article] [PubMed] [Google Scholar]
- 5.Li Y, Li X, Mao C, et al. Symptom clusters in head and neck cancer patients with endotracheal tube: which symptom clusters are independently associated with health-related quality of life? Eur J Oncol Nurs. 2020;48:101819. doi: 10.1016/j.ejon.2020.101819 [DOI] [PubMed] [Google Scholar]
- 6.Douglas CM, Ingarfield K, McMahon AD, Savage SA, Conway DI, MacKenzie K. Presenting symptoms and long-term survival in head and neck cancer. Clin Otolaryngol. 2018;43:795–804. doi: 10.1111/coa.13053 [DOI] [PubMed] [Google Scholar]
- 7.Nayak SG, Pai MS, George LS. Quality of life of patients with head and neck cancer: a mixed method study. J Cancer Res Ther. 2019;15:638–644. doi: 10.4103/jcrt.JCRT_1123_16 [DOI] [PubMed] [Google Scholar]
- 8.Chiang SH, Ho KY, Wang SY, Lin CC. Change in symptom clusters in head and neck cancer patients undergoing postoperative radiotherapy: a longitudinal study. Eur J Oncol Nurs. 2018;35:62–66. doi: 10.1016/j.ejon.2018.01.014 [DOI] [PubMed] [Google Scholar]
- 9.Kim HJ, Malone PS. Roles of biological and psychosocial factors in experiencing a psychoneurological symptom cluster in cancer patients. Eur J Oncol Nurs. 2019;42:97–102. doi: 10.1016/j.ejon.2019.08.005 [DOI] [PubMed] [Google Scholar]
- 10.Kim HJ, Barsevick AM, Tulman L. Predictors of the intensity of symptoms in a cluster in patients with breast cancer. J Nurs Scholarsh. 2009;41:158–65. doi: 10.1111/j.1547-5069.2009.01267.x [DOI] [PMC free article] [PubMed] [Google Scholar]
- 11.Hevey D Network analysis: a brief overview and tutorial. Health Psychol Behav Med. 2018;6:301–328. doi: 10.1080/21642850.2018.1521283 [DOI] [PMC free article] [PubMed] [Google Scholar]
- 12.Borsboom D, Cramer AO. Network analysis: an integrative approach to the structure of psychopathology. Annu Rev Clin Psychol. 2013;9:91–121. doi: 10.1146/annurev-clinpsy-050212-185608 [DOI] [PubMed] [Google Scholar]
- 13.Epskamp S, Fried EI. A tutorial on regularized partial correlation networks. Psychol Methods. 2018;23:617–634. doi: 10.1037/met0000167 [DOI] [PubMed] [Google Scholar]
- 14.Cheung T, Jin Y, Lam S, et al. Network analysis of depressive symptoms in Hong Kong residents during the COVID-19 pandemic. Transl Psychiatry. 2021;11:460. doi: 10.1038/s41398-021-01543-z [DOI] [PMC free article] [PubMed] [Google Scholar]
- 15.Epskamp S, Borsboom D, Fried EI. Estimating psychological networks and their accuracy: a tutorial paper. Behav Res Methods. 2018;50:195–212. doi: 10.3758/s13428-017-0862-1 [DOI] [PMC free article] [PubMed] [Google Scholar]
- 16.Xiao C, Beitler JJ, Higgins KA, et al. Fatigue is associated with inflammation in patients with head and neck cancer before and after intensity-modulated radiation therapy. Brain Behav Immun. 2016;52:145–152. doi: 10.1016/j.bbi.2015.10.016 [DOI] [PMC free article] [PubMed] [Google Scholar]
- 17.Xiao C, Miller AH, Peng G, et al. Association of epigenetic age acceleration with risk factors, survival, and quality of life in patients with head and neck cancer. Int J Radiat Oncol Biol Phys. 2021;111:157–167. doi: 10.1016/j.ijrobp.2021.04.002 [DOI] [PMC free article] [PubMed] [Google Scholar]
- 18.Oken MM, Creech RH, Tormey DC, et al. Toxicity and response criteria of the Eastern Cooperative Oncology Group. Am J Clin Oncol. 1982;5:649–655. [PubMed] [Google Scholar]
- 19.Charlson ME, Pompei P, Ales KL, MacKenzie CR. A new method of classifying prognostic comorbidity in longitudinal studies: development and validation. J Chronic Dis. 1987;40:373–83. doi: 10.1016/0021-9681(87)90171-8 [DOI] [PubMed] [Google Scholar]
- 20.Cohen S, Kamarck T, Mermelstein R. A global measure of perceived stress. J Health Soc Behav.1983;24:385–396. [PubMed] [Google Scholar]
- 21.Dueck AC, Mendoza TR, Mitchell SA, et al. Validity and reliability of the US National Cancer Institute’s patient-reported outcomes version of the common terminology criteria for adverse events (PRO-CTCAE). JAMA Oncol. 2015;1:1051–1059. doi: 10.1001/jamaoncol.2015.2639 [DOI] [PMC free article] [PubMed] [Google Scholar]
- 22.Pressler SJ, Subramanian U, Perkins SM, et al. Measuring depressive symptoms in heart failure: validity and reliability of the patient health questionnaire-8. Am J Crit Care. 2011;20:146–152. doi: 10.4037/ajcc2010931 [DOI] [PubMed] [Google Scholar]
- 23.Buysse DJ, Reynolds CF, Monk TH, Berman SR, Kupfer DJ. The Pittsburgh Sleep Quality Index: a new instrument for psychiatric practice and research. Psychiatry Res. 1989;28:193–213. doi: 10.1016/0165-1781(89)90047-4 [DOI] [PubMed] [Google Scholar]
- 24.Smets EM, Garssen B, Bonke B, De Haes JC. The Multidimensional Fatigue Inventory (MFI) psychometric qualities of an instrument to assess fatigue. J Psychosom Res. 1995;39:315–325. doi: 10.1016/0022-3999(94)00125-o [DOI] [PubMed] [Google Scholar]
- 25.Kroenke K, Strine TW, Spitzer RL, Williams JB, Berry JT, Mokdad AH. The PHQ-8 as a measure of current depression in the general population. J Affect Disord. 2009;114:163–173. doi: 10.1016/j.jad.2008.06.026 [DOI] [PubMed] [Google Scholar]
- 26.Andic F, Miller AH, Brown G, et al. Instruments for determining clinically relevant fatigue in breast cancer patients during radiotherapy. Breast Cancer. 2020;27:197–205. doi: 10.1007/s12282-019-01008-8 [DOI] [PubMed] [Google Scholar]
- 27.Buysse DJ, Hall ML, Strollo PJ, et al. Relationships between the Pittsburgh Sleep Quality Index (PSQI), Epworth Sleepiness Scale (ESS), and clinical/polysomnographic measures in a community sample. J Clin Sleep Med. 2008;4:563–571. [PMC free article] [PubMed] [Google Scholar]
- 28.National Cancer Institute. Patient-Reported Outcomes version of the Common Terminology Criteria for Adverse Events (PRO-CTCAE®). Accessed October 15, 2021. https://healthcaredelivery.cancer.gov/pro-ctcae/ [DOI] [PMC free article] [PubMed]
- 29.Brownlee J A gentle introduction to Expectation-Maximization (EM algorithm). Accessed May 20, 2022. https://machinelearningmastery.com/expectation-maximization-em-algorithm/
- 30.Moon TK. The expectation-maximization algorithm. IEEE Signal Processing Magazine. 1996;13:47–60. doi: 10.1109/79.543975 [DOI] [Google Scholar]
- 31.Xiao C, Hanlon A, Zhang Q, et al. Risk factors for clinician-reported symptom clusters in patients with advanced head and neck cancer in a phase 3 randomized clinical trial: RTOG 0129. Cancer. 2014;120:848–854. doi: 10.1002/cncr.28500 [DOI] [PMC free article] [PubMed] [Google Scholar]
- 32.Xiao C, Hanlon A, Zhang Q, et al. Symptom clusters in patients with head and neck cancer receiving concurrent chemoradiotherapy. Oral Oncol. 2013;49:360–366. doi: 10.1016/j.oraloncology.2012.10.004 [DOI] [PMC free article] [PubMed] [Google Scholar]
- 33.Garabiles MR, Lao CK, Xiong Y, Hall BJ. Exploring comorbidity between anxiety and depression among migrant Filipino domestic workers: a network approach. J Affect Disord. 2019;250:85–93. doi: 10.1016/j.jad.2019.02.062 [DOI] [PubMed] [Google Scholar]
- 34.Garabiles MR, Lao CK, Wang S, Hall BJ. The network structure of posttraumatic stress disorder among Filipina migrant domestic workers: comorbidity with depression. Eur J Psychotraumatol. 2020;11:1765544. doi: 10.1080/20008198.2020.1765544 [DOI] [PMC free article] [PubMed] [Google Scholar]
- 35.Medysky ME, Temesi J, Culos-Reed SN, Millet GY. Exercise, sleep and cancer-related fatigue: are they related? Neurophysiol Clin. 2017;47:111–122. doi: 10.1016/j.neucli.2017.03.001 [DOI] [PubMed] [Google Scholar]
- 36.Charalambous A, Berger AM, Matthews E, Balachandran DD, Papastavrou E, Palesh O. Cancer-related fatigue and sleep deficiency in cancer care continuum: concepts, assessment, clusters, and management. Support Care Cancer. 2019;27:2747–2753. doi: 10.1007/s00520-019-04746-9 [DOI] [PubMed] [Google Scholar]
- 37.Mullarkey MC, Marchetti I, Beevers CG. Using network analysis to identify central symptoms of adolescent depression. J Clin Child Adolesc Psychol. 2019;48:656–668. doi: 10.1080/15374416.2018.1437735 [DOI] [PMC free article] [PubMed] [Google Scholar]
- 38.Rha SY, Lee J. Stable symptom clusters and evolving symptom networks in relation to chemotherapy cycles. J Pain Symptom Manage. 2021;61:544–554. doi: 10.1016/j.jpainsymman.2020.08.008 [DOI] [PubMed] [Google Scholar]
- 39.Trevino KM, Iyengar N, Li Q, Mao JJ. Receipt of psychological counseling and integrative medicine services among breast cancer survivors with anxiety. Breast Cancer Res Treat. 2020;184:301–310. doi: 10.1007/s10549-020-05859-0 [DOI] [PMC free article] [PubMed] [Google Scholar]
- 40.Schwartz AL, de Heer HD, Bea JW. Initiating exercise interventions to promote wellness in cancer patients and survivors. Oncology (Williston Park). 2017;31:711–7. [PMC free article] [PubMed] [Google Scholar]
- 41.Okuyama T, Akechi T, Mackenzie L, Furukawa TA. Psychotherapy for depression among advanced, incurable cancer patients: a systematic review and meta-analysis. Cancer Treat Rev. 2017;56:16–27. doi: 10.1016/j.ctrv.2017.03.012 [DOI] [PubMed] [Google Scholar]
- 42.Sandler CX, Goldstein D, Horsfield S, et al. Randomized evaluation of cognitive-behavioral therapy and graded exercise therapy for post-cancer fatigue. J Pain Symptom Manage. 2017;54:74–84. doi: 10.1016/j.jpainsymman.2017.03.015 [DOI] [PubMed] [Google Scholar]
- 43.Kim HJ, Barsevick AM, Fang CY, Miaskowski C. Common biological pathways underlying the psychoneurological symptom cluster in cancer patients. Cancer Nurs. 2012;35:E1–E20. doi: 10.1097/NCC.0b013e318233a811 [DOI] [PubMed] [Google Scholar]
- 44.Miaskowski C, Aouizerat BE. Is there a biological basis for the clustering of symptoms? Semin Oncol Nurs. 2007;23:99–105. doi: 10.1016/j.soncn.2007.01.008 [DOI] [PubMed] [Google Scholar]
- 45.Lin Y, Bailey DE Jr., Docherty SL, et al. Distinct profiles of multiple co-occurring symptoms in patients with gastrointestinal cancers receiving chemotherapy. Support Care Cancer. 2021;29:4461–4471. doi: 10.1007/s00520-020-05946-4 [DOI] [PMC free article] [PubMed] [Google Scholar]
- 46.Lin Y, Bailey DE Jr., Docherty SL, et al. Distinct sleep disturbance profiles in patients with gastrointestinal cancers receiving chemotherapy. Cancer Nurs. 2022;45:e417–427. doi: 10.1097/NCC.0000000000000975 [DOI] [PMC free article] [PubMed] [Google Scholar]
- 47.Stephens MA, Wand G. Stress and the HPA axis: role of glucocorticoids in alcohol dependence. Alcohol Res. 2012;34:468–83. [DOI] [PMC free article] [PubMed] [Google Scholar]
- 48.Webber K, Davies AN, Leach C, Bradley A. Alcohol and drug use disorders in patients with cancer and caregivers: effects on caregiver burden. BMJ Support Palliat Care. 2020;10:242–247. doi: 10.1136/bmjspcare-2019-002127 [DOI] [PubMed] [Google Scholar]
- 49.Valenzuela CF. Alcohol and neurotransmitter interactions. Alcohol Health Res World. 1997;21:144–8. [PMC free article] [PubMed] [Google Scholar]
- 50.Perer A, Sun J. MatrixFlow: temporal network visual analytics to track symptom evolution during disease progression. AMIA Annu Symp Proc. 2012;2012:716–25. [PMC free article] [PubMed] [Google Scholar]
Associated Data
This section collects any data citations, data availability statements, or supplementary materials included in this article.