

Abstract
Objective:
This study describes characteristics of large tuberculosis (TB) outbreaks in the United States detected using novel molecular surveillance methods during 2014–2016 and followed for 2 years through 2018.
Methods:
We developed 4 genotype-based detection algorithms to identify large TB outbreaks of ≥10 cases related by recent transmission during a 3-year period. We used whole-genome sequencing and epidemiologic data to assess evidence of recent transmission among cases.
Results:
There were 24 large outbreaks involving 518 cases; patients were primarily U.S.-born (85.1%) racial/ethnic minorities (84.1%). Compared with all other TB patients, patients associated with large outbreaks were more likely to report substance use, homelessness, and having been diagnosed while incarcerated. Most large outbreaks primarily occurred within residences among families and nonfamilial social contacts. A source case with a prolonged infectious period and difficulties in eliciting contacts were commonly reported contributors to transmission.
Conclusion:
Large outbreak surveillance can inform targeted interventions to decrease outbreak-associated TB morbidity.
Keywords: Tuberculosis, Outbreaks, Whole-genome sequencing, Surveillance
1. Introduction
Despite progress towards tuberculosis (TB) elimination, outbreaks continue to challenge TB control efforts in the United States [1–4]. Successful outbreak control and prevention strategies require prompt identification and treatment of patients with TB disease followed by identification and evaluation of exposed contacts for latent TB infection (LTBI) preventive therapy [5]. Because outbreaks often occur in the context of barriers to identifying and treating these conditions [1], understanding characteristics of affected persons might inform strategies to focus interventions toward persons at-risk for TB disease, overcome these barriers, and, ultimately, reduce outbreak-associated morbidity. While the Centers for Disease Control and Prevention (CDC) identifies some outbreaks through routine genotyping surveillance and requests for supplemental assistance from state, tribal, local, and territorial partners, no systematic, national surveillance for TB outbreaks existed before 2014. Previous reports describing aggregate characteristics of outbreaks have only focused on outbreaks where CDC assistance was requested, which might not represent all outbreaks nationally [1,3].
CDC routinely uses genotype-based cluster detection methods to identify spatiotemporal concentrations of genotype-matched cases that might represent recent TB transmission [6,7]. The National TB Geno-typing Service began universal genotyping of at least one Mycobacterium tuberculosis isolate from each culture-confirmed TB case in the United States in 2004 [8]. However, conventional genotyping methods only examine <1% of the M. tuberculosis genome, so the molecular resolution can be insufficient for distinguishing isolates presumably involved in recent transmission [8–10]. In 2012, CDC began whole-genome sequencing (WGS) of select M. tuberculosis isolates. Analysis of WGS data offers increased molecular resolution by expanding the examined portion of the genome to ~90% to facilitate measurements of genetic distances between isolates at the level of single nucleotide polymorphisms (SNPs). Together with epidemiologic data, analyses of WGS data can more precisely identify outbreak-related cases involved in the same chain of recent transmission [10].
Combined use of universal conventional M. tuberculosis genotyping to identify possible outbreaks followed by analysis of WGS data to more precisely define outbreak-related cases has facilitated implementation of national TB outbreak surveillance. In this paper, we describe characteristics of large TB outbreaks of ≥10 cases (i.e., an arbitrary number of cases that many jurisdictions would consider a large outbreak) that were initially detected using novel molecular surveillance methods during 2014–2016 and followed prospectively for 2 years through 2018.
2. Materials and methods
2.1. Detection of possible large outbreaks
We defined a large TB outbreak as ≥10 cases of M. tuberculosis related by recent transmission during a 3-year period. Genotypes were characterized using a combination of spacer oligonucleotide typing (spoligotyping) and 24-locus mycobacterial interspersed repetitive unit–variable number tandem repeat (MIRU-VNTR) typing [8]. To systematically detect clusters of ≥10 genotype-matched TB cases (i.e., possible large outbreaks) for further investigation to determine whether they represented recent transmission, we developed 4 detection algorithms that were run quarterly during 2014–2016 using cases reported to the National TB Surveillance System (NTSS) (Appendix sections 1.1 and 1.2). Briefly, each algorithm uses different geographic (county, state, national, or cross-jurisdictional boundary using circular windows of up to a 50-km radius) and statistical criteria to search for at least 10 genotype-matched cases during a 3-year detection period (Table 1; Appendix Figure) [7,11]. The algorithms were designed to identify possible large outbreaks by either detecting an unexpected concentration of a genotype within a defined geographic area, requiring a preceding 24-month period with no genotype-matched cases in the area (‘incident genotypes’), or both. We focused surveillance on incident genotypes to increase the likelihood that detected clusters represented recent transmission (i.e., prevalent or commonly circulating genotypes are more likely to represent reactivation of infection acquired in the remote past). Because the algorithms were not designed to detect outbreaks with nongenotyped cases or outbreaks among cases with closely related but nominally distinct genotypes, we also allowed for manual identification of large outbreaks. Manually identified large outbreaks were detected on an ad hoc basis through reviews of routine surveillance data by CDC staff and through state and local health department report. Large outbreaks known to be ongoing when surveillance was initiated were suppressed from alerting and not included in the analysis.
Table 1.
Methods and criteria for detection of possible large outbreaks of tuberculosis (TB) in the United Statesa.
| Cluster detection method | Genotype | Geography | Additional criteria | |
|---|---|---|---|---|
| Detection algorithms | County | Exact genotype match | County | Log-likelihood ratio (LLR) statistic ≥10b |
| State | State | No genotype-matched cases in the state 24 months before initial case in cluster | ||
| National | United States | No genotype-matched cases in the United States 24 months before initial case in cluster | ||
| SaTScanc | Up to 50-km radius | Significant geospatial concentration of cases based on LLR statistic and no genotype-matched cases 24 months before initial case in cluster | ||
| Manual identification | TB program report | Matching or closely related genotype or known epidemiologic link for nongenotyped cases | Any | None |
| Routine cluster review by CDC staff |
Possible large outbreaks of TB are defined as 10 or more cases diagnosed within a 3-year time period that meet the additional criteria for any method above.
The log-likelihood ratio (LLR) statistic compares the ratio of cases with a particular genotype to all genotyped cases within a given county (i.e., observed) to this same ratio in the United States (i.e., expected) [7]. Values of ≥10 indicate an unexpected concentration of a genotype within a given county. The LLR method excludes possible large outbreaks that met the criteria for a possible large outbreak at the time surveillance was initiated.
SaTScan is a spatial scan statistic that utilizes the LLR statistic to identify a significant geospatial concentration of genotype-matched cases [11]. Clusters are identified within circular windows of up to a 50-km radius using ZIP code centroid.
2.2. Assessment of recent transmission to define outbreak-related cases
For each possible large outbreak identified by any of the detection methods, we determined the number of cases that were likely related by recent transmission (i.e., outbreak-related) during the 3-year detection period using a combination of WGS and local epidemiologic data provided through partnership with state health departments. We used whole-genome single nucleotide polymorphism (wgSNP) comparisons of M. tuberculosis isolates from cases identified in possible large outbreaks (Appendix section 2.1). We defined an epidemiologic link as known or probable contact between 2 patients during either patient’s infectious period, as determined by the investigating health department (Appendix section 2.2). The following criteria were used to classify cases as outbreak-related :
The case’s isolate was within ≤2 SNPs of another isolate from an outbreak-related case; or
The case’s isolate was within ≤5 SNPs of another isolate from an outbreak-related case, and the case was epidemiologically linked to the outbreak; or
WGS data were not available for the case (e.g., clinically diagnosed case with no available isolate), but the case was epidemiologically linked by the health department to the outbreak.
The detection algorithms might not capture all outbreak-related cases, including those with variant genotypes, clinically diagnosed cases, or cases diagnosed outside of the specified geographic area. Any such cases that were identified by health departments or through review of surveillance data by CDC staff were classified as outbreak-related using the criteria above.
2.3. Follow-up and classification of possible large outbreaks
For possible large outbreaks that had ≥5 outbreak-related cases in the initial 3-year detection period, we continued surveillance prospectively during a 2-year follow-up period to characterize continued growth of large outbreaks and to identify any large outbreaks that did not initially meet the large outbreak criteria. During this period, we continued to compile epidemiologic data and perform wgSNP comparisons for all isolates from genotype-matched cases within the specified geographic area(s). Possible large outbreaks with <5 cases meeting the outbreak-related criteria in the initial detection period were not followed. If ≥ 10 outbreak-related cases were identified during any 3-year period within the combined 5-year detection and follow-up periods, the outbreak was counted as a large outbreak (Appendix Figure).
2.4. Characteristics associated with large outbreaks
We described characteristics of cases in large outbreaks over the entire 5-year surveillance period (i.e., 3-year detection and 2-year follow-up periods). We compiled summary data for each large outbreak to describe outbreak characteristics and affected populations using a combination of patient-level TB surveillance data reported to NTSS and the county’s 5-year U.S. Census population data from the American Community Survey for 2012–2016, the time period that included the highest percentage of all cases identified in large outbreaks (93.1%). County-level measures were based on the county of residence for >50% of cases in each large outbreak.
To describe the geographic distribution of cases in large outbreaks, we calculated the median distance between case pairs using the ZIP code centroid of reported residency at diagnosis. To describe the temporal distribution of cases in large outbreaks, we calculated the median time between the earliest reported case and each subsequent outbreak-related case during the 5-year surveillance period for each outbreak. The CDC Social Vulnerability Index (CDC SVI) uses U.S. Census data to describe the potential negative effects on communities caused by external stressors on human health [12,13]. The CDC SVI ranks each county on a scale from 0 to 1 using 15 social factors within 4 overall themes: socioeconomic status, household composition and disability, racial/ethnic minority status and language, and housing type and transportation [12,13]. We compared patients’ demographic, clinical, and social risk factor data for TB cases in large outbreaks with all other U.S. TB cases reported during 2010–2018. Large outbreaks detected during 2014–2016 could include TB cases reported during 2010–2018 because the detection and follow-up periods extend before and after the date of first detection.
In collaboration with state health departments, we qualitatively summarized the primary transmission settings and contributing factors for each large outbreak. These data were based on local knowledge and investigations (sometimes with CDC onsite assistance) of the outbreaks. We categorized outbreaks based on the primary transmission settings and contributing factors that were identified for the entire outbreak (i.e., case-level data on transmission settings and contributors to transmission were not reported). Primary transmission settings included residences with transmission primarily within families, residences with transmission primarily among nonfamily social contacts (e.g., persons who use substances together, friends), overnight congregate facilities, and other congregate settings. Although some degree of transmission within families is expected for most residential outbreaks, we only classified outbreaks as such if the health department reported that transmission primarily occurred within families. Overnight congregate settings were facilities where infection control measures for occupants staying overnight would be recommended by public health authorities, such as correctional facilities, overnight homeless shelters, hospitals, and long-term care facilities. Other congregate settings, which typically lack such measures, include schools, places of worship, workplaces, and restaurants/cafés/bars. Outbreaks were characterized as having a source case with a prolonged infectious period as a contributing factor if the program reported that one individual with a long infectious period (≥6 months) was the apparent source leading to most or all of the secondary cases in the outbreak.
All statistical analyses were performed using SAS 9.4 (SAS Institute, Cary, NC). This activity was reviewed by CDC and was conducted consistent with applicable federal law and CDC policy.1
3. Results
3.1. Detection of large outbreaks
We detected 41 possible large outbreaks during 2014–2016 (Fig. 1). Of these, 24 (58.5%) were counted as large outbreaks. These 24 large outbreaks were detected primarily using county-based (n = 11, 45.8%) and state-based detection (n = 5, 20.8%) methods. Among the remaining possible large outbreaks detected, 9 (22.0%) included 5–9 cases related by recent transmission, and 8 (19.5%) included <5 cases related by recent transmission.
Fig. 1.
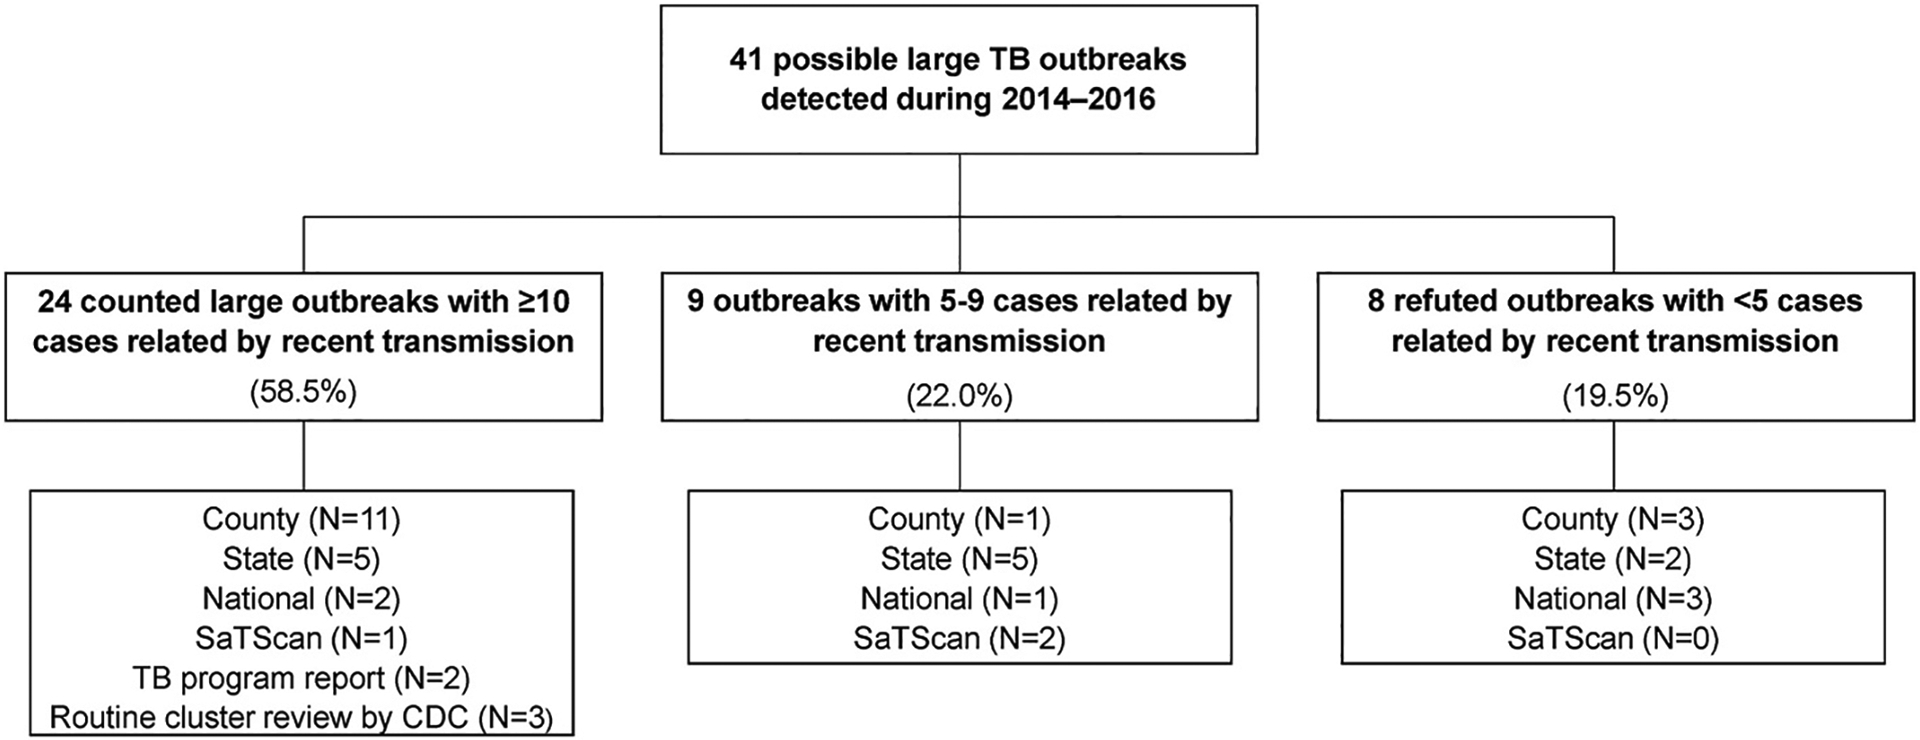
Possible large outbreaks of tuberculosis (TB) by classification status and method of first detection. Large outbreaks that are detected through manual identification (TB program report and routine cluster review by CDC staff) are by default always counted large outbreaks at detection. One of the five outbreaks detected through manual identification was also identified by one of the detection algorithms after the outbreak had been identified manually.
The 24 large outbreaks included 518 cases (median: 18.5 cases per outbreak; maximum: 45 cases) and were identified in 15 states or reporting jurisdictions, including Alaska (n = 3), Alabama (n = 2), Arkansas (n = 1), California (n = 3), Florida (n = 2), Georgia (n = 2), Hawaii (n = 1), Indiana (n = 1), North Carolina (n = 1), North Dakota (n = 1), New York City (n = 1), South Dakota (n = 1), Tennessee (n = 1), Texas (n = 3), and Wisconsin (n = 1). Of the 518 cases, 93 (18%) were not culture-confirmed, but health departments epidemiologically linked these cases to the outbreaks. One third of large outbreaks occurred in states or reporting jurisdictions with TB incidence rates below the national average of 3.0 cases per 100,000 population during 2012–2016. Six outbreaks included cases reported in >1 state; of these, 4 reported just a single case outside of the primary state (maximum: 4 cases) (Table 2). Across all outbreaks, the median number of counties (or county equivalent areas) reporting outbreak-related cases was 3 (range: 1–15 counties). However, 19 large outbreaks had ≥70% of outbreak-related cases reported by a single county. The median geographic distance between patient pairs within a large outbreak was 9.7 km (6 miles) (range: 0–200.4 km (0–124.5 miles)). The median time between the earliest reported case and each subsequent outbreak-related case was 1.6 years (range: 0.1–3.9 years); 7 outbreaks had median times of <1 year. Large outbreaks raised the TB incidence of the primarily affected counties by a median of 50% (median ratio comparing county incidence rates with and without outbreak-related cases: 1.5, range: 1.0–11.6). Fourteen (60.9%) large outbreaks occurred primarily in counties that were considered to have moderate-to-high or high social vulnerability (CDC SVI >0.5).
Table 2.
Characteristics and affected populations of large outbreaks of tuberculosis detected in the United States during 2014–2016a.
| Outbreak characteristics | Affected population | |||||||||
|---|---|---|---|---|---|---|---|---|---|---|
| Outbreak ID | Case count | No. states reporting outbreak cases | No. counties reporting outbreak cases | Median distance between patient pairs, km (miles)b | Median time from first to subsequent cases, yearsc | Percent U. S.-born | Percent in ethnic/racial minorityd | County incidence with/without outbreak cases (per 100,000)e | Ratiof | CDC SVIg |
| 1 | 17 | 3 | 5 | 200.4 (124.5) | 0.1 | 64.7 | 100.0 | 2.8/0.9 | 3.1 | 0.2 |
| 2 | 26 | 2 | 2 | 12.6 (7.8) | 3.9 | 80.8 | 100.0 | 5.4/4.8 | 1.1 | 0.8 |
| 3 | 19 | 1 | 1 | 0.0 (0.0) | 0.4 | 100.0 | 100.0 | 92.6/22.5 | 4.1 | 0.9 |
| 4 | 30 | 1 | 6 | 2.4 (1.5) | 0.7 | 93.3 | 96.7 | 8.0/1.4 | 5.7 | 0.2 |
| 5 | 19 | 1 | 6 | 37.0 (23.0) | 2.2 | 89.5 | 84.2 | 3.1/2.1 | 1.5 | 0.7 |
| 6 | 31 | 1 | 3 | 14.5 (9.0) | 1.9 | 90.3 | 45.2 | 6.8/6.0 | 1.1 | 0.9 |
| 7 | 20 | 2 | 3 | 0.0 (0.0) | 2.3 | 100.0 | 100.0 | 70.0/7.0 | 10.0 | 0.5 |
| 8 | 26 | 1 | 5 | 20.9 (13.0) | 2.4 | 100.0 | 96.2 | 6.7/3.2 | 2.1 | 0.9 |
| 9 h | 45 | 1 | NA | NA | 1.6 | 95.6 | 86.7 | NA | NA | NA |
| 10 | 18 | 1 | 2 | 3.1 (1.9) | 1.3 | 5.6 | 100.0 | 6.8/6.7 | 1.0 | 0.8 |
| 11 | 14 | 1 | 3 | 14.2 (8.8) | 2.0 | 71.4 | 100.0 | 4.7/4.5 | 1.0 | 0.8 |
| 12 | 25 | 2 | 3 | 1.9 (1.2) | 0.6 | 32.0 | 100.0 | 9.4/7.3 | 1.3 | 0.6 |
| 13 | 18 | 1 | 1 | 14.3 (8.9) | 1.1 | 100.0 | 100.0 | 6.1/5.7 | 1.1 | 0.7 |
| 14 | 38 | 1 | 15 | 198.0 (123.0) | 2.0 | 84.2 | 76.3 | 3.9/3.6 | 1.1 | 0.4 |
| 15 | 16 | 1 | 3 | 0.0 (0.0) | 0.4 | 100.0 | 62.5 | 5.1/1.8 | 2.8 | 0.3 |
| 16 | 42 | 1 | 8 | 0.0 (0.0) | 2.3 | 100.0 | 95.2 | 71.0/6.1 | 11.6 | 0.9 |
| 17 | 16 | 1 | 4 | 9.7 (6.0) | 1.4 | 100.0 | 37.5 | 4.8/4.5 | 1.1 | 0.8 |
| 18 | 11 | 1 | 1 | 5.5 (3.4) | 0.9 | 36.4 | 100.0 | 9.6/9.4 | 1.0 | 0.5 |
| 19 | 11 | 1 | 3 | 0.0 (0.0) | 1.6 | 100.0 | 100.0 | 63.4/0.0 | NA | 0.9 |
| 20 | 14 | 1 | 2 | 0.0 (0.0) | 0.4 | 100.0 | 100.0 | 77.6/17.5 | 4.4 | 0.9 |
| 21 | 10 | 1 | 3 | 17.2 (10.7) | 1.1 | 40.0 | 80.0 | 3.0/2.5 | 1.2 | 0.3 |
| 22 | 15 | 1 | 3 | 26.4 (16.4) | 2.0 | 100.0 | 100.0 | 1.2/0.6 | 2.0 | 0.4 |
| 23 | 17 | 3 | 4 | 11.1 (6.9) | 2.3 | 100.0 | 100.0 | 4.5/3.1 | 1.5 | 0.9 |
| 24 | 20 | 2 | 3 | 6.1 (3.8) | 2.2 | 100.0 | 85.0 | 3.3/2.1 | 1.6 | 0.5 |
| Total a | 18.5 (10–45) | 1 (1–3) | 3 (1–15) | 9.7 (6.0) (0–200.4 (124.5)) | 1.6 (0.1–3.9) | 97.8 (5.6–100) | 100.0 (37.5–100) | 6.1/4.5 (1.2–92.6/0–22.5) | 1.5 (1.0–11.6) | 0.7 (0.2–0.9) |
Large outbreaks detected during 2014–2016 could include cases reported from 2010 to 2018 because the surveillance time periods extend before and after the date of first detection. Values describing the totals represent the median (range).
Median distance between all case pairs based on the ZIP code centroid of reported residency at diagnosis; city of residence was used if ZIP code was missing.
Median time between the earliest reported case and each subsequent outbreak-related case during the 5-year outbreak surveillance period.
Ethnic/racial minorities include persons who were reported as a race or ethnic group other than non-Hispanic White.
Incidence rates were calculated for the county in which >50% of outbreak-related cases resided. For each outbreak, the county’s TB case counts with and without the outbreak-related cases were averaged over the respective 5-year outbreak surveillance periods and divided by the 2012–2016 American Community Survey county population estimates.
Ratio comparing the TB incidence rate with outbreak-related cases to the TB incidence rate without outbreak-related cases for the county in which >50% of outbreak-related cases resided.
The CDC Social Vulnerability Index (CDC SVI) uses 5-year U.S. Census data from the American Community Survey for 2012–2016 to describe the potential negative effects on communities caused by external stressors on human health. The CDC SVI ranks each county on 15 social factors within four overall themes, including socioeconomic status, household composition and disability, minority status and language, and housing type and transportation. Percentile ranking values range from 0 to 1, with higher values indicating greater vulnerability. Values ≤ 0.25 indicate low vulnerability; values > 0.25–0.5 indicate low-to-moderate vulnerability; values > 0.5–0.75 indicate moderate-to-high vulnerability, and values > 0.75 indicate high vulnerability. The CDC SVI is reported for the county of residence for >50% of cases in each large outbreak. See: Centers for Disease Control and Prevention/Agency for Toxic Substances and Disease Registry/Geospatial Research, Analysis, and Services Program. CDC Social Vulnerability Index 2016 Database US. https://www.atsdr.cdc.gov/placeandhealth/svi/data_documentation_download.html. Accessed on March 22, 2021.
County-level and distance measures could not be reported for this large outbreak due to surveillance artifacts with how residency data are reported by the state.
3.2. Characteristics of cases associated with large outbreaks
Cases in large outbreaks were more likely to occur among U.S.-born persons (85.1%) compared with all other TB cases counted nationally during 2010–2018 (33.8%) (Table 3). Large-outbreak–related cases were also more common among certain racial or ethnic minority persons, including non-Hispanic American Indian/Alaska Native (13.5%), non-Hispanic Black (40.9%), and non-Hispanic Native Hawaiian/Other Pacific Islander (6.4%) compared with all other cases (1.2%, 22.0%, and 0.9%, respectively).
Table 3.
Demographic, clinical, and social risk factor characteristics for tuberculosis (TB) cases detected in large outbreaks during 2014–2016 compared to all counted TB cases in the United States during 2010–2018a.
| TB cases in large outbreaks (N = 518) | All other TB cases (N = 85,841) | |
|---|---|---|
| Demographic | ||
| U.S.-born | 441 (85.1) | 29,009 (33.8) |
| Male | 347 (67.0) | 52,384 (61.0) |
| Age, years | ||
| <15 | 77 (14.9) | 4116 (4.8) |
| 15–24 | 92 (17.8) | 8548 (10.0) |
| 25–44 | 171 (33.0) | 26,589 (30.1) |
| 45–64 | 146 (28.2) | 26,613 (31.0) |
| ≥65 | 32 (6.2) | 19,962 (23.3) |
| Race/Ethnicityb | ||
| American Indian/Alaska Native | 70 (13.5) | 1044 (1.2) |
| Asian | 57 (11.0) | 28,386 (33.1) |
| Black | 212 (40.9) | 18,867 (22.0) |
| Hispanic | 62 (12.0) | 24,011 (28.0) |
| Multiple Races | 2 (0.4) | 507 (0.6) |
| Native Hawaiian/Other Pacific Islander | 33 (6.4) | 766 (0.9) |
| White | 60 (11.6) | 12,032 (14.0) |
| Unknown | 22 (4.3) | 228 (0.3) |
| Clinical | ||
| Pulmonary TB involvement | 469 (90.5) | 68,194 (79.4) |
| Clinical markers of infectiousness | ||
| Sputum smear-positive disease | 218 (42.1) | 31,811 (37.1) |
| Cavitary disease on chest radiograph | 127 (24.5) | 16,965 (19.8) |
| Sputum smear-positive and cavitary disease | 107 (20.7) | 12,580 (14.7) |
| History of previous TB diagnosis | 22 (4.3) | 4163 (4.9) |
| TB isolate resistant to isoniazid or rifampinc | 38 (9.1) | 6200 (9.6) |
| Diabetes mellitus | 36 (7.0) | 14,892 (17.4) |
| HIV co-infection | 24 (4.6) | 4667 (5.4) |
| Social risk factor | ||
| Substance use in past yeard | 151 (29.2) | 12,170 (14.2) |
| Homelessness in past year | 64 (12.4) | 4421 (5.2) |
| Incarcerated at diagnosis | 61 (11.8) | 3211 (3.8) |
| Federal Prisone | 1 (1.6) | 443 (14.0) |
| State Prisone | 47 (77.1) | 593 (18.8) |
| Local Jaile | 13 (21.3) | 1220 (38.6) |
| Othere | 0 (0.0) | 906 (28.7) |
Values are no. (%). Large outbreaks detected during 2014–2016 could include cases reported during 2010–2018 because the surveillance time periods extend before and after the date of first detection.
Persons of Hispanic ethnicity can be of any race; non-Hispanic persons were categorized as American Indian/Alaskan Native, Asian, Black, White, Native Hawaiian or other Pacific Islander, or of multiple races.
Resistance to at least isoniazid or rifampin on initial drug susceptibility testing. Percentage is calculated among cases for which drug susceptibility testing was performed.
Substance use is defined as any self-reported use of alcohol to excess or any use of illicit drugs within the year before diagnosis.
Percentages calculated among those incarcerated at time of TB diagnosis.
Social risk factors, including substance use within the year before diagnosis (29.2%), homelessness within the year before diagnosis (12.4%), and incarceration at diagnosis (11.8%), were more commonly reported among cases in large outbreaks than among all other non-–large-outbreak cases (14.2%, 5.2%, and 3.8%, respectively). Among patients incarcerated at diagnosis, cases in large outbreaks were more frequently diagnosed within state prisons compared with cases not in large outbreaks (77.1% vs. 18.8%).
3.3. Primary settings and contributors to transmission
We received sufficient information to classify primary settings and contributors to transmission for 23 of the 24 large outbreaks (Table 4). Seven (30.4%) outbreaks were reported to have occurred in residences with transmission primarily among families, and 8 (34.8%) were reported to have occurred in residences with transmission primarily among nonfamilial social contacts. Overnight congregate settings were considered the primary transmission setting for 5 (21.7%) outbreaks and included state prisons (n = 2), homeless facilities (n = 2), and an outbreak associated with a county jail, homeless facility, and a residential transitional center that provides re-entry services for ex-prisoners (n = 1). Other congregate settings were considered the primary transmission setting for 3 (13.0%) outbreaks and included a school (n = 1), a place of worship (n = 1), and Internet cafés (n = 1).
Table 4.
Social risk factors and primary transmission settings and contributing factors for large outbreaks of tuberculosis detected in the United States during 2014–2016a.
| Social risk factors | Primary setting of transmission | Contributors to transmission | ||||||||
|---|---|---|---|---|---|---|---|---|---|---|
| Outbreak ID | Percent reporting homelessness in past year | Percent incarcerated at diagnosis | Percent reporting substance use in past yearb | Residentialc | Congregated | Source case with prolonged infectious periode | Difficulty in eliciting contacts | Barriers to accessing healthcare | ||
| Family | Social | Overnight | Other | |||||||
| 1 | 0.0 | 0.0 | 5.9 | ✓ | ✓ | |||||
| 2 | 50.0 | 3.9 | 23.1 | ✓ | ✓ | ✓ | ||||
| 3 | 5.3 | 0.0 | 0.0 | ✓ | ✓ | ✓ | ✓ | |||
| 4 | 30.0 | 13.3 | 50.0 | ✓ | ✓ | |||||
| 5 | 10.5 | 15.8 | 26.3 | ✓ | ✓ | |||||
| 6 | 19.4 | 3.2 | 35.5 | ✓ | ✓ | ✓ | ||||
| 7 | 15.0 | 0.0 | 95.0 | ✓ | ✓ | ✓ | ||||
| 8 | 3.9 | 0.0 | 15.4 | ✓ | ✓ | |||||
| 9 | 6.7 | 73.3 | 35.6 | ✓ | ||||||
| 10 | 0.0 | 0.0 | 5.6 | ✓ | ✓ | ✓ | ||||
| 11 | 0.0 | 0.0 | 0.0 | ✓ | ✓ | |||||
| 12 | 4.0 | 0.0 | 4.0 | ✓ | ✓ | |||||
| 13 | 0.0 | 0.0 | 0.0 | ✓ | ✓ | |||||
| 14 | 13.2 | 5.3 | 29.0 | ✓ | ||||||
| 15 | 0.0 | 87.5 | 0.0 | ✓ | ✓ | |||||
| 16 | 0.0 | 0.0 | 19.1 | ✓ | ✓ | ✓ | ||||
| 17 | 50.0 | 6.3 | 75.0 | ✓ | ✓ | |||||
| 18 f | 9.1 | 0.0 | 36.4 | |||||||
| 19 | 0.0 | 0.0 | 27.3 | ✓ | ✓ | |||||
| 20 | 0.0 | 0.0 | 42.9 | ✓ | ✓ | ✓ | ||||
| 21 | 0.0 | 0.0 | 0.0 | ✓ | ✓ | |||||
| 22 | 13.3 | 0.0 | 60.0 | ✓ | ✓ | |||||
| 23 | 41.2 | 5.9 | 58.8 | ✓ | ✓ | |||||
| 24 | 10.0 | 5.0 | 45.0 | ✓ | ✓ | ✓ | ||||
| Total a | 6.0 (0–50) | 0.0 (0–87.5) | 26.8 (0–95) | 7 (30.4%) | 8 (34.8%) | 5 (21.7%) | 3 (13.0%) | 11 (47.8%) | 12 (52.2%) | 7 (30.4%) |
Large outbreaks detected during 2014–2016 might include cases reported during 2010–2018 because the surveillance time periods extend before and after the date of first detection. In collaboration with state health departments, we qualitatively summarized the primary transmission settings and contributing factors for each large outbreak. These data were based on local knowledge and investigations (sometimes with CDC onsite assistance) of the outbreaks. We categorized the outbreaks based on the primary transmission settings and contributing factors that health departments identified for the entire outbreak. A blank for any of these fields indicates that the information is either unknown or was not identified as a primary setting or contributor to transmission for the outbreak. Values shown represent the median (range) for social risk factors and no. (%) for primary settings and contributors to transmission. Outbreak investigations were conducted for 23 of the 24 large outbreaks; percentages are calculated using 23 as the denominator.
Substance use is defined as any self-reported use of alcohol to excess or any use of illicit drugs within the year before diagnosis.
Outbreaks in residential settings were classified as either transmission primarily within families or transmission primarily among nonfamilial social contacts. Some degree of transmission within families is expected for most residential outbreaks, so we only classified outbreaks as such if the health department reported that transmission primarily occurred within families.
Overnight congregate settings were defined as facilities where infection control measures for occupants staying overnight would be recommended by public health authorities, such as correctional facilities, overnight homeless shelters, hospitals, and long-term care facilities. Other congregate settings, which typically lack such measures, include schools, places of worship, workplaces, restaurants/cafés, bars, and casinos.
A source case with a long infectious period is defined as an individual who the health department reported was the apparent source leading to most or all of the secondary cases in the outbreak.
An investigation was not conducted for this outbreak, so the primary settings and drivers of transmission were not known.
In 11 (47.8%) outbreaks, health departments reported that a contributing factor was a source case with a prolonged infectious period that was the likely source of infection for the majority of secondary cases in the outbreak. Diagnostic delays leading to prolonged infectious periods occurred despite multiple healthcare encounters for source cases in at least 4 outbreaks. In 12 (52.2%) outbreaks, health departments reported difficulties in eliciting contacts of TB patients. Difficulties in eliciting names of contacts or locations where patients spent time were attributed to a mistrust of the government due to proximity to illicit activities (e.g., drug use or gang-related activity), a fear of stigmatization, and language/cultural barriers. In 7 (30.4%) outbreaks, health departments reported that patients experienced barriers to accessing healthcare. Geographic barriers to accessing healthcare were specifically reported for 5 outbreaks, which occurred in geographically remote or rural settings with limited access to health services.
Residential outbreaks with transmission primarily among families were often described by health departments as overcrowded settings with large numbers of children and centered on a patient with a prolonged infectious period (6 of 7 outbreaks; 85.7%). The median distance between case pairs among these outbreaks was 1.9 km (1.2 miles) and the median time from earliest reported case to subsequent cases was 0.6 years (Table 5). Residential outbreaks with transmission primarily among nonfamilial social contacts were often reported to be centered around shared substance use (median percentage of cases reporting substance use: 40.3%), and difficulties in eliciting contacts were reported as contributing to transmission for all 8 outbreaks. The median distance between case pairs among these outbreaks was 12.9 km (8.0 miles) and the median time from earliest reported case to subsequent cases was 2.3 years.
Table 5.
Comparison of outbreak characteristics by primary transmission setting for large outbreaks of tuberculosis detected in the United States during 2014–2016.
| Primary transmission settinga | No. large outbreaks | Median case count | Median distance between case pairs, km (miles)b | Median time from first to subsequent cases, yearsc | Median percent reporting homelessness in past year | Median percent incarcerated at diagnosis | Median percent reporting excess substance use in past yeard |
|---|---|---|---|---|---|---|---|
| Residential family | 7 | 18 | 1.9 (1.2) | 0.6 | 0.0 | 0.0 | 5.9 |
| Residential social | 8 | 20 | 12.9 (8.0) | 2.3 | 11.9 | 1.6 | 40.3 |
| Overnight congregate setting | 5 | 26 | 11.1 (6.9) | 1.6 | 13.2 | 6.3 | 29.0 |
| Other congregate setting | 3 | 14 | 14.2 (8.8) | 1.6 | 0.0 | 0.0 | 0.0 |
In collaboration with state health departments, we qualitatively summarized the primary transmission settings and contributing factors for each large outbreak. These data were based on local knowledge and investigations (sometimes with CDC onsite assistance) of the outbreaks. We categorized the outbreaks based on the primary transmission settings that health departments identified for the entire outbreak. Outbreaks in residential settings were classified as either transmission primarily within families or transmission primarily among nonfamilial social contacts. Some degree of transmission within families is expected for most residential outbreaks, so we only classified outbreaks as such if the health department reported that transmission primarily occurred within families. Overnight congregate settings were defined as facilities where infection control measures for occupants staying overnight would be recommended by public health authorities, such as correctional facilities, overnight homeless shelters, hospitals, and long-term care facilities. Other congregate settings, which typically lack such measures, include schools, places of worship, workplaces, and restaurants/cafés/bars.
Median distance between all case pairs based on the ZIP code centroid of reported residency at diagnosis; city of residence was used if ZIP code was missing.
Median time between the earliest reported case and each subsequent outbreak-related case during the 5-year outbreak surveillance period.
Substance use is defined as any self-reported use of alcohol to excess or any use of illicit drugs within the year before diagnosis.
4. Discussion
We detected 24 incident large TB outbreaks with a median size of 18.5 cases. These large outbreaks occurred in 15 U. S. states or reporting jurisdictions, including many where TB incidence rates were below the national average. While multistate outbreaks were uncommon and usually involved just a single case in another state, all except 3 outbreaks spanned multiple counties. This dispersion can create programmatic challenges with interjurisdictional coordination and delays managing the outbreak for states in which TB control is decentralized. Often, however, these outbreaks were localized with most cases occurring in a single county or with relative geographic proximity among TB patients. In many outbreaks, there was a rapid accumulation of additional cases within 1 year after the earliest reported case. As a result of these outbreaks, the TB incidence rates increased by a median of 50% in the primarily affected counties. Local resources available to manage a case increase of such magnitude can be quickly overwhelmed, particularly in low-incidence settings with fewer TB control resources [14].
Similar to previous studies characterizing TB outbreaks, we found that large outbreaks predominantly affected U.S.-born persons in racial and ethnic minority groups; persons who were experiencing homelessness or incarcerated, particularly in state prisons, were also disproportionately affected [1,3,15]. TB has a longstanding history of reflecting inequities in social determinants of health, such as income, housing, and healthcare access disparities, which can increase the likelihood of exposure to TB [16,17]. The interactions of exposure to TB and other factors can increase vulnerability to TB outbreaks. Consistent with this history, most (60.9%) of these large outbreaks occurred primarily in counties that are considered to have moderate-to-high or high social vulnerability.
We identified 5 outbreaks in overnight congregate settings. Infection control should be a public health priority in these settings, which are often overcrowded and collectively represent a population disproportionately affected by underlying comorbidities, social risk factors, and advanced TB disease due to a lack of healthcare access or health-seeking behavior [2,14,18–21]. Administrative infection control measures, such as systematic efforts to identify and isolate patients with TB symptoms, have been proven to help reduce transmission in congregate settings [22–25].
Despite an established association between TB outbreaks and congregate settings, we found that nearly two thirds (65.2%) of large outbreaks occurred primarily in residential settings. Residential outbreaks among families were typically centered on a patient with a prolonged infectious period who was the source case of infection for the majority of secondary cases in the outbreak. Rapid case accumulation in these outbreaks (median time from earliest reported case to subsequent cases: 0.6 years) suggests that most transmission occurred before the need for public health intervention was recognized [26].
Nearly half (47.8%) of all large outbreaks involved a source case with a prolonged infectious period. Similar to conclusions from previous reports, earlier diagnosis and treatment of TB in these persons might have prevented or mitigated transmission [1,27,28]. Diagnostic delays might reflect systemic social and economic barriers to healthcare access, such as healthcare affordability, limited geographic or physical access to health services, mistrust of medical professionals, and an inability to prioritize healthcare needs above others [29–32]. In some outbreaks, diagnostic delays still occurred despite multiple healthcare encounters, which could in part reflect a lack of familiarity with TB clinical presentations or diagnostic evaluation, perhaps because TB awareness decreases with incidence [33,34].
Residential outbreaks among nonfamilial social contacts were often reported to be centered around shared substance use and were characterized by difficulties in eliciting contacts. Reluctance or inability by patients to disclose contacts makes it difficult for public health officials to penetrate social networks and evaluate potentially exposed persons who might benefit from treatment, resulting in continued morbidity and transmission among contacts with untreated LTBI that progresses to TB disease over time. An extended period of case accumulation (median time from earliest reported case to subsequent cases: 2.3 years) in these outbreaks might reflect the difficulties that health departments described in identifying cases and their contacts.
Investment in strong community engagement and outreach workers who can build trust within these communities has proven effective [35]. In response to one large outbreak in this report among non-U.S.–born patients in a social network, a health department partnered with healthcare providers, community organizations, elected officials, business owners, and community leaders to increase awareness of TB and build trust within this community [36]. The health department conducted health fairs, mobile testing events and other community events in collaboration with community representatives and disseminated non-English language materials through local businesses, local media outlets and social media platforms to increase awareness and access to care among the affected population. Use of social media to identify potential links between patients has also benefitted some outbreak investigations [4].
Despite our systematic ascertainment efforts, molecular surveillance methods might not capture all large TB outbreaks and outbreak-associated cases. We might have missed outbreaks associated with longstanding or common genotypes, those consisting of cases with nominally different genotypes, or those with high proportions of clinically diagnosed cases. In 2018, CDC began universal WGS of all isolates from culture-confirmed cases, so we have since updated the detection algorithms to include more discriminatory genotyping methods that utilize WGS data. Furthermore, we are evaluating implementation of new statistical methods for detecting outbreaks with genotypes that are prevalent within a specific area [37]. We also might have missed some transmission settings and underestimated certain contributors to transmission, because not all outbreaks were investigated to the same degree. Finally, while smaller outbreaks with <10 cases contribute to transmission in communities, CDC large outbreak surveillance collects epidemiologic and molecular data only for outbreaks with ≥10 cases. Since large outbreak surveillance, which provided the epidemiologic and molecular data described in this report, does not systematically collect the same data for smaller outbreaks, we were unable to include information about smaller outbreaks in this analysis.
5. Conclusion
Our molecular surveillance methods facilitated the first national, systematic characterization of large TB outbreaks. The genotype-based detection algorithms we developed, which identify outbreaks across a variety of geographic areas independent of local epidemiologic data, augment manual methods to identity outbreaks through routine cluster reviews and program reporting. Additionally, the combined application of WGS and local epidemiologic data allows for more precision in identification of outbreak-associated cases, including cases not captured through the detection algorithms. Because TB outbreak control and prevention rely on supporting diagnosis, treatment, and prevention in socially disadvantaged populations, interventions to decrease outbreak-associated morbidity must address the medical, social, cultural, and overall public health needs of disproportionately affected groups. Thus, ongoing national surveillance for large TB outbreaks should continue to inform outreach to affected populations and areas, advocacy for outbreak response, and assessments of progress towards reducing associated morbidity and mortality.
Supplementary Material
Acknowledgments
We thank Tom Navin for being the driving force behind the initiation and implementation of large outbreak surveillance. We would also like to express our sincerest gratitude to our local and state TB program partners for their commitment to TB outbreak prevention and control, and we specifically thank those health department staff who helped us compile data for this report.
Funding
This research did not receive any specific grant from funding agencies in the public, commercial, or not-for-profit sectors. The authors were federal employees of the Centers for Disease Control and Prevention.
Footnotes
See e.g., 45 C.F R. part 46, 21 C.F R. part 56; 42 U. S. C. §241(d); 5 U. S. C. §552a; 44 U. S. C. §3501 et seq.
Disclaimer
The findings and conclusions in this report are those of the authors and do not necessarily represent the official position of the Centers for Disease Control and Prevention.
Appendix A. Supplementary data
Supplementary data to this article can be found online at https://doi.org/10.1016/j.tube.2022.102232.
CRediT authorship contribution statement
Kala M. Raz: Methodology, Formal analysis, Investigation, Data curation, Writing – original draft, Visualization. Sarah Talarico: Formal analysis, Writing – original draft, Writing – review & editing. Sandy P. Althomsons: Conceptualization, Methodology, Writing – review & editing. J. Steve Kammerer: Conceptualization, Methodology, Formal analysis, Writing – review & editing. Lauren S. Cowan: Methodology, Formal analysis, Writing – review & editing. Maryam B. Haddad: Investigation, Writing – review & editing. Clinton J. McDaniel: Methodology, Investigation, Writing – review & editing. Jonathan M. Wortham: Investigation, Supervision, Writing – original draft, Writing – review & editing. Anne Marie France: Conceptualization, Methodology, Writing – review & editing. Krista M. Powell: Conceptualization, Methodology, Writing – review & editing. James E. Posey: Methodology, Formal analysis, Writing – review & editing. Benjamin J. Silk: Conceptualization, Methodology, Investigation, Writing – original draft, Writing – review & editing, Supervision.
Declaration of competing interest
None.
References
- [1].Mindra G, Wortham JM, Haddad MB, Powell KM. Tuberculosis outbreaks in the United States, 2009–2015. Publ Health Rep 2017;132:157–63. 10.1177/0033354916688270. [DOI] [PMC free article] [PubMed] [Google Scholar]
- [2].Powell KM, Vanderende DS, Holland DP, Haddad MB, Yarn B, Yamin AS, et al. Outbreak of Drug-Resistant Mycobacterium tuberculosis Among Homeless People 2017;132:231–40. 10.1177/0033354917694008. [DOI] [PMC free article] [PubMed] [Google Scholar]
- [3].Mitruka K, Oeltmann JE, Ijaz K, Haddad MB. Tuberculosis outbreak investigations in the United States, 2002–2008. Emerg Infect Dis 2011;17:425–31. 10.3201/eid1703.101550. [DOI] [PMC free article] [PubMed] [Google Scholar]
- [4].Labuda SM, Mcdaniel C, Talwar A, Braumuller A, Parker S, Mcgaha S, et al. Tuberculosis outbreak associated with delayed diagnosis and long infectious periods in rural Arkansas , 2010–2018. 2021. 10.1177/0033354921999167. [DOI] [PMC free article] [PubMed] [Google Scholar]
- [5].Centers for Disease Control and Prevention. Controlling tuberculosis in the United States: recommendations from the American thoracic society, CDC and the infectious diseases society of America. MMWR Morb Mortal Wkly Rep 2005;54: 1–3. [PubMed] [Google Scholar]
- [6].Ghosh S, Moonan PK, Cowan L, Grant J, Kammerer S, Navin TR. Tuberculosis genotyping information management System: enhancing tuberculosis surveillance in the United States. Infect Genet Evol 2012;12:782–8. 10.1016/j.meegid.2011.10.013. [DOI] [PubMed] [Google Scholar]
- [7].Kammerer JS, Shang N, Althomsons SP, Haddad MB, Grant J, Navin TR. Using statistical methods and genotyping to detect tuberculosis outbreaks. Int J Health Geogr 2013;12:15. 10.1186/1476-072X-12-15. [DOI] [PMC free article] [PubMed] [Google Scholar]
- [8].Centers for Disease Control and Prevention. Tuberculosis genotyping in the United States. 2012. 10.1017/CBO9781107415324.004. Atlanta, GA. [DOI] [Google Scholar]
- [9].Roetzer A, Diel R, Kohl TA, Ruckert C, Nubel U, Blom J, et al. Whole genome sequencing versus traditional genotyping for investigation of a Mycobacterium tuberculosis outbreak: a longitudinal molecular epidemiological study. PLoS Med 2013;10. 10.1371/journal.pmed.1001387. [DOI] [PMC free article] [PubMed] [Google Scholar]
- [10].Nikolayevskyy V, Kranzer K, Niemann S, Drobniewski F. Whole genome sequencing of Mycobacterium tuberculosis for detection of recent transmission and tracing outbreaks : a systematic review. Tuberculosis 2016;98:77–85. 10.1016/j.tube.2016.02.009. [DOI] [PubMed] [Google Scholar]
- [11].Kulldorff M A spatial scan statistic. Commun Stat Theor Methods 1997;26: 1481–96. 10.1080/03610929708831995. [DOI] [Google Scholar]
- [12].Flanagan BE, Gregory EW, Hallisey EJ, Heitgerd JL, Lewis B. A social vulnerability Index for disaster management. J Homel Secur Emerg Manag 2011;8. 10.2202/1547-7355.1792. [DOI] [Google Scholar]
- [13].Flanagan BE, Hallisey EJ, Adams E, Lavery A. Measuring community vulnerability to natural anthropogenic hazards: the centers for disease control and prevention’s social vulnerability Index. J Environ Health 2018;80:34–6. [PMC free article] [PubMed] [Google Scholar]
- [14].Centers for Disease Control and Prevention. Tuberculosis outbreak associated with a homeless shelter — Kane County, Illinois, 2007–2011. MMWR Morb Mortal Wkly Rep 2012;61:186–9. [PubMed] [Google Scholar]
- [15].Althomsons SP, Kammerer JS, Shang N, Navin TR. Using routinely reported tuberculosis genotyping and surveillance data to predict tuberculosis outbreaks. PLoS One 2012;7:1–8. 10.1371/journal.pone.0048754. [DOI] [PMC free article] [PubMed] [Google Scholar]
- [16].Hargreaves JR, Boccia D, Evans CA, Adato M, Petticrew M. The social determinants of tuberculosis: from evidence to. Action 2011;101:654–62. 10.2105/AJPH.2010.199505. [DOI] [PMC free article] [PubMed] [Google Scholar]
- [17].Lonnroth K, Jaramillo E, Williams BG, Dye C, Raviglione M. Drivers of tuberculosis epidemics: the role of risk factors and social determinants. Soc Sci Med 2009;68: 2240–6. 10.1016/j.socscimed.2009.03.041. [DOI] [PubMed] [Google Scholar]
- [18].Bamrah S, Yelk Woodruff RS, Powell K, Ghosh S, Kammerer JS, Haddad MB. Tuberculosis among the homeless, United States, 1994–2010. Int J Tubercul Lung Dis 2013;17:1414–9. 10.5588/ijtld.13.0270. [DOI] [PMC free article] [PubMed] [Google Scholar]
- [19].Lambert LA, Armstrong LR, Lobato MN, Ho C, France AM, Haddad MB. Tuberculosis in jails and prisons: United States, 2002–2013. Am J Publ Health 2016;106:2231–7. 10.2105/AJPH.2016.303423. [DOI] [PMC free article] [PubMed] [Google Scholar]
- [20].Tibbetts KK, Ottoson RA, Tsukayama DT. Public health response to tuberculosis outbreak among persons experiencing homelessness, Minneapolis, Minnesota, USA, 2017–2018. Emerg Infect Dis 2020;26(3):420–6. 10.3201/eid2603.190643. [DOI] [PMC free article] [PubMed] [Google Scholar]
- [21].Centers for Disease Control and Prevention. Notes from the field: outbreak of tuberculosis associated with a newly identified Mycobacterium tuberculosis genotype — New York City, 2010–2013. MMWR Morb Mortal Wkly Rep 2013;62: 904. [PMC free article] [PubMed] [Google Scholar]
- [22].Centers for Disease Control and Prevention. Prevention and control of tuberculosis in correctional and detention facilities: recommendations from CDC. MMWR Recomm Reports 2006;55:1–44. [PubMed] [Google Scholar]
- [23].National Center for HIV/AIDS. In: Viral Hepatitis, STD, and TB Prevention (NCHHSTP). Workshop on tuberculosis and homelessness: infection control measures in homeless shelters and other overnight facilities that provide shelter: summary of the workshop held September 28–29, 2015. Atlanta, GA: US Department of Health and Human Services, Centers for Disease Control and Prevention, Office of Infectious Diseases, NCHHSTP; 2018. [Google Scholar]
- [24].Holland DP, Alexander S, Onwubiko U, Goswami ND, Yamin A, Mohamed O, et al. Response to isoniazid-resistant tuberculosis in homeless shelters, Georgia, USA, 2015–2017. Emerg Infect Dis 2019;25:593–5. [DOI] [PMC free article] [PubMed] [Google Scholar]
- [25].Muloma E, Stewart R, Townsend H, Koch S, Burkholder S, Railey S, et al. Multipronged approach to controlling a tuberculosis outbreak among persons experiencing homelessness. J Public Health Manag Pract. 2020;28(2):199–202. 10.1097/PHH.0000000000001211.0. 2022 Mar-Apr, p. 5–7. [DOI] [PMC free article] [PubMed] [Google Scholar]
- [26].Reichler MR, Khan A, Sterling TR, Zhao H, Moran J, McAuley J, et al. Risk and timing of tuberculosis among close contacts of persons with infectious tuberculosis. J Infect Dis 2018;218:1000–8. 10.1093/infdis/jiy265.Risk. [DOI] [PMC free article] [PubMed] [Google Scholar]
- [27].Haddad MB, Mitruka K, Oeltmann JE, Johns EB, Navin TR. Characteristics of tuberculosis cases that started outbreaks in the United States. Emerg Infect Dis 2015;21(3):508–10. 10.3201/eid2103.141475. Mar, 2002–2011. [DOI] [PMC free article] [PubMed] [Google Scholar]
- [28].Golub JE, Bur S, Cronin WA, Gange S, Baruch N, Comstock GW, et al. Delayed tuberculosis diagnosis and tuberculosis transmission. Int J Tubercul Lung Dis 2006; 10:24–30. [PubMed] [Google Scholar]
- [29].Syed ST, Gerber BS, Sharp LK. Traveling towards disease: transportation barriers to health care access. J Community Health 2013;38:976–93. 10.1007/s10900-013-9681-1. [DOI] [PMC free article] [PubMed] [Google Scholar]
- [30].Blinder A In rural Alabama, a longtime mistrust of medicine fuels a tuberculosis outbreak. 2016. New York Times. [Google Scholar]
- [31].Gelberg L, Gallagher TC, Andersen RM, Koegel P. Competing priorities as a barrier to medical care among homeless adults in Los Angeles. Am J Publ Health 1997;87: 217–20. 10.2105/AJPH.87.2.217. [DOI] [PMC free article] [PubMed] [Google Scholar]
- [32].Hauff AJ, Secor-Turner M. Homeless health needs: shelter and health service provider perspective. J Community Health Nurs 2014;31:103–17. 10.1080/07370016.2014.901072. [DOI] [PubMed] [Google Scholar]
- [33].Wallace RM, Kammerer JS, Iademarco MF, Althomsons SP, Winston CA, Navin TR. Increasing proportions of advanced pulmonary tuberculosis reported in the United States: are delays in diagnosis on the rise? Am J Respir Crit Care Med 2009;180: 1016–22. 10.1164/rccm.200901-0059OC. [DOI] [PubMed] [Google Scholar]
- [34].Miller AC, Polgreen LA, Cavanaugh JE, Hornick DB, Polgreen PM. Missed opportunities to diagnose tuberculosis are common among hospitalized patients and patients seen in emergency departments. Open Forum Infect Dis 2015;2:1–7. 10.1093/o. [DOI] [PMC free article] [PubMed] [Google Scholar]
- [35].Fitzpatrick LK, Hardacker JA, Heirendt W, Agerton T, Streicher A, Melnyk H, et al. A preventable outbreak of tuberculosis investigated through an intricate social network. Clin Infect Dis 2001;33:1801–6. [DOI] [PubMed] [Google Scholar]
- [36].Sullivan Meissner J, Knorr J, Ahuja S, Rao S. Engaging community stakeholders to inform and enhance tuberculosis outbreak investigation and response in New York City. Jt. 20th Conf. Union North Am. Reg. Natl. TB control. Assoc., Denver, Colorado (USA): n.d. [Google Scholar]
- [37].Althomsons SP, Hill AN, Harrist AV, France AM, Powell KM, Posey JE, et al. Statistical method to detect tuberculosis outbreaks among endemic clusters in a low-incidence setting. Emerg Infect Dis 2018;24:573–5. [DOI] [PMC free article] [PubMed] [Google Scholar]
Associated Data
This section collects any data citations, data availability statements, or supplementary materials included in this article.