Abstract
Purpose
This technical report aims to describe and detail the use of micro-computed tomography for a reliable evaluation of the bulk-fill composite/tooth interface.
Materials and Methods
Bulk-fill composite restorations in tooth cavities were scanned using micro-computed tomography to obtain qualitatively and quantitatively valuable information. Two-dimensional information was processed using specific algorithms, and ultimately a 3-dimensional (3D) specimen reconstruction was generated. The 3D rendering allowed the visualization of voids inside bulk-fill composite materials and provided quantitative measurements. The 3D analysis software VG Studio MAX was used to perform image analysis and assess gap formation within the tooth-restoration interface. In particular, to evaluate internal adaptation, the Defect Analysis add-on module of VG Studio Max was used.
Results
The data, obtained with the processing software, highlighted the presence and the shape of gaps in different colours, representing the volume of porosity within a chromatic scale in which each colour quantitatively represents a well-defined volume.
Conclusion
Micro-computed tomography makes it possible to obtain several quantitative parameters, providing fundamental information on defect shape and complexity. However, this technique has the limit of not discriminating materials without radiopacity and with low or no filler content, such as dental adhesives, and hence, they are difficult to visualise through software reconstruction.
Keywords: X-Ray Microtomography; Composite Resins; Imaging, Three-Dimensional; Dental Marginal Adaptation
Introduction
Dental caries is one of the most prevalent chronic diseases in children and adults worldwide,1 and its treatment focuses on the use of dental materials to replace the infected tooth structure in order to restore its physical and aesthetic functions. Today, resin-based composite materials represent the gold standard for restorative dentistry, providing optimal aesthetics and mechanical properties for the restoration.2
Despite their excellent characteristics, polymerisation shrinkage stress (PSS) often occurs with negative clinical implications compromising the strength of the adhesive bond, which leads to post-operative sensitivity, enamel cracks, and marginal gap formation, and hence, secondary caries formation.3 In this light, the incremental filling technique, which consists of the application of several increments of resin composite layers, which are then cured separately, was exploited to reduce PSS.4 Although this procedure has long been approved as a standard technique to ensure a proper depth of cure and decreased PSS, it may induce detrimental outcomes such as the formation of voids among layers and it is time-consuming.5
To overcome the limitations related to the incremental technique, next-generation resin composites with a novel monomer content and improved curing properties, known as bulk-fill composites (BFCs), have been introduced. BFCs can be cured at a maximal increment thickness of 4 mm with limited shrinkage, thereby allowing clinicians to fill the cavity in a single step with a satisfactory cavity adaptation and with the consequence of simplifying the procedure and decreasing the chair-time needed to complete the restoration.6,7 BFCs have gained popularity for their user-friendly application, especially for posterior restorations,8 and their mechanical and clinical properties are widely investigated in the scientific literature.4,9 In particular, due to concerns regarding PSS, further investigations of the internal and external adaptation of BFC are needed. The measurement of the shrinkage in a cavity is technically challenging; indeed, several in vitro methods have been used to analyse the PSS effect.10,11
Micro-computed tomography (micro-CT) has recently been introduced to evaluate both PSS and the internal adaptation of resin composite.12 Micro-CT data can be reconstructed 3-dimensionally (3D) to obtain, in a non-invasive and non-destructive way, qualitatively and quantitatively valuable information on factors such as gap formation caused by air bubbles, regardless of the object shape or its position.13 Micro-CT has also been shown to be a reliable and effective investigative tool for determining the precise volume and position of resin composites in cavities used as models.14 Because of its 3D imaging capabilities, micro-CT represents the preferred non-destructive method to quantify microleakage, obtaining accurate results on PSS.15
This technical report aimed to describe and detail the use of micro-CT to obtain new parameters useful for reliable evaluations of internal and external voids in BFCs.
Materials and Methods
Two separated standardized class II slot cavities, mesio-occlusal (MO) and disto-occlusal (DO) were prepared in eight extracted human third molars (for a total of 16 cavities) that were divided, according to the filling technique used, in the following two groups (n=4): group A (one BFC single increment to the occlusal surface) and group B (the proximal wall was restored in order to transform class II into class I, then the residual cavity was filled using one single increment of BFC). BFC restorations in tooth cavities were analysed individually using a micro-CT instrument (Bruker SkyScan 1174; SkyScan-Bruker, Antwerp, Belgium) with the following operating conditions: voltage, 50 kV; current, 800 µA; aluminium filter, 1 mm; pixel size, 9.5 µm; sample rotation, 180° with 0.2° steps; exposure time per projection, 10 s. The tooth projections were converted to cross-sectional slices by NRecon software (ver. 1.6.10.2, Bruker, Billerica, MA, USA) with the following correction settings: ring artefacts, 8.0; smoothing, 6.0; beam hardening, 70%; and proper misalignment compensation. The total number of slices was approximately 950 for all samples, obtaining axial information on approximately 9 mm of tooth thickness with an average scan time of 5 hours per sample. Two-dimensional information was processed using specific algorithms, and ultimately a 3D specimen reconstruction was generated. The 3D rendering allowed void visualisation inside the BFC materials and provided quantitative measurements.16
The 3D analysis software VG Studio MAX (Volume Graphics, ver. 1.2.1, Heidelberg, Germany) was used to perform image analysis and assess gap formation of the external and internal marginal adaptation. In particular, the Defect Analysis add-on module of VG Studio Max was used to evaluate internal adaptation. The operation tool was designed to process voxel datasets to obtain several parameters for a quantitative investigation of internal defects. The quantified parameters consisted of the number of defects detected at the interface and within the restoration (no. of defects); the total surface of defects (DS, expressed in µm2); the total volume of defects (DV, expressed in µm3), the specific surface, defined as the ratio between the surface and the volume of the defects (DS/DV, expressed in µm-1); the mean thickness of void formation (mean thickness, expressed in µm); the volume of mineralised materials (enamel and dentin) and composite (MV, expressed in µm3); and the ratio of the latter value to the total volume of the defect (DV/MV, expressed as a percentage).16,17 The CT-Analyser software (ver. 1.17.7.2, Bruker, Billerica, MA, USA) was employed to create a 3D model of the defects of interest, coloured and superimposed onto 3D reconstructions of enamel, dentin, and restorations, by CTVOL software (ver. 2.0, Bruker, Billerica, MA, USA).
Results
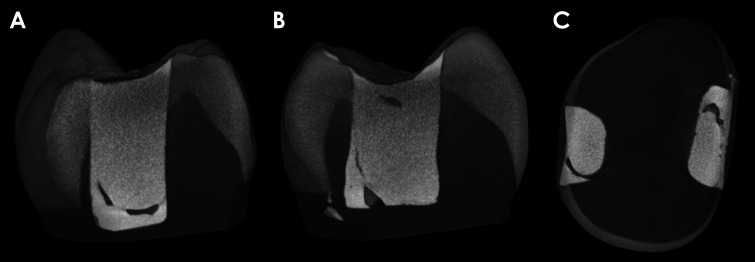
The obtained results represented 3D raw images that displayed voids inside the 2 BFC restorations (Fig. 1).
Fig. 1. Three-dimensional raw images of the same sample. Three different virtual cuts: on the sagittal plane, the mesial restoration (A) and the distal restoration (B); on the transverse plane, the 2 restorations (C).
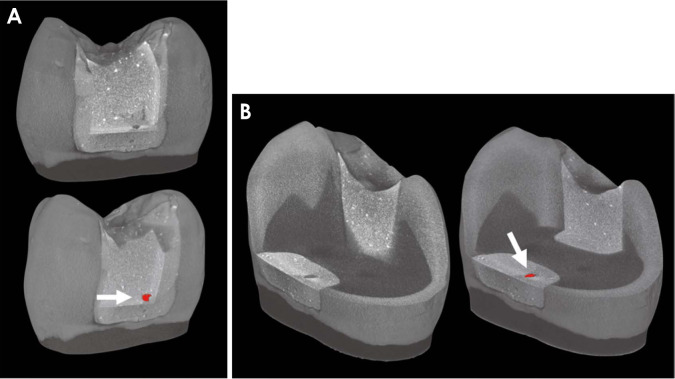
In addition, Figure 2 presents the results of the analysis of the VG Studio MAX software, showing the analysis and evaluation of gap formation within the tooth restoration.
Fig. 2. Three-dimensional microtomography models of the external (A) and internal (B) marginal adaptation of BFC class II restorations. For both 3D models, the raw images were analyzed by VG Studio MAX software (Volume Graphics, ver. 1.2.1, Heidelberg, Germany) to perform image analysis and assessment of gap formation within the tooth-restoration interface. Therefore, the processing software makes it possible to quantify the volume of the porosity, highlighting it in red (white arrow). The colour was used to highlight the presence of a gap and to define the volume of porosity on a colour scale in which each colour quantitatively corresponds to a very specific volume.
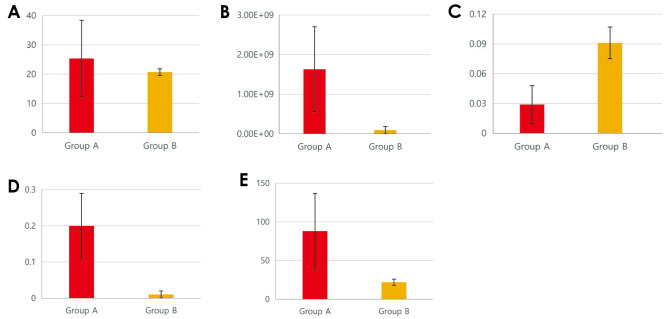
Figure 3 shows the quantification of morphometric parameters related to internal microleakage, including the number of defects, DV, DS/DV, DV/MV, and mean thickness, obtained by micro-CT analysis of the preliminary results of group A and group B.
Fig. 3. Comparative histograms of morphometric data from groups A and B. A. Number of defects. B. DV. C. DS/DV. D. DV/MV. E. Mean thickness.
The processing software displayed the volume of the porosity, highlighting it with a colour. The porosity volume was represented using a colour scale, in which each colour quantitatively corresponded to a very specific volume. Furthermore, Figure 4 shows a visual representation of the preliminary results of the study on 2 different BFC filling techniques, highlighting the 2 different shapes of defects based on the DS/DV values in the 3D reconstruction models.
Fig. 4. Preliminary results of the study on 2 different bulk-fill composite filling techniques. A. The micro-computed tomography (micro-CT) 3-dimensional (3D) reconstruction of group A highlights in red the irregular geometrical shape of the defect, which represents gap formation inside the restoration (black arrow). B. The micro-CT 3D model reconstruction of group B displays in yellow a laminar shape of the defect on tooth-restoration interfaces, extending to the cavity wall (white arrow). C. The graph shows that group A have lower DS/DV values than group B. This result was confirmed by the 3-dimensional models of the samples. DS/DV: the ratio between the surface and the volume of the defects.
Discussion
The recently introduced BFCs are promising, although the current scientific research on their mechanical and clinical potential remains limited; therefore, further research is needed, especially related to internal structures and PSS investigation. Micro-CT, which is widely considered a powerful 3D imaging technique for these investigations, obtains images based on the principle of either absorption or the phase-contrast effect. Conventional X-ray imaging relies on image formation from differences in X-ray absorption in the sample.18 The settings proposed in this technical report are usually used for investigating dense structures, such as teeth: in this case, micro-CT is based on the mapping of the linear attenuation coefficient of the X-ray crossing the analysed sample, and the attenuation depends upon the density of the dental tissue. Among the parameters investigated in this study, DS/DV provides fundamental information on the defect shape, since it represents a morphometric parameter that remarkably contributes to the analysis of microleakage and bubble formation during BFC restorations. Indeed, higher DS/DV values imply a more oriented laminar defect shape, which usually occurs at tooth-restoration interface. In contrast, lower DS/DV values indicate the presence of defects with a bulky shape, possibly internal voids (e.g., air bubbles) and gaps that are usually found within the restoration. Therefore, it is noteworthy that the colour produced by the processing software not only serves to highlight the presence of a gap, but represents the volume of porosity on a chromatic scale in which each colour quantitatively represents a well-defined volume. This information is fundamental for better understanding the real entity of the defect, if it consists of a void, or if it represents the adhesive layer between the BFC and the tooth. One of the limitations of micro-CT relates to the discrimination between adhesive material and void, since materials lacking radiopacity and with low or no filler content, as is the case for dental adhesives, are difficult to visualise through the software reconstruction. Therefore, studies based solely on micro-CT data are not sufficient to definitely state whether defects founded on the internal margin are really constituted by void formations or are areas filled with the adhesive material. For this reason, the use of complementary techniques is fundamental to complete the investigation,19 and evaluate those areas where micro-CT had indicated a hypothetical gap formation. In previous studies, the combination of different methods of analysis, such as micro-CT, scanning electron microscopy, and energy-dispersive X-ray spectroscopy was already validated.16 This combined analysis makes it possible to obtain a proper visualisation of void formation on the tooth-restoration interface, providing reliable and objective information both on the morphology and chemical composition of the analysed samples.17 Regarding the tooth-restoration interface, this method can be considered particularly helpful for researchers and clinicians, providing the opportunity to assess the effect of restorative procedures from different points of view, although further studies are needed to confirm the results obtained.
In conclusion, the micro-CT technique is an accurate and reliable tool to evaluate the BFC/tooth interface in a non-destructive way, thus providing a new, safe, feasible, and reliable methodology for analysing restorative materials. Furthermore, the various parameters proposed are very useful for a better overview of the real extent of gaps. Therefore, the combination of complementary laboratory techniques with micro-CT makes it possible to achieve a robust overview and better understanding of 3D reconstruction data.
Footnotes
SISOPD (Società Italiana Stomatologia, Odontoiatria e Protesi Dentaria-Italian Society of Dentistry, Stomatology and Prosthodontics) Foundation partially supported this study.
Conflicts of Interest: None
References
- 1.Frencken JE, Sharma P, Stenhouse L, Green D, Laverty D, Dietrich T. Global epidemiology of dental caries and severe periodontitis-a comprehensive review. J Clin Periodontol. 2017;44 Suppl 18:S94–S105. doi: 10.1111/jcpe.12677. [DOI] [PubMed] [Google Scholar]
- 2.Orsini G, Tosco V, Monterubbianesi R, Orilisi G, Putignano A. In: The first outstanding 50 years of “Università Politecnica Delle Marche”: research achievements in life sciences. Longhi S, Monteriù A, Freddi A, Aquilanti L, Ceravolo MG, Carnevali O, et al., editors. Cham, Switzerland: Springer; 2020. A new era in restorative dentistry; pp. 319–334. [Google Scholar]
- 3.Kaisarly D, Langenegger R, Litzenburger F, Heck K, El Gezawi M, Rösch P, et al. Effects of application method on shrinkage vectors and volumetric shrinkage of bulk-fill composites in class-II restorations. Dent Mater. 2022;38:79–93. doi: 10.1016/j.dental.2021.10.013. [DOI] [PubMed] [Google Scholar]
- 4.El-Safty S, Silikas N, Watts DC. Creep deformation of restorative resin-composites intended for bulk-fill placement. Dent Mater. 2012;28:928–935. doi: 10.1016/j.dental.2012.04.038. [DOI] [PubMed] [Google Scholar]
- 5.Hayashi J, Shimada Y, Tagami J, Sumi Y, Sadr A. Real-time imaging of gap progress during and after composite polymerization. J Dent Res. 2017;96:992–998. doi: 10.1177/0022034517709005. [DOI] [PubMed] [Google Scholar]
- 6.Hayashi J, Espigares J, Takagaki T, Shimada Y, Tagami J, Numata T, et al. Real-time in-depth imaging of gap formation in bulk-fill resin composites. Dent Mater. 2019;35:585–596. doi: 10.1016/j.dental.2019.01.020. [DOI] [PubMed] [Google Scholar]
- 7.Tosco V, Monterubbianesi R, Orilisi G, Procaccini M, Grandini S, Putignano A, et al. Effect of four different finishing and polishing systems on resin composites: roughness surface and gloss retention evaluations. Minerva Stomatol. 2020;69:207–214. doi: 10.23736/S0026-4970.19.04310-3. [DOI] [PubMed] [Google Scholar]
- 8.Leprince JG, Palin WM, Vanacker J, Sabbagh J, Devaux J, Leloup G. Physico-mechanical characteristics of commercially available bulk-fill composites. J Dent. 2014;42:993–1000. doi: 10.1016/j.jdent.2014.05.009. [DOI] [PubMed] [Google Scholar]
- 9.García Marí L, Climent Gil A, Llena Puy C. In vitro evaluation of microleakage in Class II composite restorations: high-viscosity bulk-fill vs conventional composites. Dent Mater J. 2019;38:721–727. doi: 10.4012/dmj.2018-160. [DOI] [PubMed] [Google Scholar]
- 10.Cerda-Rizo ER, de Paula Rodrigues M, Vilela A, Braga S, Oliveira L, Garcia-Silva TC, et al. Bonding interaction and shrinkage stress of low-viscosity bulk fill resin composites with high-viscosity bulk fill or conventional resin composites. Oper Dent. 2019;44:625–636. doi: 10.2341/18-163-L. [DOI] [PubMed] [Google Scholar]
- 11.Garcia D, Yaman P, Dennison J, Neiva G. Polymerization shrinkage and depth of cure of bulk fill flowable composite resins. Oper Dent. 2014;39:441–448. doi: 10.2341/12-484-L. [DOI] [PubMed] [Google Scholar]
- 12.Sun J, Eidelman N, Lin-Gibson S. 3D mapping of polymerization shrinkage using X-ray micro-computed tomography to predict microleakage. Dent Mater. 2009;25:314–320. doi: 10.1016/j.dental.2008.07.010. [DOI] [PMC free article] [PubMed] [Google Scholar]
- 13.Ersen KA, Gürbüz Ö, Özcan M. Evaluation of polymerization shrinkage of bulk-fill resin composites using microcomputed tomography. Clin Oral Investig. 2020;24:1687–1693. doi: 10.1007/s00784-019-03025-5. [DOI] [PubMed] [Google Scholar]
- 14.Sampaio CS, Chiu KJ, Farrokhmanesh E, Janal M, Puppin-Rontani RM, Giannini M, et al. Microcomputed tomography evaluation of polymerization shrinkage of class I flowable resin composite restorations. Oper Dent. 2017;42:E16–E23. doi: 10.2341/15-296-L. [DOI] [PubMed] [Google Scholar]
- 15.Kim HJ, Park SH. Measurement of the internal adaptation of resin composites using micro-CT and its correlation with polymerization shrinkage. Oper Dent. 2014;39:E57–E70. doi: 10.2341/12-378-L. [DOI] [PubMed] [Google Scholar]
- 16.Tosco V, Vitiello F, Furlani M, Gatto ML, Monterubbianesi R, Giuliani A, et al. Microleakage analysis of different bulk-filling techniques for class II restorations: µ-CT, SEM and EDS evaluations. Materials (Basel) 2020;14:31. doi: 10.3390/ma14010031. [DOI] [PMC free article] [PubMed] [Google Scholar]
- 17.Putignano A, Tosco V, Monterubbianesi R, Vitiello F, Gatto ML, Furlani M, et al. Comparison of three different bulk-filling techniques for restoring class II cavities: µCT, SEM-EDS combined analyses for margins and internal fit assessments. J Mech Behav Biomed Mater. 2021;124:104812. doi: 10.1016/j.jmbbm.2021.104812. [DOI] [PubMed] [Google Scholar]
- 18.Momose A. Recent advances in X-ray phase imaging. Jpn J Appl Phys. 2005;44:6355–6367. [Google Scholar]
- 19.Sinibaldi R, Conti A, Sinjari B, Spadone S, Pecci R, Palombo M, et al. Multimodal-3D imaging based on µMRI and µCT techniques bridges the gap with histology in visualization of the bone regeneration process. J Tissue Eng Regen Med. 2018;12:750–761. doi: 10.1002/term.2494. [DOI] [PubMed] [Google Scholar]


