Abstract
Radiomics is a rapidly growing field that quantitatively extracts image features in a high-throughput manner from medical imaging. In this study, we analyzed the radiomics features of the whole pancreas between healthy individuals and pancreatic cancer patients, and we established a predictive model that can distinguish cancer patients from healthy individuals based on these radiomics features. Methods: We retrospectively collected venous-phase scans of contrast-enhanced computed tomography (CT) images from 181 control subjects and 85 cancer case subjects for radiomics analysis and predictive modeling. An attending radiation oncologist delineated the pancreas for all the subjects in the Varian Eclipse system, and we extracted 924 radiomics features using PyRadiomics. We established a feature selection pipeline to exclude redundant or unstable features. We randomly selected 189 cases (60 cancer and 129 control) as the training set. The remaining 77 subjects (25 cancer and 52 control) as a test set. We trained a Random Forest model utilizing the stable features to distinguish the cancer patients from the healthy individuals on the training dataset. We analyzed the performance of our best model by running 5-fold cross-validations on the training dataset and applied our best model to the test set. Results: We identified that 91 radiomics features are stable against various uncertainty sources, including bin width, resampling, image transformation, image noise, and segmentation uncertainty. Eight of the 91 features are nonredundant. Our final predictive model, using these 8 features, has achieved a mean area under the receiver operating characteristic curve (AUC) of 0.99 ± 0.01 on the training dataset (189 subjects) by cross-validation. The model achieved an AUC of 0.910 on the independent test set (77 subjects) and an accuracy of 0.935. Conclusion: CT-based radiomics analysis based on the whole pancreas can distinguish cancer patients from healthy individuals, and it could potentially become an early detection tool for pancreatic cancer.
Keywords: radiomics, pancreatic cancer, uncertainty analysis, random forest, computed tomography
Introduction
Pancreatic cancer is the 4th leading cause of all cancer-related deaths in the US, with an estimated 5-year overall survival of about 9%. 1 Furthermore, more than 50% of cases were diagnosed at an advanced stage with metastatic disease and 5-year survival of <3%. 2 This disheartening fact has stressed the importance of innovative and robust diagnostic tools for the early detection of pancreatic cancer, which may lead to a more favorable prognosis.
Medical imaging has been an essential component in clinical cancer care. Among different imaging modalities, computed tomography (CT) is the most used medical imaging modality for diagnosis and treatment response monitoring of a variety of cancer types including pancreatic cancer.3–5 However, the current practice of medical imaging analysis is still mainly intended for visual interpretation and lesion size determination.6,7 Recent success in quantitative imaging analysis is redefining the role of medical imaging as a new data source of novel biomarkers, 6 in the form of imaging-based phenotyping. Radiomics is a method of high-throughput extraction of hundreds of features encrypted in medical images based on segmentation (delineation of a boundary around a region of interest). These radiomics features typically include the shape, first-, second- (or textual), and higher-order statistics of a volume of interest, and can provide a far more comprehensive, quantitative, and nuanced representation of the radiographic phenotype of a tumor or an organ than semantic or qualitative descriptors from human experts.7–13 Due to its distinct advantages for biomarker development, radiomics has become an active area of research focusing on risk assessment and treatment response prediction of cancer8,14–17 as well as the relationship between image features and genomics.18–23
Currently, the majority of radiomics studies analyze the radiomics features of an existing lesion. The purpose of our present study, on the other hand, aimed at analyzing the radiomics features of the entire pancreas to differentiate normal individuals from patients with pancreatic ductal adenocarcinoma (PDAC).
Materials and Methods
Ethics Statement
The study was approved by the Institutional Review Board at the University of Nebraska Medical Center (IRB#: 789-18-EP). This study does not involve any animal subjects. Informed consent of the subjects was waived for this retrospective study by IRB at UNMC, and the waiver would not affect the rights and welfare of the study subjects.
Patients
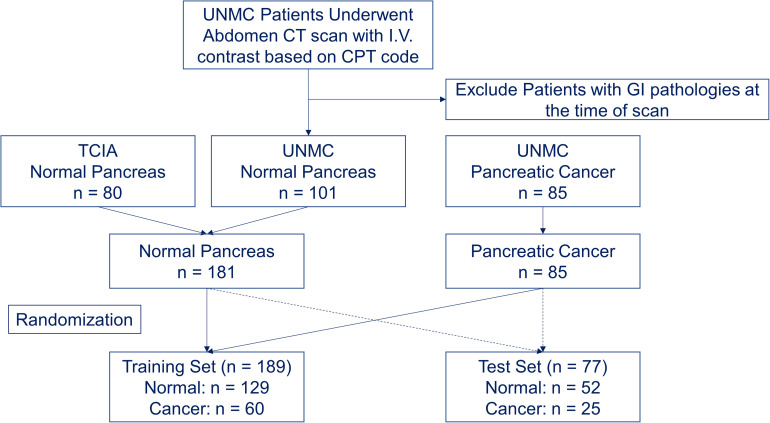
The Institutional Review Board at our institution approved this retrospective study (IRB 789-18-EP) and waived the informed consent of the subjects. The waiver would not affect the rights and welfare of the study subjects. A total of 80 healthy individuals who do not have major gastrointestinal pathologies from The Cancer Imaging Archive (TCIA) were identified as the control subjects.24–26 We combined these 80 subjects from TCIA with 101 healthy individuals without gastrointestinal pathologies at our institution from 2008 to 2018 to form the control group. We also identified 85 patients with non-metastatic, borderline resectable PDAC at our institution from 2008 to 2018 as cancer case subjects (Figure 1). The control group included 99 female subjects and 82 male subjects, with an average age of 46.7 ± 16.2. The cancer group included 35 female subjects and 50 male subjects, with an average age of 62.5 ± 10.4.
Figure 1.
Patient selection and randomization flowchart.
CT Acquisition
The 80 control subjects from the TCIA database underwent abdominal contrast-enhanced CT scans with intravenous contrast. The CT images were acquired on Philips and Siemens MDCT scanners (120 kVp tube voltage). The slice thickness was between 1.5 and 2.5 mm.24–26 The 101 control subjects from our institution also underwent abdominal CT scans with intravenous contrast on GE, Philips, and Siemens MD CT scanners. The preoperative contrast-enhanced abdominal CT scans of 85 cancer cases from our institution acquired on GE, Philips, and Siemens MDCT scanners were also collected. The CT scanners at our institution included the following models: GE-LightSpeed, GE-Revolution, Siemens-Sensation, Siemens-Definition, Philips-Ingenuity, and Philips-Brilliance. All the scans were acquired based on our standardized abdomen scanning protocol, with 120 kV, 350 mAs (effective), and 0.6 to 1.4 pitch. Each individual scan was optimized to minimize the dose to the patient. The field of view of each image was in the range of 360-450 mm. We collected the venous-phase images, which were acquired 60-90 s following the intravenous injection of the contrast material (100 mL of ISOVUE®) based on our standard protocol. The slice thickness was in the range of 1.25-3 mm. All the CT images of the cancer group were acquired at the time of diagnosis without any treatment, ruling out any treatment effect on image features.
Volume-of-Interest Segmentation
The whole pancreas of all subjects was manually contoured by two trained researchers (MD students) using the Varian Eclipse treatment planning system (Varian Medical Systems, Palo Alto, CA) under the supervision of an attending radiation oncologist. The tumor was included as part of the whole pancreas for all the cancer subjects. The attending radiation oncologist, who has more than 18 years of experience specializing in Gastro-Intestinal Cancer, finalized all segmentations. All pancreas segmentations were delineated on the CT with the original in-plane resolution and slice thickness. CT images with associated segmentations were saved and exported via DICOM format for processing and analysis.
Feature Extraction
PyRadiomics, 12 an open-source package, was used to extract radiomics features. Briefly, we converted the DICOM images and target delineation to NRRD format using a batch process in 3D slicer software 27 (https://www.slicer.org/). A total of 924 radiomics features were extracted to represent the whole pancreas from both healthy individuals and cancer patients. The radiomics features included first-order statistics, 3D shape-based features, gray level co-occurrence matrix, gray level run length matrix, gray level size zone matrix, neighboring gray-tone difference matrix, and gray level dependence matrix from the original images, images derived from Laplacian of Gaussian (LoG) filters, and 8 derived images from wavelet decompositions. 28 Extraction parameters such as bin width and resampling were studied in the following uncertainty analysis.
Feature Stability Evaluation
We used the intraclass correlation coefficient (ICC) to quantitatively assess the stability of radiomics features against various uncertainty sources. We selected to use ICC (2,1) to assess the absolute agreement with the 2-way random-effects model since this 2-way random-effects model is the appropriate model to generalize our reliability results.29,30 The ICC was calculated as follows 29 :
Uncertainty Analysis of Radiomics Feature
Feature selection is an indispensable component of the radiomics workflow as the number of available radiomics features usually is more numerous than the number of cases in the study cohort. A model without feature selection leads to over-fitting and thereby impairs the model's ability to adapt properly to independent datasets with previously unseen data. 9 To evaluate the stability and reproducibility of the extracted radiomics features, we investigated the effect of image preprocessing (bin width and resampling) and several image perturbations, including image rotation and translation, image noise, and contour dilation/erosion, on the stability of the extracted features. Briefly, the DICOM CT images were converted into a 3D volume image, and the DICOM RTSTRUCT (Radiotherapy Structure Set) polygons were converted into a binary segmentation mask. Both volume image and the segmentation mask are in the NRRD format for image perturbation studies. All the imaging processing and transformations were performed using the SimpleITK toolkit (https://simpleitk.org/) with Python 3.6 (Python Software Foundation, https://www.python.org/).
Bin Width and Resampling
As previously reported, the slice thickness and bin width are 2 important extraction parameters that affect radiomics features. 31 We investigated the effect of various bin widths and resampling (ie, with or without resampling) on the stability of the extracted features. Briefly, we chose the gray-level discretization in 5 different bin widths (5, 10, 25, 50, and 75 HU), and applied it to the volume images and masks with the original resolution and resampled resolution (1 × 1 × 1 mm3). In other words, we repeated the feature extraction process with 10 different parameter sets. We then assessed the stability of the features by using the Intraclass Correlation Coefficient14,29,30,32 (ICC>0.75), and the unstable features were excluded from predictive modeling. 29
Image Transformation
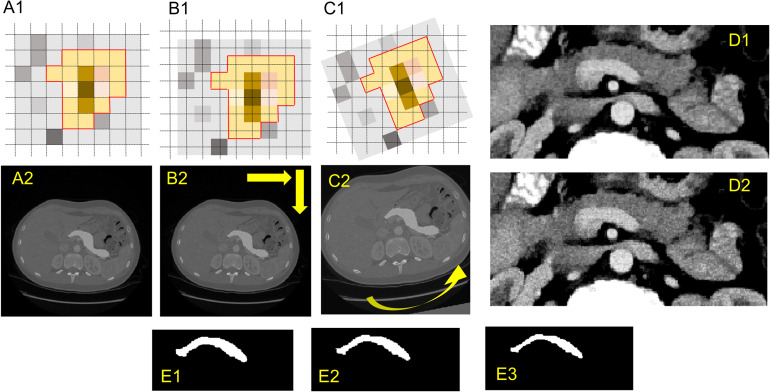
We also performed an affine transformation that shifts both volume images and masks for a total of 10 combinations of specified fractions of the isotropic voxel spacing (0.25, 0.5, 0.75) in the in-plane directions as shown in Figure 2B. The feature extraction process was repeated for all the transformed images (10 combinations) with resampling (1 × 1 × 1 mm3) and without resampling, that is, we extracted the 924 features on each of the transformed images. The radiomics features with an ICC14,29,30,32 >0.75 are considered stable features.
Figure 2.
Image perturbations (translation, rotation, noise addition, and expansion/shrinkage).
Image Rotation
Similarly, we performed an affine transformation that rotates both the volume image and mask over a set of angles in the axial plane (−9°, −6°, −3°, 3°, 6°, and 9°) as shown in Figure 2C. The feature extraction process was repeated for all rotated images (6 sets) with resampling (1 × 1 × 1 mm3) and without resampling, that is, we extracted the 924 features on each of the rotated images. The radiomics features with an ICC14,29,30,32 >0.75 are considered stable features.
Noise Addition
Furthermore, we applied the additive Gaussian image filter and the shot noise (Poisson noise) image filter to the volume image, and we repeated the feature extractions on both the original image and the images with noise additions. Examples are shown in Figure 2D. The radiomics features with an ICC14,29,30,32 >0.75 are considered stable features.
Segmentation Growth/Shrinkage
We also investigated the impact of volume adaptation on the stability of extracted features by applying dilation and erosion to the segmentation mask. The dilation/erosion mimics the variations in the manual delineation by human experts. Briefly, we used the 2D binary dilation and erosion functions in the SciPy library to create dilated or shrunk masks (Figure 2E), and we repeated feature extraction on the original images with the original or dilated/eroded segmentation masks. The radiomics features with an ICC14,29,30,32 >0.75 are considered stable features.
Exploratory Analysis of Radiomics Features
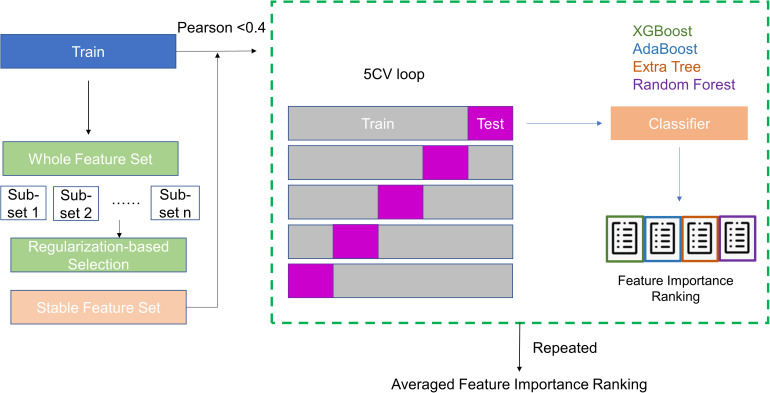
Besides the stability/reproducibility of the radiomics features against various image perturbations, exclusion of highly correlated, or redundant, radiomics features is also critical in building robust and generalizable predictive models. In our study, we utilized a combination of statistical techniques to evaluate the correlation among features and their relative importance. First, the whole data set was randomly divided into a training set and a test. The training set includes 189 subjects (∼70%) including 129 normal patients and 60 cancer patients. The test set includes the rest 77 subjects (52 normal and 25 cancer). Then, we developed a radiomics feature importance ranking workflow based on a stacked ensemble model inspired by the work by Zhai et al, 33 as shown in Figure 3. Briefly, we first used the Stability Feature Selection 34 to exclude irrelevant features. Stability Feature Selection runs a selected algorithm (e.g., logistic regression) on a subset of samples repeatedly. By analyzing how many times a feature gets selected from the aggregated results of repeated runs, the model can determine the importance of each feature. The features are ranked by a score based on how many times they get selected. Irrelevant features would result in a score close to 0, whereas important features are expected to have a score close to 100%. We carried out the Stability Feature Selection using the randomized logistic regression (scikit learn toolkit) to rank the extracted radiomics features using the training dataset. The features with zero scorings are excluded from the following analysis. Pearson coefficient analysis is then applied to the nonzero features to evaluate correlations among these features, and we used Pearson coefficient <0.4 as a threshold to exclude features that are correlated to each other. Then, we ranked the importance of each feature by utilizing repeated 5-fold cross-validation on the training data with 4 classifiers that are widely applied to data mining: XGBoost, 35 Random Forest (RF), 36 Adaboost, 37 and Extra Tree. 38 The feature importance ranking from each classifier is averaged equally and the average importance ranking is plotted.
Figure 3.
Feature selection and ranking workflow.
Predictive Analytics
We built an RF classifier by using the scikit-learn library in Python on the training set. Briefly, the same training data was used to build an RF classifier (ie, 189 randomly selected cases including 60 cancer subjects and 129 control subjects). The most important and nonredundant features selected from the exploratory analysis were used as the input for the predictive model. We further divided the training set into a training set with 173 subjects and 16 subjects as validation. We trained the model on 173 subjects in the training set and search the hyperparameter of n_estimator and max_depth by minimizing the difference in the area under the receiver operating characteristic curve (AUC) between the training set (173 subjects) and the validation set (16 subjects). We evaluated the performance of the predictive model by running 5-fold cross-validations on the training dataset (189 subjects) and by analyzing the sensitivity, specificity, and AUC. In the end, we applied the selected model, with a minimum difference of the AUC between the training set (173 subjects) and the validation set (16 subjects), to the test set (77 subjects) to evaluate its performance (accuracy and AUC). The 95% confidence interval was estimated based on the method proposed by Hanley et al. 39 We implemented the training, validation, and analysis of the predictive model by using Python 3.6 (Python Software Foundation, https://www.python.org/).
Results
Stable Features Against Extraction Parameters
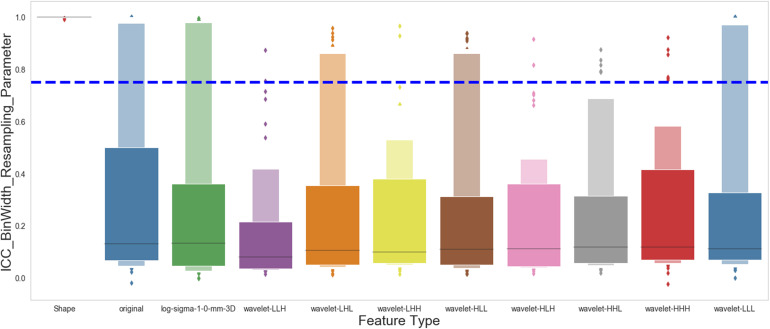
With 5 different bin widths on images with or without resampling, we had 10 different sets of extraction parameters. Figure 4 shows the ICC of all the features, categorized by feature groups, against extraction parameters. Our analysis revealed that a substantial portion of the extracted features was not stable against various extraction parameters. Only 119 out of 924 (12.9%) extracted features are stable when bin width or image resolution changes.
Figure 4.
Effect of bin width and resampling on the stability of the radiomics features. The figure shows the intraclass correlation coefficient (ICC) distribution for each group of the 924 extracted radiomics features.
Stable Features Against Image Transformations
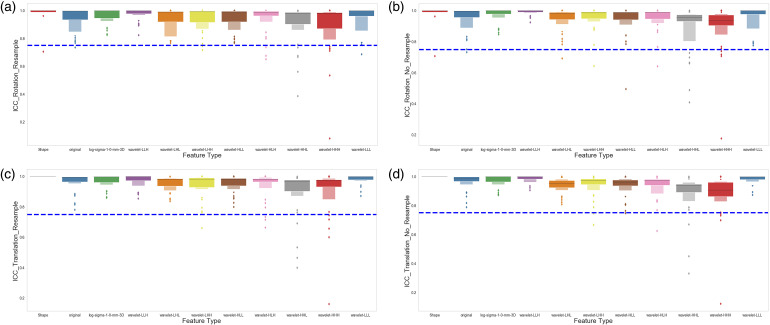
We evaluated the feature robustness against image rotation by comparing the extracted features from the original images to those extracted from the rotated images, with various degrees of rotation, by the Intraclass Correlation Coefficient (ICC). Figure 4A and B shows the ICC of all the features, categorized by feature type groups, against rotational image perturbations on the images. Figure 5A shows the results with the image resampled to 1 × 1 × 1 mm3, and Figure 5B shows the results without image resampling. Similarly, we also evaluated the robustness of the features by comparing the original images to the shifted images, with and without resampling to 1 × 1 × 1 mm3 resolution. Figure 5C and D shows the ICC of all the features, categorized by feature type groups, against translational image perturbations on the images, with or without image resampling. Our results on the robustness of features against image perturbation have shown that most of the extracted features (895 out of 924) remain stable and robust against these image transformations.
Figure 5.
Effect of image transformation (rotation and translation) on the stability of the radiomics features. (A) Shows the intraclass correlation coefficient (ICC) distribution for each group of the radiomics features after the images were rotated (−9°, −6°, −3°, 3°, 6°, 9°) and resampled to 1×1×1 mm3. (B) Shows the ICC distribution for each group of the radiomics features after the images were rotated (−9°, −6°, −3°, 3°, 6°, 9°) with the original image resolution. (C) Shows the ICC distribution for each group of the radiomics features after the images were translated, as described in the Materials and Methods section, and resampled to 1×1×1 mm3. (D) Shows the ICC distribution for each group of the radiomics features after the images were translated, as described in the Materials and Methods section, with the original image resolution.
Stable Features Against Noise Addition
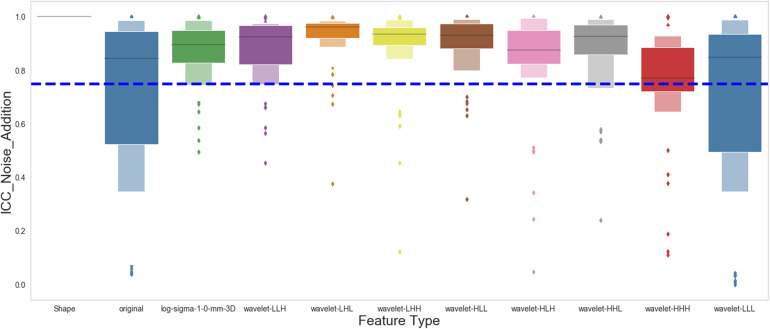
We evaluated the feature robustness against image noise by comparing the extracted features from the original images to those extracted from images with Gaussian or Poisson noise added by the ICC. Figure 6 shows the stability of each feature type against the noise addition. Our results showed that the original and wavelet-LLL features were the least stable against image noise addition. On the contrary, most of the other types of features were stable. In total 756 out of 924 extracted features (81.8%) are robust against noise addition based on the analysis.
Figure 6.
Effect of image noise on the stability of the radiomics features. The figure shows the intraclass correlation coefficient (ICC) distribution for each group of the radiomics features after the Gaussian and Poisson noises were applied to the original images.
Stable Features Against Segmentation Growth/Shrinkage
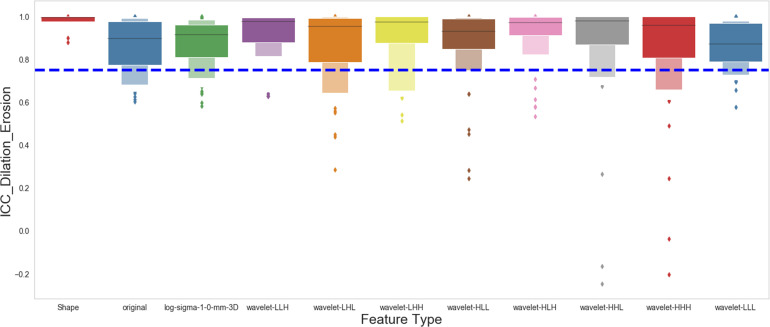
Similarly, we assessed the feature stability against segmentation variation by comparing the extracted features from the original segmentation to those with segmentation dilated or eroded. Figure 7 shows the stability of each feature type against segmentation variation. Most of the extracted features (776 out of 924) are stable if segmentation dilation or erosion occurs.
Figure 7.
Effect of segmentation growth or shrinkage on the stability of the radiomics features. The figure shows the intraclass correlation coefficient (ICC) distribution for each group of the radiomics features after the original segmentation was dilated or eroded as described in the Materials and Methods section.
Exploratory Analysis of Radiomics Features
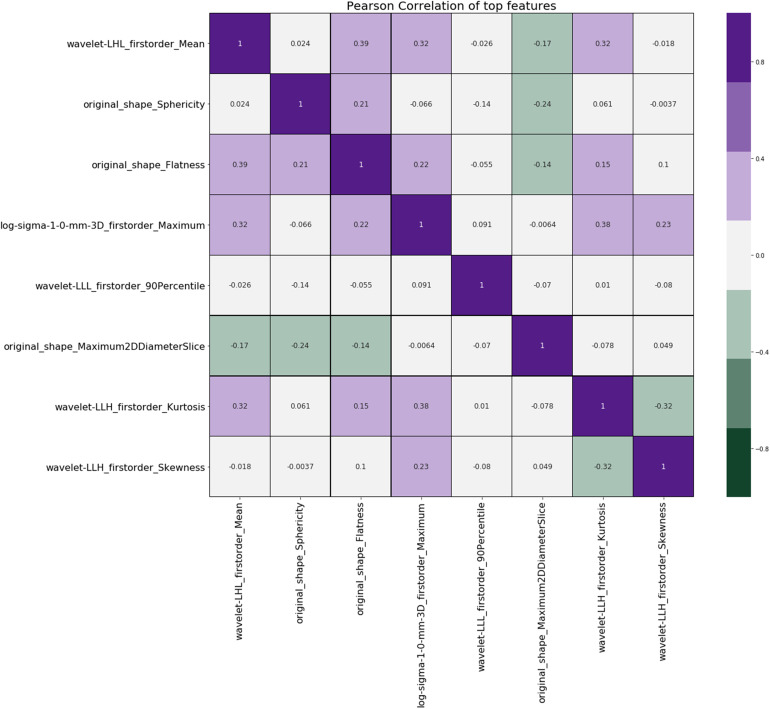
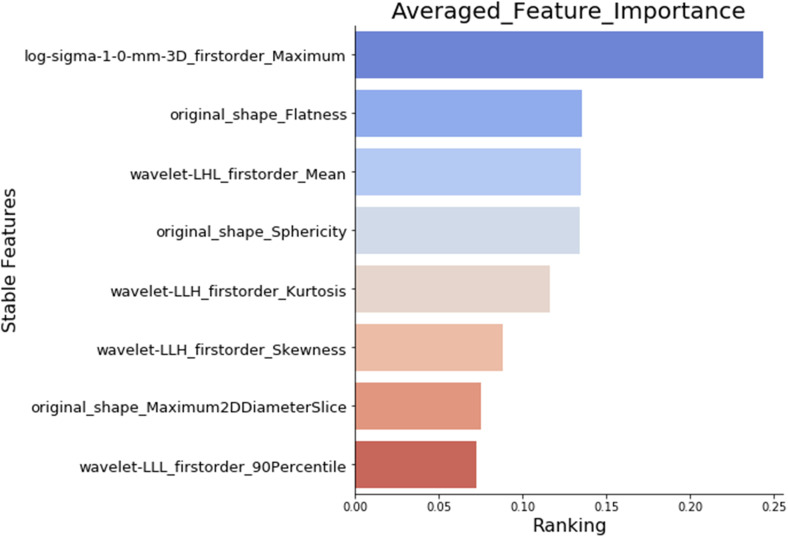
After all the uncertainty analyses, we have identified 91 shared features that are stable against extraction parameters (bin width and resampling), image transformations, image noise addition, and segmentation growth/shrinkage, as shown in Table 1. Among the remaining 91 stable features against image perturbations, our exploratory analysis showed that 84 features have a nonzero ranking by the randomized logistic regression analysis (data not shown), also known as stability feature selection. 33 Furthermore, our Pearson coefficient analysis showed that only 8 out of the 84 features, selected by randomized logistic regression, or stability feature selection, had a Pearson coefficient <0.4 (Figure 8), indicating that most of the extracted features are highly correlated. We ranked the importance of the eight nonredundant features by using a combination of four widely used classifiers: XGBoost, RF, AdaBoost, and Extra Tree, and Figure 9 shows the final ranking.
Table 1.
Stable Features Against all Uncertainties.
| Feature type | Features |
|---|---|
| Shape | Elongation |
| Flatness | |
| LeastAxisLength | |
| MajorAxisLength | |
| Maximum2DDiameterRow | |
| Maximum2DDiameterSlice | |
| Maximum3DDiameter | |
| MeshVolume | |
| MinorAxisLength | |
| Sphericity | |
| SurfaceArea | |
| SurfaceVolumeRatio | |
| VoxelVolume | |
| Original | firstorder_10Percentile |
| firstorder_90Percentile | |
| firstorder_Energy | |
| firstorder_InterquartileRange | |
| firstorder_Kurtosis | |
| firstorder_Mean | |
| firstorder_MeanAbsoluteDeviation | |
| firstorder_Median | |
| firstorder_RobustMeanAbsoluteDeviation | |
| firstorder_RootMeanSquared | |
| firstorder_Skewness | |
| firstorder_TotalEnergy | |
| firstorder_Variance | |
| log-sigma-1-0-mm-3D | firstorder_10Percentile |
| firstorder_90Percentile | |
| firstorder_Energy | |
| firstorder_InterquartileRange | |
| firstorder_Maximum | |
| firstorder_MeanAbsoluteDeviation | |
| firstorder_Range | |
| firstorder_RobustMeanAbsoluteDeviation | |
| firstorder_RootMeanSquared | |
| firstorder_TotalEnergy | |
| firstorder_Variance | |
| Wavelet-HHH | firstorder_Maximum |
| firstorder_Minimum | |
| firstorder_Range | |
| Wavelet-HHL | firstorder_Kurtosis |
| firstorder_Maximum | |
| firstorder_Minimum | |
| firstorder_Range | |
| firstorder_TotalEnergy | |
| Wavelet-HLH | |
| Wavelet-HLL | firstorder_10Percentile |
| firstorder_90Percentile | |
| firstorder_Energy | |
| firstorder_InterquartileRange | |
| firstorder_Kurtosis | |
| firstorder_Maximum | |
| firstorder_MeanAbsoluteDeviation | |
| firstorder_Range | |
| firstorder_RobustMeanAbsoluteDeviation | |
| firstorder_RootMeanSquared | |
| firstorder_TotalEnergy | |
| firstorder_Variance | |
| glcm_Correlation | |
| glcm_Idn | |
| Wavelet-LHH | firstorder_Kurtosis |
| Wavelet-LHL | firstorder_10Percentile |
| firstorder_90Percentile | |
| firstorder_Energy | |
| firstorder_InterquartileRange | |
| firstorder_Kurtosis | |
| firstorder_Maximum | |
| firstorder_Mean | |
| firstorder_MeanAbsoluteDeviation | |
| firstorder_Range | |
| firstorder_RobustMeanAbsoluteDeviation | |
| firstorder_RootMeanSquared | |
| firstorder_TotalEnergy | |
| firstorder_Variance | |
| glcm_Correlation | |
| glcm_Idn | |
| Wavelet-LLH | firstorder_Kurtosis |
| firstorder_Skewness | |
| Wavelet-LLL | firstorder_10Percentile |
| firstorder_90Percentile | |
| firstorder_Energy | |
| firstorder_InterquartileRange | |
| firstorder_Kurtosis | |
| firstorder_Mean | |
| firstorder_MeanAbsoluteDeviation | |
| firstorder_Median | |
| firstorder_RobustMeanAbsoluteDeviation | |
| firstorder_RootMeanSquared | |
| firstorder_Skewness | |
| firstorder_TotalEnergy | |
| firstorder_Variance | |
| ngtdm_Coarseness |
Figure 8.
Pearson coefficient of the stable features selected by stability feature selection. The figure shows the Pearson coefficient matrix for all the stable features that have the Pearson coefficient <0.4.
Figure 9.
Importance ranking of the selected features. The figure shows the importance ranking of the final selected features, which are important and nonredundant, calculated by our feature selection and ranking workflow.
Model Performance
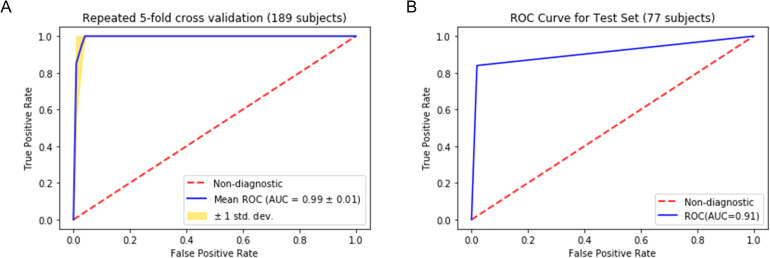
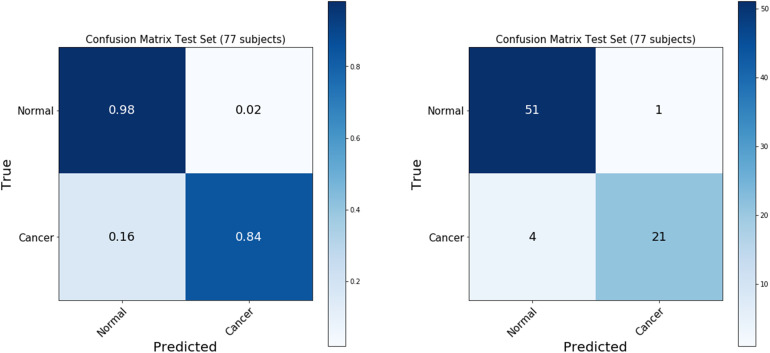
The final model was selected with a minimum difference in the AUC between the training (173 subjects) and the validation set (16 subjects). As shown in Figure 10, the repeated cross-validation showed that the RF model achieved a mean AUC of 0.99 ± 0.01 on the training set (189 subjects) and an AUC of 0.910, with a 95% confidence interval in the range between 0.85 and 0.97, on the independent test set (77 subjects). The accuracy of predicting normal versus cancer subjects on the test set (77 subjects) is 93.5%, with a 95% confidence interval between 88% and 99%. The sensitivity and specificity of the predictive model on the test set were 84% and 98%, respectively, as summarized in the confusion matrix (Figure 11).
Figure 10.
Receiver operating characteristic (ROC) analysis for the predictive model. The figure shows the ROC analysis for the Random Forest model we built to distinguish a healthy pancreas from a cancerous pancreas. (A) Shows the ROC curve of repeated 5-fold cross-validation results for the training dataset, including 189 randomly selected subjects. (B) Shows the ROC curve when the model is applied to the test dataset, including the remaining 77 subjects that the model has not been seen during the training.
Figure 11.
Confusion matrix of the predictive model on the test dataset. The figure shows the confusion matrix summarizing the performance of the predictive model on the test dataset (77 subjects).
Discussion
With the rapid developments and advancements in medical imaging, clinicians are producing and analyzing an ever-expanding amount of imaging data in their daily practice. Quantitative imaging analysis, with its ability to decipher ample amounts of information digitally encrypted in the medical images, has turned medical imaging into a new data source to discover diagnosis- or prognosis-related phenotypic signatures or biomarkers. 6 Radiomics is a high throughput method of image feature extractions, which is compelling for novel biomarker development because it phenotypically characterizes the whole volume of interest (i.e., lesion or tissue) at a macroscopic level. This unique feature allows radiomics to reveal the spatial heterogeneity within that volume of interest (e.g., intratumoral heterogeneity) more than the standard biopsy procedure, the analysis of which is based on a small portion of the tissue. 13 Furthermore, medical imaging is already immensely integrated into standard care, radiomics analysis can potentially reveal additional diagnostic/prognostic signatures repeatedly in a less burdensome and less invasive manner to patients. Previous studies have demonstrated the prognostic values of radiomics feature-based biomarkers in cancer8,14–17 and their prominent role in bridging medical imaging and genomics.18–23
Notwithstanding these achievements, the vast majority of radiomics studies analyzed radiomics features of the existing tumor and utilized the features for risk assessment of a tumor or treatment response prediction. The radiomics analysis, focusing on the existing tumor, provides limited contribution with respect to how radiomics can contribute to the early diagnosis of cancer. Our study, on the other hand, aimed at evaluating the utilization of radiomics analysis in the tumor-harboring organ (i.e., pancreas), with the long-term goal of detecting radiomics features reflecting cancerous changes of the hosting organ at an early stage of the disease. This would be especially important for battling pancreatic cancer since over 80% of pancreatic cancer cases are diagnosed when regional spread or distal metastasis has occurred. 2 Our study is a proof-of-concept study that demonstrates radiomics analysis can potentially identify these cancerous changes in the pancreas between normal individuals from cancer patients solely using robust features. Our next step is to include patients at precursor stages of pancreatic cancer, such as patients with chronic pancreatitis or pancreatic cystic lesion to explore imaging features that identify the “cancerized” pancreas at an early stage. Our study aligns with current efforts investigating the application of quantitative imaging analysis (radiomics or deep learning) in detecting various chronic pancreatic conditions including pancreatitis, cystic lesion, and cancer.40–43 It is foreseeable that radiomics or deep learning would be the ideal candidate to detect “cancerized” changes in the pancreas due to its prowess in identifying hidden patterns in the images, which may lead to the development of new early detection tools for pancreatic cancer.
Although radiomics holds great promise in the personalized era, before its clinical implementation, a hurdle the scientific community must overcome is the consistency and reproducibility of feature extraction and subsequent modeling. First, our study investigated the robustness of radiomics features against multiple uncertainty sources, including bin width, resampling, image transformation, image noise, and segmentation growth/shrinkage. To our knowledge, this is the first study assessing the uncertainty of radiomics features of the whole pancreas against these perturbations. In our study, we found that 91 of the extracted 924 features are stable against these perturbations. Furthermore, we identified that the bin width and resampling is the most profound factor affecting the stability of radiomics features. Only 12.9% of the features were stable against bin width changes. Second, our exploratory analysis further reduced the highly correlated or redundant features and selected the most important and archetypal features via a combination of widely used machine learning algorithms. Our results showed that most radiomics features are highly correlated with each other, and these redundant features were excluded in the following modeling process as it does not provide additional meaningful information. Eight out of 91 features were determined to be nonredundant (Pearson coefficient <0.4). Through our comprehensive analysis, we removed unstable and redundant features from the predictive modeling process. Our results of the feature stability study showed that most extracted features are not stable against various image perturbations, which agrees with previous studies on the robustness of radiomics features.44–47 In addition, our analysis indicated that many radiomics features are highly correlated to each other since most features are generated by repeatedly calculating first- and second-order statistics on derived images. 48 Our findings further stressed the importance of performing feature robustness and redundancy analysis before predictive modeling to avoid spurious results in future radiomics studies. The fact that most of the radiomics features are unstable also poses challenges for the clinical applications of radiomics or radiomics-based biomarkers for personalized patient care and disease management. 49 Addressing this major challenge of bringing radiomics to the clinic requires continued efforts to validate and evolve the existing models on new datasets with ever-evolving technical parameters of image acquisition and reconstruction.
Our work has a few limitations. First, with a total number of 268 patients, our sample size is limited compared to previously published studies.50,51 The limited sample size is a common issue in machine learning-related projects in medical fields,52–54 and we implemented uncertainty analysis and feature selection to reduce the impact of this limitation. We believe our strategy of assessing the uncertainty introduced by such image perturbations can potentially be a standard workflow in future radiomics studies with a limited sample size. Besides, we have also designed our exploratory analysis and a feature selection pipeline that excludes redundant or nonimportant features, which is essential in a standardized radiomics analysis workflow. 9 Although we did not perform any power analysis for this retrospective study, our final predictive model only used 8 selected features, which complies with the recommendations from the previous studies with respect to the sample size and the number of features used in the predictive model.9,55,56 Second, our study is a single-institution study without any external validation, which is one of the essential metrics for assessing the robustness of a study.57–59 Although we sought to improve the robustness of our study by randomizing the TCIA public dataset into our radiomic analysis and predictive analytics, the generalizability of our results remains to be further validated on new datasets. Third, although all the CT images we collected are the venous phases of the contrast CT, it is difficult to evaluate contrast enhancement variation since it depends on patient-specific physiology (eg, blood flow rate). Therefore, we did not study the feature stability against contrast enhancement variation among various patients.
Conclusion
Our study proved that CT-based radiomics analysis and modeling can distinguish healthy individuals from pancreatic cancer patients, and potentially can become an effective tool to detect cancerous pancreatic tissue at an early stage.
Abbreviations
- AUC
area under the receiver operating characteristic curve
- CT
computed tomography
- ICC
intraclass correlation coefficient
- PDAC
pancreatic ductal adenocarcinoma
- RF
Random Forest
- TCIA
The Cancer Imaging Archive
Footnotes
Declaration of Conflicting Interests: The authors declared no potential conflicts of interest with respect to the research, authorship, and/or publication of this article.
Funding: The authors disclosed receipt of the following financial support for the research, authorship, and/or publication of this article: This work was supported by The Otis Glebe Medical Research Foundation–Nebraska University Foundation (grant number 01100674)
ORCID iD: Shuo Wang https://orcid.org/0000-0002-3814-606X
References
- 1.Siegel RL, Miller KD, Jemal A. Cancer statistics, 2019. CA Cancer J Clin. 2019;69(1):7-34. doi: 10.3322/caac.21551. PubMed PMID: 30620402. [DOI] [PubMed] [Google Scholar]
- 2.SEER Database. SEER Database: percent of cases & 5-year relative survival by stage at diagnosis: pancreatic cancer. Available from: https://seer.cancer.gov/statfacts/html/pancreas.html.
- 3.Ahn SS, Kim MJ, Choi JY, Hong HS, Chung YE, Lim JS. Indicative findings of pancreatic cancer in prediagnostic CT. Eur Radiol. 2009;19(10):2448-2455. doi: 10.1007/s00330-009-1422-6. PubMed PMID: 19415290. [DOI] [PubMed] [Google Scholar]
- 4.Mehmet Erturk S, Ichikawa T, Sou H, et al. Pancreatic adenocarcinoma: MDCT versus MRI in the detection and assessment of locoregional extension. J Comput Assist Tomogr. 2006;30(4):583-590. doi: 10.1097/00004728-200607000-00006. PubMed PMID: 16845288. [DOI] [PubMed] [Google Scholar]
- 5.Al-Hawary MM, Francis IR, Chari ST, et al. Pancreatic ductal adenocarcinoma radiology reporting template: consensus statement of the society of abdominal radiology and the American pancreatic association. Gastroenterology. 2014;146(1):291-304.e1. doi: 10.1053/j.gastro.2013.11.004. PubMed PMID: 24355035. [DOI] [PubMed] [Google Scholar]
- 6.Gerwing M, Herrmann K, Helfen A, et al. The beginning of the end for conventional RECIST - novel therapies require novel imaging approaches. Nat Rev Clin Oncol. 2019;16:442-458. doi: 10.1038/s41571-019-0169-5. PubMed PMID: 30718844. [DOI] [PubMed] [Google Scholar]
- 7.Gillies RJ, Kinahan PE, Hricak H. Radiomics: images are more than pictures, they are data. Radiology. 2016;278(2):563-577. doi: 10.1148/radiol.2015151169. PubMed PMID: 26579733; PubMed Central PMCID: PMCPMC4734157. [DOI] [PMC free article] [PubMed] [Google Scholar]
- 8.Aerts HJ, Velazquez ER, Leijenaar RT, et al. Decoding tumour phenotype by noninvasive imaging using a quantitative radiomics approach. Nat Commun. 2014;5:4006. doi: 10.1038/ncomms5006. PubMed PMID: 24892406; PubMed Central PMCID: PMCPMC4059926. [DOI] [PMC free article] [PubMed] [Google Scholar]
- 9.Lambin P, Leijenaar RTH, Deist TM, et al. Radiomics: the bridge between medical imaging and personalized medicine. Nat Rev Clin Oncol. 2017;14(12):749-762. doi: 10.1038/nrclinonc.2017.141. PubMed PMID: 28975929. [DOI] [PubMed] [Google Scholar]
- 10.Parmar C, Grossmann P, Bussink J, Lambin P, Aerts HJ. Machine learning methods for quantitative radiomic biomarkers. Sci Rep. 2015;5:13087. doi: 10.1038/srep13087. PubMed PMID: 26278466; PubMed Central PMCID: PMCPMC4538374. [DOI] [PMC free article] [PubMed] [Google Scholar]
- 11.Sanduleanu S, Woodruff HC, de Jong EEC, et al. Tracking tumor biology with radiomics: a systematic review utilizing a radiomics quality score. Radiother Oncol. 2018;127(3):349-360. doi: 10.1016/j.radonc.2018.03.033. PubMed PMID: 29779918. [DOI] [PubMed] [Google Scholar]
- 12.van Griethuysen JJM, Fedorov A, Parmar C, et al. Computational radiomics system to decode the radiographic phenotype. Cancer Res. 2017;77(21):e104-e1e7. doi: 10.1158/0008-5472.CAN-17-0339. PubMed PMID: 29092951; PubMed Central PMCID: PMCPMC5672828. [DOI] [PMC free article] [PubMed] [Google Scholar]
- 13.Aerts HJ. The potential of radiomic-based phenotyping in precision medicine: a review. JAMA Oncol. 2016;2(12):1636-1642. doi: 10.1001/jamaoncol.2016.2631. PubMed PMID: 27541161. [DOI] [PubMed] [Google Scholar]
- 14.Dou TH, Coroller TP, van Griethuysen JJM, Mak RH, Aerts HJWL. Peritumoral radiomics features predict distant metastasis in locally advanced NSCLC. PLoS One. 2018;13(11):e0206108. doi: 10.1371/journal.pone.0206108. PubMed PMID: 30388114; PubMed Central PMCID: PMCPMC6214508. [DOI] [PMC free article] [PubMed] [Google Scholar]
- 15.Macyszyn L, Akbari H, Pisapia JM, et al. Imaging patterns predict patient survival and molecular subtype in glioblastoma via machine learning techniques. Neuro Oncol. 2016;18(3):417-425. doi: 10.1093/neuonc/nov127. PubMed PMID: 26188015; PubMed Central PMCID: PMCPMC4767233. [DOI] [PMC free article] [PubMed] [Google Scholar]
- 16.Fave X, Zhang L, Yang J, et al. Delta-radiomics features for the prediction of patient outcomes in non-small cell lung cancer. Sci Rep. 2017;7(1):588. doi: 10.1038/s41598-017-00665-z. PubMed PMID: 28373718; PubMed Central PMCID: PMCPMC5428827. [DOI] [PMC free article] [PubMed] [Google Scholar]
- 17.van Timmeren JE, Leijenaar RTH, van Elmpt W, et al. Survival prediction of non-small cell lung cancer patients using radiomics analyses of cone-beam CT images. Radiother Oncol. 2017;123(3):363-369. doi: 10.1016/j.radonc.2017.04.016. PubMed PMID: 28506693. [DOI] [PubMed] [Google Scholar]
- 18.Bodalal Z, Trebeschi S, Nguyen-Kim TDL, Schats W, Beets-Tan R. Radiogenomics: bridging imaging and genomics. Abdom Radiol (NY). 2019;44(6):1960-1984. doi: 10.1007/s00261-019-02028-w. PubMed PMID: 31049614. [DOI] [PubMed] [Google Scholar]
- 19.Wu J, Tha KK, Xing L, Li R. Radiomics and radiogenomics for precision radiotherapy. J Radiat Res. 2018;59(suppl_1):i25-i31. doi: 10.1093/jrr/rrx102. PubMed PMID: 29385618; PubMed Central PMCID: PMCPMC5868194. [DOI] [PMC free article] [PubMed] [Google Scholar]
- 20.Mazurowski MA. Radiogenomics: what it is and why it is important. J Am Coll Radiol. 2015;12(8):862-866. doi: 10.1016/j.jacr.2015.04.019. PubMed PMID: 26250979. [DOI] [PubMed] [Google Scholar]
- 21.Gevaert O, Mitchell LA, Achrol AS, et al. Glioblastoma multiforme: exploratory radiogenomic analysis by using quantitative image features. Radiology. 2015;276(1):313. doi: 10.1148/radiol.2015154019. PubMed PMID: 26101929; PubMed Central PMCID: PMCPMC4725327. [DOI] [PMC free article] [PubMed] [Google Scholar]
- 22.Karlo CA, Di Paolo PL, Chaim J, et al. Radiogenomics of clear cell renal cell carcinoma: associations between CT imaging features and mutations. Radiology. 2014;270(2):464-471. doi: 10.1148/radiol.13130663. PubMed PMID: 24029645; PubMed Central PMCID: PMCPMC4011179. [DOI] [PMC free article] [PubMed] [Google Scholar]
- 23.Abazeed ME, Adams DJ, Hurov KE, et al. Integrative radiogenomic profiling of squamous cell lung cancer. Cancer Res. 2013;73(20):6289-6298. doi: 10.1158/0008-5472.CAN-13-1616. PubMed PMID: 23980093; PubMed Central PMCID: PMCPMC3856255. [DOI] [PMC free article] [PubMed] [Google Scholar]
- 24.Clark K, Vendt B, Smith K, et al. The cancer imaging archive (TCIA): maintaining and operating a public information repository. J Digital Imaging. 2013;26(6):1045-1057. doi: 10.1007/s10278-013-9622-7 [DOI] [PMC free article] [PubMed] [Google Scholar]
- 25.Roth HR, Lu L, Farag A, et al. DeepOrgan: multi-level deep convolutional networks for automated pancreas segmentation. arXiv e-prints [Internet]. June 1, 2015. Available from: https://ui.adsabs.harvard.edu/abs/2015arXiv150606448R.
- 26.Roth HR, Farag A, Turkbey EB, Lu L, Liu J, Summers RM. Data from Pancreas-CT. The cancer imaging archive. 2016. Available from: 10.7937/K9/TCIA.2016.tNB1kqBU. [DOI]
- 27.Pieper S, Lorensen B, Schroeder W, Kikinis R, editors. The NA-MIC Kit: ITK, VTK, pipelines, grids and 3D slicer as an open platform for the medical image computing community. Third IEEE International Symposium on Biomedical Imaging: Nano to Macro, 6-9 April 2006. [Google Scholar]
- 28.PyRadiomics Documentation. Available from: https://pyradiomics.readthedocs.io/en/latest/.
- 29.Koo TK, Li MY. A guideline of selecting and reporting intraclass correlation coefficients for reliability research. J Chiropr Med. 2016;15(2):155-163. doi: 10.1016/j.jcm.2016.02.012. PubMed PMID: 27330520; PubMed Central PMCID: PMCPMC4913118. [DOI] [PMC free article] [PubMed] [Google Scholar]
- 30.Benchoufi M, Matzner-Lober E, Molinari N, Jannot AS, Soyer P. Interobserver agreement issues in radiology. Diagn Interv Imaging. 2020;101(10):639-641. doi: 10.1016/j.diii.2020.09.001. PubMed PMID: 32958434. [DOI] [PubMed] [Google Scholar]
- 31.Larue R, van Timmeren JE, de Jong EEC, et al. Influence of gray level discretization on radiomic feature stability for different CT scanners, tube currents and slice thicknesses: a comprehensive phantom study. Acta Oncol. 2017;56(11):1544-1553. doi: 10.1080/0284186X.2017.1351624. PubMed PMID: 28885084. [DOI] [PubMed] [Google Scholar]
- 32.Gamer M, Lemon J, Singh IFP. irr: Various coefficients of interrater reliability and agreement. 2012. http://cran.r-project.org/web/packages/irr/index.html
- 33.Zhai B, Chen J. Development of a stacked ensemble model for forecasting and analyzing daily average PM. Sci Total Environ. 2018;635:644-658. doi: 10.1016/j.scitotenv.2018.04.040. PubMed PMID: 29679837. [DOI] [PubMed] [Google Scholar]
- 34.Meinshausen N, Bühlmann P. Stability selection. J R Stat Soc: Ser B (Stat Method). 2010;72(4):417-473. doi: 10.1111/j.1467-9868.2010.00740.x [DOI] [Google Scholar]
- 35.Chen T, Guestrin C. XGBoost: a scalable tree boosting system. Proceedings of the 22nd ACM SIGKDD international conference on knowledge discovery and data mining, San Francisco, California, USA: Association for Computing Machinery; 2016. pp. 785-794. [Google Scholar]
- 36.Breiman L. Random forests. Mach Learn. 2001;45(1):5-32. doi: 10.1023/A:1010933404324 [DOI] [Google Scholar]
- 37.Wang R. Adaboost for feature selection, classification and its relation with SVM, A review. Phys Procedia. 2012;25:800-807. 10.1016/j.phpro.2012.03.160 [DOI] [Google Scholar]
- 38.Geurts P, Ernst D, Wehenkel L. Extremely randomized trees. Mach Learn. 2006;63(1):3-42. doi: 10.1007/s10994-006-6226-1 [DOI] [Google Scholar]
- 39.Hanley JA, McNeil BJ. The meaning and use of the area under a receiver operating characteristic (ROC) curve. Radiology. 1982;143(1):29-36. doi: 10.1148/radiology.143.1.7063747. PubMed PMID: 7063747. [DOI] [PubMed] [Google Scholar]
- 40.Preuss K, Thach N, Liang X, et al. Using Quantitative imaging for personalized medicine in pancreatic cancer: a review of radiomics and deep learning applications. Cancers (Basel). 2022;14(7):1654. doi: 10.3390/cancers14071654. PubMed PMID: 35406426; PubMed Central PMCID: PMCPMC8997008. [DOI] [PMC free article] [PubMed] [Google Scholar]
- 41.Bezzi C, Mapelli P, Presotto L, et al. Radiomics in pancreatic neuroendocrine tumors: methodological issues and clinical significance. Eur J Nucl Med Mol Imaging. 2021;48(12):4002-4015. doi: 10.1007/s00259-021-05338-8. PubMed PMID: 33835220. [DOI] [PubMed] [Google Scholar]
- 42.Park S, Chu LC, Hruban RH, et al. Differentiating autoimmune pancreatitis from pancreatic ductal adenocarcinoma with CT radiomics features. Diagn Interv Imaging. 2020;101(9):555-564. doi: 10.1016/j.diii.2020.03.002. PubMed PMID: 32278586. [DOI] [PubMed] [Google Scholar]
- 43.Liu KL, Wu T, Chen PT, et al. Deep learning to distinguish pancreatic cancer tissue from non-cancerous pancreatic tissue: a retrospective study with cross-racial external validation. Lancet Digit Health. 2020;2(6):e303-ee13. doi: 10.1016/S2589-7500(20)30078-9. PubMed PMID: 33328124. [DOI] [PubMed] [Google Scholar]
- 44.Wang J, Shen L, Zhong H, et al. Radiomics features on radiotherapy treatment planning CT can predict patient survival in locally advanced rectal cancer patients. Sci Rep. 2019;9(1):15346. doi: 10.1038/s41598-019-51629-4. PubMed PMID: 31653909; PubMed Central PMCID: PMCPMC6814843. [DOI] [PMC free article] [PubMed] [Google Scholar]
- 45.Altazi BA, Zhang GG, Fernandez DC, et al. Reproducibility of F18-FDG PET radiomic features for different cervical tumor segmentation methods, gray-level discretization, and reconstruction algorithms. J Appl Clin Med Phys. 2017;18(6):32-48. doi: 10.1002/acm2.12170. PubMed PMID: 28891217; PubMed Central PMCID: PMCPMC5689938. [DOI] [PMC free article] [PubMed] [Google Scholar]
- 46.Shiri I, Rahmim A, Ghaffarian P, Geramifar P, Abdollahi H, Bitarafan-Rajabi A. The impact of image reconstruction settings on 18F-FDG PET radiomic features: multi-scanner phantom and patient studies. Eur Radiol. 2017;27(11):4498-4509. doi: 10.1007/s00330-017-4859-z. PubMed PMID: 28567548. [DOI] [PubMed] [Google Scholar]
- 47.Peerlings J, Woodruff HC, Winfield JM, et al. Stability of radiomics features in apparent diffusion coefficient maps from a multi-centre test-retest trial. Sci Rep. 2019;9(1):4800. doi: 10.1038/s41598-019-41344-5. PubMed PMID: 30886309; PubMed Central PMCID: PMCPMC6423042. [DOI] [PMC free article] [PubMed] [Google Scholar]
- 48.Park JE, Park SY, Kim HJ, Kim HS. Reproducibility and generalizability in radiomics modeling: possible strategies in radiologic and statistical perspectives. Korean J Radiol. 2019;20(7):1124-1137. doi: 10.3348/kjr.2018.0070. PubMed PMID: 31270976; PubMed Central PMCID: PMCPMC6609433. [DOI] [PMC free article] [PubMed] [Google Scholar]
- 49.Ibrahim A, Primakov S, Beuque M, et al. Radiomics for precision medicine: current challenges, future prospects, and the proposal of a new framework. Methods. 2021;188:20-29. doi: 10.1016/j.ymeth.2020.05.022. PubMed PMID: 32504782. [DOI] [PubMed] [Google Scholar]
- 50.Chu LC, Park S, Kawamoto S, et al. Utility of CT radiomics features in differentiation of pancreatic ductal adenocarcinoma from normal pancreatic tissue. AJR Am J Roentgenol. 2019;213(2):349-357. doi: 10.2214/AJR.18.20901. PubMed PMID: 31012758. [DOI] [PubMed] [Google Scholar]
- 51.Chen PT, Chang D, Yen H, et al. Radiomic features at CT can distinguish pancreatic cancer from noncancerous pancreas. Radiol Imaging Cancer. 2021;3(4):e210010. doi: 10.1148/rycan.2021210010. PubMed PMID: 34241550; PubMed Central PMCID: PMCPMC8344348. [DOI] [PMC free article] [PubMed] [Google Scholar]
- 52.Vabalas A, Gowen E, Poliakoff E, Casson AJ. Machine learning algorithm validation with a limited sample size. PLoS One. 2019;14(11):e0224365. doi: 10.1371/journal.pone.0224365. PubMed PMID: 31697686; PubMed Central PMCID: PMCPMC6837442. [DOI] [PMC free article] [PubMed] [Google Scholar]
- 53.Willemink MJ, Koszek WA, Hardell C, et al. Preparing medical imaging data for machine learning. Radiology. 2020;295(1):4-15. doi: 10.1148/radiol.2020192224. PubMed PMID: 32068507; PubMed Central PMCID: PMCPMC7104701. [DOI] [PMC free article] [PubMed] [Google Scholar]
- 54.Rashidi HH, Tran N, Albahra S, Dang LT. Machine learning in health care and laboratory medicine: general overview of supervised learning and auto-ML. Int J Lab Hematol. 2021;43(Suppl 1):15-22. doi: 10.1111/ijlh.13537. PubMed PMID: 34288435. [DOI] [PubMed] [Google Scholar]
- 55.Sollini M, Antunovic L, Chiti A, Kirienko M. Towards clinical application of image mining: a systematic review on artificial intelligence and radiomics. Eur J Nucl Med Mol Imaging. 2019;46(13):2656-2672. doi: 10.1007/s00259-019-04372-x. PubMed PMID: 31214791. [DOI] [PMC free article] [PubMed] [Google Scholar]
- 56.Hernandez B, Parnell A, Pennington SR. Why have so few proteomic biomarkers “survived” validation? Sample size and independent validation considerations). Proteomics. 2014;14(13-14):1587-1592. doi: 10.1002/pmic.201300377. PubMed PMID: 24737731. [DOI] [PubMed] [Google Scholar]
- 57.Kim DW, Jang HY, Kim KW, Shin Y, Park SH. Design characteristics of studies reporting the performance of artificial intelligence algorithms for diagnostic analysis of medical images: results from recently published papers. Korean J Radiol. 2019;20(3):405-410. doi: 10.3348/kjr.2019.0025. PubMed PMID: 30799571; PubMed Central PMCID: PMCPMC6389801. [DOI] [PMC free article] [PubMed] [Google Scholar]
- 58.Beaulieu-Jones B, Finlayson SG, Chivers C, et al. Trends and focus of machine learning applications for health research. JAMA Netw Open. 2019;2(10):e1914051. doi: 10.1001/jamanetworkopen.2019.14051. PubMed PMID: 31651969; PubMed Central PMCID: PMCPMC6822089. [DOI] [PMC free article] [PubMed] [Google Scholar]
- 59.Topol EJ. High-performance medicine: the convergence of human and artificial intelligence. Nat Med. 2019;25(1):44-56. doi: 10.1038/s41591-018-0300-7. PubMed PMID: 30617339. [DOI] [PubMed] [Google Scholar]


