Abstract
Histologic response to chemotherapy for osteosarcoma is one of the most important prognostic factors for survival, but assessment occurs after surgery. Although tumor imaging is used for surgical planning and follow-up, it lacks predictive value. Therefore, a radiomics model was developed to predict the response to neoadjuvant chemotherapy based on pretreatment T1-weighted contrast-enhanced MRI. A total of 176 patients (median age, 20 years [range, 5–71 years]; 107 male patients) with osteosarcoma treated with neoadjuvant chemotherapy and surgery between January 2007 and December 2018 in three different centers in France (Centre Léon Bérard in Lyon, Centre Hospitalier Universitaire de Nantes in Nantes, and Hôpital Cochin in Paris) were retrospectively analyzed. Various models were trained from different configurations of the data sets. Two different methods of feature selection were tested with and without ComBat harmonization (ReliefF and t test) to select the most relevant features, and two different classifiers were used to build the models (an artificial neural network and a support vector machine). Sixteen radiomics models were built using the different combinations of feature selection and classifier applied on the various data sets. The most predictive model had an area under the receiver operating characteristic curve of 0.95, a sensitivity of 91%, and a specificity 92% in the training set; respective values in the validation set were 0.97, 91%, and 92%. In conclusion, MRI-based radiomics may be useful to stratify patients receiving neoadjuvant chemotherapy for osteosarcomas.
Keywords: MRI, Skeletal-Axial, Oncology, Radiomics, Osteosarcoma, Pediatrics
Supplemental material is available for this article.
© RSNA, 2022
Keywords: MRI, Skeletal-Axial, Oncology, Radiomics, Osteosarcoma, Pediatrics
Summary
The use of radiomics combined with machine learning based on common MRI can be easily used to provide a new biomarker to predict poor response to chemotherapy and to modify the monitoring of neoadjuvant chemotherapy.
Key Points
■ Radiomics based on pretreatment MRI helped predict the histologic response to chemotherapy for osteosarcomas; for the training and validation sets, areas under the receiver operating characteristic curve were 0.95 and 0.97, sensitivity was 91% and 91%, and specificity was 92% and 92%, respectively.
■ The use of ComBat for data harmonization improved performance of the predictive models.
■ Radiomics may be used to stratify poor responders and good responders before neoadjuvant chemotherapy in order to modify the treatment of osteosarcomas.
Introduction
Osteosarcoma is the most common malignant bone tumor in children and young adults (1,2). The cornerstone of treatment is surgery combined with neoadjuvant chemotherapy (NAC), which is currently the standard of care (2,3). In addition to age and size, NAC efficacy is a main prognostic factor. NAC efficacy is assessed by evaluation of tumoral necrosis in anatomopathologic specimens obtained during surgical resection, according to the method described by Huvos et al (4). Early identification of “poor responders” is crucial for the improvement of disease management and prognosis. There are currently no reliable clinical, biologic, or radiologic criteria that allow early evaluation of the response to chemotherapy and modification of treatment. Quantitative assessment of the histologic response is challenging for radiologists, even with the use of diffusion-weighted imaging (5), dynamic MRI (6), or fluorine 18 (18F) PET/CT (7).
Computational medical imaging, or radiomics, is a recent discipline (8,9) that consists of transforming the image into a large space of usable characteristics (radiomics) (10); it is established on the principle that the image contains phenotypic information on a macroscopic scale. These data are then used to train classifiers that are predictive of an outcome (eg, histologic findings, survival, therapeutic response, genetic mutation) (10,11). Such models can provide valuable diagnostic, prognostic, or predictive information. Thus, the ultimate objective of radiomics is to develop imaging biomarkers that support medical decisions (11). Radiomics has great potential in oncology for stratifying patients, predicting tumor response to treatment, estimating patient survival (12,13), and phenotyping tumors (14). We aimed to develop a radiomics model to predict the histologic response to NAC for osteosarcoma from pretherapeutic MRI examinations.
Materials and Methods
Patients
Pediatric and adult patients treated for osteoblastic osteosarcoma between January 1, 2007, and December 31, 2018, in three centers in France (Centre Léon Bérard in Lyon, Centre Hospitalier Universitaire de Nantes in Nantes, and Hôpital Cochin in Paris) were consecutively included in this multicentric, retrospective study. Patient data were retrieved from the RESOS database (https://netsarc.sarcomabcb.org/) for the population of Lyon and Nantes and local archives for the Paris cohort. Patient data were collected after institutional review board approval. Patients who did not consent to the use of their clinical data for an academic study were excluded, according to national and European laws.
The diagnosis of osteosarcoma was confirmed according to review of pretreatment biopsy specimens. Patients with an extra-axial or axial bone osteosarcoma who were treated with NAC and resection surgery were included. Patients for whom the osteosarcoma was localized to the skull, soft tissue, or viscera were excluded, as were patients who underwent surgery before chemotherapy and those who did not undergo surgery.
All included patients underwent MRI with at least one postcontrast T1-weighted acquisition with fat signal suppression at least 1 month before the beginning of chemotherapy (median, 13 days; range, 2–27 days) (Fig 1). MRI examinations were performed before biopsy.
Figure 1:
MR images (postcontrast T1 with fat suppression, coronal plane [patient 1], and sagittal plane [patients 2 and 3]) in three different patients treated for osteosarcoma with neoadjuvant chemotherapy (NAC) and surgery at different timepoints (before surgery; after the administration of methotrexate, ifosfamide, and etoposide; and at the end of NAC). Patient 1 (male, aged 14 years) had a stable tumor volume throughout follow-up, with the disappearance of bone edema from the first MRI control. After surgery, histologic evaluation showed less than 1% viable cells (Huvos 4). Both patients 2 (female, aged 15 years) and 3 (female, aged 12 years) showed an increase in tumor volume in the first control followed by a decrease. However, histologic evaluation showed more than 60% viable cells for patient 2 (Huvos 2) and less than 1% (Huvos 1) for patient 3.
The study sample consisted of patients treated before surgery with high-dose methotrexate or a combination of methotrexate, doxorubicin, and cisplatin.
Response to chemotherapy according to the Huvos grading system (4) was retrospectively collected from histologic reports. According to national recommendations, surgery was performed 1–2 weeks after the end of chemotherapy (median, 11 days; range, 6–21 days). Patients were considered poor responders if the percentage of viable tumor cells was 10% or greater and good responders if the percentage of viable tumor cells was less than 10%.
MRI Acquisition
Patients underwent MRI using 1.5-T magnets from various systems: Siemens (n = 99), Philips (n = 33), General Electric (n = 39), and Toshiba (n = 5). Technical details are summarized in Appendix E1 (supplement).
Radiomics Extraction
Images were automatically loaded using in-house software developed on Matlab, version R2019a (MathWorks). They were manually segmented, and the 342 radiomics features were automatically extracted. The radiomics pipeline is detailed in Appendix E1 (supplement).
Data Harmonization
Because of the diverse MRI systems and imaging protocols used, statistical harmonization (ComBat) was performed to correct for differences in features caused by the various imaging settings. The fat signal suppression technique (fat-water decomposition [Dixon] vs fat saturation) was chosen for batch-effect correction. To avoid bias, z score normalization and ComBat harmonization were achieved during the training step, and the corresponding hyperparameters were computed and used for the validation set.
Feature Selection and Predictive Model Training
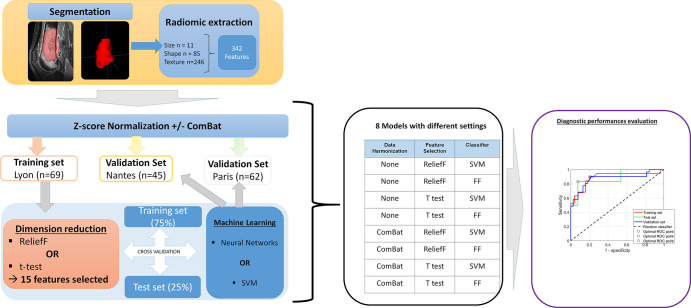
After extraction of radiomics features, dimensionality reduction was performed (Fig 2). Two different approaches were tested. In the first approach, feature selection was performed using the ReliefF algorithm, with k = 10 nearest neighbors. In the second approach, a statistical method accounting for relevancy and redundancy was tested. The number of features integrated into the model was set at n = 15.
Figure 2:
Radiomics analysis pipeline. During the segmentation step, the radiologist defined the contours of the tumor, selecting both the intraosseous contingent and extension into the soft tissues, excluding areas of intraosseous and perilesional edema. In total, 342 radiomic features were automatically extracted. Each database was separately normalized using the z score. An optional step of data harmonization using the ComBat algorithm was then performed. The training set was used to build the model. Dimension reduction was performed using one of two feature-selection methods (t test or ReliefF). Then, machine learning was performed from two different classifiers: a support vector machine (SVM) or an artificial neural network with feedforward (FF) multilayer perceptron architecture. Internal validation was systematically performed to evaluate overfitting using a hold-out cross-validation technique, with 75% of the database used for training and 25% for validation. Then, model inference was performed using the different validation sets and the performance evaluated by receiver operating characteristic (ROC) analysis. Finally, eight models were created with different settings. The variety of the data in the learning set was increased by concatenating the Lyon set and the Nantes set. Then, model inference was performed using the database of Paris.
From the reduced learning base, we compared two different classifiers to stratify good responders from poor responders. For the first, we used an artificial neural network with a feedforward multilayer perceptron architecture. For the second classifier, we used a support vector machine trained with a linear kernel and box constraints set to 1. We used different combinations of patient cohorts to build the training-base database. Overall, 16 different models were built. Figure 2 summarizes the study design.
Data harmonization, feature selection, and predictive model training processes are detailed in Appendix E1 (supplement).
Results
Patients
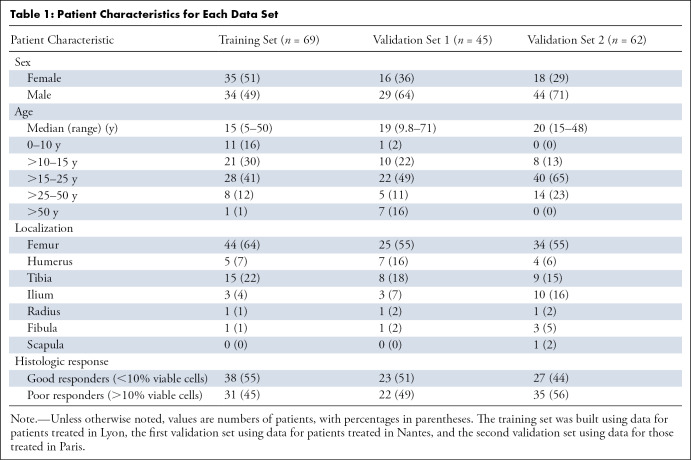
In total, 176 patients (median age, 20 years; range, 5–71 years; 107 male patients) were included. The demographic characteristics of the study sample are presented in Table 1. Fifty percent (88 of 176) of the patients were classified as good responders and 50% (88 of 176) as poor responders. Patient sample details are provided in Appendix E1 (supplement).
Table 1:
Patient Characteristics for Each Data Set
Relevance of Radiomics Features to Predict Chemotherapy Response
Features with their respective weight of predictor importance are listed in Appendix E1 (supplement).
Diagnostic Performance of the Predictive Models
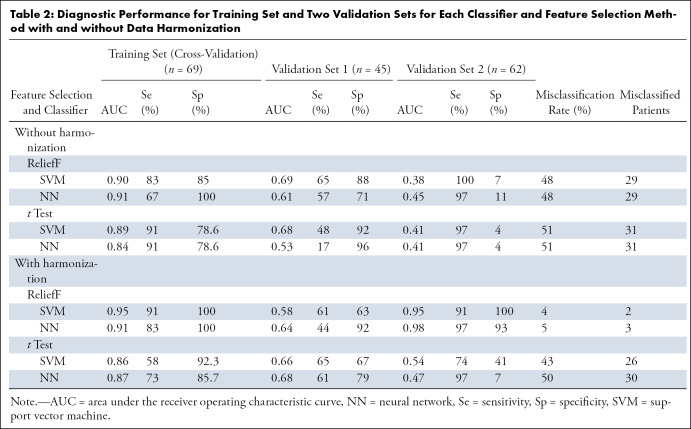
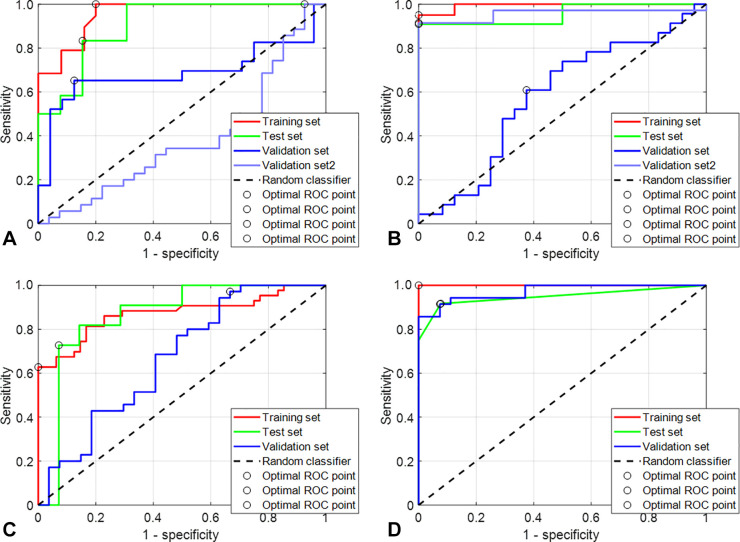
First experiment: Training using the Lyon cohort and independent double validation on the Nantes and Paris cohorts.— The model built using the Lyon cohort (n = 69) failed to generalize when tested on the Nantes (n = 45) and Paris (n = 62) cohorts, regardless of the feature selection method and classifier. Before data harmonization, the area under the receiver operating characteristic curve (AUC) ranged from 0.95 to 1 for the training set, 0.53 to 0.7 for the first validation set, and 0.37 to 0.41 for the second validation set. When data harmonization using ComBat was included, the AUC ranged from 0.93 to 1 for the learning set, 0.58 to 0.68 for the first validation set, and 0.47 to 0.98 for the second validation set. Classifier performance for each dataset is presented in Table 2.
Table 2:
Diagnostic Performance for Training Set and Two Validation Sets for Each Classifier and Feature Selection Method with and without Data Harmonization
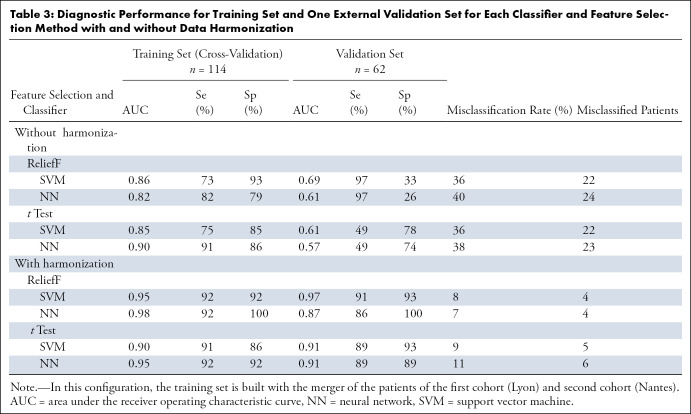
Second experiment: Training using the mixed Lyon and Nantes cohort and validation on the Paris cohort.— In this second step, the models trained using the mixed Lyon and Nantes cohort (n = 69 + 45 = 114) generalized better than in the previous step when tested on the Paris cohort (n = 62), regardless of the feature selection method and classifier, but only after data harmonization was performed.
Before use of the data harmonization algorithm, the AUC ranged from 0.87 to 0.96 for the learning set and 0.57 to 0.67 for the validation set. After data harmonization was performed, the AUC ranged from 0.99 to 1 for the training set from 0.91 to 0.97 for the validation set (Fig 3). The most predictive model had an AUC of 0.95, a sensitivity of 91%, and a specificity 92% in the training set; respective values in the validation set were 0.97, 91%, and 92%.
Figure 3:
Receiver operating characteristic (ROC) analysis of four different models. (A) The population of Lyon was used as a training set without the use of the harmonization data algorithm. The ReliefF algorithm was used to select the most relevant features, and a support vector machine (SVM) was used as the classifier. Then, model inference was performed using the two validation sets independently. The area under the ROC curve (AUC) in red shows the performance on the training set (green for the cross-validation set), and the curves in blue show the performance on the Nantes and Paris validation cohorts. (B) This model was built in the same configuration as the model in A, but a previous step of data harmonization was performed using ComBat as explained in Figure 2. (C) The Lyon and Nantes cohorts were merged and used as a training set without the use of the data harmonization algorithm. The ReliefF algorithm was used to select the most relevant features, and an SVM was used as the classifier. Then, model inference was performed on the Paris validation cohort. The AUC curve in red shows the performance in the training set and the curve in blue the performance on the Paris validation cohort. (D) This model was built in the same configuration as the model in C but with the use of ComBat.
The artificial neural network was set up with an input layer, an output layer, and three hidden layers of 15, 12, and nine neurons, respectively, and outperformed the model built with the support vector machine. Classifier performance is presented in Table 3.
Table 3:
Diagnostic Performance for Training Set and One External Validation Set for Each Classifier and Feature Selection Method with and without Data Harmonization
Discussion
In this study, we demonstrate that radiomics analysis of pretreatment MRI in pediatric and adult patients with osteosarcoma may be useful in predicting response to NAC. The study sample is similar to the known epidemiologic data for osteosarcoma (2). This sample may therefore be valid for prototyping a predictive model that may be used in the general population. The stratification of patients at diagnosis is challenging in the management of osteosarcoma because of the lack of relevant biologic, clinical, and radiologic biomarkers. The identification of good responders may improve the management of NAC, particularly because some new treatments, such as mifamurtide (15) and regorafenib (16), have been reported to increase survival of patient if given in the adjuvant setting. Im et al (7) showed that PET data can help predict overall survival and event-free survival but not histologic response to chemotherapy. Asmar et al (17) showed that diffusion MRI could be useful during monitoring to assess the response to ongoing chemotherapy. Dyke et al (18) demonstrated similar findings for dynamic perfusion MRI.
Our study showed that among the different radiomics features, size (longest equivalent diameter) appeared to be predictive of the histologic response to chemotherapy. In addition, good responders to chemotherapy had larger values of high gray-level zone and gray-level run emphasis, short-run high gray-level emphasis, and long-run high gray-level emphasis. Furthermore, good responders had a higher autocorrelation and a greater cluster shade than poor responders, showing a coarser texture. Thus, the tumors of good responders showed a coarse texture and, above all, higher gray-level values.
From a microscopic point of view, high gray-level values were associated with higher contrast enhancement and may be due to greater angiogenesis, whereas tumors with low gray-level values were associated with tumor necrosis.
Macroscopic and genetic tumor heterogeneity are known factors in the resistance to treatment (19). Song et al (20) reported that intratumoral heterogeneity of baseline 18F-fluorodeoxyglucose uptake measured with PET texture analysis can predict tumor response and event-free survival for osteosarcoma treated with NAC. Coarseness and neighborhood gray-tone difference matrix helped predict event-free survival, and nonuniformity (dependence nonuniformity, run-length nonuniformity, and size zone nonuniformity) helped predict the response to chemotherapy.
To obtain the most relevant features, it may be useful to extract radiomic features from the results of various imaging techniques and multicontrast imaging. For example, diffusion-weighted imaging with apparent diffusion coefficient mapping was used to differentiate between the necrotic and viable portions of an osteosarcoma (17).
Our study had several limitations. First, a retrospective study such as ours entails highly varying imaging protocols. Osteosarcoma is a rare tumor, and patients were included from a period of 10 years for a larger sample size. Furthermore, it was necessary to merge the patients from two cohorts to build a consequent training set because the model built on the single Lyon cohort did not generalize on the second cohort. This operation resulted in sacrifice of one validation set but also allowed us to minimize the overfitting on the learning set. Our model must be validated in practice using prospective data. As previously demonstrated, a batch correction was inferred on the general population with a high variety of protocols (21,22). However, some precautions should be taken about the distribution of data to harmonize. Because the ComBat algorithm assumes similar distributions, the distribution of data must be similar except for the shift or spread. In addition, a covariate (here the good or poor responder status) and how the batch effect affects this covariate should be identified. If this covariate is identically affected by the batch effect, the ComBat method can be used by including this covariate. In contrast, as is the case in this study, the ComBat transformation should be estimated for each sample independently. Another limitation of our study pertains to manual segmentation of the lesions. Reproducibility and repeatability could not be tested in this study because the tumors were segmented by a single radiologist. Indeed, the segmentation of osteosarcomas is challenging because of their varying localization, shape, and margins. In the same way, the effect of segmentation could not be studied. However, although the segmentation may influence some shape features, the most important features, such as size, are likely to be reproducible. Finally, although the number of patients included was modest for a radiomics study, it was relatively large given the low prevalence of osteosarcoma. In addition, there was a good balance between the classes of patients (good vs poor responders). Our database is the largest reported for a radiomics study on osteosarcoma.
In this study, chemotherapy response was predicted on the basis of an MRI examination performed at a single timepoint. Typical approaches for the evaluation of responses to chemotherapy evaluate the difference between the pretreatment and midcourse MRI examinations. Crombé et al (23) demonstrated that the changes in radiomics features on T2-weighted images correlate with the NAC response of soft-tissue sarcomas. The changes in radiomics features in osteosarcoma should be evaluated in future studies.
In conclusion, this pilot study showed that it is possible to use postcontrast T1-weighted MRI radiomics to train prediction models for the response of osteosarcomas to NAC. However, multicentric data sharing will be required to increase the volume of data and more carefully evaluate overfitting and batch effects linked to the use of data acquired from nonstandardized acquisition protocols.
This work was performed within the framework of a SIRIC LyriCAN grant INCa_INSERM_DGOS_12563 and LABEX PRIMES (ANR-11-LABX-0063), program “Investissements d'Avenir” (ANR-11-IDEX-0007).
Disclosures of conflicts of interest: A.B. No relevant relationships. B.L. No relevant relationships. W.K. No relevant relationships. A.N. No relevant relationships. M.B. Payment or honoraria for lectures, presentations, speakers bureaus, manuscript writing, or educational events from Amgen and Bayer; support for attending meetings and/or travel from PharmaMar, Pfizer, and Mundipharma. J.D. No relevant relationships. P.M.B. No relevant relationships. J.L.D. No relevant relationships. F.G. Royalties/licenses from Zimmer paid to author; consulting fees from Amgen paid to author; co-coordinator French sarcoma network Netsarc and general secretary of French Sarcoma Group; stock/stock options (co-founder) Atlanthera. A.B.V. No relevant relationships. J.Y.B. Grants from LyriCAN (INCA-DGOS-INSERM 12563), NETSARC+(INCA), InterSARC (INCA), LabEx DEvweCAN (ANR-10-LABX-0061), EURACAN (EC 739521). O.B. No relevant relationships. F.P. No relevant relationships.
Abbreviations:
- AUC
- area under the receiver operating characteristic curve
- NAC
- neoadjuvant chemotherapy
References
- 1. Fletcher CDM , Bridge JA . WHO classification of tumours of soft tissue and bone . 5th ed . Lyon, France: : IARC Press; , 2020. . [Google Scholar]
- 2. Gaspar N , Occean BV , Pacquement H , et al . Results of methotrexate-etoposide-ifosfamide based regimen (M-EI) in osteosarcoma patients included in the French OS2006/sarcome-09 study . Eur J Cancer 2018. ; 88 : 57 – 66 . [DOI] [PubMed] [Google Scholar]
- 3. Marina NM , Smeland S , Bielack SS , et al . Comparison of MAPIE versus MAP in patients with a poor response to preoperative chemotherapy for newly diagnosed high-grade osteosarcoma (EURAMOS-1): an open-label, international, randomised controlled trial . Lancet Oncol 2016. ; 17 ( 10 ): 1396 – 1408 . [DOI] [PMC free article] [PubMed] [Google Scholar]
- 4. Huvos AG , Rosen G , Marcove RC . Primary osteogenic sarcoma: pathologic aspects in 20 patients after treatment with chemotherapy en bloc resection, and prosthetic bone replacement . Arch Pathol Lab Med 1977. ; 101 ( 1 ): 14 – 18 . [PubMed] [Google Scholar]
- 5. Lee SK , Jee WH , Jung CK , Im SA , Chung NG , Chung YG . Prediction of poor responders to neoadjuvant chemotherapy in patients with osteosarcoma: additive value of diffusion-weighted MRI including volumetric analysis to standard MRI at 3T . PLoS One 2020. ; 15 ( 3 ): e0229983 . [DOI] [PMC free article] [PubMed] [Google Scholar]
- 6. Kubo T , Furuta T , Johan MP , Adachi N , Ochi M . Percent slope analysis of dynamic magnetic resonance imaging for assessment of chemotherapy response of osteosarcoma or Ewing sarcoma: systematic review and meta-analysis . Skeletal Radiol 2016. ; 45 ( 9 ): 1235 – 1242 . [DOI] [PubMed] [Google Scholar]
- 7. Im HJ , Kim TS , Park SY , et al . Prediction of tumour necrosis fractions using metabolic and volumetric 18F-FDG PET/CT indices, after one course and at the completion of neoadjuvant chemotherapy, in children and young adults with osteosarcoma . Eur J Nucl Med Mol Imaging 2012. ; 39 ( 1 ): 39 – 49 . [DOI] [PubMed] [Google Scholar]
- 8. Sun R , Limkin EJ , Dercle L , et al . Computational medical imaging (radiomics) and potential for immuno-oncology [in French] . Cancer Radiother 2017. ; 21 ( 6-7 ): 648 – 654 . [DOI] [PubMed] [Google Scholar]
- 9. Limkin EJ , Sun R , Dercle L , et al . Promises and challenges for the implementation of computational medical imaging (radiomics) in oncology . Ann Oncol 2017. ; 28 ( 6 ): 1191 – 1206 . [DOI] [PubMed] [Google Scholar]
- 10. Gillies RJ , Kinahan PE , Hricak H . Radiomics: images are more than pictures, they are data . Radiology 2016. ; 278 ( 2 ): 563 – 577 . [DOI] [PMC free article] [PubMed] [Google Scholar]
- 11. Lambin P , Leijenaar RTH , Deist TM , et al . Radiomics: the bridge between medical imaging and personalized medicine . Nat Rev Clin Oncol 2017. ; 14 ( 12 ): 749 – 762 . [DOI] [PubMed] [Google Scholar]
- 12. Sun R , Limkin EJ , Vakalopoulou M , et al . A radiomics approach to assess tumour-infiltrating CD8 cells and response to anti-PD-1 or anti-PD-L1 immunotherapy: an imaging biomarker, retrospective multicohort study . Lancet Oncol 2018. ; 19 ( 9 ): 1180 – 1191 . [DOI] [PubMed] [Google Scholar]
- 13. Coroller TP , Agrawal V , Narayan V , et al . Radiomic phenotype features predict pathological response in non-small cell lung cancer . Radiother Oncol 2016. ; 119 ( 3 ): 480 – 486 . [DOI] [PMC free article] [PubMed] [Google Scholar]
- 14. Wu W , Parmar C , Grossmann P , et al . Exploratory study to identify radiomics classifiers for lung cancer histology . Front Oncol 2016. ; 6 : 71 . [DOI] [PMC free article] [PubMed] [Google Scholar]
- 15. Brard C , Piperno-Neumann S , Delaye J , et al . Sarcome-13/OS2016 trial protocol: a multicentre, randomised, open-label, phase II trial of mifamurtide combined with postoperative chemotherapy for patients with newly diagnosed high-risk osteosarcoma . BMJ Open 2019. ; 9 ( 5 ): e025877 . [DOI] [PMC free article] [PubMed] [Google Scholar]
- 16. Davis LE , Bolejack V , Ryan CW , et al . Randomized double-blind phase II study of regorafenib in patients with metastatic osteosarcoma . J Clin Oncol 2019. ; 37 ( 16 ): 1424 – 1431 . [DOI] [PMC free article] [PubMed] [Google Scholar]
- 17. Asmar K , Saade C , Salman R , et al . The value of diffusion weighted imaging and apparent diffusion coefficient in primary Osteogenic and Ewing sarcomas for the monitoring of response to treatment: Initial experience . Eur J Radiol 2020. ; 124 : 108855 . [DOI] [PubMed] [Google Scholar]
- 18. Dyke JP , Panicek DM , Healey JH , et al . Osteogenic and Ewing sarcomas: estimation of necrotic fraction during induction chemotherapy with dynamic contrast-enhanced MR imaging . Radiology 2003. ; 228 ( 1 ): 271 – 278 . [DOI] [PubMed] [Google Scholar]
- 19. Crenn V , Biteau K , Amiaud J , et al . Bone microenvironment has an influence on the histological response of osteosarcoma to chemotherapy: retrospective analysis and preclinical modeling . Am J Cancer Res 2017. ; 7 ( 11 ): 2333 – 2349 . [PMC free article] [PubMed] [Google Scholar]
- 20. Song H , Jiao Y , Wei W , et al . Can pretreatment 18F-FDG PET tumor texture features predict the outcomes of osteosarcoma treated by neoadjuvant chemotherapy? Eur Radiol 2019. ; 29 ( 7 ): 3945 – 3954 . [DOI] [PubMed] [Google Scholar]
- 21. Orlhac F , Frouin F , Nioche C , Ayache N , Buvat I . Validation of a method to compensate multicenter effects affecting CT radiomics . Radiology 2019. ; 291 ( 1 ): 53 – 59 . [DOI] [PubMed] [Google Scholar]
- 22. Whitney HM , Li H , Ji Y , Liu P , Giger ML . Harmonization of radiomic features of breast lesions across international DCE-MRI datasets . J Med Imaging (Bellingham) 2020. ; 7 ( 1 ): 012707 . [DOI] [PMC free article] [PubMed] [Google Scholar]
- 23. Crombé A , Périer C , Kind M , et al . T2-based MRI delta-radiomics improve response prediction in soft-tissue sarcomas treated by neoadjuvant chemotherapy . J Magn Reson Imaging 2019. ; 50 ( 2 ): 497 – 510 . [DOI] [PubMed] [Google Scholar]


![MR images (postcontrast T1 with fat suppression, coronal plane [patient 1], and sagittal plane [patients 2 and 3]) in three different patients treated for osteosarcoma with neoadjuvant chemotherapy (NAC) and surgery at different timepoints (before surgery; after the administration of methotrexate, ifosfamide, and etoposide; and at the end of NAC). Patient 1 (male, aged 14 years) had a stable tumor volume throughout follow-up, with the disappearance of bone edema from the first MRI control. After surgery, histologic evaluation showed less than 1% viable cells (Huvos 4). Both patients 2 (female, aged 15 years) and 3 (female, aged 12 years) showed an increase in tumor volume in the first control followed by a decrease. However, histologic evaluation showed more than 60% viable cells for patient 2 (Huvos 2) and less than 1% (Huvos 1) for patient 3.](https://cdn.ncbi.nlm.nih.gov/pmc/blobs/2a11/9530773/16524bb8b83a/rycan.210107.fig1.jpg)
