Abstract
Colon cancer is the third most common cancer and the second leading cause of cancer‐related death worldwide. Dysregulated RNA splicing factors have been reported to be associated with tumorigenesis and development in colon cancer. In this study, we interrogated clinical and RNA expression data of colon cancer patients from The Cancer Genome Atlas (TCGA) dataset and the Gene Expression Omnibus (GEO) database. Genes regulating RNA splicing correlated with survival in colon cancer were identified and a risk score model was constructed using Cox regression analyses. In the risk model, RNA splicing factor peroxisome proliferator‐activated receptor‐γ coactivator‐1α (PPARGC1) is correlated with a good survival outcome, whereas Cdc2‐like kinase 1(CLK1), CLK2, and A‐kinase anchor protein 8‐like (AKAP8L) with a bad survival outcome. The risk model has a good performance for clinical prognostic prediction both in the TCGA cohort and the other two validation cohorts. In the tumor microenvironment (TME) analysis, the immune score was higher in the low‐risk group, and TME‐related pathway gene expression was also higher in low‐risk group. We further verified the mRNA and protein expression levels of these four genes in the adjacent nontumor, tumor, and liver metastasis tissues of colon cancer patients, which were consistent with bioinformatics analysis. In addition, knockdown of AKAP8L can suppress the proliferation and migration of colon cancer cells. Animal studies have also shown that AKAP8L knockdown can inhibit tumor growth in colon cancer in vivo. We established a prognostic risk model for colon cancer based on genes related to RNA splicing regulation and uncovered the role of AKAP8L in promoting colon cancer progression.
Keywords: AKAP8L, colon cancer, prognosis, risk model, RNA splicing
we interrogated transcriptome and the corresponding clinical data of colon cancer patients from the The Cancer Genome Atlas (TCGA) and Gene Expression Omnibus (GEO) dataset to investigate prognosis associated splicing‐related signature.And our study established a prognostic risk model based on RNA splicing regulation related genes for colon cancer.
Abbreviations
- AKAP8L
A‐kinase anchor protein 8‐like
- AS
alternative splicing
- CLK
Cdc2‐like kinase
- CRC
colorectal carcinoma
- DEG
differentially expressed gene
- GEO
Gene Expression Omnibus
- GO
Gene Ontology
- GSEA
Gene Set Enrichment Analysis
- IHC
immunohistochemical
- KEGG
Kyoto Encyclopedia of Genes and Genomes
- KM
Kaplan–Meier
- OS
overall survival
- PGC1α
peroxisome proliferator‐activated receptor‐γ coactivator‐1α
- PKM
pyruvate kinase M
- PPI
protein–protein interaction
- ROC
receiver operating characteristic
- SR
serine/arginine‐rich
- TCGA
The Cancer Genome Atlas
- TME
tumor microenvironment
1. BACKGROUND
Colon cancer is the third most common cancer and the second leading cause of cancer death worldwide. 1 The incidence and mortality of colon cancer are increased all over the world. 2 , 3 Approximately 20% of patients with colon cancer are diagnosed at an advanced stage, and the 5‐year survival rate is less than 15%. 4 With the improvement of detection methods, the early diagnosis rate has been improved, but the prognosis of advanced colon cancer patients is still poor. Therefore, the study of molecular mechanisms related to the pathogenesis of colon cancer will contribute to the diagnosis, treatment, and prognosis of colon cancer.
Alternative splicing is an important biological process in which multiple mRNA splicing isoforms are generated by different splicing patterns of pre‐mRNA. 5 Alternative splicing can enrich the variety and quantity of proteins and is the major mechanism to improve biodiversity and affect a variety of biological processes. 5 Dysregulation of alternative splicing contributes to tumor processes, including angiogenesis, tumor invasion and metastasis, energy metabolism, and immune regulation. 6 , 7 For instance, splicing variants of PKM transform to PKM2, which could affect the metabolism and promote tumor cell proliferation. 8 In addition, the variant isoform CD44v switch to CD44s has been reported to be associated with epithelial–mesenchymal transition in many cancer types. 9 , 10 , 11 , 12 Recently, AS has been summarized to be involved in the initiation and development of CRC. 13 Investigation of aberrant AS in colon cancer is of great significance for elucidating the molecular mechanism of tumorigenesis and providing therapeutic targets and novel prognostic biomarkers for colon cancer patients.
Cancer‐associated aberrant AS events may regulate by cis‐acting somatic mutations and trans‐acting mutations in splicing regulatory proteins including SR proteins. 14 Dysfunction of splicing factors can hinder splicing of individual introns or generate new splice sites, and could even have a larger impact on splicing dysregulation and alter the transcription network. 15 Recently, there has been growing interest in investigating the aberrant RNA splicing regulation factors in tumorigenesis and progression. 16
In this study, we constructed a prognostic risk model for colon cancer based on the genes associated with RNA splicing regulation. The clinical application value of this risk model was investigated. In addition, further external validation of the four RNA splicing‐related DEGs in the risk model was carried out in clinical samples of colon cancer patients and in vitro cell function experiments.
2. MATERIALS AND METHODS
2.1. Data collection and collation
All transcriptome and the corresponding clinical data of colon cancer patients were derived from TCGA and GEO databases. Including the discovery cohort (TCGA, n = 453) and two validation cohorts (GSE17536, n = 177; GSE41258, n = 185). Source websites, numbers of samples, and platforms of each cohort are summarized in Tables S1–S8. The clinical features of the TCGA and GEO patients are shown in Table 1, and the workflow is shown in Tables S1–S8. The RNA sequencing data were quantified as transcripts per kilobase million (TPM) values, which were similar to microarray data and more comparable between samples. The raw data for the microarray datasets were normalized using the RMA algorithm for background adjustment in the “Affy” software package. A total of 484 RNA splicing regulation‐related genes were obtained from the item “GO_RNA_SPLICING” from the GSEA database (http://www.gsea‐msigdb.org/). Three hundred and forty‐seven genes were found in all cohorts selected for further analysis.
TABLE 1.
Clinical characteristics between training and validation cohorts of colon cancer patients
| TCGA | GSE41258 | GSE17536 | |
|---|---|---|---|
| N = 453 | N = 185 | N = 177 | |
| Age (years) | |||
| ≥60 | 328 (72.4) | 125 (67.6) | 122 (68.9) |
| <60 | 125 (27.6) | 60 (32.4) | 55 (31.1) |
| Gender | |||
| Female | 214 (47.2) | 87 (47.0) | 81 (45.8) |
| Male | 239 (52.8) | 98 (53.0) | 96 (54.2) |
| Tumor position | |||
| Distal | 177 (39.10) | 108 (58.40) | 0 (0.00) |
| Proximal | 260 (57.40) | 77 (41.60) | 0 (0.00) |
| Unknown | 16 (3.53) | 0 (0.00) | 177 (100.00) |
| Stage | |||
| I/II | 251 (55.40) | 78 (42.20) | 81 (45.80) |
| III/IV | 192 (42.40) | 107 (57.80) | 96 (54.20) |
| Unknown | 10 (2.21) | 0 (0.00) | 0 (0.00) |
| MSI | |||
| MSI‐H | 78 (17.2) | 35 (18.9) | 0 (0.0) |
| Non‐MSI‐H | 351 (77.5) | 133 (71.9) | 0 (0.0) |
| Unknown | 24 (5.30) | 17 (9.19) | 177 (100) |
| Censored | |||
| Yes | 102 (22.5) | 102 (55.1) | 73 (41.2) |
| No | 351 (77.5) | 83 (44.9) | 104 (58.8) |
| Overall survival (months) | 22.3 (12.7–36.4) | 66.0 (25.0–100.0) | 42.3 (22.8–67.8) |
Note: Data are shown as n (%) or median (range).
Abbreviations: MSI, microsatellite instability; MSI‐H, MSI‐high; TCGA, The Cancer Genome Atlas.
2.2. Statistical analysis
Statistical analyses were undertaken using R version 3.6.3. and GraphPad Prism version 6.0.0 for Windows (GraphPad Software). The best cut‐off values of KM curves for subgroups in each dataset were obtained by utilizing “survminer” R package. To demonstrate the robustness of risk score, the sample size of any subgroup is no less than 30% of the total number and the log–rank test was used to determine the significant differences. Independent predictive performance of risk scores was evaluated by univariate and multivariate Cox regression analyses. The Wilcoxon test was applied in comparisons of two groups; the Kruskal–Wallis test was utilized to compare groups of more than two. The χ2‐test was implemented to show differences between two subgroups and clinical information. In clinical sample validation and cell function experiments, all results are shown as the mean ± SD of three independent experiments. Differences between two groups were analyzed using the unpaired sample t‐test. The statistical significance was considered to be 0.05, and all statistical p values were two‐sided.
Other methods are available in Appendix S1.
3. RESULTS
3.1. Identification of RNA splicing associated DEGs with prognostic significance for colon cancer
First, we analyzed the expression of genes associated RNA splicing in tumor samples and adjacent nontumorous samples in the TCGA and GSE41258 cohorts. A total of 195 genes were differentially expressed in both cohorts and were termed RNA splicing associated DEGs (Figure 1A). Using univariate Cox regression analysis of OS in the TCGA cohort, 21 DEGs with prognostic significance were identified. It was considered that upregulated genes should be associated with a poorer survival, whereas downregulated genes should be related to superior survival. Thus, AKAP8L, PPARGC1A, CLK2, and CLK1were selected for further analysis (Figure 1B). The heatmap graph showed that the four DEGs were expressed differently between colon cancer and normal tissue (Figure 1C).
FIGURE 1.

Identification of key RNA splicing regulation related differentially expressed genes (DEGs) for prognosis of colon cancer. (A) 195 RNA splicing regulator related DEGs were selected for subsequent analysis based on the intersection of The Cancer Genome Atlas (TCGA) cohort and GSE41258 dataset. (B) Volcano plot for the 195 DEGs from the TCGA data portal. HR, hazard ratio. (C) Heatmap shows the expression profiles of the four selected RNA splicing regulator related genes in normal and colon cancer samples in the TCGA database
3.2. Construction and validation of prognostic risk model based on four RNA splicing associated genes
We next constructed a prognostic signature based on the four genes, and the proportional hazards assumption as follows: risk score = (0.11 × expression level of AKAP8L) + (0.13 × expression level of CLK2) + (0.15 × expression level of CLK1) + (−0.35 × expression level of PPARGC1A). The distribution of each patient's risk score was obtained by calculating the risk score of each patient in the TCGA cohort. The risk score had a positive correlation with the event of death, and the number of alive patients in the low‐risk score group was higher than in the high‐risk group (Figure 2A,B). The expression levels of AKAP8L, CLK1, and CLK2 were higher in high‐risk score group, while the expression level of PPARGC1A was higher in the low‐risk score group (Figure 2C). Principal component analysis showed that the sample discrimination was favorable between the high‐risk and low‐risk groups (Figure 2D). Furthermore, patients were divided into high‐risk and low‐risk groups based on the median value of the risk score in each combination, and then KM analysis was used to analyze the OS of patients between the two groups. The result revealed that the high‐risk group patients had a significantly worse OS, indicating that a high‐risk score predicted poor prognosis for colon cancer (Figure 2E). The clinical characteristics between the high‐risk and low‐risk score groups in the TCGA cohort is shown in Table 2. Furthermore, the prediction performance of the risk model was assessed with two external datasets using the GEO datasets of GSE17536 and GSE41258. Similar results were obtained in the two validation cohorts as in the training TCGA cohort. High‐risk scores were significantly associated with worse OS (Figure 2F,G). The clinical characteristics of the training and validation cohorts are shown in Appendix S1. These results suggested that the risk model has a relatively high prognostic predictive ability and could identify high‐risk patients with poor survival outcomes in three different cohorts. We applied univariable Cox regression analysis in the TCGA training cohort and found that the risk score and tumor TNM stage were risk factors for OS. Further multivariable Cox regression analysis revealed that risk score, tumor TNM stage, and tumor position were independent risk factors for OS (Figure 2H). Similar results, showing that the risk score was an independent risk factor for OS, were obtained in the two validation cohorts (Figure 2I,J).
FIGURE 2.
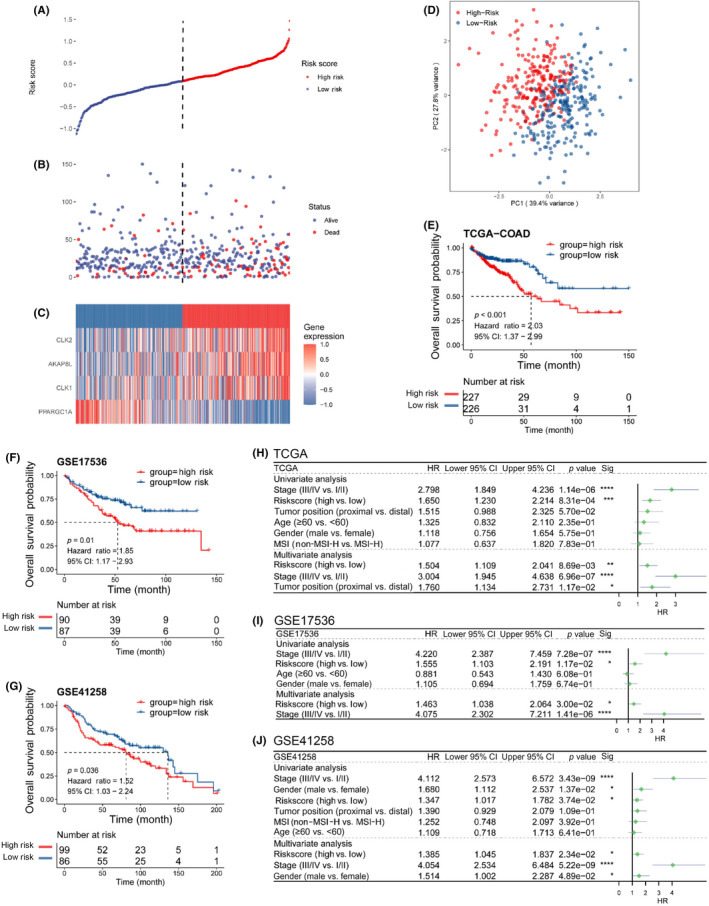
Construction and evaluation of the risk model in The Cancer Genome Atlas (TCGA) cohort and external validation in GSE17536 and GSE41258 datasets. (A) Risk score distribution of colon cancer patients in the TCGA cohort. (B) Overall survival (OS) and survival status (red dots indicate dead, blue dots indicate alive) of colon cancer patients in TCGA cohort. (C) Heatmap of the expression profiles of four genes in colon cancer patients with high‐risk and low‐risk scores in the TCGA cohort. (D) Principal component (PC) analysis shows that the sample discrimination was favorable between the high‐risk and low‐risk groups. (E) Kaplan–Meier curves of the OS for colon cancer patients with high‐risk and low‐risk scores in the TCGA cohort. (F) Kaplan–Meier curves of OS for colon cancer patients with high‐risk and low‐risk scores in the GSE17536 validation cohort. (G) Kaplan–Meier curves of OS for colon cancer patients with high‐risk and low‐risk scores in the GSE41258 validation cohort. (H–J) Univariate and multivariate Cox regression of OS in the (H) TCGA cohort and (I) GSE17536 and (J) GSE41258 validation cohorts. CI, confidence interval; COAD, colon adenocarcinoma; HR, hazard ratio
TABLE 2.
Clinical characteristics between high‐risk and low‐risk score groups in The Cancer Genome Atlas cohort of colon cancer patients
| High risk | Low risk | p value | |
|---|---|---|---|
| N = 227 | N = 226 | ||
| Age (years) | |||
| <60 | 64 (28.2) | 61 (27.0) | 0.856 |
| ≥60 | 163 (71.8) | 165 (73.0) | |
| Gender | |||
| Female | 108 (47.6) | 106 (46.9) | 0.960 |
| Male | 119 (52.4) | 120 (53.1) | |
| Tumor position | |||
| Distal | 92 (40.5) | 85 (37.6) | 0.436 |
| Proximal | 125 (55.1) | 135 (59.7) | |
| Unknown | 10 (4.41) | 6 (2.65) | |
| Stage | |||
| I/II | 110 (48.5) | 141 (62.4) | 0.008 |
| III/IV | 110 (48.5) | 82 (36.3) | |
| Unknown | 7 (3.08) | 3 (1.33) | |
| MSI | |||
| MSI‐H | 31 (13.7) | 47 (20.8) | 0.129 |
| Non‐MSI‐H | 184 (81.1) | 167 (73.9) | |
| Unknown | 12 (5.29) | 12 (5.31) | |
| RAS | |||
| MUT | 97 (42.7) | 94 (41.6) | 0.436 |
| WT | 105 (46.3) | 98 (43.4) | |
| Unknown | 25 (11.0) | 34 (15.0) | |
| BRAF | |||
| MUT | 24 (10.6) | 35 (15.5) | 0.094 |
| WT | 178 (78.4) | 157 (69.5) | |
| Unknown | 25 (11.0) | 34 (15.0) | |
Note: Data are shown as n (%).
Abbreviations: MSI, microsatellite instability; MSI‐H, MSI‐high; MUT, mutant.
3.3. Clinical prognostic value of the risk model
The KM analysis of risk score was further stratified by various clinical factors in the TCGA cohort. Among the subgroups of patients aged ≥60 years or <60 years, the high‐risk score was associated with poor prognosis, with p values of 0.034 and 0.001, respectively (Figure 3A,B). The patients were divided according to the tumor position, proximal colon and distal colon; the proximal colon includes the cecum and ascending and transverse colon, and the distal colon includes the descending and sigmoid colon. For patients with tumors in the proximal position, the prognosis was worse in high‐risk score patients (Figure 3C). We also observed that the high‐risk score was associated with poor survival outcome in patients with distal colon cancer, although the difference was not statistically significant (Figure 3G). High‐risk score related to poor prognosis in patients with non‐MSI (Figure 3D). In stage III/IV colon cancer patients, high‐risk score patients had a worse OS (Figure 3E). Moreover, high‐risk score predicted poor survival in male colon cancer patients (Figure 3F). The results suggested that the risk model has a good performance for clinical prognostic prediction.
FIGURE 3.
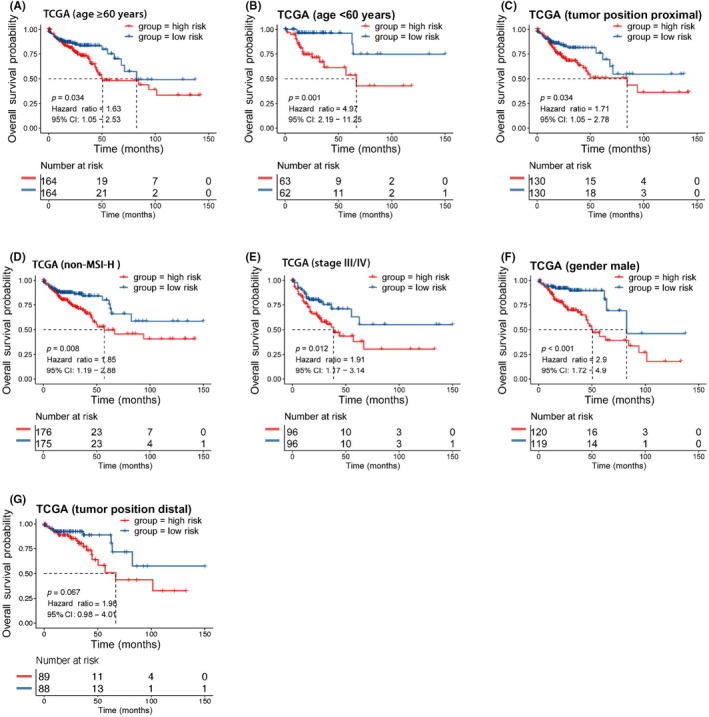
Clinical prognosis prediction of the risk model stratified by different clinical factors in The Cancer Genome Atlas (TCGA) cohort of colon cancer patients. (A) Kaplan–Meier analysis of overall survival (OS) based on the risk model in patients with age ≥60 in the TCGA cohort. (B) Kaplan–Meier analysis of OS based on the risk model in patients with age <60 years in the TCGA cohort. (C) Kaplan–Meier analysis of OS based on the risk model in patients with proximal tumor position in the TCGA cohort. (D) Kaplan–Meier analysis of OS based on the risk model in patients with non‐microsatellite instability‐high (MSI‐H) in the TCGA cohort. (E) Kaplan–Meier analysis of OS based on the risk model in patients with stage III/IV disease in the TCGA cohort. (F) Kaplan–Meier analysis of OS based on the risk model in male patients in the TCGA cohort. (G) Kaplan–Meier analysis of the OS time based on the risk model in patients with distal tumor position in the TCGA cohort. CI, confidence interval
3.4. Functional process and pathway enrichment analysis in high‐risk and low‐risk groups
In order to further analyze the functional processes and pathways significantly enriched in the high‐risk and low‐risk groups, functional enrichment analyses were carried out. Gene Ontology enrichment analysis showed that the top GO terms were mainly concentrated in immune‐related functions in the low‐risk group. The top GO terms included Fc receptor signaling pathway, Fc receptor mediated stimulatory signaling pathway, and immune response‐regulating cell surface receptor signaling pathway in biological processes, endosome membrane, mitochondrial matrix, and vacuolar membrane in cell components, and antigen binding, cofactor binding, and coenzyme binding in molecular function (Figure 4A). RNA splicing and epigenetic regulation associated pathways were enriched in the high‐risk group. The top GO terms in high‐risk group included mRNA processing, RNA splicing, and covalent chromatin modification in biological processes, microtubule organizing center part, nuclear speck, and centriole in cell components, and modification‐dependent protein binding, methyltransferase activity, and chromatin binding in molecular functions (Figure 4B). Moreover, KEGG analysis identified that the immune response related pathways were activated in the low‐risk group when compared to the high‐risk group, while the RNA splicing related pathways were suppressed (Figure 4C). The chemokine signaling pathway, NOD‐like receptor signaling pathway, and Toll‐like receptor signaling pathway were the three immune‐related pathways significantly enriched in the low‐risk group compared to the high‐risk group (Figure 4D).
FIGURE 4.
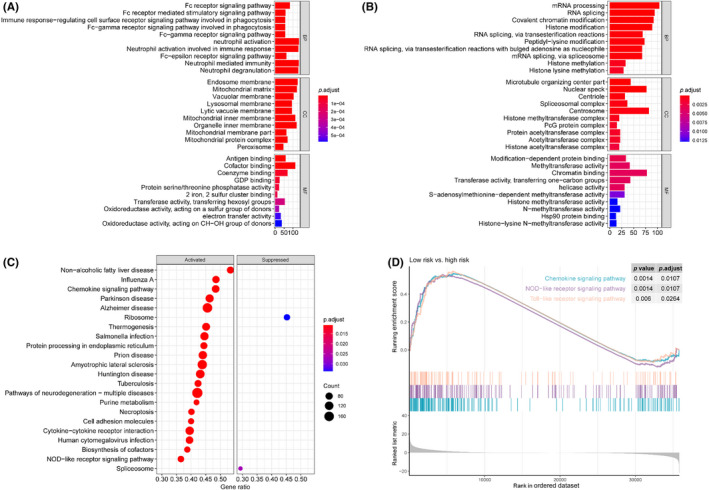
Functional enrichment analysis based on the prognostic risk model for colon cancer. (A) Gene Ontology (GO) enrichment analysis of upregulated genes in the low‐risk group. (B) GO enrichment analysis of upregulated genes in the high‐risk group. (C) Kyoto Encyclopedia of Genes and Genomes (KEGG) pathway enrichment analysis of low‐risk versus high‐risk groups. (D) KEGG pathway enrichment analysis results showing the immune‐related pathways
3.5. Tumor microenvironment analysis between high‐risk and low‐risk groups
As the functional enrichment analysis suggested that immune‐related functions and pathways were enriched in patients with low‐risk scores, we wanted to further analyze whether there were differences in the TME and the types of infiltrated immune cells between the high‐risk and low‐risk groups. Based on the ESTIMATE method, the immune score and stromal score were calculated between the high‐risk and low‐risk groups. We found that the immune score of the low‐risk group was higher than that of the high‐risk group, and there was no significant difference in the stromal scores between the two groups (Figure 5A). Then we further analyzed the levels of 28 types of tumor infiltrating immune cells between the high‐ and low‐risk groups. We found that the low‐risk group had more immune cell infiltration than the high‐risk group (Figure 5B), including activated CD4 T cells, activated CD8 T cells, and activated dendritic cells. Moreover, the TME related signatures analysis revealed that CD8 T cell effector and immune checkpoint associated pathway genes were higher in the low‐risk group than in the high‐risk group (Figure 5C). Previous studies revealed that colon adenocarcinoma patients with a higher immune score and more infiltration of antitumor immune cells have a better survival outcome. 17 , 18 , 19 Therefore, we speculated that the better prognosis of the low‐risk group might be related to the more favorable antitumor immune microenvironment.
FIGURE 5.
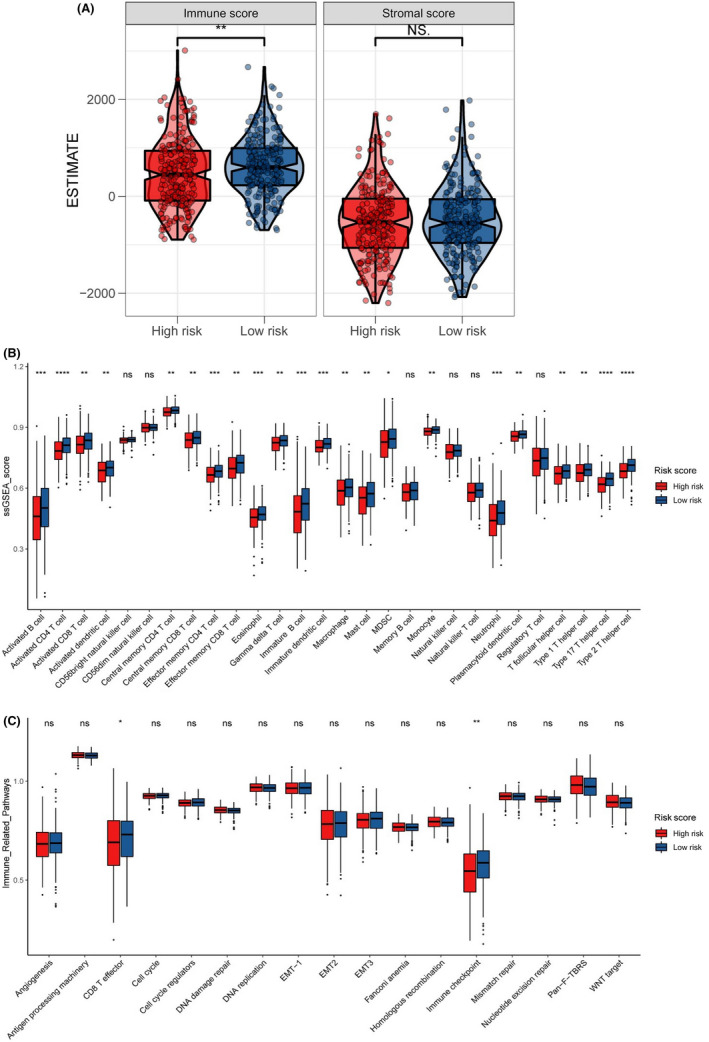
Tumor microenvironment analysis of the prognostic risk model for colon cancer. (A) Immune score and stromal score analyses in low‐risk and high‐risk groups. (B) Level of tumor‐infiltrating immune cells in the two groups, including 28 kinds of different types of immune cells. (C) Tumor microenvironment‐related signature analysis between low‐risk and high‐risk groups. *p < 0.05, **p < 0.01, ***p < 0.001, ****p < 0.0001. ns, not significant; ssGSEA, single‐sample Gene Set Enrichment Analysis
3.6. Validation of four genes in clinical colon cancer tissue samples and cancer cell lines
The ROC curve analysis was used to assess the specificity and sensitivity of the four genes for colon cancer diagnosis. We found that AKAP8L, PPARGC1A, CLK2, and CLK1 achieved an area under the ROC curve value of >0.75, indicating a high specificity and sensitivity (Figure 6A–D). Furthermore, survival analysis of the four RNA splicing associated DEGs was carried out in the TCGA dataset by KM curve. High expression of AKAP8L, CLK1, and CLK2 and low expression of PPARGC1A was significantly associated with poor prognosis in colon cancer (Figure 6E–H). We next validated the expression pattern of CLK1, CLK2, AKAP8L, and PPARGC1A in clinical colon cancer samples and cell lines. The results of quantitative RT‐PCR showed that CLK1, CLK2, and AKAP8L were highly expressed and PPARGC1A was expressed at low levels in colon cancer tissues compared to adjacent normal tissues, which is in accordance with the results of bioinformatics analysis (Figure 7A–D). Moreover, the expression levels of CLK2 and AKAP8L were significantly higher in liver metastatic tissues than in primary colon cancer tissues, whereas the expression levels of CLK1 and PPARGC1A showed no significant difference between primary and metastasis samples (Figure 7E–H). We also detected the mRNA expression of CLK1, CLK2, AKAP8L, and PPARGC1A in normal colonic epithelial cell line NCM460 and a panel of colon cancer cell lines. We found that CLK1, CLK2, and AKAP8L were higher and PPARGC1A was lower in colon cancer cell lines compared to NCM460 (Figure 7I–L). We further evaluated the protein expression level of the four genes by IHC assay in 36 paired colon cancer tissues and liver metastatic tissues (Figure 8A). The protein levels of CLK1, CLK2, and AKAP8L were also higher in colon cancer tissues than in adjacent normal tissues, which was in accordance with the mRNA expression level (Figure 8B–D). Additionally, CLK1 had a higher expression level in liver metastatic tissues than in tumor tissues. However, the expression levels of CLK2 and AKAP8L had no significant difference between colon cancer tissues and corresponding liver metastatic tissues. The PPARGC1A protein expression was low in both adjacent normal tissues and colon cancer tissues, but had a relative higher level in liver metastatic tissues (Figure 8E).
FIGURE 6.
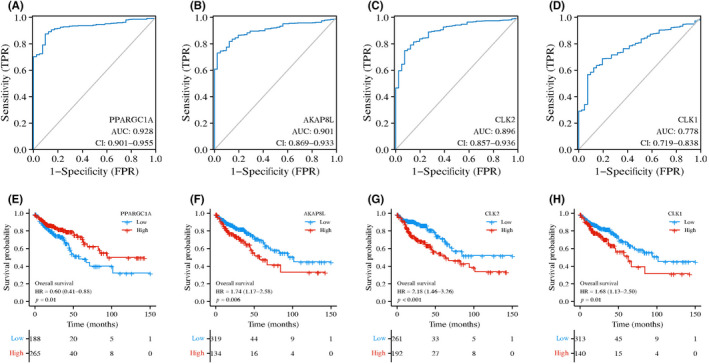
Receiver operating characteristic (ROC) curves and Kaplan–Meier survival curves of overall survival (OS) time of colon cancer patients and four genes. (A–D) ROC analysis of the four key RNA splicing regulator related genes in discrimination of normal and colon cancer patients, all with an area under the ROC curve (AUC) value of >0.75. (E–H) Kaplan–Meier survival curves of OS time for colon cancer patients with high and low expression of indicated RNA splicing‐related genes in The Cancer Genome Atlas dataset. CI, confidence interval; FPR, false positive rate; HR, hazard ratio; TPR, true positive rate
FIGURE 7.
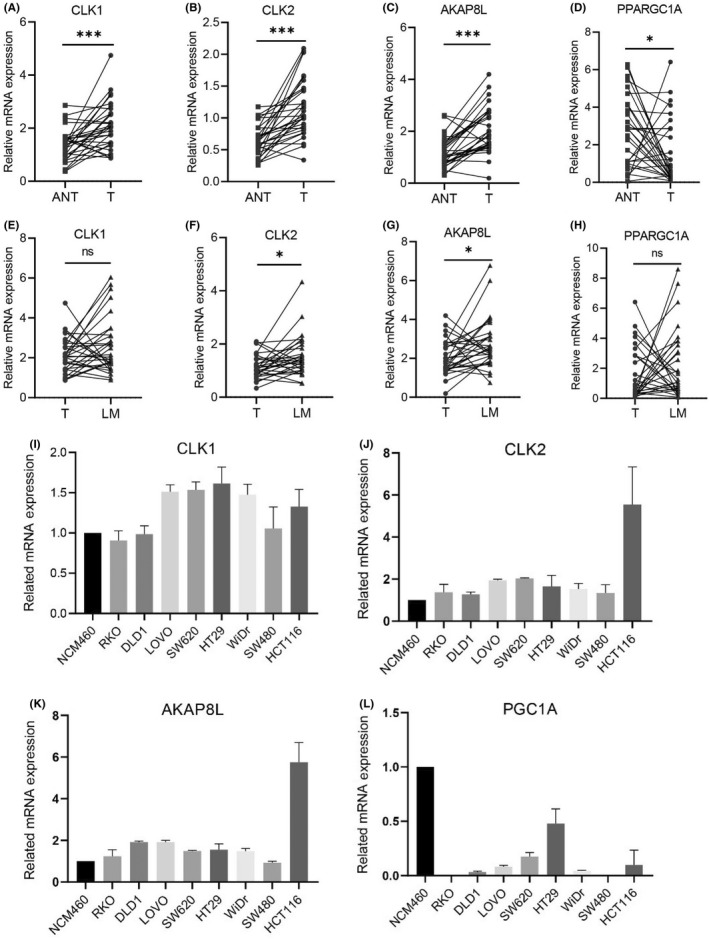
mRNA expression levels of CLK1, CLK2, AKAP8L, and PPARGC1A in colon cancer patient sample and cell lines. (A–D) mRNA expression of CLK1, CLK2, AKAP8L, and PPARGC1A in 30 paired colon cancer tissues (T) and adjacent normal tissues (ANT) by quantitative PCR (qPCR) analysis. (E–H) mRNA expression of CLK1, CLK2, AKAP8L, and PPARGC1A in 30 paired colon cancer tissues (T) and liver metastatic tissues (LM) by qPCR analysis. (I–L) CLK1, CLK2, AKAP8L, and PPARGC1A relative mRNA expression in normal colonic epithelial cell lines and colon cancer cell lines. Data in (A–H) are presented as mean ± SD. *p < 0.05, ***p < 0.001 (Student's t‐test)
FIGURE 8.
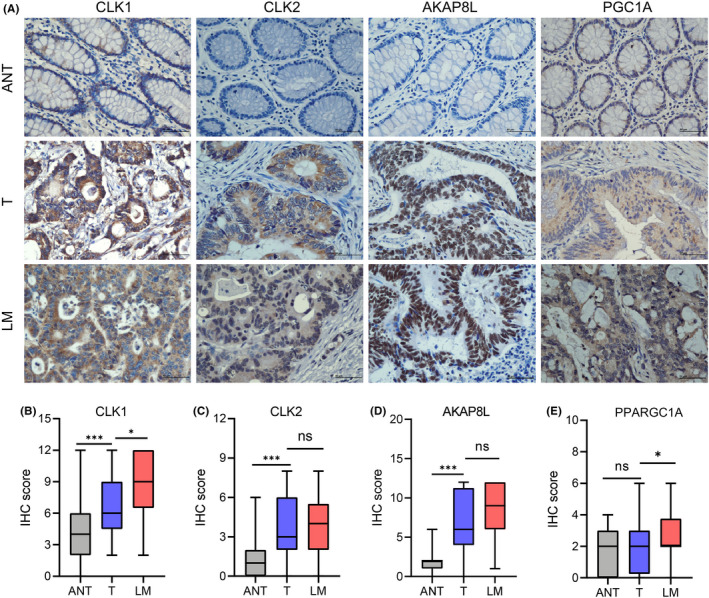
Expression of CLK1, CLK2, AKAP8L, and PPARGC1A was validated by immunohistochemical (IHC) staining in colon cancer and liver metastatic tissues. (A) Representative images showing IHC staining results of CLK1, CLK2, AKAP8L, and PPARGC1A in colon cancer adjacent normal tissues (ANT), colon cancer tissues (T), and liver metastatic tissues (LM) (scale bar, 50 μm). (B–E) IHC staining scores analysis of CLK1, CLK2, AKAP8L, and PPARGC1A in colon cancer tissues (T) versus adjacent normal tissues (ANT) and liver metastatic tissues (LM) (n = 36). Data are presented as mean ± SD. *p < 0.05, ***p < 0.001 (Student's t‐test). ns, not significant
3.7. AKAP8L promotes colon cancer cell proliferation, migration, and invasion
Among the four RNA splicing associated genes in this risk model, the biological role of AKAP8L in colon cancer tumorigenesis and development remains unclear. In order to test whether AKAP8L plays a biological role in colon cancer, we first detected the basal protein expression level of AKAP8L in a normal colonic epithelial cell line NCM460 and a panel of colon cancer cell lines. The result showed that SW620, LOVO, DLD1, and HCT‐116 had higher AKAP8L levels than NCM460 cells (Figure 9A). We then stably knocked down AKAP8L in HCT‐116 and DLD1 cells with high basal levels of AKAP8L (Figure 9B). When AKAP8L was knocked down, the cell proliferation capacity was inhibited in HCT‐116 and DLD1 cell lines (Figure 9C). Colony formation assay revealed that the colony numbers were significantly decreased in the AKAP8L knockdown cells (Figure 9D). In addition, migration and invasion assays showed that loss of AKAP8L could suppress the motility and invasive ability of HCT‐116 and DLD1 cells (Figure 9E,F). Furthermore, we constructed AKAP8L overexpression plasmid and control vector plasmid, and transfected SW480 cells with relatively low expression of AKAP8L (Figure 9G). We found that the proliferation rate of SW480 cells overexpressing AKAP8L was only slightly increased compared with the control group, but its migration and invasion ability was significantly enhanced (Figure 9H,I). In addition, we carried out in vivo experiments to verify the oncogenic function of AKAP8L. We constructed a subcutaneous xenograft tumor model in nude mice with AKAP8L‐knockdown or control HCT116 cells and DLD1 cells. We found that stable knockdown of AKA8PL could remarkably delay the tumor growth both in the HCT116 model and DLD1 model (Figure 10A,C). At the end of the animal experiment, the tumors were collected and weighed. The tumor weights of the AKAP8L knockdown group were lower than that of the control group (Figure 10B–F). Consistently, the proliferative cells in the xenografts were significantly decreased in the AKA8PL knockdown groups compared with the control group by Ki‐67 staining (Figure 10G,H). Taken together, these results suggest that AKAP8L plays an oncogenic role in colon cancer, and high expression of AKAP8L could promote the proliferation and metastasis of colon cancer cells.
FIGURE 9.
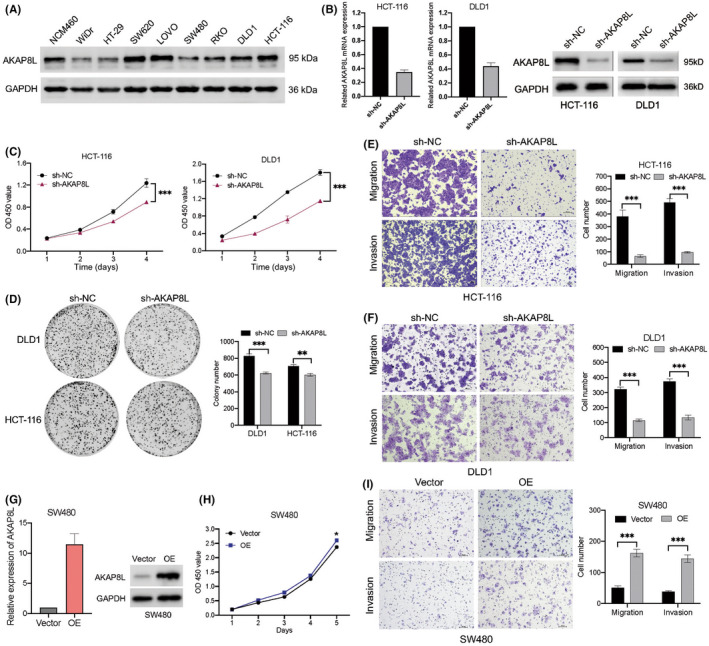
AKAP8L promotes colon cancer cell growth, migration, and invasion. (A) Basic protein expression of AKAP8L in normal colonic epithelial cell lines and colon cancer cell lines detected by western blot. GAPDH serve as the loading control. (B) mRNA and protein levels of AKAP8L in HCT‐116 and DLD1 cells with control vector (sh‐NC) or sh‐AKAP8L were evaluated by quantitative PCR and western blot. (C) Cell growth in HCT‐116 and DLD1 cells with sh‐NC or sh‐AKAP8L was determined by CCK‐8 assay. (D) Left, representative images of cell colonies stained with crystal violet in HCT‐116 and DLD1 cells with sh‐NC or sh‐AKAP8L. Right, numbers of colonies as mean ± SD from three independent experiments. (E,F) Left, representative images of migrated cells in migration and invasion assays were stained with crystal violet in HCT‐116 cells with sh‐NC or sh‐AKAP8L. Right, numbers of cells as mean ± SD from three independent experiments. (G) mRNA and protein levels of AKAP8L in SW480 cells transfected with sh‐NC or AKAP8L overexpression (OE) vector. (H) Cell growth in SW480 cells with vector or AKAP8L‐OE determined by CCK‐8 assay. (I) Representative images and statistic graph of migrated cells in migration and invasion assays in in SW480 cells with vector or AKAP8L‐OE. Data are presented as mean ± SD. **p < 0.01, ***p < 0.001 (Student's t‐test). OD, optical density
FIGURE 10.
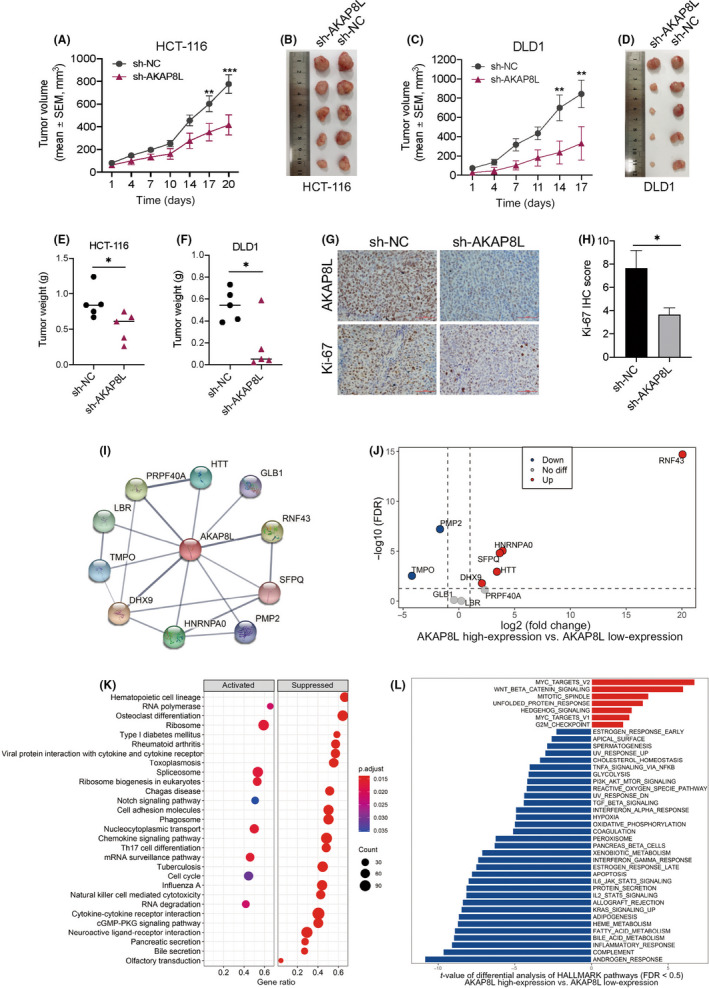
Knockdown of AKAP8L inhibits colon tumor growth in vivo. (A,C) Tumor volumes growth curve of HCT‐116 and DLD1 xenografts with control vector (sh‐NC) or sh‐AKAP8L. Data are shown as mean ± SEM of five mice in each group. Statistical analyses were carried out using two‐way ANOVA. **p < 0.01, ***p < 0.001. (B–F) Tumor images and weight of tumors harvested at the end of the experiment; statistical analyses were carried out using the Mann–Whitney test. *p < 0.05. (G,H) Representative images and statistical graph showing the immunohistochemical staining of Ki‐67 in HCT‐116 xenograft with sh‐NC or sh‐AKAP8L. Statistical analyses were carried out using Student's t‐test. *p < 0.05. (I) Protein–protein interaction network downloaded from the STRING database indicated all the possible intersections between AKAP8L and other proteins (confidence = 0.4). (J) Differential mRNA expression of genes that may interact with AKAP8L at the protein level between the AKAP8L high‐expression and AKAP8L low‐expression subgroups in The Cancer Genome Atlas (TCGA) cohort. (K) Kyoto Encyclopedia of Genes and Genomes Gene Set Enrichment Analysis of the AKAP8L high‐expression versus AKAP8L low‐expression subgroups in the TCGA cohort (false discovery rate [FDR] <0.05). (L) Differential analysis of Gene Set Variation Analysis scores of HALLMARK pathways between the AKAP8L high‐expression and AKAP8L low‐expression subgroups in the TCGA cohort (FDR < 0.05)
3.8. Potential genes that interact with AKAP8L and relevant pathway analysis
To better explore the potential genes that intersect with AKAP8L at the protein level, we generated a PPI network functional enrichment analysis based on AKAP8L using the STRING data portal. The results showed that 10 genes had interaction with AKAP8L at the protein level (Figure 10I). We next divided the samples in the TCGA cohort into two groups according to the median value of AKAP8L mRNA, and then analyzed the expression of the 10 genes between the AKAP8L high‐expression and AKAP8L low‐expression subgroups. The RNF43 expression level was upregulated most significantly (Figure 10J). In addition, the GSEA analysis of KEGG pathways indicated the change of relevant pathways between the AKAP8L high‐expression group versus the AKAP8L low‐expression groups (Figure 10K). We also used Gene Set Variation Analysis to assign activity estimates of 50 HALLMARLK cancer‐related pathways between the AKAP8L high‐expression and AKAP8L low‐expression subgroups. We found that the MYC and WNT/β‐catenin signaling pathways were significantly activated in the AKAP8L high‐expression group (Figure 10L).
4. DISCUSSION
We constructed a prognostic risk model based on four genes associated with RNA splicing regulation in the TCGA colon cancer dataset. The prognostic risk model was further validated in two GEO datasets. The expression profile of four RNA splicing regulators was further evaluated in clinical patient samples. The prognostic risk model was confirmed to be an independent prognostic factor in multivariable analyses for colon cancer. We also determined that AKAP8L could promote colon cancer cell proliferation and migration through in vitro experiments.
In our risk score, PPARGC1A is associated with a favorable survival outcome and CLK1, CLK2, and AKAP8L with an unfavorable survival outcome. CLK1 and CLK2 are members of the evolutionarily conserved CLK family, which play an important biological role in pre‐mRNA splicing by regulating SR protein. CLK1 can promote gastric cancer development by regulating the splicing processes and can act as a potential target for gastric cancer treatment. 20 Other studies have found that CLK1 undergoes abnormal splicing events with an inclusion of exon 4 in CRC, which in turn affects its function as a splicing factor kinase, and then negatively regulates its downstream alternative splicing events. 21 Previous studies have found that CLK2 is an important oncogene kinase and splicing regulator in breast cancer, and knockdown of CLK2 can significantly inhibit the proliferation and migration of breast cancer cells. 22 , 23 Our study found that both CLK1 and CLK2 had higher expression levels in colon cancer, which predicted poor OS. We also tested the protein and mRNA levels of CLK1 and CLK2 in patient samples of colon cancer and obtained results consistent with the bioinformatic analysis.
Encoding protein of A‐kinase anchor protein 8‐like, AKAP8L, also named HA95 (homologous to AKAP95), 24 is involved in many biological processes, such as G2/M phase transformation, mRNA processing, RNA splicing regulation, and histone phosphorylation regulation. 25 , 26 A recent study found that the N‐terminal region of AKAP8L binds to mTORC1 in the cytoplasm, which plays an important role in mTORC1's regulation of cell growth. 27 However, AKAP8L has been less studied in tumor, and the biological function of AKAP8L in colon cancer is still unknown. Our results showed that AKAP8L has higher expression level in colon cancer and liver metastatic tissue. Higher levels of AKAP8L were associated with poor survival in colon cancer according to the TCGA data. We also found that knockdown of AKAP8L could inhibit colon cancer cell growth both in vitro and in vivo. Furthermore, we found 10 genes that interacted with AKAP8L at the protein level through the PPI analysis. Among the 10 genes, the difference in RNF43 expression level was most obvious between the AKAP8L high‐expression and AKAP8L low‐expression groups. RNF43 encodes a RING finger protein with ubiquitin ligase activity, which has been reported to be overexpressed in CRC and to play a crucial role in the pathogenesis of CRC. 28 , 29 , 30 A previous study has reported that AKAP8L is an RNF43‐interacting protein but might not be the substrate of RNF43 ubiquitin ligase. 31 However, the regulatory relationship between AKAP8L and RNF43 remain unclear. Furthermore, we found that MYC and WNT/β‐catenin signaling pathways, which are associated with prompting colon cancer development and progression, were upregulated in the AKAP8L high‐expression group. Therefore, we speculate that AKAP8L might play a role in promoting colon cancer development. However, further studies are needed to uncover the molecular mechanism of AKAP8L in mediating tumor development.
PPARGC1A encodes PGC1α protein, which can maintain mitochondrial activity, resistance to oxidative stress, and support cellular survival. In BRAF (V600E) mutated melanoma cells, PGC1α can support the survival of melanoma cells even in the presence of BRAF inhibitor, but PGC1α can also inhibit tumor metastasis. 32 The potential mechanism of inhibition of this invasive phenotype is related to activation of the ID2/TCF4 axis and increased downstream integrin expression. 33 BRAF mutations also occur in 8%–12% of advanced CRC patients, with V600E being the most common mutation locus. 34 , 35 In different types of tumor, the function of PGC1α can range from tumor inhibition to tumor growth promotion. Some studies have reported that PGC1α can promote the metastasis of breast cancer, pancreatic cancer, gastric cancer, and cholangiocarcinoma. 36 , 37 , 38 , 39 However, other studies have found that PGC1α could inhibit tumor aggressiveness in prostate cancer, renal carcinoma, and melanoma. 33 , 40 , 41 , 42 Some studies revealed that overexpression of PGC1α resulted in the progression and therapy resistance of colon cancer, 43 , 44 , 45 whereas others found that lower expression levels of PGC1α were associated with colon cancer progression. 46 , 47 In our study, we found that high mRNA levels of PGC1α were associated with better prognosis in colon cancer from TCGA data. However, the protein level of PGC1α was higher in liver metastases than in adjacent normal tissue and primary tumors by IHC assay. These differential expression profiles of PGC1α in primary tumor and metastasis suggest that PGC1α expression and activity are differentially regulated depending on the tumor site. The number of colon cancer tissue samples used in our study is also limited. We hope to further expand the sample size in future studies to detect the differential expression of PGC1α in colorectal cancer and liver metastasis, and further explore its role and mechanism.
The GO enrichment analysis indicated that immune‐related functions were enriched in the low‐risk group, while RNA splicing, and epigenetic regulation associated pathways were enriched in the high‐risk group. In addition, we found three immune‐related pathways—the chemokine signaling pathway, NOD‐like receptor signaling pathway, and Toll‐like receptor signaling pathway—were significantly enriched in the low‐risk group compared to the high‐risk group. For further ESTIMATE analysis, the result showed that the immune score was higher in the low‐risk group than in the high‐risk group. High immune score was implicated with a better prognosis and survival outcome in previous research. CD8 T cell effector and immune checkpoint associated pathway genes were higher in the low‐risk group. These results indicated that the risk score correlated with immune status in colon cancer, and the low‐risk score had a more positive antitumor immune status. Previous studies have shown that alternative splicing plays an important role in cancer immunity. 48 , 49 , 50 , 51 The immunogenic epitope in tumor cells is constitutively spliced out, which made the tumor cells cloud not be recognized by T‐cell receptor engineered T cells. 7 Therefore, whether the risk score could complement with immune score to better evaluate the efficacy and prognosis of immunotherapy still needs more in‐depth analysis.
Our study still has some limitations. First, the number of patient samples used to verify the expression of the four splicing factor genes was small. Therefore, the prediction efficiency of the risk model needs further verification in a large patient sample cohort. Second, we did not analyze the abnormal alternative splicing events related to the four splicing factor genes. Third, the ratios of stage I to II and that of stage III to IV in the TCGA cohort were slightly different from those in the GSE41258 and GSE17536 cohorts, but did not affect the analysis results between the TCGA cohort and GSE41258 and GSE17536 cohorts. In addition, the biological function and mechanism of these four genes in the occurrence and development of colon cancer still needs further investigation in future studies.
AUTHOR CONTRIBUTIONS
QYL, TD, and ZGC: development of methodology, analysis, and interpretation of data. DJY, MZQ, and LZ: study concept and design and drafting of the manuscript. JHP, JS, and WTP: data collecting, analysis, and interpretation. JYQ and FL: in vitro cell functional experiments. FTL and LQY: western blot and immunohistochemistry. ZFX and YTS: critical revision of the manuscript for important intellectual content and administrative support.
Funding information
National Natural Science Foundation of China, Grant/Award Number: 82073377, 82003268, 81772587; Natural Science Foundation of Guangdong, Grant/Award Number: 2021A1515012439; Science and Technology Program of Guangdong, Grant/Award Number: 2019B020227002.
CONFLICT OF INTEREST
The authors have no conflict of interest.
DATA AVAILABILITY STATEMNET
The key raw data have been deposited into the Research Data Deposit (http://www.researchdata.org.cn) with Approval Number RDDB2022765627. The datasets used in this study are publicly available.
ETHICS STATEMENT
The studies involving human participants were reviewed and approved by the Ethics Committee of The Sun Yat‐Sen University Cancer Center. The participants provided their written informed consent to participate in this study. All animal experiments were performed under the guidance of Sun Yat‐Sen University Committee for Use and Care of Laboratory Animals and were approved by the animal experimentation ethics.
CONSENT FOR PUBLICATION
All the authors have read and approved the manuscript.
Supporting information
Tables S1–S8
Appendix S1
ACKNOWLEDGMENTS
This study was supported by the National Natural Science Foundation of China (NSFC 82073377, 82003268, and 81772587), Natural Science Foundation of Guangdong (2021A1515012439), and Science and Technology Program of Guangdong (2019B020227002).
Luo Q‐Y, Di T, Chen Z‐G, et al. Novel prognostic model predicts overall survival in colon cancer based on RNA splicing regulation gene expression. Cancer Sci. 2022;113:3330‐3346. doi: 10.1111/cas.15480
Qiu‐Yun Luo, Tian Di, and Zhi‐Gang Chen contributed equally to the manuscript.
Contributor Information
Lin Zhang, Email: zhanglin@sysucc.org.cn.
Miao‐Zhen Qiu, Email: qiumzh@sysucc.org.cn.
Da‐Jun Yang, Email: yangdj@sysucc.org.cn.
REFERENCES
- 1. Sung H, Ferlay J, Siegel RL, et al. Global cancer statistics 2020: GLOBOCAN estimates of incidence and mortality worldwide for 36 cancers in 185 countries. CA Cancer J Clin. 2021;71:209‐249. [DOI] [PubMed] [Google Scholar]
- 2. Feng RM, Zong YN, Cao SM, Xu RH. Current cancer situation in China: good or bad news from the 2018 global cancer statistics? Cancer Commun (Lond). 2019;39(1):22. [DOI] [PMC free article] [PubMed] [Google Scholar]
- 3. Wu C, Li M, Meng H, et al. Analysis of status and countermeasures of cancer incidence and mortality in China. Sci China Life Sci. 2019;62(5):640‐647. [DOI] [PubMed] [Google Scholar]
- 4. Siegel RL, Miller KD, Goding Sauer A, et al. Colorectal cancer statistics, 2020. CA Cancer J Clin. 2020;70(3):145‐164. [DOI] [PubMed] [Google Scholar]
- 5. Ule J, Blencowe BJ. Alternative splicing regulatory networks: functions, mechanisms, and evolution. Mol Cell. 2019;76(2):329‐345. [DOI] [PubMed] [Google Scholar]
- 6. Sveen A, Kilpinen S, Ruusulehto A, Lothe RA, Skotheim RI. Aberrant RNA splicing in cancer; expression changes and driver mutations of splicing factor genes. Oncogene. 2016;35(19):2413‐2427. [DOI] [PubMed] [Google Scholar]
- 7. Frankiw L, Baltimore D, Li G. Alternative mRNA splicing in cancer immunotherapy. Nat Rev Immunol. 2019;19(11):675‐687. [DOI] [PubMed] [Google Scholar]
- 8. David CJ, Chen M, Assanah M, Canoll P, Manley JL. HnRNP proteins controlled by c‐Myc deregulate pyruvate kinase mRNA splicing in cancer. Nature. 2010;463(7279):364‐368. [DOI] [PMC free article] [PubMed] [Google Scholar]
- 9. Miwa T, Nagata T, Kojima H, Sekine S, Okumura T. Isoform switch of CD44 induces different chemotactic and tumorigenic ability in gallbladder cancer. Int J Oncol. 2017;51(3):771‐780. [DOI] [PMC free article] [PubMed] [Google Scholar]
- 10. Bhattacharya R, Mitra T, Ray Chaudhuri S, Roy SS. Mesenchymal splice isoform of CD44 (CD44s) promotes EMT/invasion and imparts stem‐like properties to ovarian cancer cells. J Cell Biochem. 2018;119(4):3373‐3383. [DOI] [PubMed] [Google Scholar]
- 11. Brown RL, Reinke LM, Damerow MS, et al. CD44 splice isoform switching in human and mouse epithelium is essential for epithelial‐mesenchymal transition and breast cancer progression. J Clin Invest. 2011;121(3):1064‐1074. [DOI] [PMC free article] [PubMed] [Google Scholar]
- 12. Sakuma K, Sasaki E, Kimura K, et al. HNRNPLL, a newly identified colorectal cancer metastasis suppressor, modulates alternative splicing of CD44 during epithelial‐mesenchymal transition. Gut. 2018;67(6):1103‐1111. [DOI] [PubMed] [Google Scholar]
- 13. Wang J, Wang C, Li L, et al. Alternative splicing: an important regulatory mechanism in colorectal carcinoma. Mol Carcinog. 2021;60(4):279‐293. [DOI] [PubMed] [Google Scholar]
- 14. Liu Z, Rabadan R. Computing the role of alternative splicing in cancer. Trends Cancer. 2021;7:347‐358. [DOI] [PMC free article] [PubMed] [Google Scholar]
- 15. Anczukow O, Krainer AR. Splicing‐factor alterations in cancers. RNA. 2016;22(9):1285‐1301. [DOI] [PMC free article] [PubMed] [Google Scholar]
- 16. Urbanski LM, Leclair N, Anczukow O. Alternative‐splicing defects in cancer: splicing regulators and their downstream targets, guiding the way to novel cancer therapeutics. Wiley Interdiscip Rev RNA. 2018;9(4):e1476. [DOI] [PMC free article] [PubMed] [Google Scholar]
- 17. Tong Y, Peng M, Li J, Niu Y. Comprehensive analyses of stromal‐immune score‐related competing endogenous RNA networks in colon adenocarcinoma. Dis Markers. 2022;2022:4235305. [DOI] [PMC free article] [PubMed] [Google Scholar]
- 18. Tan Y, Lu L, Liang X, Chen Y. Identification of a pyroptosis‐related lncRNA risk model for predicting prognosis and immune response in colon adenocarcinoma. World J Surg Oncol. 2022;20(1):118. [DOI] [PMC free article] [PubMed] [Google Scholar]
- 19. He R, Zhang M, He L, et al. Integrated analysis of necroptosis‐related genes for prognosis, immune microenvironment infiltration, and drug sensitivity in colon cancer. Front Med (Lausanne). 2022;9:845271. [DOI] [PMC free article] [PubMed] [Google Scholar]
- 20. Babu N, Pinto SM, Biswas M, et al. Phosphoproteomic analysis identifies CLK1 as a novel therapeutic target in gastric cancer. Gastric Cancer. 2020;23(5):796‐810. [DOI] [PubMed] [Google Scholar]
- 21. Lian H, Wang A, Shen Y, et al. Identification of novel alternative splicing isoform biomarkers and their association with overall survival in colorectal cancer. BMC Gastroenterol. 2020;20(1):171. [DOI] [PMC free article] [PubMed] [Google Scholar]
- 22. Yoshida T, Kim JH, Carver K, et al. CLK2 is an oncogenic kinase and splicing regulator in breast cancer. Cancer Res. 2015;75(7):1516‐1526. [DOI] [PubMed] [Google Scholar]
- 23. Iwai K, Yaguchi M, Nishimura K, et al. Anti‐tumor efficacy of a novel CLK inhibitor via targeting RNA splicing and MYC‐dependent vulnerability. EMBO Mol Med. 2018;10(6):e8289. [DOI] [PMC free article] [PubMed] [Google Scholar]
- 24. Orstavik S, Eide T, Collas P, et al. Identification, cloning and characterization of a novel nuclear protein, HA95, homologous to A‐kinase anchoring protein 95. Biol Cell. 2000;92(1):27‐37. [DOI] [PubMed] [Google Scholar]
- 25. Kvissel AK, Orstavik S, Eikvar S, et al. Involvement of the catalytic subunit of protein kinase a and of HA95 in pre‐mRNA splicing. Exp Cell Res. 2007;313(13):2795‐2809. [DOI] [PubMed] [Google Scholar]
- 26. Li Y, Kao GD, Garcia BA, et al. A novel histone deacetylase pathway regulates mitosis by modulating Aurora B kinase activity. Genes Dev. 2006;20(18):2566‐2579. [DOI] [PMC free article] [PubMed] [Google Scholar]
- 27. Melick CH, Meng D, Jewell JL. A‐kinase anchoring protein 8L interacts with mTORC1 and promotes cell growth. J Biol Chem. 2020;295(23):8096‐8105. [DOI] [PMC free article] [PubMed] [Google Scholar]
- 28. Yagyu R, Furukawa Y, Lin YM, Shimokawa T, Yamamura T, Nakamura Y. A novel oncoprotein RNF43 functions in an autocrine manner in colorectal cancer. Int J Oncol. 2004;25(5):1343‐1348. [PubMed] [Google Scholar]
- 29. Yan HHN, Lai JCW, Ho SL, et al. RNF43 germline and somatic mutation in serrated neoplasia pathway and its association with BRAF mutation. Gut. 2017;66(9):1645‐1656. [DOI] [PubMed] [Google Scholar]
- 30. Yaeger R, Chatila WK, Lipsyc MD, Hechtman JF, Cercek A, Sanchez‐Vega F, Jayakumaran G, Middha S, Zehir A, Donoghue MTA, You D, Viale A, Kemeny N, Segal NH, Stadler ZK, Varghese AM, Kundra R, Gao J, Syed A, Hyman DM, Vakiani E, Rosen N, Taylor BS, Ladanyi M, Berger MF, Solit DB, Shia J, Saltz L, Schultz N Clinical sequencing defines the genomic landscape of metastatic colorectal cancer. Cancer Cell 2018;33(1):125–136.e3. [DOI] [PMC free article] [PubMed] [Google Scholar]
- 31. Sugiura T, Yamaguchi A, Miyamoto K. A cancer‐associated RING finger protein, RNF43, is a ubiquitin ligase that interacts with a nuclear protein, HAP95. Exp Cell Res. 2008;314(7):1519‐1528. [DOI] [PubMed] [Google Scholar]
- 32. Vazquez F, Lim JH, Chim H, et al. PGC1alpha expression defines a subset of human melanoma tumors with increased mitochondrial capacity and resistance to oxidative stress. Cancer Cell. 2013;23(3):287‐301. [DOI] [PMC free article] [PubMed] [Google Scholar]
- 33. Luo C, Lim JH, Lee Y, et al. A PGC1alpha‐mediated transcriptional axis suppresses melanoma metastasis. Nature. 2016;537(7620):422‐426. [DOI] [PMC free article] [PubMed] [Google Scholar]
- 34. Benson AB, Venook AP, Al‐Hawary MM, et al. NCCN guidelines insights: colon cancer, version 2.2018. J Natl Compr Canc Netw. 2018;16(4):359‐369. [DOI] [PMC free article] [PubMed] [Google Scholar]
- 35. Tran B, Kopetz S, Tie J, et al. Impact of BRAF mutation and microsatellite instability on the pattern of metastatic spread and prognosis in metastatic colorectal cancer. Cancer. 2011;117(20):4623‐4632. [DOI] [PMC free article] [PubMed] [Google Scholar]
- 36. Dan L, Wang C, Ma P, et al. PGC1alpha promotes cholangiocarcinoma metastasis by upregulating PDHA1 and MPC1 expression to reverse the Warburg effect. Cell Death Dis. 2018;9(5):466. [DOI] [PMC free article] [PubMed] [Google Scholar]
- 37. Wang P, Guo X, Zong W, et al. PGC‐1alpha/SNAI1 axis regulates tumor growth and metastasis by targeting miR‐128b in gastric cancer. J Cell Physiol. 2019;234(10):17232‐17241. [DOI] [PubMed] [Google Scholar]
- 38. Sancho P, Burgos‐Ramos E, Tavera A, et al. MYC/PGC‐1alpha balance determines the metabolic phenotype and plasticity of pancreatic cancer stem cells. Cell Metab. 2015;22(4):590‐605. [DOI] [PubMed] [Google Scholar]
- 39. Andrzejewski S, Klimcakova E, Johnson RM, Tabariès S, Annis MG, McGuirk S, Northey JJ, Chénard V, Sriram U, Papadopoli DJ, Siegel PM, St‐Pierre J PGC‐1alpha promotes breast cancer metastasis and confers bioenergetic flexibility against metabolic drugs. Cell Metab 2017;26(5):778–787.e5. [DOI] [PubMed] [Google Scholar]
- 40. Zhuang C, Zhuang C, Luo X, et al. N6‐methyladenosine demethylase FTO suppresses clear cell renal cell carcinoma through a novel FTO‐PGC‐1alpha signalling axis. J Cell Mol Med. 2019;23(3):2163‐2173. [DOI] [PMC free article] [PubMed] [Google Scholar]
- 41. Torrano V, Valcarcel‐Jimenez L, Cortazar AR, et al. The metabolic co‐regulator PGC1alpha suppresses prostate cancer metastasis. Nat Cell Biol. 2016;18(6):645‐656. [DOI] [PMC free article] [PubMed] [Google Scholar]
- 42. Kaminski L, Torrino S, Dufies M, et al. PGC1alpha inhibits polyamine synthesis to suppress prostate cancer aggressiveness. Cancer Res. 2019;79(13):3268‐3280. [DOI] [PMC free article] [PubMed] [Google Scholar]
- 43. Witherspoon M, Sandu D, Lu C, et al. ETHE1 overexpression promotes SIRT1 and PGC1alpha mediated aerobic glycolysis, oxidative phosphorylation, mitochondrial biogenesis and colorectal cancer. Oncotarget. 2019;10(40):4004‐4017. [DOI] [PMC free article] [PubMed] [Google Scholar]
- 44. Bhalla K, Hwang BJ, Dewi RE, et al. PGC1alpha promotes tumor growth by inducing gene expression programs supporting lipogenesis. Cancer Res. 2011;71(21):6888‐6898. [DOI] [PMC free article] [PubMed] [Google Scholar]
- 45. Vellinga TT, Borovski T, de Boer VC, et al. SIRT1/PGC1alpha‐dependent increase in oxidative phosphorylation supports chemotherapy resistance of colon cancer. Clin Cancer Res. 2015;21(12):2870‐2879. [DOI] [PubMed] [Google Scholar]
- 46. D'Errico I, Lo Sasso G, Salvatore L, et al. Bax is necessary for PGC1alpha pro‐apoptotic effect in colorectal cancer cells. Cell Cycle. 2011;10(17):2937‐2945. [DOI] [PubMed] [Google Scholar]
- 47. Feilchenfeldt J, Brundler MA, Soravia C, Totsch M, Meier CA. Peroxisome proliferator‐activated receptors (PPARs) and associated transcription factors in colon cancer: reduced expression of PPARgamma‐coactivator 1 (PGC‐1). Cancer Lett. 2004;203(1):25‐33. [DOI] [PubMed] [Google Scholar]
- 48. Sotillo E, Barrett DM, Black KL, et al. Convergence of acquired mutations and alternative splicing of CD19 enables resistance to CART‐19 immunotherapy. Cancer Discov. 2015;5(12):1282‐1295. [DOI] [PMC free article] [PubMed] [Google Scholar]
- 49. Simpson TR, Li F, Montalvo‐Ortiz W, et al. Fc‐dependent depletion of tumor‐infiltrating regulatory T cells co‐defines the efficacy of anti‐CTLA‐4 therapy against melanoma. J Exp Med. 2013;210(9):1695‐1710. [DOI] [PMC free article] [PubMed] [Google Scholar]
- 50. Wang Y, Zhang H, Jiao B, et al. The roles of alternative splicing in tumor‐immune cell interactions. Curr Cancer Drug Targets. 2020;20(10):729‐740. [DOI] [PMC free article] [PubMed] [Google Scholar]
- 51. Gong B, Kiyotani K, Sakata S, et al. Secreted PD‐L1 variants mediate resistance to PD‐L1 blockade therapy in non‐small cell lung cancer. J Exp Med. 2019;216(4):982‐1000. [DOI] [PMC free article] [PubMed] [Google Scholar]
Associated Data
This section collects any data citations, data availability statements, or supplementary materials included in this article.
Supplementary Materials
Tables S1–S8
Appendix S1
Data Availability Statement
The key raw data have been deposited into the Research Data Deposit (http://www.researchdata.org.cn) with Approval Number RDDB2022765627. The datasets used in this study are publicly available.


