

Abstract
The plant defense hormone, salicylic acid (SA), plays essential roles in immunity and systemic acquired resistance. Salicylic acid induced by the pathogen is perceived by the receptor nonexpressor of pathogenesis‐related genes 1 (NPR1), which is recruited by TGA transcription factors to induce the expression of pathogenesis‐related (PR) genes. However, the mechanism by which post‐translational modifications affect TGA's transcriptional activity by salicylic acid signaling/pathogen infection is not well‐established. Here, we report that the loss‐of‐function mutant of brassinosteroid insensitive2 (BIN2) and its homologs, bin2‐3 bil1 bil2, causes impaired pathogen resistance and insensitivity to SA‐induced PR gene expression, whereas the gain‐of‐function mutant, bin2‐1, exhibited enhanced SA signaling and immunity against the pathogen. Our results demonstrate that salicylic acid activates BIN2 kinase, which in turn phosphorylates TGA3 at Ser33 to enhance TGA3 DNA binding ability and NPR1–TGA3 complex formation, leading to the activation of PR gene expression. These findings implicate BIN2 as a new component of salicylic acid signaling, functioning as a key node in balancing brassinosteroid‐mediated plant growth and SA‐induced immunity.
Keywords: BIN2, brassinosteroid, plant immunity, salicylic acid, TGA3
Subject Categories: Plant Biology
Plant pathogen response signaling via salicylic acid and brassinosteroid‐mediated stress/developmental signals are more intertwined than previously thought.
Introduction
Salicylic acid (SA) is an essential phytohormone that plays key roles in plant defense against pathogens (van Butselaar & Van den Ackerveken, 2020; Zhou & Zhang, 2020). Pathogens induce the accumulation of SA, which stimulates plant immunity (Ding & Ding, 2020). In Arabidopsis, pathogen‐induced SA is mainly synthesized through Isochorismate Synthase 1 (ICS1/SID2; Wildermuth et al, 2001); accordingly, an inability properly to synthesize SA leads to compromised systemic acquired resistance (Gaffney et al, 1993). NPR1 is a receptor and a central regulator of the SA signaling pathway. Loss of NPR1 function results in impaired SA‐induced PR gene expression (Cao et al, 1994; Delaney et al, 1995). In the presence of SA or pathogen infection, monomeric SA‐bound NPR1 is transported from the cytoplasm to the nucleus, where it interacts with members of the TGA family of a transcription factor to activate PR gene expression (Zhang et al, 1999, 2003; Despres et al, 2000; Zhou et al, 2000; Rochon et al, 2006; Kesarwani et al, 2007). Meanwhile, two other SA receptors, NPR3 and NPR4, are inhibited by SA and function with TGAs as transcriptional corepressors of SA response genes (Ding et al, 2018).
A recent study revealed that epigenetic control of SA signaling by the CBP/p300‐family of histone acyl transferases, HAC1 and HAC5 (HAC1/5), was affected by an interaction with NPR1. The resulting transcriptional complex is recruited to PR chromatin by TGAs, where it relaxes repressive local chromatin organization through H3 histone acetylation and facilitates transcription (Jin et al, 2018). As the master regulator of SA signaling, NPR1 was reported to orchestrate transcriptional reprogramming by post‐translational modifications, protein stability, and epigenetic reprogramming (Saleh et al, 2015). Despite the essential role of NPR1 in SA‐triggered transcription of PR during plant defense, the molecular mechanism of its role as a TGA's transcriptional activation remains elusive. As key downstream components of SA signaling, TGAs have not been extensively studied; therefore, the post‐translational modifications of TGAs in response to SA and the mechanism of how SA induces the binding of TGAs to their target promoters remain to be established.
In Arabidopsis, there are 10 members of the GSK3‐like protein kinase family (Jonak & Hirt, 2002; Qi et al, 2013). BIN2, the first plant GSK3‐like kinase to be discovered, controls plant morphology and BR sensitivity (Li et al, 2001; Choe et al, 2002; Li & Nam, 2002; Perez‐Perez et al, 2002). BIN2 has been established as a critical negative regulator of the BR signaling in Arabidopsis (Nolan et al, 2020), with subsequent studies showing BIN2 to be involved in a wide range of developmental and stress response processes through its interaction with and phosphorylation of diverse substrates, including kinases: Snf1‐related kinase 2s (SnRK2s) and mitogen‐activated protein (MAP), ubiquitin ligases: Plant U‐Box40 (PUB40), enzymes: Cellulose Synthase A1 (CESA1), and transcription factors: abscisic acid insensitive5 (ABI5), auxin response factors (ARFs), CESTA transcription factors, enhancer of glabra3 (EGL3), transparent testa glabra1 (TTG1), phytochrome interacting factor4 (PIF4), family transcription factor‐like2 (MYBL2), homeodomain‐leucine zipper protein1 (HAT1), WRKY54, tiny, responsive to dessication 26 (RD26), upbeat1 (UPB1), and golden2‐like 1 (GLK1; Kim et al, 2012; Ye et al, 2012; Khan et al, 2013; Bernardo‐Garcia et al, 2014; Cai et al, 2014; Cheng et al, 2014; Cho et al, 2014; Hu & Yu, 2014; Zhang et al, 2014, 2021a; Chen et al, 2017; Jiang et al, 2019; Xie et al, 2019; Li et al, 2020a, 2020b). Together, these interactions suggest that BIN2 functions as a key node in mediating multiple signaling pathways to regulate plant growth and stress responses.
In this study, we identified BIN2 as a critical component in SA signaling pathway. SA induces the phosphorylation of TGA3 by BIN2 at S33; this enhances the binding of TGA3 to its targets and promotes NPR1‐TGA3 complex formation, activating plant immunity. This phosphorylation process is also dependent on NPR1, indicating that phosphorylation of TGA3 is a necessary event for SA signaling and plant immunity.
Results
BIN2 physically interacts with TGA3
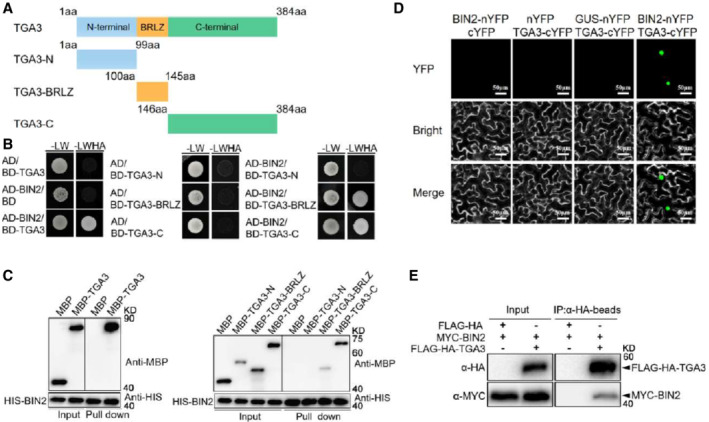
In our previous study, we identified BIN2‐interacting proteins by a yeast two‐hybrid (Y2H) screen using BD‐BIN2 (full length of BIN2 to the GAL4 DNA binding domain of the bait vector) and found TGA3 to be one of the BIN2's binding partners (Zhang et al, 2021a). A yeast two‐hybrid and HIS pull‐down assays were therefore initially conducted to confirm the physical interaction betweens TGA3 and BIN2 in vitro. As shown in Fig 1A–C, TGA3 interacts with BIN2 in vitro, and the basic region followed by the leucine zipper domain (BRLZ) and C‐terminus of TGA3 mediate the interaction with BIN2. To further confirm the interaction in plants, transient bimolecular fluorescence complementation (BiFC) assays in tobacco (Nicotiana benthamiana) leaves were performed by co‐expressing BIN2 fused with the N‐terminus of yellow fluorescent protein (BIN2‐nYFP) and TGA3 fused to the C‐terminus of YFP (TGA3‐cYFP). As shown in Fig 1D, strong YFP fluorescence signals were detected in the nucleus, indicating the physical interaction between BIN2 and TGA3. Co‐immunoprecipitation (Co‐IP) assays were further carried out using transgenic plants expressing BIN2 and TGA3 driven by their native promoters and confirmed their interaction in vivo (Fig 1E).
Figure 1. BIN2 interacts with TGA3.
-
ADiagram of TGA3‐truncated proteins used in Y2H assays and in vitro pull‐down assays described in (B) and (C). The numbers indicate the positions of amino acids.
-
BY2H assays to detect the interactions between BIN2 with TGA3 and its fragments. The experiment was repeated three times with similar results, and representative images are displayed.
-
CBIN2 interacts with TGA3 in vitro pull‐down assay. HIS‐BIN2 was incubated with MBP, MBP‐tagged full‐length or truncated TGA3, and the proteins immunoprecipitated with HIS beads were detected using anti‐MBP antibody.
-
DBiFC assays of the interaction of BIN2 (fused with the N‐terminal fragment of YFP) with TGA3 (fused with the C‐terminal fragment of YFP) in Nicotiana benthamiana. Scale bars represent 50 μm.
-
ECo‐immunoprecipitation (Co‐IP) analysis of the interaction between BIN2 and TGA3. Total proteins were extracted from the 2‐week‐old proBIN2:Myc‐BIN2/proTGA3:FLAG‐HA or proBIN2:Myc‐BIN2/proTGA3:FLAG‐HA‐TGA3 transgenic seedlings and were incubated with anti‐HA beads. HA‐Flag fusion was examined using anti‐HA antibody, and coimmunoprecipitated MYC‐BIN2 was detected using anti‐MYC antibody. The proteins from crude lysates (left, input) and immunoprecipitated proteins (right) were detected with anti‐MYC antibody.
Source data are available online for this figure.
As BIN2 functions redundantly with its homologs BIL1 and BIL2, we tested whether or not TGA3 interacts with BIL1 and BIL2 (Appendix Fig S1A and B). We found that TGA3 also interacted with BIL1 and BIL2 in the Y2H system (Appendix Fig S1A) and in tobacco leaves (Appendix Fig S1B). We also detected interactions between BIN2 and other TGAs. As shown in Appendix Fig S1C and D, BIN2 also interacted with TGA2, TGA5, and TGA6 in vitro and in vivo.
SA induces the phosphorylation of TGA3 by BIN2
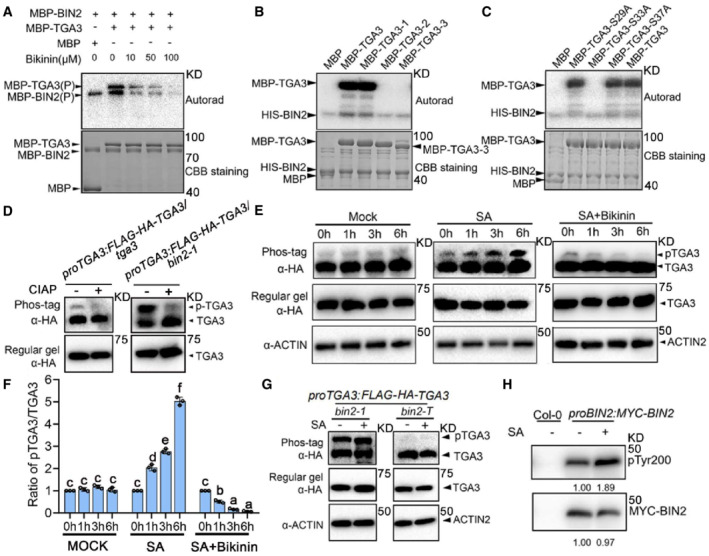
Next, to test whether TGA3 is a substrate of BIN2, in vitro kinase assays were performed with BIN2 and TGA3. We found that BIN2 directly phosphorylated TGA3 and bikinin, an inhibitor of BIN2, inhibited phosphorylation (Fig 2A). These results suggested that BIN2 phosphorylates TGA3 in vitro. There are eleven conserved phosphorylation sites of BIN2 (S/TXXXS/T) in the N‐terminal of TGA3. Based on these sequences, we mapped the phosphorylation sites in TGA3 using truncated TGA3 proteins. As shown in Fig 2B and Appendix Fig S2A, when Ser29, Ser33, and Ser37 were deleted, BIN2 could not phosphorylate the truncated TGA3‐2 and TGA3‐3 proteins. To further confirm the phosphorylation sites, we mutated Ser29, Ser33, and Ser37 to alanine, respectively. When S33 was mutated to alanine, the phosphorylation of TGA3 by BIN2 was almost undetectable (Fig 2C).
Figure 2. BIN2 phosphorylates TGA3 in vitro and in vivo .
-
A, BBIN2 phosphorylates TGA3 in vitro. Phosphorylation of full‐length TGA3 by BIN2 is inhibited by bikinin, as revealed in a kinase assay (A), and BIN2 phosphorylates truncated TGA3‐1 (17aa‐384aa) but not TGA3‐2 (41aa‐384aa) and TGA3‐3 (56aa‐384aa) (B); phosphorylated proteins are indicated (P). Autoradiography (Autorad) is shown at the top, and proteins detected by coomassie brilliant blue (CBB) staining are shown at the bottom.
-
CS33 in TGA3 is the BIN2 phosphorylation site. Potential phosphorylation Ser residue of TGA3 was mutated to Ala. Kinase assays were performed with purified HIS‐BIN2 and wild‐type or mutant forms of MBP‐TGA3.
-
DTGA3 is phosphorylated in vivo. FLAG‐HA‐TGA3 immunoprecipitated from proTGA3: FLAG‐HA‐TGA3tga3 or proTGA3: FLAG‐HA‐TGA3/bin2‐1 transgenic plants, was treated with calf‐intestinal alkaline phosphatase (CIAP) and separated on SDS–PAGE gel containing phos‐tag reagent. CIAP treatment produced a fast‐migrating band. The arrows indicate the phosphorylated or unphosphorylated TGA3.
-
ESA induces phosphorylation of TGA3 by BIN2. Two‐week‐old proTGA3:FLAG‐HA‐TGA3/tga3 transgenic plants were treated without (Mock) or with 0.5 mM SA, or with 0.5 mM SA+ 50 μM bikinin for the indicated time period. FLAG‐HA‐TGA3 was detected using phos‐tag gel (upper panel) or regular gel as controls (middle panel). ACTIN was used as a loading control (lower panel).
-
FThe ratio of phosphorylated TGA3 to dephosphorylated TGA3 in (E). The band intensity was determined from three independent experiments using ImageJ. The initial ratio of phosphorylated TGA3 to dephosphorylated TGA3 was defined as “1.” Bars represent mean ± s.d. (n = 3). Different letters are used to label genotypes with statistical differences (P < 0.05, two‐way ANOVA).
-
GDetection of phosphorylated and dephosphorylated FLAG‐HA‐TGA3 in proTGA3:FLAG‐HA‐TGA3/bin2‐1 and proTGA3:FLAG‐HA‐TGA3/bin2‐3 bil1 bil2 (bin2‐T). Two‐week‐old seedlings were pretreated with or without 0.5 mM SA for 6 h. Proteins extracted from plants were separated on a phos‐tag gel (upper panel) or regular gel as controls (middle panel). ACTIN was used as a loading control (lower panel).
-
HImmunoblot analysis of BIN2 pTyr200 in vivo. MYC‐BIN2 immunoprecipitated by anti‐MYC antibody from Col‐0 or proBIN2:MYC‐BIN2 with/without 0.5 mM SA treatment, was used to detect the pTyr200 of BIN2. Numbers under each lane indicate the band intensities of pTyr200 or total MYC‐BIN2, respectively.
Source data are available online for this figure.
To further test whether BIN2 phosphorylates TGA3 in vivo, we immunoprecipitated TGA3 protein from proTGA3:HA‐FLAG‐TGA3/tga3 or proTGA3:HA‐FLAG‐TGA3/bin2‐1 transgenic plants and distinguished between phosphorylated and dephosphorylated TGA3 using phos‐tag gel, in which the phosphorylated proteins specifically binds to the phos‐tag reagent and has reduced protein mobility. As shown in Fig 2D, under normal conditions, phosphorylated and dephosphorylated TGA3 can be detected, mainly in the form of dephosphorylation in proTGA3:HA‐FLAG‐TGA3/tga3. After SA treatment, phosphorylated TGA3 accumulated with SA‐induced TGA3 phosphorylation being inhibited by bikinin (Fig 2E and F). Furthermore, more phosphorylated TGA3 was found in bin2‐1 but almost undetected in bin2‐3 bil1 bil2 (Fig 2G).
The phosphorylation of tyrosine in the T‐loop of the kinase domain (at Tyr216/Tyr279 in human GSK3b/a) is essential for the full kinase activity of GSK3s (Hughes et al, 1993; Cole et al, 2004; Lochhead et al, 2006). In Arabidopsis, the phospho‐Tyr200 residue of AtSK21/BIN2 is corresponding to phospho‐Tyr216/Tyr279 of human GSK3b/a. The anti‐pTyr279/Tyr216 antibody was also used to detect BIN2 activity in previous studies (Hao et al, 2016; Li et al, 2020a; Zhang et al, 2021b). Then, an anti‐pTyr279/Tyr216 (pTyr) antibody and the phosphorylation status of BES1 were used to evaluate whether SA influences the kinase activity of BIN2 (Yin et al, 2002). BIN2 kinase activity was indeed enhanced after SA treatment (Fig 2H and Appendix Fig S2B), indicating that SA‐activated phosphorylation of TGA3 by BIN2 is a critical event for SA signaling.
BIN2 phosphorylation is indispensable for SA‐activated transcription activity of TGA3
To study the function of TGA3 phosphorylation by BIN2, we first detected TGA3 protein accumulation in proTGA3:FLAG‐HA‐TGA3/tga3 with SA or bikinin treatment. As shown in Appendix Fig S3A and B, the protein stability of TGA3 was independent of phosphorylation by BIN2. TGA3‐eGFP subcellular localization was detected by transient expression in tobacco leaf epidermal cells. TGA3‐eGFP mostly accumulated in the nucleus, and the TGA3‐eGFP signal did not change after SA or bikinin treatment (Appendix Fig S3C). These results indicate the stability and subcellular localization of TGA3 are not affected by BIN2 phosphorylation.
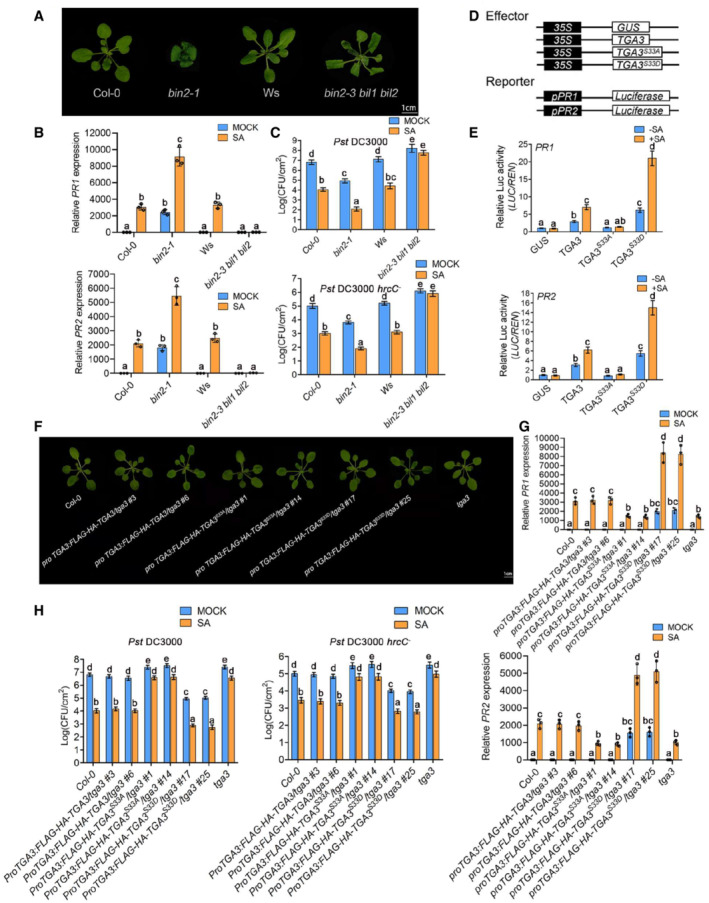
To determine the relationship between phosphorylation of TGA3 by BIN2 and transcription activity of TGA3, we detected PR1 and PR2 expression in wild‐type (WT), bin2‐1, and bin2‐3 bil1 bil2 plants (Fig 3A) and found PR gene expression was activated in bin2‐1 without SA as that in WT with SA treatment (Fig 3B). Further activation can be found in bin2‐1 after SA treatment, while SA‐induced PR expression was severely blocked in bin2‐3 bil1 bil2 as it was in the NPR1 loss‐of‐function mutant (Fig 3B). BIN2 compensated for the loss of SA‐induced PR expression of bin2‐3 bil1 bil2 in ProBIN2:MYC‐BIN2/bin2‐3 bil1 bil2, and SA‐induced PR expression was a little lower in bin2‐3 when compared with WT. We therefore conclude that BIN2 and its homologs play redundant roles in SA signaling (Appendix Fig S4).
Figure 3. Phosphorylation of TGA3 by BIN2 activates TGA3 transcription activity.
-
AMorphology of plants of the indicated genotypes. The picture was photographed 4 weeks after planting.
-
BRelative expression of PR1 and PR2 in the indicated genotypes. Bars represent mean ± s.d. (n = 3). The data were calculated from three biological replicates. Different letters are used to label genotypes with statistical differences (P < 0.05, two‐way ANOVA).
-
CGrowth of Pst DC3000 or Pst DC3000 hrcC − on the indicated genotypes with/without SA treatment. Leaves of 4‐week‐old plants were infiltrated with Pst DC3000 (OD600 = 0.0002) or Pst DC3000 hrcC − (OD600 = 0.002). Bars represent mean ± s.d. (n = 5). The data were calculated from five biological replicates. Different letters are used to label genotypes with statistical differences (P < 0.05, two‐way ANOVA).
-
D, EEffects of BIN2 phosphorylation site in TGA3 on the transcriptional regulation of the PR1 and PR2 expression in tga3 mutant protoplasts. The constructs used are shown in (D). Relative LUC activity (LUC/REN), indicating the level of PR1 and PR2 expression activated by TGA3, is shown in (E). Data are mean ± s.d. (n = 6). The data were calculated from six biological replicates. Different letters above the bars indicate statistically significant differences between samples (P < 0.05, two‐way ANOVA).
-
FMorphology of plants of the indicated genotypes. The picture was photographed 4 weeks after planting.
-
GRelative expression of PR1 and PR2 in the indicated genotypes treated with/without 0.5 mM SA for 6 h. Bars represent mean ± s.d. (n = 3). The data were calculated from three biological replicates. Different letters are used to label genotypes with statistical differences (P < 0.05, two‐way ANOVA).
-
HGrowth of Pst DC3000 or Pst DC3000 hrcC − on the indicated genotypes treated with/without SA. Leaves of 4‐week‐old plants were infiltrated with Pst DC3000 (OD600 = 0.0002) or Pst DC3000 hrcC − (OD600 = 0.002). Bars represent mean ± s.d. (n = 5). The data were calculated from five biological replicates. Different letters are used to label genotypes with statistical differences (P < 0.05, two‐way ANOVA).
Source data are available online for this figure.
Next, we compared disease resistance in WT, bin2‐1, and bin2‐3 bil1 bil2 plants. While bin2‐1 displayed enhanced plant immunity, bin2‐3 bil1 bil2 showed impaired disease resistance (Fig 3C). Meanwhile, SA‐induced resistance against Pseudomonas syringae pv. tomato DC3000 (Pst DC3000)/Pst DC3000 hrcC − was significantly impaired in bin2‐3 bil1 bil2, but enhanced in bin2‐1 plants. Transient transcription activation assays were then performed (Fig 3D and E). 35S:FLAG‐HA‐TGA3, 35S:FLAG‐HA‐TGA3 S33A (the nonphosphorylated mimetic form of TGA3, Ser 33 mutated to Ala), and 35S:FLAG‐HA‐TGA3 S33D (the phosphorylated mimetic form of TGA3, Ser 33 mutated to Asp) were used as effector constructs and co‐transformed Arabidopsis protoplasts with the reporter constructs (Fig 3D). TGA3 activated PR1 and PR2 expression after SA treatment, with TGAS33D activating more strongly. But TGA3S33A behaved as the GUS control (Fig 3E). Then, proTGA3:FLAG‐HA‐TGA3/tga3, proTGA3:FLAG‐HA‐TGA3 S33A /tga3, and proTGA3: FLAG‐HA‐TGA3 S33D /tga3 plants were generated (Fig 3F). PR gene expression was induced by TGA3 after SA treatment in proTGA3:FLAG‐HA‐TGA3/tga3 and was activated more strongly by TGA3S33D in proTGA3:FLAG‐HA‐TGA3 S33D /tga3. No difference was found in proTGA3:FLAG‐HA‐TGA3 S33A /tga3 when compared with tga3 (Fig 3G). Moreover, proTGA3:FLAG‐HA‐TGA3/bin2‐3 bil1 bil2 was insensitive to SA‐induced PR gene expression (like bin2‐3 bil1 bil2), whereas proTGA3:FLAG‐HA‐TGA3 S33D /bin2‐3 bil1 bil2 displayed increased sensitivity to SA when compared with bin2‐3 bil1 bil2 (Appendix Fig S5A).
Finally, we analyzed the SA‐induced PR gene expression in bin2‐1 tga3 and found that constitutive PR expression in bin2‐1 was partially dependent on TGA3 (Appendix Fig S5B). Consistent with these results, TGA3 rescued the Pst DC3000/Pst DC3000 hrcC − resistance defect of tga3, but TGA3 S33A did not (Fig 3H). TGA3S33D rather than TGA3 activated the pathogen resistance of bin2‐3 bil1 bil2 in proTGA3:FLAG‐HA‐TGA3 S33D /bin2‐3 bil1 bil2, and loss of TGA3 partially impaired the enhanced pathogen resistance of bin2‐1 in bin2‐1 tga3 (Appendix Fig S5C and D). Taken together, these results support the conclusion that SA‐induced TGA3 transcription activity is dependent on BIN2 phosphorylation.
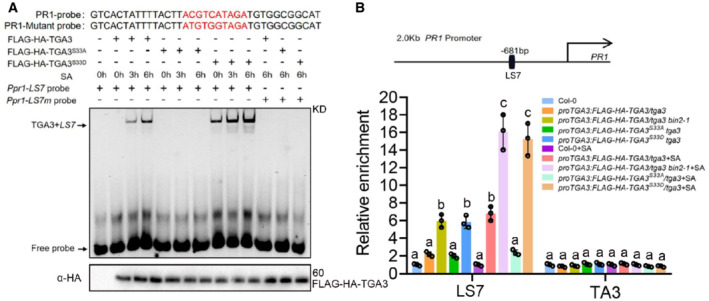
SA‐induced TGA3 DNA binding ability is dependent on BIN2 phosphorylation
Previous studies have found that the binding of TGA3 to the viral activation sequence‐1 (as‐1) element is SA inducible (Lebel et al, 1998; Zhang et al, 2003). To test whether SA‐induced TGA3 DNA binding ability is dependent on BIN2 phosphorylation, electrophoretic mobility shift assays (EMSA) were performed. TGA3, TGA3S33A, or TGA3S33D were immunoprecipitated from proTGA3:FLAG‐HA‐TGA3/tga3, proTGA3:FLAG‐HA‐TGA3 S33A /tga3 or proTGA3:FLAG‐HA‐TGA3 S33D /tga3 plants, respectively. TGA3 binds to the TGACG motif on PR1 promotor, and the binding was enhanced when plants were treated with SA (Fig 4A), which was consistent with the previous study (Kinkema et al, 2000). SA‐enhanced TGA3 binding was abolished in proTGA3:FLAG‐HA‐TGA3 S33A /tga3. Furthermore, the ability of TGA3 S33D binding to the LS7 element was largely enhanced without SA treatment and even stronger with SA treatment (Fig 4A). We then further examined the effect of BIN2‐mediated phosphorylation on the binding ability of TGA3 to target genes in vivo by performing chromatin immunoprecipitation (ChIP) assays. After SA treatment, TGA3 was shown to bind the LS7 element in PR1, and the binding ability of TGA3 was reduced when TGA3 was mutated from Ser33 to Ala33 and enhanced when TGA3 was mutated from Ser33 to Asp33 or in bin2‐1 background (Fig 4B). These results suggest that BIN2‐mediated phosphorylation is critical for TGA3 binding to the promoters of target genes in vivo.
Figure 4. BIN2 phosphorylation promotes TGA3 binding ability.
-
AIn vitro binding of nuclear TGA3 to the LS7 element of PR1. EMSA assays of the binding of TGA3 to the PR1 promoter. Mutant probe is the probe with a mutation from ACGTCATAGA to ATGTGGTAGA.
-
BChIP–qPCR analysis was performed with homozygous lines, which were harvested after 0.5 mM SA treatment for 0 or 6 h. bp, base pairs. Top: Schematic representation of the cis‐elements and chromatin fragments of amplicon in the PR1 genomic region. LS7, TGA motif. Data are mean ± s.d. (n = 3). The data were calculated from three biological replicates. Different letters above the bars indicate statistically significant differences between samples (P < 0.05, two‐way ANOVA).
Source data are available online for this figure.
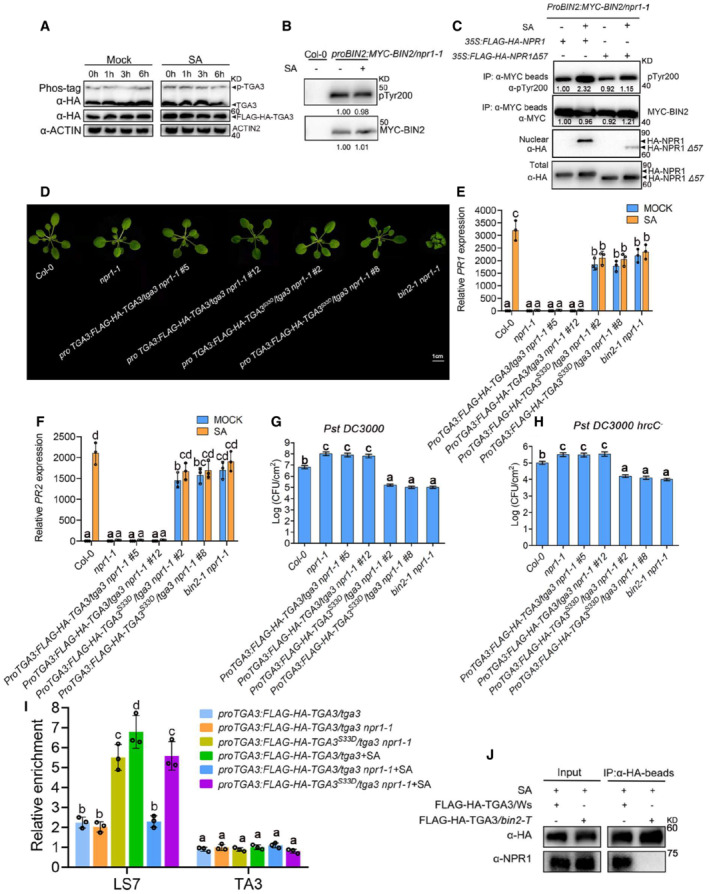
SA‐induced phosphorylation of TGA3 by BIN2 is dependent on NPR1
As the master regulator and receptor of SA signaling, NPR1 confers immunity through NPR1‐TGAs transcriptional complex. Since SA‐induced TGA3 transcription is dependent on NPR1, we studied whether SA‐induced phosphorylation of TGA3 by BIN2 was dependent on NPR1. First, we detected SA‐induced phosphorylation of TGA3 by BIN2 in proTGA3:FLAG‐HA‐TGA3/tga3/npr1‐1. As shown in Fig 5A, SA‐induced phosphorylation of TGA3 was abolished in proTGA3:FLAG‐HA‐TGA3/tga3/npr1‐1. Meanwhile, the SA‐activation of BIN2 activity was also inhibited in proBIN2:MYC‐BIN2/npr1‐1 or npr1‐1 (Fig 5B and Appendix Fig S6A).
Figure 5. BIN2‐TGA3 signaling module regulates SA signaling downstream of NPR1.
-
ADetection of SA‐induced TGA3 phosphorylation in proTGA3: FLAG‐HA‐TGA3/tga3/npr1‐1.
-
BImmunoblot analysis of BIN2 pTyr200 in vivo. MYC‐BIN2 immunoprecipitated by anti‐MYC antibody from Col‐0 or proBIN2:MYC‐BIN2/npr1‐1 with/without 0.5 mM SA treatment, was used to detect the pTyr200 of BIN2. Numbers under each lane indicate the band intensities of pTyr200 or total MYC‐BIN2, respectively.
-
CNuclear localization of NPR1 was required for the activation of SA to BIN2. 35S:FLAG‐HA‐NPR1 or 35S:FLAG‐HA‐NPR1Δ57 were transformed into proBIN2:MYC‐BIN2/npr1‐1 protoplasts with/without 0.5 mM SA treatment. Then, MYC‐BIN2 immunoprecipitated by anti‐MYC antibody from proBIN2:MYC‐BIN2/npr1‐1 protoplasts was used to detect the pTyr200 of BIN2. Numbers under each lane indicate the band intensities of pTyr200 or total MYC‐BIN2, respectively.
-
DMorphology of plants of the indicated genotypes. The picture was photographed 4 weeks after planting.
-
E, FRelative expression of PR1 (E) and PR2 (F) in the indicated genotypes. Bars represent mean ± s.d. (n = 3). The data were calculated from three biological replicates. Different letters are used to label genotypes with statistical differences (P < 0.05, two‐way ANOVA).
-
G, HGrowth of Pst DC3000 (G) or Pst DC3000 hrcC − (H) on the indicated genotypes. Leaves of 4‐week‐old plants were infiltrated with Pst DC3000 (OD600 = 0.0002) or Pst DC3000 hrcC − (OD600 = 0.002). Bars represent mean ± s.d. (n = 5). The data were calculated from five biological replicates. Different letters are used to label genotypes with statistical differences (P < 0.05, one‐way ANOVA).
-
IChIP–qPCR analysis was performed with homozygous lines, which were harvested after 0.5 mM SA for 0 or 6 h. bp, base pairs. Data are mean ± s.d. (n = 5). The data were calculated from five biological replicates. Different letters above the bars indicate statistically significant differences between samples (P < 0.05, two‐way ANOVA).
-
JCo‐IP analysis of the interaction between TGA3 and NPR1. Total proteins were extracted from the 2‐week‐old proTGA3:FLAG‐HA‐TGA3/Ws or proTGA3:FLAG‐HA‐TGA3/bin2‐3 bil1 bil2 (bin2‐T) transgenic seedlings treated with 0.5 mM SA for 6 h and were incubated with anti‐HA beads. FLAG‐HA‐fused TGA3 was examined using anti‐HA antibody, and coimmunoprecipitated NPR1 was detected using anti‐NPR1 antibody. The proteins from crude lysates (left, input) and immunoprecipitated proteins (right) were detected with anti‐NPR1 antibody.
Source data are available online for this figure.
Considering that no interaction was found between BIN2 and NPR1 (Appendix Fig S7A and B), to further test whether SA‐induced BIN2 activity is dependent on NPR1, we analyzed whether nuclear localization of NPR1 is required for the activation of SA to BIN2. A previous study showed that there were two nuclear localization signals (NLSs) in the C‐terminus of NPR1 and deletion of the C‐terminal 57 amino acids of NPR1 resulted in exclusively cytoplasmic localization of the fusion protein (Kinkema et al, 2000). As shown in Fig 5C, NPR1, but not NPR1Δ57, can rescue the defect of SA‐induced BIN2 activity in proBIN2:MYC‐BIN2/npr1‐1. TGA3S33D therefore promoted the expression of PR1 and PR2 in proTGA3:FLAG‐HA‐TGA3 S33D /tga3/npr1‐1, but TGA3 in proTGA3:FLAG‐HA‐TGA3/tga3/npr1‐1 did not (Fig 5D–F). Moreover, inhibited SA signaling and immunity in npr1‐1 could be recovered when crossed with bin2‐1 or by expressing TGA3S33D (Fig 5G and H). However, the expression of PR1 and PR2 genes could not be further activated after SA treatment in proTGA3:FLAG‐HA‐TGA3 S33D /tga3/npr1‐1 or bin2‐1 npr1‐1.
BIN2 phosphorylation induced TGA3 binding to the PR1 promoter, but SA‐enhanced binding was abolished in proTGA3:FLAG‐HA‐TGA3 S33D /tga3/npr1‐1 (Fig 5I). Nevertheless, when TGA3 existed in the phosphorylated form in proTGA3:FLAG‐HA‐TGA3 S33D /tga3/npr1‐1, the activity of binding to PR1 promoter was still strong even without SA treatment. After SA treatment, NPR1 almost only interacted with phosphorylated TGA3 in proTGA3:FLAG‐HA‐TGA3/Ws or TGA3S33D in proTGA3:TGA3 S33D /tga3 rather than dephosphorylated TGA3 in proTGA3:FLAG‐HA‐TGA3/bin2‐3 bil1 bil2 or TGA3S33A in proTGA3:HA‐FLAG‐TGA3 S33A /tga3 (Fig 5J and Appendix Fig S6B). And the interaction between NPR1 and TGA3 was even stronger in proTGA3:HA‐FLAG‐TGA3/bin2‐1 than in proTGA3:HA‐FLAG‐TGA3/tga3 (Appendix Fig S6B).
Furthermore, we analyzed published RNA sequence data and tested PR gene expression in Col‐0 or bin2‐1 with BL (the most active BRs), SA, or BL together with SA treatment (Appendix Fig S8A), finding that BR antagonizes SA during the regulation of PR gene expression. We analyzed BR response by detecting hypocotyl elongation and found SA‐inhibited BR response (Appendix Fig S8B and C). All of these results demonstrated that SA‐induced phosphorylation of TGA3 by BIN2 is dependent on NPR1 and phosphorylation of TGA3 by BIN2 is essential for further activation of TGA3 transcriptional activity by interaction with NPR1.
Discussion
Salicylic acid signaling has been well studied over the past two decades. In the absence of SA, NPR1 exists in the cytosol as inactive oligomers. Upon pathogen infection and SA accumulation, multimeric NPR1 depolymerizes to form an active monomer by SA‐induced redox changes and then is translocated to the nucleus (Withers & Dong, 2016; Zhang & Li, 2019). There, NPR1 functions as a co‐activator of TGAs, and a mechanistic gene regulatory model has been recently presented for the clade III factor TGA3 (Jin et al, 2018). TGA3 belongs to the bZIP transcription factor group D clade III and was named according to its cognate DNA binding motif (TGACG) in the as‐1 motif (Droege‐Laser et al, 2018). Post‐translational modifications of NPR1 affect the interaction between NPR1 and its partners including TGA3. During the SA induction, sumoylation of NPR1 induces its association with transcription activator TGA3, which leads to the formation of NPR1‐TGA3 complex binding to the as‐1 element to activate PR1 transcription (Saleh et al, 2015). However, the mechanism by which NPR1‐TGA3 complex regulates SA‐induced gene expression remains to be fully established. A recent study showed that two other SA receptors NPR3/4 interacted with TGA2/5/6 to repress SA response gene expression in the noninduced condition. TGA2/5/6 function as transcription repressors with NPR3/4 under normal condition and as activators with NPR1 in the presence of SA or pathogen infection (Ding et al, 2018). On the other hand, TGA3 has been considered as an activator in all cases (Kesarwani et al, 2007; Saleh et al, 2015).
TGA3 transcriptional activity is regulated by NPR1‐mediated SA signaling. TGA3 DNA binding and transcriptional activity were enhanced by interaction with NPR1 in response to SA (Zhou et al, 2000). But the molecular mechanism of TGA3 transcriptional activity activation is not clear. In this study, we found that TGA3 binding and transcriptional activity were enhanced after SA treatment by the SA‐induced phosphorylation of TGA3 by BIN2. Furthermore, phosphorylation of TGA3 by BIN2 is dependent on NPR1, and TGA3 binding ability and transcriptional activity are enhanced in bin2‐1 even without SA or NPR1 in bin2‐1 npr1‐1. But SA‐induced TGA3 binding ability and transcriptional activity are abolished in bin2‐1 npr1‐1 after SA treatment.
Our results suggest a previously unknown branch for SA signaling (Fig 6). After SA is perceived by NPR1, SA signaling is transduced from NPR1 to downstream components including BIN2. Additionally, after phosphorylation of TGA3 by BIN2, monomeric NPR1 interacts with phosphorylated TGA3 to further promote PR gene expression. During SA signal transduction, the first step of SA signaling is NPR1‐mediated phosphorylation of TGA3 by BIN2, during which NPR1 acts as a mediator of the signaling pathway. In the second step, where NPR1 serves as a co‐activator, TGA3 transcriptional activity is further activated by enhanced interaction between NPR1 and phosphorylated TGA3 (Fig 6A). TGA3S33D induces PR gene expression in the absence of SA and the transcriptional activity is further activated by interaction with NPR1 after SA treatment (Fig 6B).
Figure 6. Proposed model to illustrate BIN2‐TGA3 interaction plays an indispensable role in SA signaling.
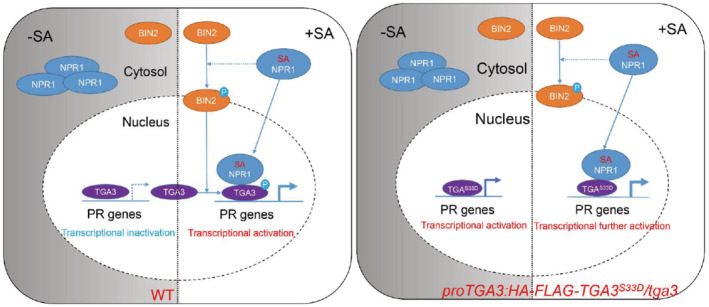
On the left: A working model for WT. In the absence of SA, NPR1 exists in the cytosol as inactive oligomers. BIN2 is inhibited and TGA3 accumulates in the nucleus almost as the dephosphorylated form. Less dephosphorylated TGA3 binds to PR gene promoters, so PR gene expression is not activated. In the presence of SA, SA binding to NPR1 enables NPR1 to be transported into the nucleus as a monomer. BIN2 kinase activity is activated by NPR1‐mediated SA signaling. Then, activated BIN2 phosphorylates TGA3. SA‐induced BIN2 phosphorylation is indispensable for SA signaling. On the one hand, phosphorylated TGA3 displays enhanced DNA binding ability and transcriptional activity. On the other hand, phosphorylation of TGA3 by BIN2 is critical for the interaction between NPR1 and TGA3, which is indispensable for further SA‐mediated PR gene transcriptional activation. On the right: A model for proTGA3:HA‐FLAG‐TGA3 S33D /tga3. In the absence of SA, TGA3S33D binds to PR to promote PR gene expression without interaction with NPR1. In the presence of SA, NPR1 is transferred from cytosol to nucleus. And then, NPR1 interacts with TGA3S33D to further promote TGA3S33D transcriptional activity.
Phosphorylation of TGA3 by BIN2 is therefore an essential step of SA signaling and SA signaling regulates PR gene expression through NPR1‐BIN2‐TGA3 module in response to pathogen infection in a highly dynamic manner. Previously, the functions of SA receptors NPR1/NPR3/NPR4 and transcription factors TGAs/WRKYs have been established in SA signaling. In this study, we found that SA‐induced BIN2 kinase activity was dependent on NPR1, but BIN2 cannot interact with NPR1 directly. Our results suggest that there could be some other components between NPR1 and BIN2, which are necessary for SA signaling transduction. Identification of BIN2 and/or other components involved in SA signaling will provide us with a more comprehensive model of SA signaling.
TGA3 also mediates the cross‐talk between SA and cytokinin (CK) to regulate basal pathogen resistance. CK‐induced ARR2 phosphorylation leads to ARR2 interaction with TGA3 to bind to SA‐dependent PR promoters and activate their expression (Choi et al, 2010). Moreover, recent work identified the role of TGA3 in heavy metal detoxification (Fang et al, 2017). In the study, we found BIN2‐TGA3 signaling module regulates SA signaling by activating TGA3 transcriptional activity. Constitutive PR gene expression in bin2‐1 was partially dependent on TGA3, and SA‐induced PR gene expression was severely impaired in bin2‐3 bil1 bil2 but was partially blocked in the tga3 single mutant. Because NPR1 confers immunity by recruiting TGAs (e.g., TGA2, TGA3, TGA5, and TGA6; Zhou & Zhang, 2020), TGAs function redundantly in regulating SA‐induced PR gene expression. BIN2 interacted with TGA2, TGA3, TGA5, and TGA6, and the canonical phosphorylation sites of BIN2 (S/TXXXS/T) were found at the N‐termini of all these TGAs. Considering the important role of BIN2 and its homologs in SA signaling, BIN2 may therefore regulate SA signaling through multiple TGAs.
BIN2 also acts as a negative regulator in BR signaling to inhibit plant growth and development. We analyzed the published RNA sequence data and found SA antagonistically regulates the expression of BR‐responsive genes, such as SAUR1, EXPA4, EXPL3, and TCH3 (Sun et al, 2010; Huang et al, 2020). But the repression of SA‐induced PR by BR cannot be detected. This may be due to the extremely low expression of PR after their repression by WRKYs transcription factors and the NPR3/NPR4‐TGAs signaling module under normal condition (Saleh et al, 2015; Ding et al, 2018). PR expression in Col‐0 treated simultaneously with BL and SA showed that only here could the BR‐mediated inhibition of SA‐induced PR expression be detected (Appendix Fig S8A). As this antagonism between BR and SA disappeared in bin2‐1 plants (Appendix Fig S8A–C), we hypothesize BIN2 is an important regulator balancing BR‐mediated plant growth and SA‐induced pathogen resistance.
Under normal growth conditions, BIN2 activity is inhibited by BR and other signaling pathways, which promotes plant growth. Upon pathogen infection, SA accumulates and SA signaling induces BIN2 kinase activity by NPR1 and other unknown components to phosphorylate and activate TGA3, which induces PR gene expression to battle pathogen infection. During the crop breeding process, the dilemma we often face is that plants with high resistance displaying limited growth, as is seen with bin2‐1 plants. The aim of this study has been to find plants with high disease resistance but which grow normally plants and investigate the underlying molecular mechanisms. In the study, we identified a BIN2 phosphorylation site in TGA3. The proTGA3:TGA3 S33D /tga3 plants showed enhanced pathogen resistance but largely normal growth. Our findings therefore provide a molecular basis for the modulation of TGA3, opening the possibility of designing crops with both high resistance and yield.
Materials and Methods
Plant material and growth conditions
Arabidopsis plant seeds were used in the study, were sterilized using 70% (v/v) ethanol and 0.1% (v/v) Triton X‐100 and plated on ½ Murashige & Skoog (1/2 MS) medium with/without appropriate antibiotic and vernalized at 4°C for 3 days in the dark, and were incubated for 6 h in light (150 μmol m−2 s−1) at 22°C for germination and then grown in a growth chamber at 22°C/19°C day/night, ~70% relative humidity, and under a 16 h : 8 h light:dark photoperiod (150 μmol m−2 s−1) for long day condition. Arabidopsis plants were grown on the soil at 22°C/19°C day/night, ~70% relative humidity, and under a 12 h : 12 h light:dark photoperiod (150 μmol m−2 s−1) for short day condition or a 16 h : 8 h light:dark photoperiod (150 μmol m−2 s−1) for long day condition. Wild‐type Arabidopsis ecotypes were Columbia‐0 (Col‐0) or Wassilewskija (Ws). npr1‐1 mutant was obtained from Yuelin Zhang's lab (Cao et al, 1994). bin2‐1 and bin2‐3 bil1 bil2 were obtained from Xuelu Wang's laboratory (Li et al, 2001; Yan et al, 2009). T‐DNA insertion mutant tga3 was obtained from the ABRC (Arabidopsis Biological Resource Center), corresponding to line SALK_088114.
Plasmid construction and generation of transgenic Arabidopsis plants
The coding regions of TGA3 from the wild type were fused with the pCM1307 vector harboring FLAG‐HA. The BIN2 coding region was also cloned into the pCM1307‐MYC vector (Li et al, 2015). For site‐directed mutagenesis of TGA3 (TGA3S33A and TGA3S33D), the primers with corresponding mutated sites were designed and explored for PCR using pCM1307‐FLAG‐HA‐TGA3 plasmid as the template. The site mutation of TGA3 was confirmed by sequencing and then fused into pCM1307‐FLAG‐HA vector. All these genes were expressed under the control of the CaMV 35S promoter. For the native promoter conditions in transgenic plants, about 2,000 bp of TGA3 or BIN2 promoter were cloned from Arabidopsis genomic DNA and used to replace the CaMV 35S promoter in the pCM1307‐FLAG‐HA or pCM1307‐MYC vectors with XhoI and ECORI. Then, the CDS of TGA3 or BIN2 were fused to the recombinant plasmids. These all constructs were introduced into Agrobacterium tumefaciens strain GV3101 and transformed into related plants using the floral dip method as described previously (Zhang et al, 2006). Briefly, prepare the Agrobacterium strain that harbors the gene of interest in a binary vector by inoculating a single Agrobacterium colony into a liquid LB medium containing the appropriate antibiotics for binary vector selection. Use this feeder culture to inoculate a 100 ml liquid LB with the appropriate antibiotics and grow the culture at 28°C for 16–24 h. Collect Agrobacterium cells and gently resuspend cells in 1 volume of freshly made 5% (wt/vol) sucrose solution and then add Silwet L‐77 to a concentration of 0.02% (vol/vol) (20 ml per 100 ml of solution) and mix well immediately before dipping. Invert plants and dip aerial parts of plants in the Agrobacterium cell suspension for 10 s with gentle agitation. Cover dipped plants with a plastic cover or wrap them with plastic film. Lay down the treated plants on their sides for 16–24 h to maintain high humidity. Send the treated plants back to the greenhouse or the growth chamber, allow them to grow normally for several months, and then collect dry seeds. Transgenic lines were selected on half‐strength MS medium plus 50 mg ml−1 Hygromycin B. Transgene expression was confirmed by immunoblotting using anti‐HA antibody or anti‐MYC antibody at 1:2,000 dilution. Homozygous T3 transgenic seeds or plants were used for further analysis.
Yeast two‐hybrid screen
Yeast two‐hybrid screen is which we described in our previous study (Tan et al, 2021). The coding region of BIN2 was cloned into the pGBKT7 vector to generate a bait vector with BIN2 fused to the GAL4 DNA binding domain. The bait construct was further co‐transformed into the yeast strain Y2H Gold (Clontech, Mountain View, CA, USA) with a prey cDNA library of the cotyledon of 12‐day‐old Arabidopsis seedlings which was constructed by fusing cDNAs with the GAL4 activation domain in the pGADT7‐Rec vector. The transformants were screened on the selective medium SD/−Leu/−Trp/–His/−Ade/X‐a‐GAL/AbA. Positive clones were isolated and their self‐activation activities were checked by co‐transformation with an empty pGADT7 vector. Those positive clones without self‐activation activities were further identified by sequence analysis. The procedure conducted is described in detail in the Make Your Own “Mate & Plate” Library System User Manual and Yeast Two‐Hybrid System User Manual (Clontech).
Protein–protein interaction assays
To confirm the interaction between BIN2 and TGA3 in our yeast two‐hybrid screen, the full‐length CDS of TGA3 and its fragments were cloned into pGBKT7 as bait, whereas BIN2, BIL1, or BIL2 were cloned into pGADT7 as prey (Clontech). Each pair of bait and prey constructs was transformed into yeast strain AH109 according to the Yeast Transformation System 2 user manual (Clontech). Transformants were selected on SD/−Leu/−Trp/–His/−Ade medium (LWHA) via serial dilution, and transformants that grew well on SD/−Leu/−Trp medium were used as positive clones harboring both plasmids.
For HIS pull‐down assay, full‐length coding region of TGA3 and various truncated constructs were incorporated into the pETMALc‐H vector (MBP tag). Full length of BIN2 was cloned into the pET‐28a (+) vector (HIS tag). MBP or MBP‐fused proteins were purified using amylose resin (NEB). BIN2 fused with HIS tag was purified using Ni‐ NTA agarose (Invitrogen). Purified MBP or MBP‐fused proteins were incubated with equal amounts of HIS‐BIN2 beads in HIS pull‐down binding buffer (20 mM Tris–HCl pH 8.0, 150 mM NaCl, 0.2% Triton) at 4°C for 2 h with gentle rotation. After washing five times with HIS pull‐down washing buffer (20 mM Tris–HCl pH 8.0, 150 mM NaCl, 0.1% Triton), the beads were collected, boiled in 50 μl 1 × SDS loading buffer for 8 min at 100°C, and the sample was examined by immunoblot using anti‐HIS or anti‐MBP antibodies. For input detection, before adding HIS‐BIN2 beads, the total incubation system was 250 μl, including purified MBP/MBP‐fused proteins in the pull‐down binding buffer. Twenty‐five microliter out of the 250 μl incubation system was used for input detection of MBP/MBP‐fused proteins. Twenty‐five microliter incubation system was boiled in 25 μl 2 × SDS loading buffer for 8 min at 100°C, and then, the 10 μl sample was examined by immunoblot using anti‐MBP antibody. So the MBP/MBP‐fused protein input used in the study was 2% total input. Before incubation with MBP/MBP‐fused proteins, the same amount of HIS‐BIN2 beads to be used for the HIS pull‐down experiment, were boiled in 1 × SDS loading buffer for 8 min at 100°C, and then were examined by immunoblot using anti‐HIS antibody as input.
Bimolecular fluorescence complementation assay was conducted using the N‐ or C‐terminus of YFP as previously (Yu et al, 2008). Briefly, the full‐length BIN2/BIL1/BIL2 was fused with pXY103 vector carrying N‐terminal of YFP, and TGA3 was fused with pXY104 vector carrying C‐terminal YFP. Agrobacterium strain GV3101 was transformed with the above vector or control vector. Agrobacterium cultures were grown overnight in an LB medium containing 200 mM acetosyringone, washed with infiltration medium (10 mM MgCl2 10 mM MES, pH 5.7, 200 mM acetosyringone), and resuspended to an OD600 of 1.0. Agrobacterium carrying nYFP and cYFP constructs were mixed in equal ratios, and the Agrobacterium mixtures were infiltrated into the young leaves of Nicotiana benthamiana. After 36–48 h, YFP was excited with a 514‐nm laser line and detected from 530 to 560 nm. YFP signals were detected using a fluorescence microscope (Leica; Yu et al, 2008).
Co‐immunoprecipitation (co‐IP) was performed as described previously (Zhang et al, 2021a). Briefly, the total proteins were extracted from Col‐0, pTGA3: FLAG‐HA‐TGA3/proBIN2:MYC‐BIN2, proTGA3:FLAG‐HA‐TGA3/Ws or proTGA3:FLAG‐HA‐TGA3/bin2‐3 bil1 bil2 and then incubated with HA agarose beads (Sigma‐Aldrich) in IP buffer (10 mM Tris, pH 7.5, 0.5% Nonidet P‐40, 2 mM EDTA, 150 mM NaCl, 1 mM PMSF, and 1% plant protease inhibitor cocktail; Amresco). The beads were collected, washed at least five times with IP buffer, recovered, and mixed with 1 × SDS loading buffer. The samples were detected by immunoblot analysis using anti‐ antibody, and the coimmunoprecipitated proteins were detected with anti‐HA antibody (Sangon), anti‐MYC (Sangon), or anti‐NPR1 antibody (Agrisera). Samples immunoprecipitated from the Col‐0 plants were used as a negative control.
In vitro kinase assay and detection of in vivo TGA3 phosphorylation
The kinase assay was performed as described (Zhang et al, 2021a). For the in vitro kinase assays, all recombinant proteins were purified from Escherichia coli BL21. Every reaction was performed in 20 μl kinase buffer (20 mM Tris, pH 7.5, 100 mM NaCl, 12 mM MgCl2 and 10 μCi 32P‐γ‐ATP). The kinase assays were performed at 37°C for 60 min and then were incubated with SDS loading buffer at 100°C for 10 min. The samples were separated by 12% SDS–PAGE gels, and then, the gels were exposed to phosphor screens. The autoradiograph (Autorad) signals were detected by a Typhoon 9410 phosphor imager. Equal contents of proteins were reacted in the kinase buffer with ATP and then separated on 12% SDS–PAGE gels for CBB staining. In vivo phosphorylated TGA3 was examined using phos‐tag reagent (NARD Institute, AAL‐107) as described (Zhang et al, 2021a, 2021b). Briefly, total protein was extracted from seedlings and separated on a 12% SDS–PAGE gel containing 75 μM Phos‐tag reagent and 100 mM MnCl2. For alkaline phosphatase treatment, the FLAG‐HA‐TGA3 proteins were immunoprecipitated with anti‐ HA beads and then incubated with calf‐intestinal alkaline phosphatase (Sigma‐Aldrich) at 37°C for 1 h and subsequently subjected to Phos‐tag‐SDS–PAGE. The separated proteins were then transferred to a PVDF membrane (Millipore) and blotted with anti‐HA antibody at a dilution of 1/1,000. The secondary antibody (goat anti‐rabbit IgG, Thermo Fisher) conjugated to HRP was used at a dilution of 1/10,000 for signal detection by the enhanced chemiluminescence assay.
RNA isolation and quantitative polymerase chain reaction
Total RNA was extracted and purified from 2‐week‐old light/dark grown seedlings of various genotypes with/without SA treatment using an RNeasy Mini Kit (Qiagen). The first strand cDNA was synthesized using M‐MLV Reverse Transcriptase (Invitrogen) in quantitative reverse transcription polymerase chain reaction (qRT–PCR). The qRT–PCR was performed according to the manufacturer's instructions from the TransStart Tip Green qPCR Super MixKit (Transgene). The CFX Connect Real‐Time System (Bio‐Rad) was used for qRT–PCR analysis. For each sample, three replicates were performed and the expression levels were normalized to those of ACTIN2. All primer sequences are listed in Appendix Table S1.
Electrophoresis mobility shift assay
Electrophoretic mobility shift assays were performed as previously described (Tan et al, 2018). Briefly, FLAG‐HA‐TGA3/FLAG‐HA‐TGA3S33A/FLAG‐HA‐TGA3S33D was extracted from transgenic plants with/without SA treatment using HA agarose beads. The DNA probes were labeled with biotin and then incubated with FLAG‐HA‐TGA3/FLAG‐HA‐TGA3S33A/HA‐FALG‐TGA3S33D in EMSA binding buffer (25 mM HEPES KOH, pH 8.0, 50 mM KCl, 1 mM dithiothreitol (DTT) and 10% glycerol). A Light Shift Chemiluminescent EMSA Kit (Thermo Fisher) was used to detect protein–DNA interactions.
Transient expression assay
For the transient expression of the TGA3 target gene, the promoters of PR1 and PR2 were cloned into the pGreen II 0800‐LUC vector (Hellens et al, 2005; Zhang et al, 2014) to generate reporter constructs. Each reporter construct was co‐transformed with 35S: FLAG‐HA‐TGA3, 35S: FLAG‐HA‐TGA3 S33A , 35S: FLAG‐HA‐TGA3 S33D , or 35S:GUS as control into tga3 mutant protoplasts for the transcriptional activity assay. Firefly and Renilla luciferase signals were assayed using dual luciferase assay reagents (Promega) and the Berthold Centro LB960 luminometer system. CaMV 35S‐driven REN was used as an internal control. The LUC:REN ratio was calculated, and the relative ratio was used as the final measurement. The luciferase data were normalized to total protein content.
Chromatin immunoprecipitation‐quantitative polymerase chain reaction assay
Chromatin immunoprecipitation (ChIP) was performed as described previously (Yu et al, 2011). Briefly, 2 g 2‐week‐old light/dark grown Col‐0, pTGA3: FLAG‐HA‐TGA3/tga3/bin2‐1, pTGA3: FLAG‐HA‐TGA3/tga3, pTGA3: FLAG‐HA‐TGA3 S33A /tga3, pTGA3:FLAG‐HA‐TGA3 S33D /tga3, pTGA3: FLAG‐HA ‐TGA3tga3//npr1‐1, or pTGA3: FLAG‐HA‐TGA3 S33D /tga3/npr1‐1 seedlings with or without SA treatment, were cross‐linked with formaldehyde and used for chromatin isolation. The chromatin was sonicated five times (15 s on and 15 s off) on ice and immunoprecipitated using HA agarose beads. After reverse cross‐linking, the DNA fragments were quantified by RT–qPCR using specific primer sets (Appendix Table S1). Col‐0 was used as the negative control, and the values for Col‐0 were set to 1 after normalization against ACTIN2 for qPCR analysis. Three biological replicates were carried out throughout the process.
Pathogen infection assay
For bacterial infection, two full‐grown leaves of 4‐week‐old plants grown under short‐day conditions were inoculated with different Pseudomonas strains. For SA‐mediated immune responses, plants were sprayed with 1 mM SA and 24 h later pressure‐infiltrated with different Pseudomonas strains. Bacterial growth (colony forming units per cm2) was determined 3 days postinoculation. The experiments were repeated in at least three individual biological replicates, and six such replicates were used for each genotype in the pathogen growth assay.
Quantification and statistical analysis
The band intensity of western blotting was measured with ImageJ software (Schneider et al, 2012). The data for qRT–PCR were collected with Bio‐Rad real‐time PCR detection systems with gene‐specific primers (Appendix Table S1). The data in Figs 2F, 3B, C, E, G and H, 4B, and 5E, F and I, and Appendix Figs S4A and B, S5A and B, and S8C were statistically analyzed using two‐way ANOVA, and the data in Fig 5G and H, Appendix Figs S5C and D, and S8A were statistically analyzed by one‐way ANOVA. All statistical analysis was performed using GraphPad PRISM V.6.0. The different letters were considered to be statistically significant at P < 0.05. In Figures, different letters denote statistical significance test (P < 0.05) as compared to wild‐type controls, unless otherwise specified by lines connecting the compared pieces of data.
Data availability
This study includes no data deposited in external repositories.
Author contributions
Dawei Zhang: Conceptualization; resources; funding acquisition; writing – review and editing. Qing Han: Formal analysis; investigation; methodology; writing – original draft. Wenrong Tan: Formal analysis; investigation; methodology; writing – original draft. Yuqing Zhao: Methodology. Feng Yang: Methodology. Xiuhong Yao: Investigation. Honghui Lin: Supervision; writing – review and editing.
In addition to the CRediT author contributions listed above, the contributions in detail are:
DZ conceived and designed the experiments. QH, WT, and DZ performed most experiments with assistance from YZ, FY, and XY. DZ wrote the manuscript with contribution from HL. All authors participated in result discussion and data analysis.
Disclosure and competing interests statement
The authors declare that they have no conflict of interest.
Supporting information
Source Data for Appendix
Appendix
Expanded View Figures PDF
Source Data for Figure 1
Source Data for Figure 2
Source Data for Figure 3
Source Data for Figure 4
Source Data for Figure 5
Acknowledgements
We thank Yuelin Zhang for providing the npr1‐1 mutant, Xuelu Wang for providing the bin2‐1 and bin2‐3 bil1 bil2 mutants, and Hongqing Guo for editing the manuscript. This work was supported by grants from the National Natural Science Foundation of China (grant no. 31970263 to HL; 32070213 to DZ); Fundamental Research Funds for the Central Universities (SCU2020D003).
The EMBO Journal (2022) 41: e110682
References
- Bernardo‐Garcia S, de Lucas M, Martinez C, Espinosa‐Ruiz A, Daviere JM, Prat S (2014) BR‐dependent phosphorylation modulates PIF4 transcriptional activity and shapes diurnal hypocotyl growth. Genes Dev 28: 1681–1694 [DOI] [PMC free article] [PubMed] [Google Scholar]
- van Butselaar T, Van den Ackerveken G (2020) Salicylic acid steers the growth‐immunity tradeoff. Trends Plant Sci 25: 566–576 [DOI] [PubMed] [Google Scholar]
- Cai Z, Liu J, Wang H, Yang C, Chen Y, Li Y, Pan S, Dong R, Tang G, Barajas‐Lopez JD et al (2014) GSK3‐like kinases positively modulate abscisic acid signaling through phosphorylating subgroup III SnRK2s in Arabidopsis. Proc Natl Acad Sci USA 111: 9651–9656 [DOI] [PMC free article] [PubMed] [Google Scholar]
- Cao H, Bowling SA, Gordon AS, Dong XN (1994) Characterization of an ARABIDOPSIS mutant that is nonresponsive to inducers of systemic acquired‐resistance. Plant Cell 6: 1583–1592 [DOI] [PMC free article] [PubMed] [Google Scholar]
- Chen J, Nolan TM, Ye H, Zhang M, Tong H, Xin P, Chu J, Chu C, Li Z, Yin Y (2017) Arabidopsis WRKY46, WRKY54, and WRKY70 transcription factors are involved in Brassinosteroid‐regulated plant growth and drought responses. Plant Cell 29: 1425–1439 [DOI] [PMC free article] [PubMed] [Google Scholar]
- Cheng Y, Zhu W, Chen Y, Ito S, Asami T, Wang X (2014) Brassinosteroids control root epidermal cell fate via direct regulation of a MYB‐bHLH‐WD40 complex by GSK3‐like kinases. Elife 3: e02525 [DOI] [PMC free article] [PubMed] [Google Scholar]
- Cho H, Ryu H, Rho S, Hill K, Smith S, Audenaert D, Park J, Han S, Beeckman T, Bennett MJ et al (2014) A secreted peptide acts on BIN2‐mediated phosphorylation of ARFs to potentiate auxin response during lateral root development. Nat Cell Biol 16: 66–76 [DOI] [PubMed] [Google Scholar]
- Choe S, Schmitz RJ, Fujioka S, Takatsuto S, Lee MO, Yoshida S, Feldmann KA, Tax FE (2002) Arabidopsis brassinosteroid‐insensitive dwarf12 mutants are semidominant and defective in a glycogen synthase kinase 3 beta‐like kinase. Plant Physiol 130: 1506–1515 [DOI] [PMC free article] [PubMed] [Google Scholar]
- Choi J, Huh SU, Kojima M, Sakakibara H, Paek KH, Hwang I (2010) The cytokinin‐activated transcription factor ARR2 promotes plant immunity via TGA3/NPR1‐dependent salicylic acid signaling in Arabidopsis. Dev Cell 19: 284–295 [DOI] [PubMed] [Google Scholar]
- Cole A, Frame S, Cohen P (2004) Further evidence that the tyrosine phosphorylation of glycogen synthase kinase‐3 (GSK3) in mammalian cells is an autophosphorylation event. Biochem J 377: 249–255 [DOI] [PMC free article] [PubMed] [Google Scholar]
- Delaney TP, Friedrich L, Ryals JA (1995) Arabidopsis signal‐transduction mutant defective in chemically and biologically induced disease resistance. Proc Natl Acad Sci USA 92: 6602–6606 [DOI] [PMC free article] [PubMed] [Google Scholar]
- Despres C, DeLong C, Glaze S, Liu E, Fobert PR (2000) The arabidopsis NPR1/NIM1 protein enhances the DNA binding activity of a subgroup of the TGA family of bZIP transcription factors. Plant Cell 12: 279–290 [PMC free article] [PubMed] [Google Scholar]
- Ding P, Ding Y (2020) Stories of salicylic acid: a plant defense hormone. Trends Plant Sci 25: 549–565 [DOI] [PubMed] [Google Scholar]
- Ding Y, Sun T, Ao K, Peng Y, Zhang Y, Li X, Zhang Y (2018) Opposite roles of salicylic acid receptors NPR1 and NPR3/NPR4 in transcriptional regulation of plant immunity. Cell 173: 1454–1467 [DOI] [PubMed] [Google Scholar]
- Droege‐Laser W, Snoek BL, Snel B, Weiste C (2018) The Arabidopsis bZIP transcription factor family ‐ an update. Curr Opin Plant Biol 45: 36–49 [DOI] [PubMed] [Google Scholar]
- Fang H, Liu Z, Long Y, Liang Y, Jin Z, Zhang L, Liu D, Li H, Zhai J, Pei Y (2017) The Ca2+/calmodulin2‐binding transcription factor TGA3 elevates LCD expression and H2S production to bolster Cr6+ tolerance in Arabidopsis. Plant J 91: 1038–1050 [DOI] [PubMed] [Google Scholar]
- Gaffney T, Friedrich L, Vernooij B, Negrotto D, Nye G, Uknes S, Ward E, Kessmann H, Ryals J (1993) Requirement of salicylic‐acid for the induction of systemic acquired‐resistance. Science 261: 754–756 [DOI] [PubMed] [Google Scholar]
- Hao Y, Wang H, Qiao S, Leng L, Wang X (2016) Histone deacetylase HDA6 enhances brassinosteroid signaling by inhibiting the BIN2 kinase. Proc Natl Acad Sci USA 113: 10418–10423 [DOI] [PMC free article] [PubMed] [Google Scholar]
- Hellens RP, Allan AC, Friel EN, Bolitho K, Grafton K, Templeton MD, Karunairetnam S, Gleave AP, Laing WA (2005) Transient expression vectors for functional genomics, quantification of promoter activity and RNA silencing in plants. Plant Methods 1: 13 [DOI] [PMC free article] [PubMed] [Google Scholar]
- Hu Y, Yu D (2014) BRASSINOSTEROID INSENSITIVE2 interacts with ABSCISIC ACID INSENSITIVE5 to mediate the antagonism of Brassinosteroids to abscisic acid during seed germination in Arabidopsis. Plant Cell 26: 4394–4408 [DOI] [PMC free article] [PubMed] [Google Scholar]
- Huang P, Dong Z, Guo P, Zhang X, Qiu Y, Li B, Wang Y, Guo H (2020) Salicylic acid suppresses apical hook formation via NPR1‐mediated repression of EIN3 and EIL1 in Arabidopsis. Plant Cell 32: 612–629 [DOI] [PMC free article] [PubMed] [Google Scholar]
- Hughes K, Nikolakaki E, Plyte SE, Totty NF, Woodgett JR (1993) Modulation of the glycogen synthase kinase‐3 family by tyrosine phosphorylation. EMBO J 12: 803–808 [DOI] [PMC free article] [PubMed] [Google Scholar]
- Jiang H, Tang B, Xie Z, Nolan T, Ye H, Song GY, Walley J, Yin Y (2019) GSK3‐like kinase BIN2 phosphorylates RD26 to potentiate drought signaling in Arabidopsis. Plant J 100: 923–937 [DOI] [PubMed] [Google Scholar]
- Jin H, Choi SM, Kang MJ, Yun SH, Kwon DJ, Noh YS, Noh B (2018) Salicylic acid‐induced transcriptional reprogramming by the HAC‐NPR1‐TGA histone acetyltransferase complex in Arabidopsis. Nucleic Acids Res 46: 11712–11725 [DOI] [PMC free article] [PubMed] [Google Scholar]
- Jonak C, Hirt H (2002) Glycogen synthase kinase 3/SHAGGY‐like kinases in plants: an emerging family with novel functions. Trends Plant Sci 7: 457–461 [DOI] [PubMed] [Google Scholar]
- Kesarwani M, Yoo J, Dong X (2007) Genetic interactions of TGA transcription factors in the regulation of pathogenesis‐related genes and disease resistance in Arabidopsis. Plant Physiol 144: 336–346 [DOI] [PMC free article] [PubMed] [Google Scholar]
- Khan M, Rozhon W, Bigeard J, Pflieger D, Husar S, Pitzschke A, Teige M, Jonak C, Hirt H, Poppenberger B (2013) Brassinosteroid‐regulated GSK3/Shaggy‐like kinases phosphorylate mitogen‐activated protein (MAP) kinase kinases, which control stomata development in Arabidopsis thaliana. J Biol Chem 288: 7519–7527 [DOI] [PMC free article] [PubMed] [Google Scholar]
- Kim TW, Michniewicz M, Bergmann DC, Wang ZY (2012) Brassinosteroid regulates stomatal development by GSK3‐mediated inhibition of a MAPK pathway. Nature 482: 419–422 [DOI] [PMC free article] [PubMed] [Google Scholar]
- Kinkema M, Fan WH, Dong X (2000) Nuclear localization of NPR1 is required for activation of PR gene expression. Plant Cell 12: 2339–2350 [DOI] [PMC free article] [PubMed] [Google Scholar]
- Lebel E, Heifetz P, Thorne L, Uknes S, Ryals J, Ward E (1998) Functional analysis of regulatory sequences controlling PR‐1 gene expression in Arabidopsis. Plant J 16: 223–233 [DOI] [PubMed] [Google Scholar]
- Li J, Nam KH (2002) Regulation of brassinosteroid signaling by a GSK3/SHAGGY‐like kinase. Science 295: 1299–1301 [DOI] [PubMed] [Google Scholar]
- Li J, Nam KH, Vafeados D, Chory J (2001) BIN2, a new brassinosteroid‐insensitive locus in Arabidopsis. Plant Physiol 127: 14–22 [DOI] [PMC free article] [PubMed] [Google Scholar]
- Li J, Liu J, Wang G, Cha JY, Li G, Chen S, Li Z, Guo J, Zhang C, Yang Y et al (2015) A chaperone function of NO CATALASE ACTIVITY1 is required to maintain Catalase ACTIVITY and for multiple stress responses in Arabidopsis. Plant Cell 27: 908–925 [DOI] [PMC free article] [PubMed] [Google Scholar]
- Li J, Terzaghi W, Gong Y, Li C, Ling JJ, Fan Y, Qin N, Gong X, Zhu D, Deng X (2020a) Modulation of BIN2 kinase activity by HY5 controls hypocotyl elongation in the light. Nat Commun 11: 1592 [DOI] [PMC free article] [PubMed] [Google Scholar]
- Li T, Lei W, He R, Tang X, Han J, Zou L, Yin Y, Lin H, Zhang D (2020b) Brassinosteroids regulate root meristem development by mediating BIN2‐UPB1 module in Arabidopsis. PLoS Genet 16: e1008883 [DOI] [PMC free article] [PubMed] [Google Scholar]
- Lochhead PA, Kinstrie R, Sibbet G, Rawjee T, Morrice N, Cleghon V (2006) A chaperone‐dependent GSK3β transitional intermediate mediates activation‐loop autophosphorylation. Mol Cell 24: 627–633 [DOI] [PubMed] [Google Scholar]
- Nolan TM, Vukašinović N, Liu DR, Russinova E, Yin YH (2020) Brassinosteroids: multidimensional regulators of plant growth, development, and stress responses. Plant Cell 32: 295–318 [DOI] [PMC free article] [PubMed] [Google Scholar]
- Perez‐Perez JM, Ponce MR, Micol JL (2002) The UCU1 Arabidopsis gene encodes a SHAGGY/GSK3‐like kinase required for cell expansion along the proximodistal axis. Dev Biol 242: 161–173 [DOI] [PubMed] [Google Scholar]
- Qi X, Chanderbali AS, Wong GK‐S, Soltis DE, Soltis PS (2013) Phylogeny and evolutionary history of glycogen synthase kinase 3/SHAGGY‐like kinase genes in land plants. BMC Evol Biol 13: 143 [DOI] [PMC free article] [PubMed] [Google Scholar]
- Rochon A, Boyle P, Wignes T, Fobert PR, Despres C (2006) The coactivator function of Arabidopsis NPR1 requires the core of its BTB/POZ domain and the oxidation of C‐terminal cysteines. Plant Cell 18: 3670–3685 [DOI] [PMC free article] [PubMed] [Google Scholar]
- Saleh A, Withers J, Mohan R, Marques J, Gu Y, Yan S, Zavaliev R, Nomoto M, Tada Y, Dong X (2015) Posttranslational modifications of the master transcriptional regulator NPR1 enable dynamic but tight control of plant immune responses. Cell Host Microbe 18: 169–182 [DOI] [PMC free article] [PubMed] [Google Scholar]
- Schneider CA, Rasband WS, Eliceiri KW (2012) NIH image to ImageJ: 25 years of image analysis. Nat Methods 9: 671–675 [DOI] [PMC free article] [PubMed] [Google Scholar]
- Sun Y, Fan X, Cao D, Tang W, He K, Zhu J, He J, Bai M, Zhu S, Oh E et al (2010) Integration of brassinosteroid signal transduction with the transcription network for plant growth regulation in Arabidopsis. Dev Cell 19: 765–777 [DOI] [PMC free article] [PubMed] [Google Scholar]
- Tan W, Zhang D, Zhou H, Zheng T, Yin Y, Lin H (2018) Transcription factor HAT1 is a substrate of SnRK2.3 kinase and negatively regulates ABA synthesis and signaling in Arabidopsis responding to drought. PLoS Genet 14: e1007336 [DOI] [PMC free article] [PubMed] [Google Scholar]
- Tan W, Han Q, Li Y, Yang F, Li J, Li P, Xu X, Lin H, Zhang D (2021) A HAT1‐DELLA signaling module regulates trichome initiation and leaf growth by achieving gibberellin homeostasis. New Phytol 231: 1220–1235 [DOI] [PubMed] [Google Scholar]
- Wildermuth MC, Dewdney J, Wu G, Ausubel FM (2001) Isochorismate synthase is required to synthesize salicylic acid for plant defence. Nature 414: 562–565 [DOI] [PubMed] [Google Scholar]
- Withers J, Dong X (2016) Posttranslational modifications of NPR1: a single protein playing multiple roles in plant immunity and physiology. PLoS Pathog 12: e1005707 [DOI] [PMC free article] [PubMed] [Google Scholar]
- Xie Z, Nolan T, Jiang H, Tang B, Zhang M, Li Z, Yin Y (2019) The AP2/ERF transcription factor TINY modulates Brassinosteroid‐regulated plant growth and drought responses in Arabidopsis. Plant Cell 31: 1788–1806 [DOI] [PMC free article] [PubMed] [Google Scholar]
- Yan Z, Zhao J, Peng P, Chihara RK, Li J (2009) BIN2 functions redundantly with other Arabidopsis GSK3‐like kinases to regulate brassinosteroid signaling. Plant Physiol 150: 710–721 [DOI] [PMC free article] [PubMed] [Google Scholar]
- Ye H, Li L, Guo H, Yin Y (2012) MYBL2 is a substrate of GSK3‐like kinase BIN2 and acts as a corepressor of BES1 in brassinosteroid signaling pathway in Arabidopsis. Proc Natl Acad Sci USA 109: 20142–20147 [DOI] [PMC free article] [PubMed] [Google Scholar]
- Yin Y, Wang ZY, Mora‐Garcia S, Li J, Yoshida S, Asami T, Chory J (2002) BES1 accumulates in the nucleus in response to brassinosteroids to regulate gene expression and promote stem elongation. Cell 109: 181–191 [DOI] [PubMed] [Google Scholar]
- Yu X, Li L, Li L, Guo M, Chory J, Yin Y (2008) Modulation of brassinosteroid‐regulated gene expression by jumonji domain‐containing proteins ELF6 and REF6 in Arabidopsis. Proc Natl Acad Sci USA 105: 7618–7623 [DOI] [PMC free article] [PubMed] [Google Scholar]
- Yu X, Li L, Zola J, Aluru M, Ye H, Foudree A, Guo H, Anderson S, Aluru S, Liu P et al (2011) A brassinosteroid transcriptional network revealed by genome‐wide identification of BESI target genes in Arabidopsis thaliana. Plant J 65: 634–646 [DOI] [PubMed] [Google Scholar]
- Zhang Y, Li X (2019) Salicylic acid: biosynthesis, perception, and contributions to plant immunity. Curr Opin Plant Biol 50: 29–36 [DOI] [PubMed] [Google Scholar]
- Zhang Y, Fan W, Kinkema M, Li X, Dong X (1999) Interaction of NPR1 with basic leucine zipper protein transcription factors that bind sequences required for salicylic acid induction of the PR‐1 gene. Proc Natl Acad Sci USA 96: 6523–6528 [DOI] [PMC free article] [PubMed] [Google Scholar]
- Zhang Y, Tessaro MJ, Lassner M, Li X (2003) Knockout analysis of Arabidopsis transcription factors TGA2, TGA5, and TGA6 reveals their redundant and essential roles in systemic acquired resistance. Plant Cell 15: 2647–2653 [DOI] [PMC free article] [PubMed] [Google Scholar]
- Zhang X, Henriques R, Lin SS, Niu QW, Chua NH (2006) Agrobacterium‐mediated transformation of Arabidopsis thaliana using the floral dip method. Nat Protoc 1: 641–646 [DOI] [PubMed] [Google Scholar]
- Zhang D, Ye H, Guo H, Johnson A, Zhang M, Lin H, Yin Y (2014) Transcription factor HAT1 is phosphorylated by BIN2 kinase and mediates brassinosteroid repressed gene expression in Arabidopsis. Plant J 77: 59–70 [DOI] [PubMed] [Google Scholar]
- Zhang D, Tan W, Yang F, Han Q, Deng X, Guo H, Liu B, Yin Y, Lin H (2021a) A BIN2‐GLK1 signaling module integrates Brassinosteroid and light signaling to repress chloroplast development in the dark. Dev Cell 56: 310–324 [DOI] [PubMed] [Google Scholar]
- Zhang W, Tang Y, Hu Y, Yang Y, Cai J, Liu H, Zhang C, Liu X, Hou X (2021b) Arabidopsis NF‐YCs play dual roles in repressing brassinosteroid biosynthesis and signaling during light‐re dated hypocotyl elongation. Plant Cell 33: 2360–2374 [DOI] [PMC free article] [PubMed] [Google Scholar]
- Zhou JM, Zhang Y (2020) Plant immunity: danger perception and signaling. Cell 181: 978–989 [DOI] [PubMed] [Google Scholar]
- Zhou JM, Trifa Y, Silva H, Pontier D, Lam E, Shah J, Klessig DF (2000) NPR1 differentially interacts with members of the TGA/OBF family of transcription factors that bind an element of the PR‐1 gene required for induction by salicylic acid. Mol Plant Microbe Interact 13: 191–202 [DOI] [PubMed] [Google Scholar]