

Abstract
Autophagy depends on the repopulation of lysosomes to degrade intracellular components and recycle nutrients. How cells co‐ordinate lysosome repopulation during basal autophagy, which occurs constitutively under nutrient‐rich conditions, is unknown. Here, we identify an endosome‐dependent phosphoinositide pathway that links PI3Kα signaling to lysosome repopulation during basal autophagy. We show that PI3Kα‐derived PI(3)P generated by INPP4B on late endosomes was required for basal but not starvation‐induced autophagic degradation. PI(3)P signals were maintained as late endosomes matured into endolysosomes, and served as the substrate for the 5‐kinase, PIKfyve, to generate PI(3,5)P2. The SNX‐BAR protein, SNX2, was recruited to endolysosomes by PI(3,5)P2 and promoted lysosome reformation. Inhibition of INPP4B/PIKfyve‐dependent lysosome reformation reduced autophagic clearance of protein aggregates during proteotoxic stress leading to increased cytotoxicity. Therefore under nutrient‐rich conditions, PI3Kα, INPP4B, and PIKfyve sequentially contribute to basal autophagic degradation and protection from proteotoxic stress via PI(3,5)P2‐dependent lysosome reformation from endolysosomes. These findings reveal that endosome maturation couples PI3Kα signaling to lysosome reformation during basal autophagy.
Keywords: autophagy, INPP4B, lysosome, PI3Kα, PIKfyve
Subject Categories: Autophagy & Cell Death
Sequential phosphoinositide conversion by PI3Kα, INPP4B and PIKfyve is necessary for autophagic degradation and protein aggregate clearance under nutrient‐rich conditions.

Introduction
Autophagy is a highly conserved pathway that degrades intracellular components and recycles nutrients. Autophagy occurs constitutively in almost all eukaryotic cells to ensure organelle quality control, and is upregulated in response to nutrient deficiency or stress to mobilize amino acids and promote cytoprotection (Klionsky et al, 2021). Autophagic cargo is encapsulated and sequestered within autophagosomes that subsequently fuse with lysosomes to form autolysosomes, in which cargo is broken down into macromolecules that are reutilized by the cell (Dikic & Elazar, 2018). A dynamic equilibrium of autophagosomes and lysosomes must be maintained for sustained autophagy and to allow adaptive autophagy responses. If lysosomes are not sufficiently repopulated during autophagy, autophagosomes accumulate and autophagic function is reduced (McGrath et al, 2021). There has been significant progress in understanding how lysosomes are repopulated during starvation‐induced autophagy via transcription factor EB (TFEB)/transcription factor E3 (TFE3)‐dependent lysosome biogenesis (Settembre et al, 2011, 2012) and autophagic lysosome reformation (ALR) pathways (Yu et al, 2010). However, these pathways do not operate during basal autophagy, which occurs under nutrient‐rich conditions to maintain cellular homeostasis and is associated with longevity and protection against neurodegeneration (Hara et al, 2006; Komatsu et al, 2006; Nakamura & Yoshimori, 2018). Therefore, it remains unclear how cells co‐ordinate lysosome repopulation during basal autophagy.
Phosphoinositide 3‐kinases (PI3Ks) generate phosphoinositides on intracellular membranes that regulate many aspects of autophagy. In the canonical pathway that operates during starvation, Unc‐51 like autophagy activating kinase (ULK1) activates the class III PI3K complex I (Vps34, p150, Beclin‐1, and ATG14) generating phosphatidylinositol 3‐phosphate (PI(3)P) on omegasomes, autophagosome precursors derived from endoplasmic reticulum membranes (Axe et al, 2008; Russell et al, 2013). PI(3)P recruits effector proteins that drive elongation and closure of emerging autophagosome membranes, leading to the sequestration of autophagic cargo within autophagosomes (Axe et al, 2008; Dooley et al, 2014). PI(3)P also interacts with tectonin beta‐propeller repeat containing protein 1 (TECPR1) to facilitate autophagosome–lysosome fusion (Chen et al, 2012), and contributes to ALR to facilitate lysosome repopulation during starvation‐induced autophagy (Munson et al, 2015). The class II PI3K, PI3KC2α, is also required for shear stress‐induced autophagy via PI(3)P generation at primary cilia (Boukhalfa et al, 2020), whereas PI3KC2β contributes to autophagic degradation during starvation via phosphatidyinositol 3,4‐bisphosphate (PI(3,4)P2) generation on lysosomes (Marat et al, 2017).
Alternatively, inactivation of class I PI3K signaling during starvation contributes to mTOR‐dependent autophagy activation (Manning & Toker, 2017). In response to growth factor stimulation, class I PI3K generates phosphatidylinositol 3,4,5‐trisphosphate (PI(3,4,5)P3) on the inner leaflet of the plasma membrane, which is hydrolyzed by inositol polyphosphate 5‐phosphatases to PI(3,4)P2 (Rodgers et al, 2017). PI(3,4,5)P3 and PI(3,4)P2 together recruit AKT (James et al, 1996; Ma et al, 2008) to the inner wall of the plasma membrane, where it is activated by phosphorylation and subsequently activates the autophagy repressor mTOR (Inoki et al, 2002). Paradoxically, the class I PI3K p110β catalytic subunit promotes autophagosome formation by stimulating class III PI3K complex activity via Rab5 binding (Dou et al, 2010, 2013), suggesting that the contribution of class I PI3K signaling to autophagy regulation is complex.
Interestingly up to 30% of cellular PI(3)P is generated downstream of growth factor‐stimulated class I PI3K signaling via hydrolysis of PI(3,4)P2 by inositol polyphosphate 4‐phosphatase type I (INPP4A) and type II (INPP4B) (Shin et al, 2005; Ikonomov et al, 2015). It is not known whether class I PI3K‐derived PI(3)P generation has a functional role in autophagy. INPP4A and INPP4B convert PI(3,4)P2 to PI(3)P on distinct endosomal compartments promoting endocytosis and late endosome trafficking, respectively (Ivetac et al, 2005; Shin et al, 2005; Li Chew et al, 2015; Daste et al, 2017; Liu et al, 2018, 2020; Rodgers et al, 2021). INPP4B is recruited to late endosomes via Rab7 binding, where it generates PI(3)P downstream of PI3Kα to enhance Hrs‐dependent late endosome formation (Rodgers et al, 2021). Thereby INPP4B promotes lysosomal degradation of endocytic cargoes including EGFR and GSK3β leading to AKT/MEK signaling suppression or Wnt/β‐catenin signaling activation, respectively (Liu et al, 2020; Rodgers et al, 2021).
Here, we investigated the role class I PI3K‐dependent PI(3)P generation plays in autophagy. We demonstrate that PI3Kα‐derived PI(3)P synthesis by INPP4B on endosomes is required for lysosome reformation from endolysosomes, basal autophagic degradation, and protection from proteotoxic stress, which is functionally distinct from the canonical Vps34‐generated pool of PI(3)P. Mechanistically, INPP4B‐generated PI(3)P signals are retained as endosomes mature into endolysosomes, and act as a substrate for PI(3,5)P2 synthesis by PIKfyve. PI(3,5)P2 recruits the SNX‐BAR protein, SNX2, to promote endolysosome membrane tubulation, and thereby lysosome reformation. Therefore, our investigation reveals an endosome‐dependent phosphoinositide conversion pathway that couples PI3Kα signaling to lysosome repopulation during basal autophagy.
Results
INPP4B promotes PI3Kα‐dependent basal autophagic degradation independent of Vps34
The majority of cellular PI(3)P is generated via phosphorylation of phosphatidylinositol (PI) by Vps34, which promotes autophagosome formation and the recruitment of autophagic cargo in response to nutrient deprivation (Dooley et al, 2014). However, PI(3)P is also generated downstream of PI3Kα via hydrolysis of PI(3,4)P2 by the 4‐phosphatase INPP4B under nutrient‐rich conditions (Shin et al, 2005; Gewinner et al, 2009; Ikonomov et al, 2015; Rodgers et al, 2021; Fig 1A). It is unknown whether this alternate PI(3)P pool also contributes to autophagy regulation. To decipher the role INPP4B‐generated PI(3)P plays, we undertook a systematic evaluation of the autophagy pathway in MCF‐7 cells, which express endogenous INPP4B but not INPP4A (Fedele et al, 2010) and harbor a hyperactivating PIK3CAE545K mutation. Lipidated LC3B‐II, which associates with the autophagosome membrane and corresponds to the relative number of autophagosomes (Mizushima & Yoshimori, 2007), was assessed under growth media conditions (basal autophagy) or following nutrient‐free EBSS treatment which activates starvation‐induced autophagy. Interestingly, ectopic GFP‐INPP4B expression (Appendix Fig S1A) decreased LC3B‐II protein levels under growth conditions, however, there was no sustained difference in LC3B‐II between GFP‐INPP4B and GFP‐vector cells during prolonged starvation‐induced autophagy (Fig 1B and C). In contrast, INPP4B shRNA depletion (Appendix Fig S1B and C) increased LC3B‐II under growth conditions, but not following prolonged starvation‐induced autophagy (Fig 1D and E). INPP4B siRNA depletion also increased LC3B‐II levels under growth conditions in HeLa and HEK293T cells (Appendix Fig S1D–F), indicating that INPP4B regulation of basal autophagy is conserved across multiple independent cell lines. GFP‐INPP4B also significantly decreased the number of Sequesterome 1 (SQSTM1, better known as p62)‐positive autophagosomes under growth conditions, but had little effect on autophagosome numbers following EBSS treatment (Fig 1F and G). Collectively, this data suggests that INPP4B selectively reduces the number of autophagosomes during basal autophagy but not following activation of starvation‐enhanced autophagy. Furthermore, the number of p62‐positive autophagosomes was also reduced following HA‐INPP4BWT but not PI(3,4)P2 phosphatase‐dead HA‐INPP4BC842A expression (Rijal et al, 2015; Appendix Fig S1G and H), indicating that INPP4B decreases autophagosome numbers via its conversion of PI(3,4)P2 to PI(3)P.
Figure 1. INPP4B promotes PI3Kα‐dependent basal autophagic degradation independent of Vps34.

-
API(3)P is synthesized directly by the class III PI3K Vps34, or via the sequential actions of PI3Kα, inositol polyphosphate 5‐phosphatses, and INPP4B in response to growth factor stimulation.
-
B, CMCF‐7 cells expressing GFP‐INPP4B or GFP‐vector were cultured in growth media or EBSS for the indicated times, then lysed and immunoblotted with LC3B antibodies and GAPDH antibodies as a loading control (B). Data represent the relative LC3B‐II levels normalized to GAPDH, and expressed relative to growth media‐treated GFP‐vector cells which were assigned an arbitrary value of 1 (n = 3 experiments) (C).
-
D, EMCF‐7 cells expressing nontargeted (NT), INPP4B #1, or INPP4B #2 shRNA were cultured in growth media or EBSS for the indicated times, then lysed and immunoblotted with LC3B antibodies and GAPDH antibodies as a loading control (D). Data represent the relative LC3B‐II levels normalized to GAPDH, and expressed relative to growth media‐treated NT shRNA cells which were assigned an arbitrary value of 1 (n = 3 experiments) (E).
-
F, GMCF‐7 cells expressing GFP‐INPP4B or GFP‐vector were cultured in growth media or EBSS for 4 h, then fixed and immunostained with p62 antibodies, and co‐stained with DAPI and phalloidin (F). Data represent the number of p62+ puncta relative to cell area (μm2) (n = 3 experiments, > 50 cells/experiment) (G).
-
H, IMCF‐7 cells expressing GFP‐INPP4B or GFP‐vector were treated with 100 nM bafilomycin A1 or DMSO as a vehicle control for 4 h, then lysed and immunoblotted with LC3B antibodies and GAPDH antibodies as a loading control (H). Data represent the relative LC3B‐II levels normalized to GAPDH, and expressed relative to DMSO‐treated GFP‐vector cells which were assigned an arbitrary value of 1 (I) (n = 3 experiments).
-
J, KMCF‐7 cells expressing GFP‐INPP4B or GFP‐vector were treated with 100 nM of bafilomycin A1 or DMSO as a vehicle control for 4 h, then fixed and immunostained with p62 antibodies, and co‐stained with DAPI and phalloidin (J). Data represent the number of p62+ puncta relative to cell area (μm2) (n = 3 experiments, > 50 cells/experiment) (K).
-
L, MMCF‐7 cells expressing GFP‐INPP4B or GFP‐vector were treated with 2 μM BYL719 (PI3Kα inhibitor) or DMSO as a vehicle control for the indicated times. Cells were lysed and immunoblotted with LC3B, pAKTS473, AKT(pan), pS6KT389, or S6K antibodies and GAPDH antibodies as a loading control (L). Data represent the relative LC3B‐II levels normalized to GAPDH, and expressed relative to DMSO‐treated GFP‐vector cells which were assigned an arbitrary value of 1 (n = 3 experiments) (M).
-
N, OMCF‐7 cells expressing GFP‐INPP4B or GFP‐vector were treated with 1 or 10 μM of SAR405 (Vps34 inhibitor) or DMSO as a vehicle control for 4 h. Cells were lysed and immunoblotted with LC3B antibodies and GAPDH antibodies as a loading control (N). Data represent the relative LC3B‐II levels normalized to GAPDH, and expressed relative to DMSO‐treated GFP‐vector cells which were assigned an arbitrary value of 1 (n = 3 experiments) (O).
Data information: Data are presented as mean ± SD. The insets at the lower right of each image are higher power regions of the boxed areas. Scale bar is 10 μm in (F, J). P values determined by one‐way ANOVA with Tukey post hoc test in (C, G, I, K, M, O), or by one‐way ANOVA in (E).
Source data are available online for this figure.
The INPP4B‐mediated decrease in autophagosomes observed during basal autophagy may be a consequence of either reduced autophagosome biogenesis, or enhanced autophagosome turnover via their fusion with lysosomes to form autolysosomes (Mizushima & Yoshimori, 2007). To distinguish between these two possibilities, cells were treated with the V‐ATPase inhibitor bafilomycin A1, which prevents autophagosome–lysosome fusion (Mauvezin et al, 2015). Bafilomycin A1 treatment restored both the decreased LC3B‐II levels and p62‐positive autophagosomes in GFP‐INPP4B expressing cells to a level similar to GFP‐vector controls (Fig 1H–K). This data suggests that INPP4B enhances autophagosome turnover and hence autophagic degradation but does not affect autophagosome formation. To evaluate autophagosome fusion with lysosomes, we utilized the pH‐sensitive GFP‐mCherry‐LC3 biosensor, which is detected as GFP‐positive/mCherry‐positive when at autophagosomes and GFP‐negative/mCherry‐positive at autolysosomes. This analysis revealed that INPP4B shRNA depletion increased LC3 biosensor association at autophagosomes, coupled with a decrease at autolysosomes, in growth media but not EBSS‐treated cells (Appendix Fig S1I–K). Taken together this data are consistent with an interpretation that INPP4B is required for basal autophagic degradation.
Growth factor stimulation activates PI3Kα signaling, which generates PI(3,4,5)P3 and subsequently PI(3,4)P2 that is hydrolyzed by INPP4B to PI(3)P (Rodgers et al, 2021). As INPP4B promotes autophagosome turnover during nutrient‐rich but not starvation conditions, we predicted that INPP4B regulation of basal autophagy requires PI3Kα signaling. Treatment with the PI3Kα inhibitor BYL719, which suppressed AKT/mTOR signaling, had little effect on LC3B levels in GFP‐vector cells but significantly increased the reduced LC3B‐II in GFP‐INPP4B cells (Fig 1L and M), suggesting that INPP4B‐generated PI(3)P promotes autophagosome turnover downstream of PI3Kα. PI(3)P is also generated on omegasomes by Vps34, stimulating autophagosome formation during starvation‐induced autophagy by recruiting the PI(3)P effector WIPI2 (Axe et al, 2008; Polson et al, 2010; Russell et al, 2013; Dooley et al, 2014). However, our data indicates INPP4B‐generated PI(3)P did not affect autophagosome formation, and had no effect on the number of WIPI2‐positive omegasomes under growth or starvation conditions (Appendix Fig S1L and M). Additionally, treatment with the Vps34 inhibitor SAR405, which suppresses autophagosome formation during starvation‐induced autophagy (Ronan et al, 2014), had no further effect on the reduced LC3B‐II levels in GFP‐INPP4B cells under basal autophagy conditions (Fig 1N and O). Altogether, our findings are consistent with a model whereby INPP4B‐generated PI(3)P promotes PI3Kα‐dependent basal autophagic degradation independent of Vps34‐generated PI(3)P.
INPP4B‐generated PI(3)P on late endosomes is retained on endolysosomes
To determine how INPP4B promotes basal autophagy, the intracellular site of INPP4B‐mediated PI(3)P generation was analyzed. INPP4B exhibits a diffusely cytosolic distribution, but has also been identified on early and late endosomes where it converts PI(3,4)P2 to PI(3)P downstream of class I PI3K signaling (Li Chew et al, 2015; Liu et al, 2018; Rodgers et al, 2021). Interestingly, both PI(3,4)P2 and PI(3)P have been identified on lysosomes (Munson et al, 2015; Marat et al, 2017). Autophagosomes accumulate if lysosome function is impaired (McGrath et al, 2021). Therefore, we predicted that the deficit observed in autophagosome turnover with INPP4B depletion may be a consequence of an inability to regulate PI(3,4)P2 to PI(3)P conversion on lysosomes and thereby sustain lysosome homeostasis. To examine this possibility, PI(3)P was assessed under growth conditions using the 2xFYVE recombinant PI(3)P biosensor (Gillooly et al, 2000). INPP4B shRNA depletion significantly reduced the proportion of PI(3)P‐positive lysosomes (Fig 2A and B), suggesting that INPP4B contributes to PI(3)P generation on this compartment. To assess whether INPP4B itself localizes to lysosomes, cells were pretreated with saponin in order to remove cytoplasmic and retain intracellular membrane‐associated proteins (Figs 2C and EV1A). Extensive INPP4B co‐localization with CD63‐positive late endosomes was observed under these conditions, as previously reported (Rodgers et al, 2021), but surprisingly no co‐localization between INPP4B and LAMP1‐positive lysosomes was apparent. These findings indicate INPP4B contributes to PI(3)P generation on lysosomes, but does not itself localize to this compartment.
Figure 2. INPP4B‐generated PI(3)P on late endosomes is retained on endolysosomes.

-
A, BMCF‐7 cells expressing nontargeted (NT), INPP4B #1, or INPP4B #2 shRNA were fixed and immunostained with recombinant GST‐2xFYVEHrs (2xFYVE) (PI(3)P probe) and LAMP2 antibodies, and co‐stained with DAPI (A). Data represent the proportion of PI(3)P+ lysosomes (n = 3 experiments, > 40 cells/experiment) (B). Arrows indicate co‐localization between 2xFYVE and LAMP2.
-
CMCF‐7 cells were treated with 0.02% (w/v) saponin for 30 s, then fixed and immunostained with INPP4B and either LAMP1 or CD63 antibodies, and co‐stained with DAPI. Arrows indicate co‐localization between INPP4B and CD63.
-
D, EMCF‐7 cells co‐expressing GFP‐INPP4B or GFP‐vector, and Hrs or NT shRNA, were fixed and immunostained with recombinant 2xFYVE (PI(3)P probe) and LAMP2 antibodies, and co‐stained with DAPI (D). Data represent the proportion of PI(3)P+ lysosomes (n = 3 experiments, > 30 cells/experiment) (E). Arrows indicate co‐localization between 2xFYVE and LAMP2.
-
F, GMCF‐7 cells co‐expressing GFP‐INPP4B or GFP‐vector, and Hrs or NT shRNA, were fixed and immunostained with recombinant 2xFYVE (PI(3)P probe) and CD63 antibodies, and co‐stained with DAPI (F). Data represent the proportion of PI(3)P+ late endosomes (n = 3 experiments, > 30 cells/experiment) (G). Arrows indicate co‐localization between 2xFYVE and LAMP2.
-
H, IMCF‐7 cells co‐expressing GFP‐INPP4B or GFP‐vector, and Hrs or NT shRNA, were lysed and immunoblotted with LC3B antibodies, and GAPDH antibodies as a loading control (H). Data represent the relative LC3B‐II levels normalized to GAPDH, and expressed relative to GFP‐vector; NT shRNA cells which were assigned an arbitrary value of 1 (n = 3 experiments) (I).
-
JINPP4B generates PI(3)P on late endosomes, which is retained on endolysosomes following late endosome maturation.
Data information: Data are presented as mean ± SD. The insets at the lower right or bottom of each image are higher power regions of the boxed areas. Scale bar is 10 μm in (A, C, D, F). P values determined by one‐way ANOVA with Tukey post hoc test in (B, E, G), or by one‐way ANOVA in (I).
Source data are available online for this figure.
Figure EV1. INPP4B does not affect amphisome formation.

-
AMCF‐7 cells were fixed and immunostained with INPP4B and either LAMP1 or CD63 antibodies, and co‐stained with DAPI.
-
B, CMCF‐7 cells expressing GFP‐INPP4B or GFP‐vector were transduced with lentiviral particles encoding nontargeted (NT) or Hrs shRNA. Cells were lysed and immunoblotted with Hrs antibodies, and GAPDH antibodies as a loading control (B). Data represent the relative Hrs levels normalized to GAPDH expression, and expressed relative to GFP‐vector;NT shRNA cells which were assigned an arbitrary value of 1 (n = 3 experiments) (C).
-
D, EMCF‐7 cells expressing GFP‐INPP4B or GFP‐vector were fixed and stained with CD63 and p62 antibodies, and co‐stained with DAPI (D). Data represent the number of late endosomes (CD63+/p62− puncta) and amphisomes (CD63+/p62+ puncta) per cell (n = 3 experiments, > 50 cells/experiment) (E). Arrows indicate amphisomes.
Data information: Data are presented as mean ± SD. The insets at the lower right of each image are higher power regions of the boxed areas. Scale bar is 10 μm in (A, D). P values determined by one‐way ANOVA with Tukey post hoc test in (C, E).
Source data are available online for this figure.
We recently reported that INPP4B promotes late endosome/lysosome formation via the PI(3)P‐binding endosomal sorting complex required for transport (ESCRT) protein, Hrs (Rodgers et al, 2021). ESCRT regulates the formation of intraluminal vesicles (ILVs) to promote maturation of late endosomes, which is in turn required for the subsequent fusion of late endosomes with lysosomes to form endolysosomes that degrade endocytic cargo (Bache et al, 2006; Malerød et al, 2007; Urwin et al, 2010). Interestingly, ESCRT inactivation also leads to autophagosome accumulation by unknown mechanisms (Filimonenko et al, 2007; Rusten et al, 2007), reminiscent of the effects we observed with INPP4B depletion. We hypothesized that PI(3)P generated by INPP4B on late endosomes may be retained upon endosome maturation to endolysosomes contributing to autophagic degradation. Suppression of late endosome maturation via Hrs shRNA depletion (Fig EV1B and C) significantly reduced PI(3)P‐positive lysosomes, and increased PI(3)P‐positive late endosomes, in both GFP‐INPP4B and vector control cells (Fig 2D–G). This data suggests that PI(3)P generated by INPP4B on late endosomes persists on endolysosomes following late endosome maturation. Furthermore, Hrs shRNA depletion modestly increased LC3B‐II in GFP‐vector cells, and restored the reduced LC3B‐II observed in GFP‐INPP4B expressing cells under growth conditions (Fig 2H and I). Therefore, we propose that INPP4B‐derived PI(3)P on lysosomes is required for autophagic degradation, events blocked by preventing endosome maturation to endolysosomes (Fig 2J). Late endosomes can also fuse with autophagosomes in some cells to form amphisomes, a hybrid compartment that facilitates degradation of endocytic and autophagic cargo (Zhao et al, 2021). However, we observed very few CD63‐positive/p62‐positive amphisomes in control or GFP‐INPP4B expressing cells (Fig EV1D and E), suggesting no influence on autophagic flux via amphisome formation.
INPP4B promotes PI3Kα‐dependent lysosome formation
As autophagosomes accumulate with INPP4B depletion, together with a reduction of autophagosome–lysosome fusion, we questioned whether PI(3)P generated by INPP4B under basal autophagy conditions is required for lysosome homeostasis. Strikingly, GFP‐INPP4B significantly increased, whereas INPP4B shRNA or siRNA depleted, the number of LAMP1 and LAMP2‐positive lysosomes in MCF‐7 and HeLa cells (Figs 3A and B, and EV2A–D), suggesting that INPP4B regulates lysosome numbers in multiple cell types. Expression of HA‐INPP4BWT, but not PI(3,4)P2 phosphatase‐dead HA‐INPP4BC842A, also increased the number of LAMP2‐positive lysosomes in MCF‐7 cells (Fig EV2E and F), consistent with a requirement for INPP4B‐mediated PI(3,4)P2 to PI(3)P conversion. Critically, inhibition of late endosome maturation via Hrs shRNA depletion decreased INPP4B‐mediated enhanced lysosome numbers (Fig EV2G and H). INPP4B also enhanced lysosomal activity as assessed by Magic Red™ cathepsin B staining (Fig 3C and D). However, we did not observe any overt changes to lysosome size or positioning in cells with INPP4B overexpression or shRNA depletion, which we confirmed by super resolution microscopy imaging and analysis (Fig EV2I–M). Collectively, our results reveal that INPP4B‐generated PI(3)P enhances lysosome formation, a function reliant on the maturation of endosomes to endolysosomes.
Figure 3. INPP4B promotes PI3Kα‐dependent lysosome formation.

-
A, BMCF‐7 cells expressing GFP‐INPP4B or GFP‐vector were fixed and immunostained with LAMP1 or LAMP2 antibodies, and co‐stained with DAPI and phalloidin (A). Data represent the number of LAMP1+ or LAMP2+ puncta relative to cell area (μm2) (n = 3 experiments, > 50 cells/experiment) (B).
-
C, DSnapshots of Magic Red™ (MR) cathepsin B substrate and Hoechst 33342 captured in live MCF‐7 cells expressing GFP‐INPP4B or GFP‐vector (C). Data represent the number of MR cathepsin B+ puncta per cell (n = 3 experiments, > 50 cells/experiment) (D).
-
E, FMCF‐7 cells expressing nontargeted (NT) or INPP4B #1 shRNA were cultured in growth media or EBSS for the indicated times, then fixed and immunostained with LAMP1 antibodies and co‐stained with DAPI and phalloidin (E). Data represent the number of LAMP1+ puncta relative to cell area (μm2) (n = 3 experiments, > 30 cells per experiment) (F).
-
G, HMCF‐7 cells expressing GFP‐INPP4B or GFP‐vector were transfected with NT, PIK3CA #1, or PIK3CA #2 siRNA. After 24 h, cells were fixed and immunostained with LAMP1 antibodies, and co‐stained with DAPI and phalloidin (G). Data represent the number of LAMP1+ puncta relative to cell area (μm2) (n = 3 experiments, > 40 cells per experiment) (H).
Data information: Data are presented as mean ± SD. Scale bar is 10 μm in (A, C, E, G). P values determined by two‐tailed unpaired t test in (B, D), by one‐way ANOVA with Tukey post hoc test in (F), or by one‐way ANOVA in (H).
Source data are available online for this figure.
Figure EV2. INPP4B does not affect lysosome size or dispersion.

-
A, BMCF‐7 cells expressing nontargeted (NT), INPP4B #1, or INPP4B #2 shRNA were fixed and immunostained with LAMP1 antibodies, and co‐stained with DAPI and phalloidin (A). Data represent the number of LAMP1+ puncta relative to cell area (μm2) (n = 3 experiments, > 50 cells/experiment) (B).
-
C, DHeLa cells were transfected with NT or INPP4B siRNA. After 24 h, cells were fixed and immunostained with LAMP2 antibodies, and co‐stained with DAPI and phalloidin (C). Data represent the number of LAMP2+ puncta relative to cell area (μm2) (n = 3 experiments, > 50 cells/experiment) (D).
-
E, FMCF‐7 cells were transfected with HA‐vector, HA‐INPP4B,WT or HA‐INPP4BC842A. Forty‐eight hours later, cells were fixed and immunostained with LAMP2 antibodies, and co‐stained with DAPI and phalloidin (E). Data represent the number of LAMP2+ puncta relative to cell area (μm2) (n = 3 experiments, > 20 cells/experiment) (F).
-
G, HMCF‐7 cells co‐expressing GFP‐INPP4B or GFP‐vector, and Hrs or NT shRNA, were fixed and immunostained with LAMP1 antibodies, and co‐stained with DAPI and phalloidin (G). Data represent the number of LAMP1+ puncta relative to cell area (μm2) (n = 3 experiments, > 40 cells per experiment) (H).
-
I–KMCF‐7 cells expressing GFP‐INPP4B or GFP‐vector were fixed and immunostained with LAMP1 antibodies, and imaged using super resolution microscopy (I). Data represent the LAMP1+ puncta size (J) and LAMP1+ puncta size distribution (K) (n = 3 experiments, > 20 cells/experiment).
-
L, MData represent the distance of LAMP1+ puncta from the center of the nucleus (L), and the proportion of perinuclear LAMP1+ puncta (< 15 μm from center of nucleus) and peripheral LAMP1+ puncta (> 15 μm from center of nucleus) (M) (n = 3 experiments, > 20 cells/experiment).
-
NMCF‐7 cells expressing GFP‐INPP4B or GFP‐vector were transfected with NT, PIK3CA #1, or PIK3CA #2 siRNA. After 24 h, cells were lysed and immunoblotted with PI3K p110α antibodies, and GAPDH antibodies as a loading control.
-
O, PMCF‐7 cells expressing GFP‐INPP4B or GFP‐vector were treated with 2 μM BYL719 (PI3Kα inhibitor) or DMSO as a vehicle control for 24 h, then fixed and immunostained with LAMP1 antibodies, and co‐stained with DAPI and phalloidin (O). Data represent the number of LAMP1+ puncta relative to cell area (μm2) (n = 3 experiments, > 50 cells per experiment) (P).
Data information: Data are presented as mean ± SD. The insets at the bottom of each image are higher power regions of the boxed areas. Scale bar is 10 μm in (A, C, E, G, I, O). P values determined by one‐way ANOVA with Tukey post hoc test in (B, F, P), by two‐tailed unpaired t test in (D), or by one‐way ANOVA in (H).
Source data are available online for this figure.
As INPP4B enhanced autophagic degradation under growth conditions but not following nutrient deprivation, we examined whether INPP4B regulation of lysosome formation was also restricted to growth conditions. Interestingly, although INPP4B shRNA depletion reduced lysosome numbers under growth conditions, this had little effect on lysosome numbers following prolonged nutrient deprivation (Fig 3E and F), revealing INPP4B regulation of lysosome formation and autophagic flux requires high nutrient availability. PI3Kα is a heterodimer consisting of a catalytic p110α subunit and a p85 regulatory subunit that is activated by growth factor stimulation. To investigate dependence on PI3Kα, we performed siRNA depletion of PIK3CA, which encodes the p110α catalytic subunit of PI3Kα, or treated cells with the PI3Kα inhibitor BYL719 (Fig EV2N). PIK3CA depletion or BYL719 treatment significantly reduced the increased number of lysosomes in GFP‐INPP4B cells under nutrient‐rich conditions (Figs 3G and H, and EV2O and P). Therefore, we propose that INPP4B‐generated PI(3)P promotes lysosome formation downstream of PI3Kα signaling under nutrient‐rich conditions, leading to enhanced basal autophagic flux.
INPP4B enhances lysosome reformation from endolysosomes
To determine how INPP4B‐generated PI(3)P promotes lysosome formation, we investigated whether INPP4B regulates known lysosome biogenesis pathways. Inactivation of lysosome‐associated mTOR by nutrient depletion promotes TFEB/TFE3 nuclear translocation and lysosomal gene transcription, leading to de novo lysosome biogenesis (Settembre et al, 2011, 2012). PI(3,4)P2 is required for activation of AKT/mTOR signaling (Gewinner et al, 2009; Fedele et al, 2010), whereas PI(3)P is required for localized mTOR activation on lysosomes (Nobukuni et al, 2005; Hong et al, 2017). We therefore examined whether INPP4B regulates lysosome biogenesis via mTOR regulation, which was assessed basally under growth media conditions or with EBSS ± serum stimulation to suppress and reactivate mTOR, respectively. INPP4B modestly suppressed phosphorylation‐dependent activation of AKTS473 and the mTOR substrate S6KT389 under growth conditions (Fig EV3A–C) as previously reported (Gewinner et al, 2009; Fedele et al, 2010), but had no effect on localized mTORS2448 phosphorylation on lysosomes (Fig EV3D and E). Furthermore, INPP4B did not alter the expression of TFEB/TFE3 target genes, including LAMP1, ATP6V1C1, ATP6VOD1, CTNS, TPP1, or M6PR, under growth or starvation conditions (Fig EV3F). Taken together, these findings indicate that although INPP4B modestly suppresses AKT and mTOR activation, this is insufficient to stimulate de novo lysosome biogenesis.
Figure EV3. INPP4B does not regulate mTOR‐dependent lysosome biogenesis.

-
A–CMCF‐7 cells expressing GFP‐INPP4B or GFP‐vector were cultured in growth media, EBSS (4 h), or EBSS (4 h) followed by 10% FCS (30 min). Cells were lysed and immunblotted with pAKTS473, AKT(pan), pS6KT389, and S6K antibodies, and GAPDH antibodies as a loading control (A). Data represent the relative pAKTS473 levels normalized to AKT(pan) (B) or pS6KT389 levels normalized to S6K (C), and expressed relative to growth media‐treated GFP‐vector cells which were assigned an arbitrary value of 1 (n = 3 experiments).
-
D, EMCF‐7 cells expressing GFP‐INPP4B or GFP‐vector were cultured in growth media, EBSS (4 h) or EBSS (4 h) followed by 10% FCS (30 min). Cells were fixed and immunostained with pmTORS2448 and LAMP1 antibodies, and co‐stained with DAPI (D). Data represent mean pmTORS2448 fluorescence intensity overlapping with LAMP1+ puncta expressed relative to growth media‐treated GFP‐vector cells which were assigned an arbitrary value of 1 (n = 3 experiments) (E).
-
FMCF‐7 cells expressing GFP‐INPP4B or GFP‐vector were cultured in growth media or EBSS for 4 h. RNA was extracted and two‐step quantitative RT‐PCR was performed using primers for LAMP1, ATP6V1C1, ATP6V0D1, CTNS, TPP1, or M6PR, and expression was normalized to ACTB. Expression was determined using the ΔΔCt method and expressed relative to growth media‐treated GFP‐vector cells, which were assigned an arbitrary value of 1 (n = 3 experiments).
Data information: Data are presented as mean ± SD. The insets at the bottom of each image are higher power regions of the boxed areas. Scale bar is 10 μm in (D). P values determined by two‐way ANOVA in (B, C, F).
Source data are available online for this figure.
An alternate mechanism for lysosome generation is via lysosome reformation pathways that regenerate new lysosomes from existing autolysosomal or endolysosomal membranes under specific cellular conditions. ALR mediates lysosome repopulation during prolonged starvation‐induced autophagy but this process is inactive under growth conditions (Yu et al, 2010). Instead, lysosomes are generated by tubulation and scission of endolysosome membranes via a process known as lysosome reformation from endolysosomes (Pryor et al, 2000; Bright et al, 2005). However, it has not been reported whether lysosome reformation from endolysosomes affects autophagy. Lysosomes that are newly formed via reformation from endolysosomes are called terminal storage lysosomes, which do not contain active hydrolases and can be distinguished from endolysosomes, which contain active hydrolases (Bright et al, 2016). Interestingly, INPP4B siRNA depletion significantly reduced the number of terminal storage lysosomes (LAMP1‐positive, Magic Red™ cathepsin B‐negative; Fig 4A and B). We therefore questioned whether INPP4B‐mediated PI(3,4)P2 to PI(3)P conversion contributes to lysosome reformation from endolysosomes. Quantitative analysis of lysosome reformation events has been a significant challenge as the timing of endolysosome tubule budding and separation occurs within several seconds (Bissig et al, 2017). To address this, we developed a rapid imaging and analysis workflow to identify and quantify lysosome reformation events in live cells. This analysis used spinning disk microscopy of live MCF‐7 cells expressing GFP‐INPP4B or GFP‐vector to capture reformation of LAMP1‐mCherry‐positive lysosomes under growth conditions (Fig 4C, Movies EV1 and EV2). Two distinct lysosome populations were observed; larger, slower moving lysosomes that underwent reformation, and smaller, faster moving lysosomes that did not appear to undergo reformation, although these lysosomes were difficult to individually track across the entire time‐lapse as they frequently moved outside the focal plane. To quantify the relative rate of lysosome reformation, kymographs of the larger, slow‐moving lysosomes were constructed and converted to “skeletons” to identify branch points corresponding to lysosomal tubulation and fission events (Fig 4D and Appendix Fig S2A–E). Strikingly, this analysis revealed an increased number of lysosome reformation events per minute in GFP‐INPP4B compared to vector control cells (Fig 4E), suggesting that INPP4B enhances lysosome numbers by increasing the rate of lysosome reformation.
Figure 4. INPP4B promotes lysosome reformation.

-
A, BSnapshots of LAMP1‐GFP, Magic Red™ (MR) cathepsin B substrate, and Hoechst 33342 captured in live HeLa cells transfected with INPP4B or nontargeted siRNA (A). Data represent the number of LAMP1+/MR cathepsin B+ and LAMP1+/MR cathepsin B− lysosomes (terminal storage lysosomes) per cell (n = 3 experiments, > 50 cells/experiment) (B). Yellow arrows indicate LAMP1+/MR cathepsin B+ lysosomes, and white arrows indicate terminal storage lysosomes.
-
CTimelapse snapshots of LAMP1‐mCherry signals from MCF‐7 cells expressing GFP‐INPP4B or GFP‐vector captured by spinning disk microscopy. Maximum intensity projections of three z‐planes taken 0.27 μm apart are shown. Arrows indicate lysosome reformation.
-
DOverview of analysis workflow used to quantify lysosome reformation from spinning disk microscopy. Maximum intensity projections of lysosomes were converted to three‐dimensional kymographs using x, y, and time dimensions, then segmented and skeletonized to track tubulation and fission events (depicted in red) that branch off the parent lysosome (depicted in black).
-
EData represent the number of LAMP1+ reformation events per cell per minute (n = 12 GFP‐vector cells, n = 15 GFP‐INPP4B cells).
Data information: Data are presented as mean ± SD. The insets at the lower right of each image are higher power regions of the boxed areas. Scale bar is 10 μm in (A, C). P values determined by two‐way ANOVA with Holm–Sidak post‐hoc test in (B), or by two‐tailed unpaired t test in (E).
Source data are available online for this figure.
INPP4B‐generated PI(3)P is phosphorylated to PI(3,5)P2 by PIKfyve to promote lysosome reformation
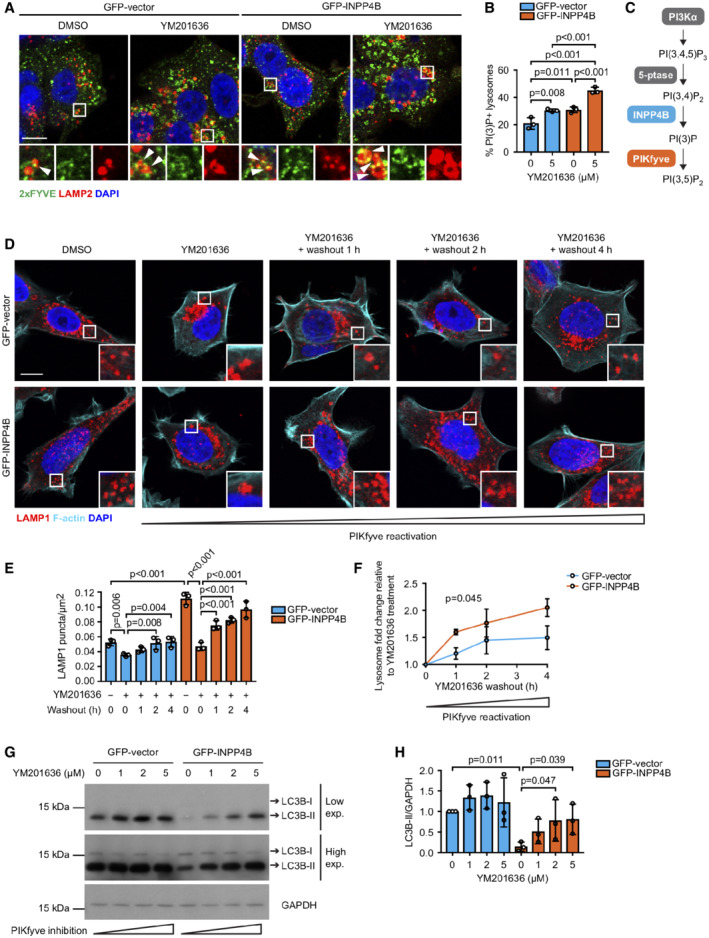
The molecular pathway that directs lysosome reformation from endolysosomes is not well understood, however, several reports show a requirement for localized PI(3,5)P2 generation on endolysosomes (Bissig et al, 2017; Choy et al, 2018). All cellular PI(3,5)P2 is synthesized from PI(3)P by the PI(3)P 5‐kinase PIKfyve, in complex with the scaffold protein Vac14 and the lipid/protein phosphatase Fig4 (Zolov et al, 2012; Lees et al, 2020). PI(3,5)P2 depletion via PIKfyve inactivation suppresses lysosome reformation from endolysosomes leading to fewer and swollen lysosomes (Bissig et al, 2017; Choy et al, 2018). We hypothesized that INPP4B conversion of PI(3,4)P2 to PI(3)P, the latter being retained on endolysosomes, may provide a substrate for PIKfyve to generate PI(3,5)P2 that drives lysosome reformation. Currently available PI(3,5)P2 probes display poor selectivity (Hammond et al, 2015). Therefore, we imaged PI(3)P in the presence of the PIKfyve inhibitor, YM201636, as an indirect measure of PI(3)P conversion to PI(3,5)P2. YM201636 treatment increased the proportion of lysosomes with PI(3)P‐positive staining, revealing its conversion to PI(3,5)P2 was blocked. PI(3)P was further increased by concurrent GFP‐INPP4B expression (Fig 5A and B), indicating that INPP4B‐generated PI(3)P acts as a substrate for PIKfyve to form PI(3,5)P2 (Fig 5C).
Figure 5. INPP4B promotes PIKfyve‐dependent lysosome reformation and autophagic flux.
-
A, BMCF‐7 cells expressing GFP‐INPP4B or GFP‐vector were treated with 5 μM YM201636 (PIKfyve inhibitor) or DMSO as a vehicle control for 2 h. Cells were fixed and immunostained with recombinant GST‐2xFYVEHrs (2xFYVE) (PI(3)P probe) and LAMP2 antibodies, and co‐stained with DAPI (A). Data represent the proportion of PI(3)P+ lysosomes (n = 3 experiments, > 30 cells/experiment) (B). Arrows show co‐localization between 2xFYVE and LAMP2.
-
CINPP4B generates PI(3)P downstream of PI3Kα signaling, which is predicted to act as a substrate for phosphorylation to PI(3,5)P2 by PIKfyve.
-
D–FMCF‐7 cells expressing GFP‐INPP4B or GFP‐vector were treated with 5 μM YM201636 (PIKfyve inhibitor) or DMSO as a vehicle control for 2 h, then YM201636 was washed out for 1, 2, or 4 h. Cells were fixed and immunostained with LAMP1 antibodies, and co‐stained with DAPI and phalloidin (D). Data represent the number of LAMP1+ puncta relative to cell area (μm2) (E), and the lysosome fold change relative to the YM201636‐treated condition for each cell line (F) (n = 3 experiments, > 30 cells per experiment).
-
G, HMCF‐7 cells expressing GFP‐INPP4B or GFP‐vector were treated with 1, 2, or 5 μM YM201636 (PIKfyve inhibitor) or DMSO as a vehicle control for 4 h. Cells were lysed and immunoblotted with LC3B antibodies, and GAPDH antibodies as a loading control (G). Data represent the relative LC3B‐II levels normalized to GAPDH, and expressed relative to DMSO‐treated GFP‐vector cells which were assigned an arbitrary value of 1 (n = 3 experiments) (H).
Data information: Data are presented as mean ± SD. The insets at the lower right or bottom of each image are higher power regions of the boxed areas. Scale bar is 10 μm in (A, D). P values determined by one‐way ANOVA in (B, E, H), or by two‐tailed unpaired t test of the area under the curve in (F).
Source data are available online for this figure.
To determine whether INPP4B‐mediated lysosome reformation is dependent on PIKfyve conversion of PI(3)P to PI(3,5)P2, lysosome numbers were examined under conditions of PIKfyve inactivation. PIKFYVE siRNA depletion significantly reduced lysosome numbers in GFP‐INPP4B expressing cells, but had minimal effect on GFP‐vector controls, possibly as only a partial reduction in PIKFYVE mRNA expression was achieved (Fig EV4A–C). However, more robust effects were observed with YM201636 treatment, which resulted in significantly fewer and swollen lysosomes in both GFP‐INPP4B and GFP‐vector cells consistent with inhibition of lysosome reformation (Fig EV4D and E). As YM201636 inhibitor effects are reversible (Jefferies et al, 2008; Bissig et al, 2017), we also performed YM201636 washout experiments to assess if INPP4B enhances the rate of lysosome reformation under conditions of PIKfyve reactivation. Lysosome numbers were reduced in both GFP‐INPP4B and GFP‐vector cells with YM201636 treatment, and recovered after 4 h of YM201636 washout (Fig 5D and E). Notably, lysosome regeneration following PIKfyve reactivation occurred at a significantly faster rate in GFP‐INPP4B cells compared to vector controls (Fig 5F), consistent with the contention that INPP4B enhances lysosome reformation by supplying PI(3)P as a substrate for PIKfyve‐mediated PI(3,5)P2 generation. Furthermore, YM201636 treatment rescued the decreased LC3B‐II observed in GFP‐INPP4B cells (Fig 5G and H), suggesting that INPP4B promotes basal autophagic flux via enhanced PIKfyve‐dependent lysosome reformation.
Figure EV4. INPP4B promotes PIKfyve‐dependent lysosome reformation.

-
AMCF‐7 cells expressing GFP‐INPP4B or GFP‐vector were transfected with nontargeted (NT), PIKFYVE #1, or PIKFYVE #2 siRNA. After 24 h, RNA was extracted and two‐step quantitative RT‐PCR was performed using primers for PIKFYVE, and expression was normalized to ACTB. Expression was determined using the ΔΔCt method and expressed relative to GFP‐vector;NT siRNA cells which were assigned an arbitrary value of 1 (n = 3 experiments).
-
B, CMCF‐7 cells expressing GFP‐INPP4B or GFP‐vector were transfected with NT, PIKFYVE #1, or PIKFYVE #2 siRNA. After 24 h, cells were fixed and immunostained with LAMP2 antibodies, and co‐stained with DAPI and phalloidin (B). Data represent the number of LAMP2+ puncta relative to cell area (μm2) (n = 3 experiments, > 40 cells per experiment) (C).
-
D, EMCF‐7 cells expressing GFP‐INPP4B or GFP‐vector were treated with 2 or 5 μM YM201636 (PIKfyve inhibitor) or DMSO as a vehicle control for 4 h. Cells were fixed and immunostained with LAMP1 antibodies, and co‐stained with DAPI and phalloidin (D). Data represent the number of LAMP1+ puncta relative to cell area (μm2) (n = 3 experiments, > 30 cells/experiment) (E).
Data information: Data are presented as mean ± SD. The insets at the lower right of each image are higher power regions of the boxed areas. Scale bar is 10 μm in (B, D). P values determined by one‐way ANOVA with Tukey post hoc test in (A, C), or by one‐way ANOVA in (E).
Source data are available online for this figure.
SNX2 is a PI(3,5)P2 effector that promotes lysosome reformation
The membrane‐associated molecular machinery that facilitates lysosome reformation from endolysosomes remains largely unknown. The PI(3,5)P2‐binding calcium channel protein, TRPML1, is the only described effector of lysosome reformation from endolysosomes, which is required for scission of endolysosome tubules (Miller et al, 2015). However, there are likely to be unidentified factors that co‐ordinate the initial budding and extension of endolysosome tubules. Interestingly, sorting nexin (SNX) proteins SNX1 and SNX2 contain a PI(3,5)P2‐binding phox homology (PX) domain, and a functional bin‐amphiphysin‐rvs (BAR) domain that detects and promotes membrane curvature (Cozier et al, 2002; Carlton et al, 2005). SNX1 and SNX2 form part of the retromer complex that regulates endosome‐to‐Golgi transport, but also possess in vitro membrane tubulation activity (van Weering et al, 2012), suggesting the potential to intrinsically regulate membrane deformation events. SNX1 and SNX2 were also identified in PI(3,5)P2 interactomes as well as Fig4 and Vac14 proximity interactomes (Catimel et al, 2008; Qiu et al, 2021), consistent with an association with the PIKfyve complex, but their function in this context has not been reported. We therefore investigated whether SNX1 or SNX2 function as PI(3,5)P2 effectors of lysosome reformation from endolysosomes. Lysosome numbers were assessed under growth conditions in GFP‐INPP4B or GFP‐vector cells with concurrent SNX1 or SNX2 siRNA depletion (Fig 6A and B, and Appendix Fig S3A and B). SNX1 depletion had little impact on lysosomes. In contrast, SNX2 depletion significantly reduced lysosome numbers in GFP‐INPP4B and GFP‐vector cells and lysosomes also appeared swollen, reminiscent of PIKfyve inhibition, suggesting that SNX2 is a potential effector of lysosome reformation. To exclude off‐target effects of SNX2 siRNA, we also found that siRNAs targeting the 3'‐UTR region of SNX2 reduced lysosome numbers, and this effect was reversed by co‐expression of recombinant GFP‐SNX2 (Appendix Fig S3C–G).
Figure 6. SNX2 is a putative PI(3,5)P2 effector that promotes lysosome reformation.

-
A, BMCF‐7 cells expressing GFP‐INPP4B or GFP‐vector were transfected with nontargeted (NT), SNX1, or SNX2 siRNA. After 24 h, cells were fixed and immunostained with LAMP2 antibodies, and co‐stained with DAPI and phalloidin (A). Data represent the number of LAMP2+ puncta relative to cell area (μm2; n = 3 experiments, > 40 cells per experiment) (B).
-
CTimelapse snapshots of LAMP1‐mCherry and GFP‐SNX2 signals from MCF‐7 cells captured by spinning disk microscopy. Maximum intensity projections of two z‐planes taken 0.27 μm apart are shown.
-
D, EMCF‐7 cells expressing GFP‐INPP4B or GFP‐vector were treated with 5 μM YM201636 (PIKfyve inhibitor) for 2 h, then YM201636 was washed out for 1 h. Cells were fixed and immunostained with SNX2 and LAMP1 antibodies, and co‐stained with DAPI (D). Data represent the proportion of SNX2+ LAMP2 puncta (n = 3 experiments, > 40 cells/experiment) (E). Arrows show co‐localization between SNX2 and LAMP2.
-
FHeLa cells were transfected with GFP‐SNX2. After 24 h, cells were treated with 5 μM YM201636 (PIKfyve inhibitor) for 2 h, then YM201636 was washed out for 1 h. Cells were fixed and subjected to immuno‐electron microscopy analysis using GFP (10 nm) antibodies. Arrows show GFP‐SNX2 localization on a lysosome.
-
GHeLa cells were transfected with GFP‐PIKfyve. After 24 h, cells were treated with 5 μM YM201636 (PIKfyve inhibitor) for 2 h, then YM201636 was washed out for 1 h. Cells were fixed and immunostained with SNX2, GFP, and LAMP2 antibodies, and imaged using super resolution microscopy. Arrows show co‐localization between GFP‐PIKfyve, SNX2, and LAMP2.
-
HMCF‐7 cells expressing LAMP1‐mCherry were transfected with NT or SNX2 siRNA. After 24 h, cells were imaged by spinning disk microscopy for 20 min. Representative time‐lapse snapshots of LAMP1‐mCherry from a maximum projection of three z‐planes taken 0.27 μm apart are shown. Arrow indicates lysosome reformation.
-
IData represent the number of LAMP1+ reformation events per cell per minute (n = 21 NT siRNA cells, n = 27 SNX2 siRNA cells).
Data information: Data are presented as mean ± SD. The insets at the lower right or bottom of each image are higher power regions of the boxed areas. Scale bar is 10 μm in (A, C, D, G, H), and 100 nm in (F). P values determined by one‐way ANOVA in with Tukey post hoc test in (B, E), or by two‐tailed unpaired t test in (I).
Source data are available online for this figure.
SNX2 is predominantly recruited to early endosomes by PI(3)P where it regulates retromer‐dependent trafficking, but interestingly, SNX2 binds with similar affinity to PI(3,5)P2 and a minor pool of SNX2 localizes to lysosomes under growth conditions (Carlton et al, 2005; Mellado et al, 2014). Spinning disk microscopy revealed that GFP‐SNX2 co‐localized with LAMP1‐mCherry‐positive lysosomes undergoing reformation in live cells (Fig 6C). We determined whether SNX2 is recruited to lysosomes in response to PIKfyve‐generated PI(3,5)P2 using SNX2‐specific antibodies (Appendix Fig S3H and I). Co‐localization of endogenous SNX2 with lysosomes was minimal following PIKfyve inhibition in GFP‐INPP4B and GFP‐vector control cells, however, SNX2 lysosome co‐localization significantly increased following PIKfyve reactivation (Fig 6D and E), suggesting that SNX2 is recruited to lysosomes in a PI(3,5)P2‐dependent manner. This was confirmed by immuno‐electron microscopy, which demonstrated that a pool of GFP‐SNX2 localized to lysosome membranes during PIKfyve reactivation (Fig 6F). As current PI(3,5)P2 probes display poor selectivity (Hammond et al, 2015), we assessed SNX2 co‐localization with PIKfyve, the only enzyme that synthesizes PI(3,5)P2 (Zolov et al, 2012). Super resolution microscopy revealed that SNX2 co‐localized with GFP‐PIKfyve on lysosomes during PIKfyve reactivation (Fig 6G). Together, these findings suggest that SNX2 is recruited to lysosomes by PIKfyve generation of PI(3,5)P2. In control studies, we found that PIKfyve inhibition did not affect SNX2 localization to early endosomes (Appendix Fig S3J and K). To determine whether SNX2 is required for lysosome reformation, we utilized our analysis pipeline to identify and quantify lysosome reformation events in nontargeted (NT) and SNX2 siRNA live MCF‐7 cells by spinning disk microscopy (Fig 6H, Movies EV3 and EV4). SNX2 siRNA cells exhibited a striking decrease in the number of lysosome reformation events per minute compared to NT siRNA cells (Fig 6I). Notably, lysosome tubules were rarely detected in the absence of SNX2, suggesting that SNX2 may be required for the formation of endolysosome tubules during lysosome reformation. Taken together, these findings suggest that SNX2 is recruited to lysosomes by PIKfyve‐generated PI(3,5)P2 and contributes to lysosome reformation.
INPP4B/PIKfyve‐dependent lysosome reformation protects against proteotoxic stress
Basal autophagy is critically important for maintaining cellular homeostasis, and is required for a number of cellular processes including the protein quality control pathway. During proteotoxic stress, misfolded or aggregated proteins are tagged with ubiquitin chains and are subsequently degraded either by the ubiquitin proteasome system, or larger aggregates are sequestered by autophagosomes and degraded via autophagy. Prolonged proteotoxic stress activates apoptosis and cell death, and defective proteotoxic stress responses cause cytotoxicity leading to a range of pathological conditions (Dubnikov et al, 2017). Inhibition of basal autophagy in vivo following Atg5 or Atg7 deletion results in the accumulation of ubiquitinated protein aggregates leading to cytotoxicity and neurodegenerative disease (Hara et al, 2006; Komatsu et al, 2006), highlighting the critical cytoprotective role of basal autophagy. However, whether lysosome reformation from endolysosomes contributes to protein quality control remains unclear. We therefore investigated whether INPP4B/PIKfyve regulation of lysosome reformation and basal autophagy are required for protein aggregate clearance during proteotoxic stress. Puromycin is widely used experimentally to induce proteotoxic stress by prematurely terminating protein translation leading to misfolded proteins that accumulate as ubiquitin‐tagged aggregates (Fan et al, 2010; Park et al, 2017). INPP4B siRNA depletion or YM201636 treatment significantly increased the accumulation of protein aggregates in puromycin‐treated cells (Fig 7A–D). In contrast, GFP‐INPP4B reduced protein aggregation under similar experimental conditions (Fig EV5A and B). To exclude whether this difference was due to protein aggregate clearance by the ubiquitin proteasome system, cells were also co‐treated with the proteasome inhibitor MG132. GFP‐INPP4B expression also reduced protein aggregation under these conditions (Fig EV5A and B), which was reversed by concomitant YM201636 or bafilomycin A1 treatment (Figs 7E and F, and EV5C and D). Collectively, this data indicates that INPP4B/PIKfyve regulation of lysosome reformation is required for autophagic degradation of protein aggregates. Finally, we assessed whether INPP4B/PIKfyve‐dependent lysosome reformation protects against cytotoxicity during prolonged proteotoxic stress. Critically, we found that INPP4B siRNA depletion or YM201636 treatment significantly reduced cell viability in response to puromycin treatment (Fig 7G and H). These findings suggest that INPP4B/PIKfyve‐dependent lysosome reformation is required for protein quality control, and inactivation of this pathway leads to cell death. Altogether, our findings identify a phosphoinositide conversion pathway via endosomes that is required for lysosome reformation from endolysosomes, basal autophagic flux and protection against proteotoxic stress.
Figure 7. INPP4B and PIKfyve are required for proteotoxic stress response.

-
A, BHeLa cells transfected with INPP4B or nontargeted (NT) siRNA were treated for 1 h with 5 μg/ml puromycin. Cells were fixed and immunostained with ubiquitin antibodies, and co‐stained with DAPI and phalloidin (A). Data represent the percentage of cells with ubiquitinated protein aggregates (n = 3 experiments, > 200 cells/experiment) (B).
-
C, DHeLa cells were treated with 5 μM YM201636 (PIKfyve inhibitor) or DMSO as a vehicle control for 2 h, then 5 μg/ml puromycin for 1 h. Cells were fixed and immunostained with ubiquitin antibodies, and co‐stained with DAPI and phalloidin (C). Data represent the percentage of cells with ubiquitinated protein aggregates (n = 3 experiments, > 200 cells/experiment) (D).
-
E, FMCF‐7 cells expressing GFP‐INPP4B or GFP‐vector were treated for 4 h with 10 μg/ml puromycin, 5 μm MG132, and either 5 μM YM201636 (PIKfyve inhibitor) or DMSO as a vehicle control. Cells were fixed and immunostained with ubiquitin antibodies, and co‐stained with DAPI and phalloidin (E). Data represent the percentage of cells with ubiquitinated protein aggregates (n = 3 experiments, > 200 cells/experiment) (F).
-
GHeLa cells transfected with INPP4B or NT siRNA were treated with 10 μg/ml puromycin for 2–6 h, then cell viability was assessed using CellTiter‐Glo® assays. Data represent the relative cell viability normalized to untreated cells (n = 3 experiments).
-
HHeLa cells were treated 10 μg/ml puromycin ±5 μM YM201636 (PIKfyve inhibitor) or DMSO as a vehicle control for 2–6 h, then cell viability was assessed using CellTiter‐Glo® assays. Data represent the relative cell viability normalized to untreated cells (n = 3 experiments).
Data information: Data are presented as mean ± SD. The insets at the lower right or bottom of each image are higher power regions of the boxed areas. Scale bar is 10 μm in (A, C, E). P values determined by one‐way ANOVA in with Tukey post hoc test in (B, D, F), by two‐tailed unpaired t test of the area under the curve in (G), or by one‐way ANOVA with Tukey post hoc test of the area under the curve in (H).
Source data are available online for this figure.
Figure EV5. INPP4B promotes autophagic degradation of protein aggregates during proteotoxic stress.

-
A, BMCF‐7 cells expressing GFP‐INPP4B or GFP‐vector were treated for 4 h with 10 μg/ml puromycin ±5 μm MG132 or DMSO as a vehicle control. Cells were fixed and immunostained with ubiquitin antibodies, and co‐stained with DAPI and phalloidin (A). Data represent the percentage of cells with ubiquitinated protein aggregates (n = 3 experiments, > 200 cells/experiment) (B).
-
C, DMCF‐7 cells expressing GFP‐INPP4B or GFP‐vector were treated for 4 h with 10 μg/ml of puromycin, 5 μm of MG132, and either 100 nM of bafilomycin A1 or DMSO as a vehicle control. Cells were fixed and immunostained with ubiquitin antibodies, and co‐stained with DAPI and phalloidin (C). Data represent the percentage of cells with ubiquitinated protein aggregates (n = 3 experiments, > 200 cells/experiment) (D).
Data information: Data are presented as mean ± SD. The insets at the lower right or bottom of each image are higher power regions of the boxed areas. Scale bar is 10 μm in (A, C). P values determined by one‐way ANOVA in with Tukey post hoc test in (B, D).
Source data are available online for this figure.
Discussion
Here, we identify a molecular pathway that controls lysosome repopulation during basal autophagy that is dependent on endosome maturation and lysosome reformation from endolysosomes. PI3Kα generates PI(3,4,5)P3 at the plasma membrane in response to growth factor stimulation, which is rapidly hydrolyzed to PI(3,4)P2 by inositol polyphosphate 5‐phosphatases (Rodgers et al, 2017). INPP4B dephosphorylates this PI(3,4)P2 pool to generate PI(3)P on late endosomes (Rodgers et al, 2021). Through a comprehensive and systematic examination, we show here that INPP4B‐generated PI(3)P is maintained on endolysosomes following endosome maturation and serves as a substrate for PIKfyve phosphorylation to form PI(3,5)P2. The SNX‐BAR protein, SNX2, binds PI(3,5)P2 to promote endolysosome tubule formation and lysosome reformation. This molecular pathway is required to ensure lysosome homeostasis during basal autophagy, whereby suppression of phosphoinositide conversion or endosome maturation reduces lysosome numbers and basal autophagic degradation leading to cytotoxicity during proteotoxic stress. Therefore, our data suggest a model whereby PI3Kα signaling initiates a phosphoinositide pathway under nutrient‐rich conditions, which results in PI(3)P generation on late endosomes that promotes PI(3,5)P2‐dependent lysosome repopulation during basal autophagy (Fig 8).
Figure 8. Phosphoinositide conversion via endosomes contributes to lysosome repopulation during basal autophagy.

Under nutrient‐rich conditions, PI3Kα generates PI(3,4,5)P3 at the plasma membrane, which is subsequently hydrolyzed to PI(3,4)P2 by inositol polyphosphate 5‐phosphatases. PI(3,4,5)P3 and PI(3,4)P2 recruit and activate the serine/threonine kinase AKT, which in turn activates mTORC1 to suppress autophagy. Alternatively, PI(3,4)P2 is also hydrolyzed by INPP4B on endosomes to PI(3)P, which is retained on endolysosomes following late endosome maturation. PI(3)P is then phosphorylated by PIKfyve to PI(3,5)P2, which recruits the SNX‐BAR protein SNX2 to promote lysosome reformation and basal autophagic degradation.
The contribution of the class I PI3K signaling network to autophagy is complex, with evidence that class I PI3K effector proteins can promote or suppress autophagy (Yu et al, 2015; Manning & Toker, 2017). We demonstrate class I PI3K‐dependent PI(3)P synthesis regulates autophagy in a distinct manner to the canonical Vps34‐dependent PI(3)P pathway, suggesting functional specificity between these different PI(3)P pools. Vps34‐generated PI(3)P is required for starvation‐induced autophagy by promoting autophagosome formation, recruitment of autophagic cargo, autophagosome–lysosome fusion, and the repopulation of lysosomes by ALR (Axe et al, 2008; Russell et al, 2013; Dooley et al, 2014; Munson et al, 2015). In contrast, we show that INPP4B‐generated PI(3)P downstream of PI3Kα is required for basal autophagy by promoting lysosome reformation from endolysosomes. Notably, INPP4B‐generated PI(3)P is dispensable during starvation‐induced autophagy where PI3Kα activation is minimal (Manning & Toker, 2017; Rodgers et al, 2017). All cellular PI(3,5)P2 is generated via PI(3)P phosphorylation by the PIKfyve complex, which contains the catalytic 5‐kinase PIKfyve and two regulatory components, the lipid/protein phosphatase Fig4 and the scaffold protein Vac14 (Zolov et al, 2012; Lees et al, 2020). PI(3)P to PI(3,5)P2 conversion by the PIKfyve complex is required for multiple intracellular trafficking events including endosomal sorting, endosome‐to‐Golgi transport, and lysosome reformation (Rutherford et al, 2006; Jefferies et al, 2008; Bissig et al, 2017; Choy et al, 2018). Although a large proportion of the PI(3)P substrate for PIKfyve is synthesized by class III PI3K, there is a distinct Vps34‐independent PI(3)P substrate pool derived from class I PI3K (Ikonomov et al, 2015). Recent reports show that class I PI3K‐derived PI(3,4)P2 signals are hydrolyzed to PI(3)P on endosomes by INPP4B (Liu et al, 2018, 2020; Rodgers et al, 2021). Our findings demonstrate that INPP4B‐generated PI(3)P signals on endosomes are retained as this compartment matures into endolysosomes, and in turn PI(3)P is subsequently phosphorylated to PI(3,5)P2 by PIKfyve. Therefore, we propose that the lysosomal PI(3,5)P2 pool that functions during basal autophagy is derived from sequential action of PI3Kα, INPP4B, and PIKfyve to facilitate lysosome reformation from endolysosomes.
We propose that a functional endosomal system is required to maintain lysosome homeostasis during basal autophagy. There is an emerging body of evidence that autophagosome membranes are derived from recycling endosomes (Longatti et al, 2012; Puri et al, 2018) or hybrid Golgi‐endosome structures (Kumar et al, 2021), suggesting that significant convergence exists between the endosomal and autophagy pathways. However, the complexities of the functional intersection of these two pathways are still emerging. ESCRT proteins, which promote the formation of ILVs within late endosomes to facilitate endosome maturation, are also required for basal autophagic degradation by unknown mechanisms (Filimonenko et al, 2007; Rusten et al, 2007). Consistent with this, we found that suppression of late endosome maturation via inactivation of INPP4B or the ESCRT protein, Hrs, reduced basal autophagic degradation. Mechanistically, we propose that this block in autophagy results from an inability to retain and/or access PI(3)P on endolysosomes for PIKfyve generation of PI(3,5)P2. This reveals an unanticipated level of interplay between endosomal and autophagy pathways, whereby basal autophagy is dependent on the continued maturation of endosomes in order to facilitate PIKfyve‐dependent lysosome reformation.
Our findings provide mechanistic insight into how lysosome membrane recycling occurs under basal autophagy. Although lysosome reformation was first described over a decade ago (Pryor et al, 2000; Bright et al, 2005), the significant challenges associated with capturing these rapid membrane remodeling events have greatly limited our understanding of the molecular mechanisms that govern this process. Our development of a rapid imaging and quantitative analysis workflow enabled us to examine lysosome reformation in live cells and identify INPP4B, a PI(3)P‐generating enzyme, and SNX2, a PI(3,5)P2‐binding effector, as direct regulators of this process. The PI(3,5)P2‐binding calcium channel protein, TRPML1, promotes scission of endolysosome tubules (Miller et al, 2015), and here we show that SNX2 is required for the initiation and/or extension of endolysosome tubules, suggesting that these PI(3,5)P2 effectors work at different stages of lysosome reformation. Some SNX proteins require coincidence detection of multiple phosphoinositides or proteins to regulate their localization and activity (Carlton et al, 2004; Daste et al, 2017). We demonstrate that SNX2 recruitment to endolysosomes is dependent on PI(3,5)P2 generation by PIKfyve. However, as SNX2 can also bind PI(3)P, PI(4)P, and PI(3,4)P2 (Carlton et al, 2005; Chandra et al, 2019), we cannot exclude the possibility that co‐incidence phosphoinositide detection may contribute to SNX2 recruitment or activation on endolysosomes. Furthermore, there is likely to be additional molecular machinery that co‐ordinates lysosome reformation from endolysosomes, such as motor proteins or actin scaffolds that are essential for autolysosome tubule extension during ALR (Rong et al, 2012; Du et al, 2016; Dai et al, 2019; McGrath et al, 2021).
Dissecting the pathways that underpin lysosome repopulation during autophagy may provide important insights into the molecular basis of diseases associated with lysosome and autophagy dysfunction. Defective lysosome homeostasis is linked to a wide spectrum of human diseases (Bonam et al, 2019). We and others recently uncovered defective ALR leads to muscular and neurological disorders associated with enlarged lysosomal compartments and reduced autophagic capacity (Varga et al, 2015; Vantaggiato et al, 2019; McGrath et al, 2021). It is currently unknown whether defective lysosome reformation from endolysosomes is pathogenic. However, mutations in PIKfyve complex proteins Fig4 and Vac14 cause PI(3,5)P2 depletion and neurological disease (Chow et al, 2007; Zhang et al, 2007, 2008; Zolov et al, 2012). There is a strong association with lysosome dysfunction in these disorders, including the presence of enlarged lysosomes in both patient samples and mouse models. The reasons for lysosome enlargement are still emerging, but this is a characteristic feature observed with inhibition of lysosome reformation in cellular models (Bissig et al, 2017; Choy et al, 2018) and may relate to an inability to regenerate lysosomes from endolysosome membranes. Moreover, PIKfyve inhibition in lymphoma and neuronal cells also causes lysosome swelling and dysfunction leading to autophagosome accumulation (Martin et al, 2013; Gayle et al, 2017), consistent with a role for PIKfyve in maintaining the supply of lysosomes needed for autophagosome fusion to form autolysosomes. Our data demonstrates that disruption of INPP4B/PIKfyve‐dependent lysosome reformation leads to protein aggregate accumulation and proteotoxicity, processes that are associated with neurological disease (Dubnikov et al, 2017). It is interesting to speculate whether reduced lysosome reformation and increased proteotoxic stress may contribute to neurological disease resulting from PIKfyve complex inactivation, and in turn, whether dysregulation of lysosome reformation from endolysosomes may impact on other human diseases.
Materials and Methods
Cell culture
MCF‐7 (cat # HTB‐22), HeLa cells (cat # CCL2), and HEK293T (cat # CRL‐3216) cells were purchased from ATCC. MCF‐7 cells were cultured in DMEM supplemented with 10% (v/v) FCS, 2 mM L‐glutamine, 100 units/ml penicillin, 1% (v/v) streptomycin, and 10 μg/ml insulin. HeLa and HEK293T were cultured in DMEM supplemented with 10% (v/v) FCS, 2 mM L‐glutamine, 100 units/ml penicillin, and 1% (v/v) streptomycin. All cells were maintained in a 5% CO2‐humidified 37°C incubator. All aseptic culture techniques were performed in a class II biohazard hood. Cells were routinely tested to confirm the absence of mycoplasma contamination. Cell line authentication was not performed.
For nutrient deprivation, cells were washed twice with PBS then incubated in EBSS (Sigma, cat # E3024) for 2–6 h as indicated. For experiments using SAR405 (Selleckchem, # S7682), bafilomycin A1 (Sigma, cat # B1793), or YM201636 (Selleckchem, cat # S1219), cells were treated with the indicated dose or the same volume of DMSO as a vehicle control. For YM201636 washout experiments, cells were washed twice with growth media then incubated with fresh growth media.
cDNA constructs
To generate pBMN‐LAMP1‐mCherry and pBMN‐LAMP1‐mEGFP, the pBMN‐Z retroviral vector (Gary Nolan, Stanford University, Addgene, cat # 1734) was digested with Sal1/BamH1 before cloning using the HiFi DNA Assembly 1232 Kit (New England Biolabs, cat # E5520S) according to the manufacturer's instructions. LAMP1‐mCherry and LAMP1‐mEGFP were generated by PCR amplification of LAMP1‐RFP (Sherer et al, 2003; Addgene, cat # 1817) and either pBMN‐mCherry‐C1 (Michael Lazarou, Walter and Eliza Hall Institute of Medical Research and Monash University, Australia; Padman et al, 2019), or pBMN‐mEGFP‐INPP5K (McGrath et al, 2021), respectively. pCGN‐HA‐INPP4BWT and pCGN‐HA‐INPP4BC842A were generated by digesting pCGN‐HA (Gurung et al, 2003) with Kpn1. INPP4BWT or INPP4BC842A (Rijal et al, 2015) were amplified with Kpn1 digestion sites, then digested and cloned into the Kpn1 site of pCGN‐HA. All generated plasmid DNA sequences were verified by Sanger sequencing (Micromon, Monash University, Australia). pEGFP‐SNX2 was a kind gift from Brett Collins (University of Queensland, Australia). pEGFP‐PIKFYVE was a kind gift from Geert van den Bogaart (Addgene, cat # 121148; Baranov et al, 2019). pEGFP‐C2 was purchased from Clontech (cat # 6083‐1).
Generation of stable cell lines by viral transduction
Retroviral and lentiviral transductions were carried out as previously described (Lazarou et al, 2015; Rodgers et al, 2021). Cells transduced with lentiviral particles encoding pHIV‐1SDmCMV.pre GFP‐vector, pHIV‐1SDmCMV.pre GFP‐INPP4B (Fedele et al, 2010), pBMN‐LAMP1‐mEGFP, or pBMN‐LAMP1‐mCherry were selected by fluorescent activated cell sorting (FACS) (Flowcore, Monash University, Australia). Cells transduced with pLKO.1‐puro Non‐Mammalian shRNA (Sigma, cat # SHC002), INPP4B #1 mission® shRNA (Sigma, cat # TRCN0000052721), INPP4B #2 mission® shRNA (Sigma, cat # TRCN0000052722), or HGS mission® shRNA (Sigma, cat # TRCN000038‐0920) lentiviral particles were selected by culturing cells in media containing 1 μg/ml puromycin (Sigma, cat # P9620) for 1 week, then cultured into puromycin‐free media at least 1 week before experiments were conducted.
Cell transfections
pCGN‐HA‐vector, pCGN‐HA‐INPP4BWT, pCGN‐HA‐INPP4BC842A, pEGFP‐PIKFYVE, pEGFP‐SNX2, or pEGFP‐C2 were transfected into cells using Lipofectamine 3000 (Invitrogen, cat # L3000001) according to the manufacturer's instructions. Cells were co‐stained with HA or GFP antibodies (Appendix Table S1) in all experiments in order to detect transfected cells. For siRNA depletion, cells were reverse transfected with INPP4B siRNA (Qiagen, cat # SI05133338), PIK3CA siRNA #1 (Qiagen, cat # SI02622207), PIK3CA siRNA #2 (Qiagen, cat # SI02665369), PIP5K3 siRNA #1 (Qiagen, cat # SI03063928), PIP5K3 siRNA #2 (Qiagen, cat # SI05049359), SNX1 siRNA (Qiagen, cat # SI00047775), SNX2 siRNA (Qiagen, cat # SI04258394), SNX2 3'‐UTR siRNA (Qiagen, cat # SI05077534), or NT siRNA (Qiagen, cat # 1027281) using Lipofectamine RNAiMAX (Invitrogen, cat # 13778075) according to the manufacturer's directions (Transfecting Stealth™ RNAi or siRNA into MCF7 Cells Using Lipofectamine™ RNAiMAX). Following transfections, cells were incubated for 24 h at 37°C before experiments were conducted.
Immunoblotting
Cell lysates were prepared for immunoblotting by washing cells once with TBS on ice followed by direct cell lysis in 40 mM of Tris pH 6.8, 4% (w/v) SDS, 20% (v/v) glycerol, 0.0002% (w/v) bromophenol blue, 50 mM of DTT. Lysates were boiled for 5 min at 100°C, and proteins were separated by 10% SDS‐PAGE at 150 V for 1–1.5 h. LC3B proteins were transferred to PDVF by electrophoresis at 100 mA for 2 h. All other proteins were transferred to PVDF at 250 mA for 1.5 h. Immunoblot blocking solution (5% skim milk in TBS) was added to membranes for 1 h at room temperature while rocking. Membranes were incubated in primary antibodies (Appendix Table S1) diluted in TSB‐T overnight at 4°C while rocking. Membranes were washed three times with TBS‐T while rocking for 10 min each. Secondary HRP‐conjugated antibodies (Appendix Table S1) diluted in TBS‐T were added for 1 h at room temperature then membranes were washed three times in TBS‐T while rocking for 10 min each. Membranes were immersed in ECL Plus for 1 min, then exposed to X‐ray film in a dark room and developed using a Fuji processor. Densitometry with ImageJ version 2.0.0 software (https://imagej.nih.gov) (Schneider et al, 2012) was used to quantify protein bands, with signals being normalized to the loading control protein GAPDH.
Immunofluorescence
Immunofluorescence of lysosomes and endosomes
Endosomes and lysosomes were visualized by immunofluorescence using a saponin‐based protocol that preserves endosomal structures (Scheffler et al, 2014). Cells were seeded onto 15 mm round coverslips. After 24 h, cells were fixed with 4% (w/v) PFA for 20 min, then washed three times in 50 mM of NH4Cl in PBS. Cells were blocked and permeabilized in 2% (w/v) BSA, 0.05% (w/v) saponin in PBS for 1 h. Primary antibodies (Appendix Table S1) were diluted in blocking solution and added overnight at 4°C, then cells were washed three times in PBS. Alexa Fluor® secondary antibodies, phalloidin and DAPI (Appendix Table S1) were diluted in blocking solution and added for 1 h at room temperature. Cells were washed three times with PBS, and mounted onto slides with Fluoromount‐G. Slides were imaged using a Leica SP8 invert confocal laser scanning microscope (Monash Micro Imaging, Monash University, Australia) and LAS X version 3.5.6.21594 software (Leica, https://www.leica‐microsystems.com/). Single z‐plane images were taken using the same laser power for all conditions within the same experiment. For super resolution microscopy, slides were imaged using a Zeiss LSM980 confocal laser scanning microscope with an Airyscan 2 detector (Monash Micro Imaging, Monash University, Australia) and ZEN version 3.3 (Zeiss, https://www.zeiss.com/).
To visualize INPP4B at lysosomes and endosomes, cells were pretreated with saponin before fixation to remove cytoplasmic proteins and retain proteins bound by intracellular membranes as previously described (Marat et al, 2017). Media was aspirated from cells, then cells were permeabilized with 0.02% (w/v) saponin, 25 mM of KCl, 2.5 mM of MgCl2, 25 mM of HEPES, pH 7.4 for 30 s. Cells were then fixed and stained using the saponin‐based protocol as described above.
Immunofluorescence of autophagosomes and protein aggregates
Cells were seeded onto 15 mm coverslips. The following day, cells washed three times with PBS and fixed with 4% (w/v) PFA for 30 min. Cells were washed three times in PBS. Cells were permeabilized with 0.1% (v/v) Triton X‐100 in PBS for 90 s. Cells were washed three times with PBS. Cells were blocked in 3% (w/v) BSA in PBS for 1 h. Primary antibodies (Appendix Table S1) were diluted in blocking solution and added for 1 h. Cells were washed three times with PBS. Alexa Fluor® secondary antibodies, phalloidin, and DAPI (Appendix Table S1) were diluted in block and added for 1 h. Cells were washed three times with PBS and mounted on to slides with Fluoromount G. Slides were imaged using a Leica SP8 invert confocal laser scanning microscope and LAS X version 3.5.6.21594 software. Single z‐plane images were taken using the same laser power for all conditions within the same experiment.
GFP‐mCherry‐LC3B biosensor
Cells were transduced with retroviral particles encoding pBABE‐puro‐mCherry‐EGFP‐LC3B (Addgene, cat #22418; N'Diaye et al, 2009) as previously described (Lazarou et al, 2015). Following transduction, cells were seeded onto 15 mm round coverslips. The following day, cells were fixed in 4% (w/v) PFA for 20 min, then washed three times with PBS. DAPI was diluted in PBS and added to cells for 30 min, then cells were washed three times with PBS. Coverslips were mounted onto slides with Fluoromount‐G and imaged using a Leica SP8 invert confocal laser scanning microscope and LAS X version 3.5.6.21594 software. Single z‐plane images were taken using the same laser power for all conditions within the same experiment.
Detection of PI(3)P by immunofluorescence
PI(3)P staining was performed as previously described using the “Golgi” staining method (Hammond et al, 2009). Briefly, cells were seeded onto 15 mm round coverslips. The following day, cells were fixed in 2% (w/v) PFA for 15 min. Cells were washed three times with 50 mM of NH4Cl in PBS, and then permeabilized with Buffer A (20 mM PIPES, 137 mM NaCl, 2.7 mM KCl, pH 6.8) with 20 μM of digitonin for 5 min. Cells were washed three times in Buffer A and then blocked with 5% (v/v) goat serum, 50 mM of NH4Cl in Buffer A for 45 min. Eight μg/ml of recombinant GST‐2xFYVEHrs (Naughtin et al, 2010) was diluted with 5% (v/v) goat serum in Buffer A and added to cells for 45 min. Cells were washed twice with Buffer A then primary antibodies (Appendix Table S1) were diluted in 5% (v/v) goat serum in Buffer A and added to cells for 1.5 h. Cells were washed twice with Buffer A. Alexa Fluor® secondary antibodies and DAPI (Appendix Table S1) were diluted with 5% (v/v) goat serum in Buffer A and added to cells for 45 min. Cells were washed four times with Buffer A. Cells were postfixed with 2% (w/v) PFA then washed three times in 50 mM of NH4Cl in PBS and once with dH2O. Coverslips were mounted onto slides with Fluoromount‐G and imaged using a Leica SP8 invert confocal laser scanning microscope and LAS X version 3.5.6.21594 software. Single z‐plane images were taken using the same laser power for all conditions within the same experiment.
Particle analysis
Images were analyzed using ImageJ version 2.0.0 software. For particle analysis, the same channel threshold was applied to all images from the same experiment. The “analyse particle” plugin was used to determine the number and/or size of p62‐positive, LAMP1‐positive, or LAMP2‐positive puncta greater than 0.1 μm2 per cell. To determine the distance of lysosomes from the nucleus, the centroid coordinates of individual lysosomes and nuclei were used to determine distance using the equation: distance = √((lysosome x coordinate − nucleus x coordinate)2 + (lysosome y coordinate − nucleus y coordinate)2). Particle co‐localization analysis was performed as previously described (De Leo et al, 2016). To determine the proportion of PI(3)P‐positive lysosomes, SNX2‐positive lysosomes, or SNX2‐positive early endosomes, the LAMP1‐positive or EEA1‐positive puncta were used to construct a mask that was overlaid with the 2xFYVE‐positive or SNX2‐positive puncta. To quantify CD63‐positive/p62‐positive amphisomes, the CD63‐positive puncta were used to construct a mask that was overlaid with the p62‐positive puncta. The number of double positive puncta with > 30% overlap in area were quantified. To determine lysosomal phospho‐mTOR staining intensity, the LAMP1 channel was used to construct a mask that was overlaid with the phospho‐mTOR staining. Fluorescence intensity of phospho‐mTOR signals co‐localizing with LAMP1 were calculated and normalized to cell area.
Live cell imaging
Magic Red™ cathepsin B
Magic Red™ cathepsin B assays (Bio‐Rad, cat # 6133) were carried out according to the manufacturer's instructions. Cells were seeded in 4‐well chamber slides. The following day, cells were washed once with PBS, then incubated for 30 min with Magic Red™ cathepsin B and 1 μg/ml Hoechst 33342 diluted in live cell media containing phenol red‐free DMEM, 10% (v/v) FCS, and 10 μg/ml insulin. Live cells were imaged in a 5% CO2‐humidified 37°C chamber using a Leica SP8 invert confocal laser scanning microscope and LAS X version 3.5.6.21594 software. Single z‐plane images were taken using the same laser power for all conditions within the same experiment. The “analyse particle” plugin was used to determine the number of Magic Red™ cathepsin B‐positive puncta per cell, with the same channel threshold applied to each image in the same experiment. To quantify LAMP1‐positive/Magic Red™ cathepsin B‐negative terminal storage lysosomes, the LAMP1‐positive puncta were used to construct a mask that was overlaid with the Magic Red™ cathepsin B‐positive puncta.
Lysosome reformation
Cells expressing LAMP1‐mCherry were seeded in a 35 mm FluoroDish. The following day, cells were washed once with PBS then phenol red‐free DMEM containing 10% (v/v) FCS and 10 μg/ml insulin were added. Live cells were imaged in a 5% CO2‐humidified 37°C chamber using a 3i Marianas Spinning Disk microscope (Monash Micro Imaging, Monash University, Australia) and Slidebook version 6.0.22 (Intelligent Imaging Innovations, https://www.intelligent‐imaging.com/). To visualize lysosome reformation, three z‐planes 0.27 μm apart were acquired every 500 or 1,000 ms for 20 min using the same laser power for all conditions within the same experiment. Maximum intensity projections of lysosomes were converted into three‐dimensional kymographs using x, y, and time axes, and lysosome reformation analysis was performed using Dragonfly software version 2020.2 (Object Research Systems Inc, http://www.theobjects.com/dragonfly). Briefly, kymographs of lysosomes were segmented using OTSU's method for thresholding (Otsu, 1979), and skeletonized to detect tubulations events leading to scissions as branches off the main stem that represents the parent lysosome. The skeletons were then analyzed for nodes and branches in order identify and quantify lysosome reformation events (Appendix Fig S5A–E).
To visualize SNX2 at lysosomes undergoing reformation, MCF‐7 cells expressing LAMP1‐mCherry were transfected with pEGFP‐SNX2. After 24 h, cells were washed once with PBS then phenol red‐free DMEM containing 10% (v/v) FCS and 10 μg/ml insulin were added. Live cells were imaged in a 5% CO2‐humidified 37°C chamber using a 3i Marianas Spinning Disk microscope and Slidebook version 6.0.22. Two z‐planes 0.27 μm apart were acquired every 1,000 ms for 20 min.
Immuno‐gold labeling of cryosections for transmission electron microscopy
Tokuyasu sample preparation and immuno‐gold labeling of cryosections for transmission electron microscopy was performed as described (Slot & Geuze, 2007; Oorschot et al, 2021). A version of the protocol is maintained at protocols.io (dx.doi.org/10.17504/protocols.io.btmrnk56). Cell monolayers were cultured in 10 cm plates and allowed to reach 80% confluency before being fixed overnight at 4°C with 0.1 M phosphate buffered 2% (w/v) PFA and 0.2% (w/v) glutaraldehyde. Cells were washed in PBS (3 × 10 min) and then rinsed for 10 min in 0.15% (w/v) glycine in PBS. The fixed samples were scraped in 1% (w/v) gelatin in 0.1 M phosphate buffer and infused for 30 min at 37°C with 12% (w/v) gelatin in 0.1 M phosphate buffer, which was subsequently solidified at 4°C before being cut into small cubes measuring ~0.5 mm on each edge. The gelatin embedded cells were infiltrated with 2.3 M sucrose in 0.1 M phosphate buffer at 4°C overnight, rotating. Sucrose‐infiltrated cell blocks were mounted on aluminum cryo‐pins and then frozen in liquid nitrogen for cryo‐ultramicrotomy.
Frozen cell blocks were trimmed at −100°C with a cutting speed of 100 mm/s and a 100 nm feed, and then sectioned at −120°C with an 0.8 mm/s cutting speed and 62 nm feed using a UC7/FC7 cryo‐ultramicrotome (Leica Microsystems) equipped with a 20° cryo‐trim diamond knife (Diatome) and a 35° cryo‐immuno diamond knife (Diatome), respectively. Cryosections were retrieved using a stainless steel loop with a droplet of phosphate buffered 1% (w/v) methyl cellulose and 1.15 M sucrose, then deposited on formvar‐coated grids for immunolabeling.
Samples were prepared for immunolabeling by floating grids section‐side down in PBS at 37°C for 1 h. Grids were then rinsed with 0.15% (w/v) glycine in PBS (3 × 2 min) and blocked with 1% (w/v) BSA in PBS for 5 min, before incubation with rabbit anti‐GFP primary antibodies (Appendix Table S1) in 1% (w/v) BSA in PBS for 1 h at room temperature. Following washes in 0.1% (w/v) BSA in PBS (5 × 2 min), grids were incubated with Protein‐A conjugated 10‐nm gold particles (1:50, Cell Biology, UMC Utrecht, Netherlands) diluted in 1% (w/v) BSA in PBS for 30 min at room temperature and then washed in PBS (5 × 2 min). The labeling reaction was stabilized by fixation with 1% (w/v) glutaraldehyde in PBS for 5 min and grids rinsed in distilled water (6 × 1 min). Grids were then contrasted with 2% (w/v) uranyloxalate (pH 7) for 5 min at room temperature, and floated twice briefly and then for 10 min on ice cold 0.4% (w/v) uranyl acetate in 1.8% (w/v) aqueous methyl cellulose (pH 4). Finally, grids were looped out and dried in a thin film of 0.4% (w/v) uranyl acetate in 1.8% (w/v) aqueous methyl cellulose (pH 4) using a wire loop. High resolution electron micrographs were acquired using a JEOL‐1400 Plus transmission electron microscope at 80 keV and TEM Centre version 1.7.18.2349 software (Monash Ramaciotti Centre for Cryo‐Electron Microscopy, Monash University, Australia).
RNA analysis
RNA was extracted from cells using the Isolate II RNA extraction kit (Bioline, cat # BIO‐52073) according to the manufacturer's instructions. RNA concentration was determined using a Nanodrop 1000 spectrophotometer (Thermo Fisher Scientific). Extracted RNA was diluted to 50 ng/ml, and subjected to two‐step qRT‐PCR using the iScript gDNA clear cDNA synthesis kit (Bio‐Rad, cat # 172‐5035) and the QuantiTect SYBR Green PCR Kit (Qiagen, cat # 204143) according to the manufacturers' instructions. Reactions were subjected to thermocycling using a CFX384 Real Time PCR System (Bio‐Rad), and analyzed using CFX Manager version 3.1 software (Bio‐Rad, https://www.bio‐rad.com). All qRT‐PCR primers are listed in Appendix Table S2. A no template control without cDNA and a no reverse transcriptase control were included to ensure no genomic DNA was present. The relative expression of the gene of interest was compared to the standard loading control genes ACTB or RRN18S and quantified using the ΔΔCT method (Dussault & Pouliot, 2006).
Cell viability assays
Cell viability was assessed using CellTiter‐Glo® 3D Cell Viability Assay (Promega, cat # G9681). Briefly, ~24,000 cells were seeded per well in a 24‐well plate. The following day, cells were treated with 10 μg/ml puromycin and/or 5 μM YM201636 for 2, 4, or 6 h. At the treatment endpoint, media was removed and replaced with 200 μl of fresh media without inhibitors and 200 μl CellTiter reagent. The plate was shaken for 5 min and left to incubate in the dark for 30 min. The integrated luminescence signal was detected using a BMG LABTECH CLARIOstar Plus plate reader with CLARIOstar version 5.20 R5 and MARS 3.10 R6 software.
Statistics and reproducibility
Genetically modified cells were derived from the same pool of parent cells. Cells were randomly assigned to treatment or control groups. No sample size calculations were performed. Blinding was not applied to experiments. All experiments were repeated at least three times independently to ensure statistical significance of the results. Statistical analysis was performed using Prism version 7.0 (GraphPad, https://www.graphpad.com). Two‐tailed unpaired t test was used for experiments with two groups, one‐way ANOVA was used for experiments with more than two groups and one independent variable, and two‐way ANOVA was used for experiments with more than two groups and two independent variables. Details of statistical testing can be found in the figure legends. Differences between groups were considered statistically different for P values < 0.05.
Author contributions
Samuel J Rodgers: Conceptualization; formal analysis; supervision; investigation; methodology; writing – original draft; writing – review and editing. Emily I Jones: Formal analysis; investigation; writing – review and editing. Senthil Arumugam: Resources; formal analysis; writing – review and editing. Sabryn A Hamila: Validation; investigation; writing – review and editing. Jill Danne: Investigation; writing – review and editing. Rajendra Gurung: Methodology; writing – review and editing. Matthew J Eramo: Methodology; writing – review and editing. Randini Nanayakkara: Methodology; writing – review and editing. Georg Ramm: Resources; funding acquisition; writing – review and editing. Meagan J McGrath: Conceptualization; supervision; funding acquisition; writing – original draft; writing – review and editing. Christina A Mitchell: Conceptualization; resources; supervision; funding acquisition; writing – original draft; writing – review and editing.
Disclosure and competing interests statement
The authors declare that they have no conflict of interest.
Supporting information
Appendix
Expanded View Figures PDF
Movie EV1
Movie EV2
Movie EV3
Movie EV4
Source Data for Expanded View and Appendix
Source Data for Figure 1
Source Data for Figure 2
Source Data for Figure 3
Source Data for Figure 4
Source Data for Figure 5
Source Data for Figure 6
Source Data for Figure 7
PDF+
Acknowledgements
The authors thank Michael Lazarou (Walter and Eliza Hall Institute of Medical Research and Monash University, Australia) for providing HeLa cells and the pBMN‐mCherry‐C1 plasmid, and Brett Collins (University of Queensland, Australia) for providing the pEGFP‐SNX2 plasmid. This work was supported by the Australian Research Council grants DP190102499 and DP220103810, Australian Government Research Training Program Scholarships and a Monash‐King's College Postgraduate Scholarship. This study utilized Monash Micro Imaging, Monash Ramaciotti Centre for Cryo Electron Microscopy, Micromon and Flowcore, Monash University, Australia. Open access publishing facilitated by Monash University, as part of the Wiley ‐ Monash University agreement via the Council of Australian University Librarians.
The EMBO Journal (2022) 41: e110398.
Data availability
This study includes no data deposited in external repositories. Source data and uncropped blots are provided with this paper. All data that support the findings of this study are available from the corresponding author upon reasonable request.
References
- Axe EL, Walker SA, Manifava M, Chandra P, Roderick HL, Habermann A, Griffiths G, Ktistakis NT (2008) Autophagosome formation from membrane compartments enriched in phosphatidylinositol 3‐phosphate and dynamically connected to the endoplasmic reticulum. J Cell Biol 182: 685–701 [DOI] [PMC free article] [PubMed] [Google Scholar]
- Bache KG, Stuffers S, Malerød L, Slagsvold T, Raiborg C, Lechardeur D, Wälchli S, Lukacs GL, Brech A, Stenmark H (2006) The ESCRT‐III subunit hVps24 is required for degradation but not silencing of the epidermal growth factor receptor. Mol Biol Cell 17: 2513–2523 [DOI] [PMC free article] [PubMed] [Google Scholar]
- Baranov MV, Bianchi F, Schirmacher A, van Aart MAC, Maassen S, Muntjewerff EM, Dingjan I, Ter Beest M, Verdoes M, Keyser SGL et al (2019) The phosphoinositide kinase PIKfyve promotes cathepsin‐S‐mediated major histocompatibility complex class II antigen presentation. iScience 11: 160–177 [DOI] [PMC free article] [PubMed] [Google Scholar]
- Bissig C, Hurbain I, Raposo G, van Niel G (2017) PIKfyve activity regulates reformation of terminal storage lysosomes from endolysosomes. Traffic 18: 747–757 [DOI] [PubMed] [Google Scholar]
- Bonam SR, Wang F, Muller S (2019) Lysosomes as a therapeutic target. Nat Rev Drug Discov 18: 923–948 [DOI] [PMC free article] [PubMed] [Google Scholar]
- Boukhalfa A, Nascimbeni AC, Ramel D, Dupont N, Hirsch E, Gayral S, Laffargue M, Codogno P, Morel E (2020) PI3KC2α‐dependent and VPS34‐independent generation of PI3P controls primary cilium‐mediated autophagy in response to shear stress. Nat Commun 11: 294 [DOI] [PMC free article] [PubMed] [Google Scholar]
- Bright NA, Davis LJ, Luzio JP (2016) Endolysosomes are the principal intracellular sites of acid hydrolase activity. Curr Biol 26: 2233–2245 [DOI] [PMC free article] [PubMed] [Google Scholar]
- Bright NA, Gratian MJ, Luzio JP (2005) Endocytic delivery to lysosomes mediated by concurrent fusion and kissing events in living cells. Curr Biol 15: 360–365 [DOI] [PubMed] [Google Scholar]
- Carlton J, Bujny M, Peter BJ, Oorschot VM, Rutherford A, Mellor H, Klumperman J, McMahon HT, Cullen PJ (2004) Sorting nexin‐1 mediates tubular endosome‐to‐TGN transport through coincidence sensing of high‐ curvature membranes and 3‐phosphoinositides. Curr Biol 14: 1791–1800 [DOI] [PubMed] [Google Scholar]
- Carlton JG, Bujny MV, Peter BJ, Oorschot VM, Rutherford A, Arkell RS, Klumperman J, McMahon HT, Cullen PJ (2005) Sorting nexin‐2 is associated with tubular elements of the early endosome, but is not essential for retromer‐mediated endosome‐to‐TGN transport. J Cell Sci 118: 4527–4539 [DOI] [PMC free article] [PubMed] [Google Scholar]
- Catimel B, Schieber C, Condron M, Patsiouras H, Connolly L, Catimel J, Nice EC, Burgess AW, Holmes AB (2008) The PI(3,5)P2 and PI(4,5)P2 interactomes. J Proteome Res 7: 5295–5313 [DOI] [PubMed] [Google Scholar]
- Chandra M, Chin YK, Mas C, Feathers JR, Paul B, Datta S, Chen KE, Jia X, Yang Z, Norwood SJ et al (2019) Classification of the human phox homology (PX) domains based on their phosphoinositide binding specificities. Nat Commun 10: 1528 [DOI] [PMC free article] [PubMed] [Google Scholar]
- Chen D, Fan W, Lu Y, Ding X, Chen S, Zhong Q (2012) A mammalian autophagosome maturation mechanism mediated by TECPR1 and the Atg12‐Atg5 conjugate. Mol Cell 45: 629–641 [DOI] [PMC free article] [PubMed] [Google Scholar]
- Chow CY, Zhang Y, Dowling JJ, Jin N, Adamska M, Shiga K, Szigeti K, Shy ME, Li J, Zhang X et al (2007) Mutation of FIG4 causes neurodegeneration in the pale tremor mouse and patients with CMT4J. Nature 448: 68–72 [DOI] [PMC free article] [PubMed] [Google Scholar]
- Choy CH, Saffi G, Gray MA, Wallace C, Dayam RM, Ou ZA, Lenk G, Puertollano R, Watkins SC, Botelho RJ (2018) Lysosome enlargement during inhibition of the lipid kinase PIKfyve proceeds through lysosome coalescence. J Cell Sci 131: jcs213587 [DOI] [PMC free article] [PubMed] [Google Scholar]
- Cozier GE, Carlton J, McGregor AH, Gleeson PA, Teasdale RD, Mellor H, Cullen PJ (2002) The phox homology (PX) domain‐dependent, 3‐phosphoinositide‐mediated association of sorting nexin‐1 with an early sorting endosomal compartment is required for its ability to regulate epidermal growth factor receptor degradation. J Biol Chem 277: 48730–48736 [DOI] [PubMed] [Google Scholar]
- Dai A, Yu L, Wang HW (2019) WHAMM initiates autolysosome tubulation by promoting Actin polymerization on autolysosomes. Nat Commun 10: 3699 [DOI] [PMC free article] [PubMed] [Google Scholar]
- Daste F, Walrant A, Holst MR, Gadsby JR, Mason J, Lee JE, Brook D, Mettlen M, Larsson E, Lee SF et al (2017) Control of Actin polymerization via the coincidence of phosphoinositides and high membrane curvature. J Cell Biol 216: 3745–3765 [DOI] [PMC free article] [PubMed] [Google Scholar]
- De Leo MG, Staiano L, Vicinanza M, Luciani A, Carissimo A, Mutarelli M, Di Campli A, Polishchuk E, Di Tullio G, Morra V et al (2016) Autophagosome‐lysosome fusion triggers a lysosomal response mediated by TLR9 and controlled by OCRL. Nat Cell Biol 18: 839–850 [DOI] [PMC free article] [PubMed] [Google Scholar]
- Dikic I, Elazar Z (2018) Mechanism and medical implications of mammalian autophagy. Nat Rev Mol Cell Biol 19: 349–364 [DOI] [PubMed] [Google Scholar]
- Dooley HC, Razi M, Polson HEJ, Girardin SE, Wilson MI, Tooze SA (2014) WIPI2 links LC3 conjugation with PI3P, autophagosome formation, and pathogen clearance by recruiting Atg12‐5‐16L1. Mol Cell 55: 238–252 [DOI] [PMC free article] [PubMed] [Google Scholar]
- Dou Z, Chattopadhyay M, Pan J‐A, Guerriero JL, Jiang Y‐P, Ballou LM, Yue Z, Lin RZ, Zong W‐X (2010) The class IA phosphatidylinositol 3‐kinase p110‐beta subunit is a positive regulator of autophagy. J Cell Biol 191: 827–843 [DOI] [PMC free article] [PubMed] [Google Scholar]
- Dou Z, Pan JA, Dbouk HA, Ballou LM, DeLeon JL, Fan Y, Chen JS, Liang Z, Li G, Backer JM et al (2013) Class IA PI3K p110β subunit promotes autophagy through Rab5 small GTPase in response to growth factor limitation. Mol Cell 50: 29–42 [DOI] [PMC free article] [PubMed] [Google Scholar]
- Du W, Su QP, Chen Y, Zhu Y, Jiang D, Rong Y, Zhang S, Zhang Y, Ren H, Zhang C et al (2016) Kinesin 1 drives autolysosome Tubulation. Dev Cell 37: 326–336 [DOI] [PubMed] [Google Scholar]
- Dubnikov T, Ben‐Gedalya T, Cohen E (2017) Protein quality control in health and disease. Cold Spring Harb Perspect Biol 9: a023523 [DOI] [PMC free article] [PubMed] [Google Scholar]
- Dussault A‐A, Pouliot M (2006) Rapid and simple comparison of messenger rna levels using real‐time PCR. Biol Proced Online 8: 1–10 [DOI] [PMC free article] [PubMed] [Google Scholar]
- Fan W, Tang Z, Chen D, Moughon D, Ding X, Chen S, Zhu M, Zhong Q (2010) Keap1 facilitates p62‐mediated ubiquitin aggregate clearance via autophagy. Autophagy 6: 614–621 [DOI] [PMC free article] [PubMed] [Google Scholar]
- Fedele CG, Ooms LM, Ho M, Vieusseux J, O'Toole SA, Millar EK, Lopez‐Knowles E, Sriratana A, Gurung R, Baglietto L et al (2010) Inositol polyphosphate 4‐phosphatase II regulates PI3K/Akt signaling and is lost in human basal‐like breast cancers. Proc Natl Acad Sci USA 107: 22231–22236 [DOI] [PMC free article] [PubMed] [Google Scholar]
- Filimonenko M, Stuffers S, Raiborg C, Yamamoto A, Malerød L, Fisher EM, Isaacs A, Brech A, Stenmark H, Simonsen A (2007) Functional multivesicular bodies are required for autophagic clearance of protein aggregates associated with neurodegenerative disease. J Cell Biol 179: 485–500 [DOI] [PMC free article] [PubMed] [Google Scholar]
- Gayle S, Landrette S, Beeharry N, Conrad C, Hernandez M, Beckett P, Ferguson SM, Mandelkern T, Zheng M, Xu T et al (2017) Identification of apilimod as a first‐in‐class PIKfyve kinase inhibitor for treatment of B‐cell non‐Hodgkin lymphoma. Blood 129: 1768–1778 [DOI] [PMC free article] [PubMed] [Google Scholar]
- Gewinner C, Wang ZC, Richardson A, Teruya‐Feldstein J, Etemadmoghadam D, Bowtell D, Barretina J, Lin WM, Rameh L, Salmena L et al (2009) Evidence that inositol polyphosphate 4‐phosphatase type II is a tumor suppressor that inhibits PI3K signaling. Cancer Cell 16: 115–125 [DOI] [PMC free article] [PubMed] [Google Scholar]
- Gillooly DJ, Morrow IC, Lindsay M, Gould R, Bryant NJ, Gaullier JM, Parton RG, Stenmark H (2000) Localization of phosphatidylinositol 3‐phosphate in yeast and mammalian cells. EMBO J 19: 4577–4588 [DOI] [PMC free article] [PubMed] [Google Scholar]
- Gurung R, Tan A, Ooms LM, McGrath MJ, Huysmans RD, Munday AD, Prescott M, Whisstock JC, Mitchell CA (2003) Identification of a novel domain in two mammalian inositol‐polyphosphate 5‐phosphatases that mediates membrane ruffle localization. The inositol 5‐phosphatase skip localizes to the endoplasmic reticulum and translocates to membrane ruffles following epidermal growth factor stimulation. J Biol Chem 278: 11376–11385 [DOI] [PubMed] [Google Scholar]
- Hammond GR, Schiavo G, Irvine RF (2009) Immunocytochemical techniques reveal multiple, distinct cellular pools of PtdIns4P and PtdIns(4,5)P(2). Biochem J 422: 23–35 [DOI] [PMC free article] [PubMed] [Google Scholar]
- Hammond GRV, Takasuga S, Sasaki T, Balla T (2015) The ML1Nx2 phosphatidylinositol 3,5‐bisphosphate probe shows poor selectivity in cells. PLoS ONE 10: e0139957 [DOI] [PMC free article] [PubMed] [Google Scholar]
- Hara T, Nakamura K, Matsui M, Yamamoto A, Nakahara Y, Suzuki‐Migishima R, Yokoyama M, Mishima K, Saito I, Okano H et al (2006) Suppression of basal autophagy in neural cells causes neurodegenerative disease in mice. Nature 441: 885–889 [DOI] [PubMed] [Google Scholar]
- Hong Z, Pedersen NM, Wang L, Torgersen ML, Stenmark H, Raiborg C (2017) PtdIns3P controls mTORC1 signaling through lysosomal positioning. J Cell Biol 216: 4217–4233 [DOI] [PMC free article] [PubMed] [Google Scholar]
- Ikonomov OC, Sbrissa D, Venkatareddy M, Tisdale E, Garg P, Shisheva A (2015) Class III PI 3‐kinase is the main source of PtdIns3P substrate and membrane recruitment signal for PIKfyve constitutive function in podocyte endomembrane homeostasis. Biochim Biophys Acta 1853: 1240–1250 [DOI] [PMC free article] [PubMed] [Google Scholar]
- Inoki K, Li Y, Zhu T, Wu J, Guan KL (2002) TSC2 is phosphorylated and inhibited by Akt and suppresses mTOR signalling. Nat Cell Biol 4: 648–657 [DOI] [PubMed] [Google Scholar]
- Ivetac I, Munday AD, Kisseleva MV, Zhang X‐M, Luff S, Tiganis T, Whisstock JC, Rowe T, Majerus PW, Mitchell CA (2005) The type Iα inositol polyphosphate 4‐phosphatase generates and terminates phosphoinositide 3‐kinase signals on endosomes and the plasma membrane. Mol Biol Cell 16: 2218–2233 [DOI] [PMC free article] [PubMed] [Google Scholar]
- James SR, Downes CP, Gigg R, Grove SJ, Holmes AB, Alessi DR (1996) Specific binding of the Akt‐1 protein kinase to phosphatidylinositol 3,4,5‐trisphosphate without subsequent activation. Biochem J 315: 709–713 [DOI] [PMC free article] [PubMed] [Google Scholar]
- Jefferies HB, Cooke FT, Jat P, Boucheron C, Koizumi T, Hayakawa M, Kaizawa H, Ohishi T, Workman P, Waterfield MD et al (2008) A selective PIKfyve inhibitor blocks PtdIns(3,5)P(2) production and disrupts endomembrane transport and retroviral budding. EMBO Rep 9: 164–170 [DOI] [PMC free article] [PubMed] [Google Scholar]
- Klionsky DJ, Petroni G, Amaravadi RK, Baehrecke EH, Ballabio A, Boya P, Bravo‐San Pedro JM, Cadwell K, Cecconi F, Choi AMK et al (2021) Autophagy in major human diseases. EMBO J 40: e108863 [DOI] [PMC free article] [PubMed] [Google Scholar]
- Komatsu M, Waguri S, Chiba T, Murata S, Iwata J, Tanida I, Ueno T, Koike M, Uchiyama Y, Kominami E et al (2006) Loss of autophagy in the central nervous system causes neurodegeneration in mice. Nature 441: 880–884 [DOI] [PubMed] [Google Scholar]
- Kumar S, Javed R, Mudd M, Pallikkuth S, Lidke KA, Jain A, Tangavelou K, Gudmundsson SR, Ye C, Rusten TE et al (2021) Mammalian hybrid pre‐autophagosomal structure HyPAS generates autophagosomes. Cell 184: 5950–5969 [DOI] [PMC free article] [PubMed] [Google Scholar]
- Lazarou M, Sliter DA, Kane LA, Sarraf SA, Wang C, Burman JL, Sideris DP, Fogel AI, Youle RJ (2015) The ubiquitin kinase PINK1 recruits autophagy receptors to induce mitophagy. Nature 524: 309–314 [DOI] [PMC free article] [PubMed] [Google Scholar]
- Lees JA, Li P, Kumar N, Weisman LS, Reinisch KM (2020) Insights into lysosomal PI(3,5)P(2) homeostasis from a structural‐biochemical analysis of the PIKfyve lipid kinase complex. Mol Cell 80: 736–743 [DOI] [PMC free article] [PubMed] [Google Scholar]
- Li Chew C, Lunardi A, Gulluni F, Ruan DT, Chen M, Salmena L, Nishino M, Papa A, Ng C, Fung J et al (2015) In vivo role of INPP4B in tumor and metastasis suppression through regulation of PI3K‐AKT signaling at endosomes. Cancer Discov 5: 740–751 [DOI] [PMC free article] [PubMed] [Google Scholar]
- Liu H, Paddock MN, Wang H, Murphy CJ, Geck RC, Navarro AJ, Wulf GM, Elemento O, Haucke V, Cantley LC et al (2020) The INPP4B tumor suppressor modulates EGFR trafficking and promotes triple negative breast cancer. Cancer Discov 10: 1226–1239 [DOI] [PMC free article] [PubMed] [Google Scholar]
- Liu SL, Wang ZG, Hu Y, Xin Y, Singaram I, Gorai S, Zhou X, Shim Y, Min JH, Gong LW et al (2018) Quantitative lipid imaging reveals a new signaling function of phosphatidylinositol‐3,4‐bisphophate: isoform‐ and site‐specific activation of Akt. Mol Cell 71: 1092–1104 [DOI] [PMC free article] [PubMed] [Google Scholar]
- Longatti A, Lamb CA, Razi M, Yoshimura S, Barr FA, Tooze SA (2012) TBC1D14 regulates autophagosome formation via Rab11‐ and ULK1‐positive recycling endosomes. J Cell Biol 197: 659–675 [DOI] [PMC free article] [PubMed] [Google Scholar]
- Ma K, Cheung SM, Marshall AJ, Duronio V (2008) PI(3,4,5)P3 and PI(3,4)P2 levels correlate with PKB/akt phosphorylation at Thr308 and Ser473, respectively; PI(3,4)P2 levels determine PKB activity. Cell Signal 20: 684–694 [DOI] [PubMed] [Google Scholar]
- Malerød L, Stuffers S, Brech A, Stenmark H (2007) Vps22/EAP30 in ESCRT‐II mediates endosomal sorting of growth factor and chemokine receptors destined for lysosomal degradation. Traffic 8: 1617–1629 [DOI] [PubMed] [Google Scholar]
- Manning BD, Toker A (2017) AKT/PKB signaling: navigating the network. Cell 169: 381–405 [DOI] [PMC free article] [PubMed] [Google Scholar]
- Marat AL, Wallroth A, Lo WT, Muller R, Norata GD, Falasca M, Schultz C, Haucke V (2017) mTORC1 activity repression by late endosomal phosphatidylinositol 3,4‐bisphosphate. Science 356: 968–972 [DOI] [PubMed] [Google Scholar]
- Martin S, Harper CB, May LM, Coulson EJ, Meunier FA, Osborne SL (2013) Inhibition of PIKfyve by YM‐201636 dysregulates autophagy and leads to apoptosis‐independent neuronal cell death. PLoS ONE 8: e60152 [DOI] [PMC free article] [PubMed] [Google Scholar]
- Mauvezin C, Nagy P, Juhász G, Neufeld TP (2015) Autophagosome‐lysosome fusion is independent of V‐ATPase‐mediated acidification. Nat Commun 6: 7007 [DOI] [PMC free article] [PubMed] [Google Scholar]
- McGrath MJ, Eramo MJ, Gurung R, Sriratana A, Gehrig SM, Lynch GS, Lourdes SR, Koentgen F, Feeney SJ, Lazarou M et al (2021) Defective lysosome reformation during autophagy causes skeletal muscle disease. J Clin Invest 131: e135124 [DOI] [PMC free article] [PubMed] [Google Scholar]
- Mellado M, Cuartero Y, Brugada R, Verges M (2014) Subcellular localisation of retromer in post‐endocytic pathways of polarised Madin‐Darby canine kidney cells. Biol Cell 106: 377–393 [DOI] [PubMed] [Google Scholar]
- Miller A, Schafer J, Upchurch C, Spooner E, Huynh J, Hernandez S, McLaughlin B, Oden L, Fares H (2015) Mucolipidosis type IV protein TRPML1‐dependent lysosome formation. Traffic 16: 284–297 [DOI] [PubMed] [Google Scholar]
- Mizushima N, Yoshimori T (2007) How to interpret LC3 immunoblotting. Autophagy 3: 542–545 [DOI] [PubMed] [Google Scholar]
- Munson MJ, Allen GF, Toth R, Campbell DG, Lucocq JM, Ganley IG (2015) mTOR activates the VPS34‐UVRAG complex to regulate autolysosomal tubulation and cell survival. EMBO J 34: 2272–2290 [DOI] [PMC free article] [PubMed] [Google Scholar]
- N'Diaye EN, Kajihara KK, Hsieh I, Morisaki H, Debnath J, Brown EJ (2009) PLIC proteins or ubiquilins regulate autophagy‐dependent cell survival during nutrient starvation. EMBO Rep 10: 173–179 [DOI] [PMC free article] [PubMed] [Google Scholar]
- Nakamura S, Yoshimori T (2018) Autophagy and longevity. Mol Cells 41: 65–72 [DOI] [PMC free article] [PubMed] [Google Scholar]
- Naughtin MJ, Sheffield DA, Rahman P, Hughes WE, Gurung R, Stow JL, Nandurkar HH, Dyson JM, Mitchell CA (2010) The myotubularin phosphatase MTMR4 regulates sorting from early endosomes. J Cell Sci 123: 3071–3083 [DOI] [PubMed] [Google Scholar]
- Nobukuni T, Joaquin M, Roccio M, Dann SG, Kim SY, Gulati P, Byfield MP, Backer JM, Natt F, Bos JL et al (2005) Amino acids mediate mTOR/raptor signaling through activation of class 3 phosphatidylinositol 3OH‐kinase. Proc Natl Acad Sci USA 102: 14238–14243 [DOI] [PMC free article] [PubMed] [Google Scholar]
- Oorschot V, Lindsey BW, Kaslin J, Ramm G (2021) TEM, SEM, and STEM‐based immuno‐CLEM workflows offer complementary advantages. Sci Rep 11: 899 [DOI] [PMC free article] [PubMed] [Google Scholar]
- Otsu N (1979) A threshold selection method from gray level histograms. IEEE Trans Syst Man Cybern 9: 62–66 [Google Scholar]
- Padman BS, Nguyen TN, Uoselis L, Skulsuppaisarn M, Nguyen LK, Lazarou M (2019) LC3/GABARAPs drive ubiquitin‐independent recruitment of optineurin and NDP52 to amplify mitophagy. Nat Commun 10: 408 [DOI] [PMC free article] [PubMed] [Google Scholar]
- Park J, Park Y, Ryu I, Choi MH, Lee HJ, Oh N, Kim K, Kim KM, Choe J, Lee C et al (2017) Misfolded polypeptides are selectively recognized and transported toward aggresomes by a CED complex. Nat Commun 8: 15730 [DOI] [PMC free article] [PubMed] [Google Scholar]
- Polson HE, de Lartigue J, Rigden DJ, Reedijk M, Urbé S, Clague MJ, Tooze SA (2010) Mammalian Atg18 (WIPI2) localizes to omegasome‐anchored phagophores and positively regulates LC3 lipidation. Autophagy 6: 506–522 [DOI] [PubMed] [Google Scholar]
- Pryor PR, Mullock BM, Bright NA, Gray SR, Luzio JP (2000) The role of intraorganellar ca(2+) in late endosome‐lysosome heterotypic fusion and in the reformation of lysosomes from hybrid organelles. J Cell Biol 149: 1053–1062 [DOI] [PMC free article] [PubMed] [Google Scholar]
- Puri C, Vicinanza M, Ashkenazi A, Gratian MJ, Zhang Q, Bento CF, Renna M, Menzies FM, Rubinsztein DC (2018) The RAB11A‐positive compartment is a primary platform for autophagosome assembly mediated by WIPI2 recognition of PI3P‐RAB11A. Dev Cell 45: 114–131 [DOI] [PMC free article] [PubMed] [Google Scholar]
- Qiu S, Lavallée‐Adam M, Côté M (2021) Proximity interactome map of the Vac14‐Fig4 complex using BioID. J Proteome Res 20: 4959–4973 [DOI] [PubMed] [Google Scholar]
- Rijal S, Fleming S, Cummings N, Rynkiewicz NK, Ooms LM, Nguyen NY, Teh TC, Avery S, McManus JF, Papenfuss AT et al (2015) Inositol polyphosphate 4‐phosphatase II (INPP4B) is associated with chemoresistance and poor outcome in AML. Blood 125: 2815–2824 [DOI] [PubMed] [Google Scholar]
- Rodgers SJ, Ferguson DT, Mitchell CA, Ooms LM (2017) Regulation of PI3K effector signalling in cancer by the phosphoinositide phosphatases. Biosci Rep 37: BSR20160432 [DOI] [PMC free article] [PubMed] [Google Scholar]
- Rodgers SJ, Ooms LM, Oorschot VMJ, Schittenhelm RB, Nguyen EV, Hamila SA, Rynkiewicz N, Gurung R, Eramo MJ, Sriratana A et al (2021) INPP4B promotes PI3Kα‐dependent late endosome formation and Wnt/β‐catenin signaling in breast cancer. Nat Commun 12: 3140 [DOI] [PMC free article] [PubMed] [Google Scholar]
- Ronan B, Flamand O, Vescovi L, Dureuil C, Durand L, Fassy F, Bachelot MF, Lamberton A, Mathieu M, Bertrand T et al (2014) A highly potent and selective Vps34 inhibitor alters vesicle trafficking and autophagy. Nat Chem Biol 10: 1013–1019 [DOI] [PubMed] [Google Scholar]
- Rong Y, Liu M, Ma L, Du W, Zhang H, Tian Y, Cao Z, Li Y, Ren H, Zhang C et al (2012) Clathrin and phosphatidylinositol‐4,5‐bisphosphate regulate autophagic lysosome reformation. Nat Cell Biol 14: 924–934 [DOI] [PubMed] [Google Scholar]
- Russell RC, Tian Y, Yuan H, Park HW, Chang Y‐Y, Kim J, Kim H, Neufeld TP, Dillin A, Guan K‐L (2013) ULK1 induces autophagy by phosphorylating Beclin‐1 and activating VPS34 lipid kinase. Nat Cell Biol 15: 741–750 [DOI] [PMC free article] [PubMed] [Google Scholar]
- Rusten TE, Vaccari T, Lindmo K, Rodahl LM, Nezis IP, Sem‐Jacobsen C, Wendler F, Vincent JP, Brech A, Bilder D et al (2007) ESCRTs and Fab1 regulate distinct steps of autophagy. Curr Biol 17: 1817–1825 [DOI] [PubMed] [Google Scholar]
- Rutherford AC, Traer C, Wassmer T, Pattni K, Bujny MV, Carlton JG, Stenmark H, Cullen PJ (2006) The mammalian phosphatidylinositol 3‐phosphate 5‐kinase (PIKfyve) regulates endosome‐to‐TGN retrograde transport. J Cell Sci 119: 3944–3957 [DOI] [PMC free article] [PubMed] [Google Scholar]
- Scheffler JM, Schiefermeier N, Huber LA (2014) Mild fixation and permeabilization protocol for preserving structures of endosomes, focal adhesions, and Actin filaments during immunofluorescence analysis. Methods Enzymol 535: 93–102 [DOI] [PubMed] [Google Scholar]
- Schneider CA, Rasband WS, Eliceiri KW (2012) NIH image to ImageJ: 25 years of image analysis. Nat Methods 9: 671–675 [DOI] [PMC free article] [PubMed] [Google Scholar]
- Settembre C, Di Malta C, Polito VA, Garcia Arencibia M, Vetrini F, Erdin S, Erdin SU, Huynh T, Medina D, Colella P et al (2011) TFEB links autophagy to lysosomal biogenesis. Science 332: 1429–1433 [DOI] [PMC free article] [PubMed] [Google Scholar]
- Settembre C, Zoncu R, Medina DL, Vetrini F, Erdin S, Erdin S, Huynh T, Ferron M, Karsenty G, Vellard MC et al (2012) A lysosome‐to‐nucleus signalling mechanism senses and regulates the lysosome via mTOR and TFEB. EMBO J 31: 1095–1108 [DOI] [PMC free article] [PubMed] [Google Scholar]
- Sherer NM, Lehmann MJ, Jimenez‐Soto LF, Ingmundson A, Horner SM, Cicchetti G, Allen PG, Pypaert M, Cunningham JM, Mothes W (2003) Visualization of retroviral replication in living cells reveals budding into multivesicular bodies. Traffic 4: 785–801 [DOI] [PubMed] [Google Scholar]
- Shin H‐W, Hayashi M, Christoforidis S, Lacas‐Gervais S, Hoepfner S, Wenk MR, Modregger J, Uttenweiler‐Joseph S, Wilm M, Nystuen A et al (2005) An enzymatic cascade of Rab5 effectors regulates phosphoinositide turnover in the endocytic pathway. J Cell Biol 170: 607–618 [DOI] [PMC free article] [PubMed] [Google Scholar]
- Slot JW, Geuze HJ (2007) Cryosectioning and immunolabeling. Nat Protoc 2: 2480–2491 [DOI] [PubMed] [Google Scholar]
- Urwin H, Authier A, Nielsen JE, Metcalf D, Powell C, Froud K, Malcolm DS, Holm I, Johannsen P, Brown J et al (2010) Disruption of endocytic trafficking in frontotemporal dementia with CHMP2B mutations. Hum Mol Genet 19: 2228–2238 [DOI] [PMC free article] [PubMed] [Google Scholar]
- van Weering JR, Sessions RB, Traer CJ, Kloer DP, Bhatia VK, Stamou D, Carlsson SR, Hurley JH, Cullen PJ (2012) Molecular basis for SNX‐BAR‐mediated assembly of distinct endosomal sorting tubules. EMBO J 31: 4466–4480 [DOI] [PMC free article] [PubMed] [Google Scholar]
- Vantaggiato C, Panzeri E, Castelli M, Citterio A, Arnoldi A, Santorelli FM, Liguori R, Scarlato M, Musumeci O, Toscano A et al (2019) ZFYVE26/SPASTIZIN and SPG11/SPATACSIN mutations in hereditary spastic paraplegia types AR‐SPG15 and AR‐SPG11 have different effects on autophagy and endocytosis. Autophagy 15: 34–57 [DOI] [PMC free article] [PubMed] [Google Scholar]
- Varga R‐E, Khundadze M, Damme M, Nietzsche S, Hoffmann B, Stauber T, Koch N, Hennings JC, Franzka P, Huebner AK et al (2015) In vivo evidence for lysosome depletion and impaired autophagic clearance in hereditary spastic paraplegia type SPG11. PLoS Genet 11: e1005454 [DOI] [PMC free article] [PubMed] [Google Scholar]
- Yu L, McPhee CK, Zheng L, Mardones GA, Rong Y, Peng J, Mi N, Zhao Y, Liu Z, Wan F et al (2010) Termination of autophagy and reformation of lysosomes regulated by mTOR. Nature 465: 942–946 [DOI] [PMC free article] [PubMed] [Google Scholar]
- Yu X, Long YC, Shen HM (2015) Differential regulatory functions of three classes of phosphatidylinositol and phosphoinositide 3‐kinases in autophagy. Autophagy 11: 1711–1728 [DOI] [PMC free article] [PubMed] [Google Scholar]
- Zhang X, Chow CY, Sahenk Z, Shy ME, Meisler MH, Li J (2008) Mutation of FIG4 causes a rapidly progressive, asymmetric neuronal degeneration. Brain 131: 1990–2001 [DOI] [PMC free article] [PubMed] [Google Scholar]
- Zhang Y, Zolov SN, Chow CY, Slutsky SG, Richardson SC, Piper RC, Yang B, Nau JJ, Westrick RJ, Morrison SJ et al (2007) Loss of Vac14, a regulator of the signaling lipid phosphatidylinositol 3,5‐bisphosphate, results in neurodegeneration in mice. Proc Natl Acad Sci USA 104: 17518–17523 [DOI] [PMC free article] [PubMed] [Google Scholar]
- Zhao YG, Codogno P, Zhang H (2021) Machinery, regulation and pathophysiological implications of autophagosome maturation. Nat Rev Mol Cell Biol 22: 733–750 [DOI] [PMC free article] [PubMed] [Google Scholar]
- Zolov SN, Bridges D, Zhang Y, Lee WW, Riehle E, Verma R, Lenk GM, Converso‐Baran K, Weide T, Albin RL et al (2012) In vivo, Pikfyve generates PI(3,5)P2, which serves as both a signaling lipid and the major precursor for PI5P. Proc Natl Acad Sci USA 109: 17472–17477 [DOI] [PMC free article] [PubMed] [Google Scholar]