

Abstract
Conventional PAH analytical methods are time-consuming and expensive, limiting their utility in time sensitive events (i.e. oil spills and floods) or for widespread environmental monitoring. Unreliable and inefficient screening methods intended to prioritize samples for more extensive analyses exacerbate the issue. Antibody-based biosensor technology was implemented as a quantitative screening method to measure total PAH concentration in adult oysters (Crassostrea virginica) — a well-known bioindicator species with ecological and commercial significance. Individual oysters were analyzed throughout the historically polluted Elizabeth River watershed (Virginia, USA). Significant positive association was observed between biosensor and GC–MS measurements that persisted when the method was calibrated for different regulatory subsets of PAHs. Mapping of PAH concentrations in oysters throughout the watershed demonstrates the utility of this technology for environmental monitoring. Through a novel extension of equilibrium partitioning, biosensor technology shows promise as a cost-effective analysis to rapidly predict whole animal exposure to better assess human health risk as well as improve monitoring efforts.
Keywords: Biosensor, Polycyclic aromatic hydrocarbons (PAH), Equilibrium partitioning, Oil spill response, Seafood safety
1. Introduction
Polycyclic aromatic hydrocarbons (PAHs) are a class of organic contaminants known for their ubiquity and persistence in the environment and their toxic, mutagenic, and carcinogenic potential (Chapman, 1990; Latimer and Zheng, 2003; Lawal, 2017). In the environment, PAHs exist as complex mixtures comprised of hundreds of different compounds. Natural processes such as volcanic eruptions, forest fires, and oil seeps release PAHs, but emissions from anthropogenic sources such as fossil fuel burning, production of coal-tar derivatives, and oil spills are major sources of PAH pollution in the environment (Neff et al., 2005; Abdel-Shafy and Mansour, 2016). Of particular concern is legacy contamination related to unregulated industrial discharge of PAHs prior to the US Clean Water Act of 1972, as well as increased PAH loads from non-point sources (e.g. vehicle exhaust) due to urbanization and continued reliance on fossil fuels (Wolfe et al., 1996; Van Metre et al., 2000; Walker et al., 2005; Minick and Anderson, 2017). As of 2019, PAHs are ranked within the top ten pollutants on the substance priority list of the Agency for Toxic Substances and Disease Registry (ATSDR) based on their frequency of detection, toxicity, and potential for human exposure at Superfund sites (ATSDR, 2020).
The distribution of PAHs in the aquatic environment is driven by their hydrophobicity and lipophilicity (Latimer and Zheng, 2003). PAHs can exist in different environmental phases including bound to organic sediments, lipid-bound within biological tissues via bioaccumulation, or freely dissolved in water at very low concentrations (Neff et al., 2005; Burgess et al., 2003). Sediment serves as a significant repository for PAHs as they readily sorb to the nonpolar, organic regions of sediment particles (Neff et al., 2005). When phases are at assumed equilibrium, the distribution of PAHs in the environment is proportional between phases via partitioning coefficients, or equilibrium constants. By using a simple ratio calculation, an unknown concentration of PAHs in one phase can be deduced by dividing the partition coefficient by the known concentration in another phase. The utility of the equilibrium partitioning (EqP) theory is observed in previous assessments of PAH bioavailability in which known concentrations in hydrophobic phases are used to estimate low PAH concentrations in the dissolved aqueous phase. The dissolved phase has the most potential for biological uptake but is difficult to measure by conventional analytical methods due to limitations in sample volume requirements. A prominent example of the utility of the EqP theory in bioavailability assessments is its fundamental role in techniques using polymer-based passive sampling devices (PSD). Based on the contaminant concentration sorbed within the PSD and the known partition coefficient, the freely dissolved PAH fraction can be estimated (DiToro et al., 1991; Leslie et al., 2002; Vrana et al., 2005; Ghosh et al., 2014; Mayer et al., 2014).
As sessile benthic filter feeders, bivalve molluscs such as oysters are highly sensitive to bioaccumulation of lipophilic PAH due to their detritivore feeding habits as well as their low metabolic capacity (James, 1989). PAH levels in bivalve tissue are among the highest observed in all food products, posing a potential human health risk (EFSA, 2008). Accordingly, oysters are a well-known biomonitoring species with widespread ecological significance and have served as a key sentinel species in the NOAA Mussel Watch Program since its establishment in 1975 (Farrington et al., 1983, 2016; Wade et al., 1998). For degraded estuarine sites, oyster restoration is a valuable remediation strategy that provides an array of ecosystem services such as stabilizing shorelines and supplying protective habitat for epibenthic fauna and juvenile fish (Grabowski et al., 2012). With a native habitat distribution ranging 8000 km from Canadian maritime provinces to the Gulf of Mexico as well as Panama and the Caribbean islands, the eastern oyster (Crassostrea virginica) is an internationally important commercial seafood product (NMFS, 2007). In 2020, C. virginica commercial fishery landings garnered over $140 million in the United States alone (NMFS, 2015).
While a multitude of PAHs compounds exist in the environment, regulatory bodies often base maximum acceptable levels on the concentrations of a subset of target PAHs. The subset of compounds analyzed in such assessments are considered priority pollutants due to their frequency and occurrence in environmental samples as well as their toxicity and potential for human exposure (ATSDR, 2020). Subsets of priority PAHs can vary depending on the regulatory agency and endpoint of concern. The list of 16 priority PAHs issued by the U.S. Environmental Protection Agency (EPA) is commonly analyzed for environmental risk assessments and monitoring. This list was originally developed to assess human health risk from drinking water, but these compounds have since served as target analytes in food-related risk assessments (Andersson and Achten, 2015). Although there is no legislation on maximum acceptable PAH levels in food in the United States, the European Food Safety Authority (EFSA) within the European Union regulates PAH levels in a wide variety of food products entering the market. As of 2011, maximum levels have been set for benzo [a] pyrene and the sum of 4 PAH compounds, benzo [a] pyrene, benz [a] anthracene, benzo [b] fluoranthene, and chrysene (PAH4), in fresh, chilled, or frozen bivalves (EC 835/2011) through the European Committee for Standardization (CEN)-accepted GC–MS gas chromatography–mass spectrometry (GC-MS) method (EN 16619: 2015) (European Union, 2011). Adopted by the EPA in 1984, the toxic equivalency factor approach to human health risk assessments considers carcinogenic potency of individual PAH compounds (EPA, 1984; Nisbet and LaGoy, 1992). In this technique, individual PAH concentrations are converted to their toxic equivalent concentration relative to benzo [a] pyrene (BaPE) and used to assess cancer risk from exposure (EPA, 1984; Nisbet and LaGoy, 1992; ATSDR, 1995). This method has also been utilized by the FDA following the Deepwater Horizon oil spill in 2010 and the Virginia Department of Health’s Division of Shellfish Sanitation (VDH-DSS) in 2012 (VDH, 2012).
Standard chemical analyses such as (GC–MS) to quantify PAH levels in seafood are often time-consuming, labor-intensive, and expensive on a per sample basis (Mauseth and Challenger, 2001; Mastovska et al., 2015; Zhang et al., 2018; Felemban et al., 2019). Additionally, complex sample extraction and clean up methods prior to analysis require large volumes of hazardous organic solvents (Farré et al., 2010). In large scale surveys or in rapid response scenarios (e.g. oil spills or flooding events), employment of GC–MS alone is inefficient due to slow assessment time and cost. Methods exist to quickly and inexpensively screen samples for further GC–MS analysis such as high-performance liquid chromatography coupled with fluorescence detection (HPLC-FLD); however, this method is limited in its sensitivity and accuracy and it still requires multiple steps of sample processing and preparation (Plaza-Bolaños et al., 2010; Zelinkova and Wenzl, 2015). For seafood contamination assessment following an oil spill, sensory analysis (i.e. sniff-testing) has been used to prioritize samples for further GC–MS analysis based on the detection of petroleum taint in the seafood sample (US Food and Drug Administration (FDA), 2010; Moller et al., 1999). This testing is conducted by a panel of experts that have undergone highly specialized training (Yender et al., 2002); however, results may be unreliable due to the sensitivity and experience of panel members as well as compromised sample integrity due to factors unrelated to petroleum (e.g. putrefaction or fecal contamination) (Mauseth and Challenger, 2001). Additionally, sensory analysis is not a quantitative approach — PAH levels and relative toxicity remain unknown until GC–MS analysis. Faster, more cost-effective, and reliable screening methods that can measure PAH levels in seafood are needed to better assess human health risk.
In an effort to provide faster, economical and reliable PAH analyses, a variety of immunoassay methods have been examined for the detection and quantification of PAH in environmental samples (EPA, 1996a,b; Spier et al., 2012; Behera et al., 2018). Our lab has developed a rapid, near-real-time method for PAH quantitation using the KinExA Inline Biosensor (Sapidyne Instruments, Boise, ID) and a mouse-derived anti-pyrene-butyric acid monoclonal antibody, 2G8, with previously demonstrated uniform selectivity for a range of 3–5 ring PAHs (Li et al., 2016). Additionally, the biosensor is a user-friendly instrument that can directly analyze environmental samples (i.e requires minimal sample preparation). It has been used to quantify PAH in porewater samples in the Chesapeake Bay and Houston ship channel and has demonstrated strong positive correlation with PAH measurements of sediment porewater when using passive sampling and GC–MS (Hartzell et al., 2017; Conder et al., 2021; Camargo et al., 2022).
Serving as the study area, the Elizabeth River is a tidal estuary in southeastern Virginia (USA) surrounded by four major cities and comprised of the Eastern, Western, and Southern branches and the Lafayette River. The Elizabeth River was selected on the basis of significantly elevated PAH levels observed in sediment throughout the river due to numerous military and industrial activities. Coal and petroleum storage and transport, shipbuilding and repair activities, as well as creosote-based wood treatment facilities active until the 1990s were predominant sources of PAH pollution. Atlantic Wood Industries, a designated Superfund Site, was one of three major wood treatment facilities located in this river. In 2004, the Elizabeth River had the highest known PAH concentrations in sediment worldwide and has been a site for ongoing remediation efforts (DiGiulio and Clark, 2015).
The purpose of this study is to evaluate antibody-based biosensor technology as a rapid screening method to measure PAH concentrations in adult oysters (C. virginica) and assist in regulatory assessments and environmental monitoring. Through a novel extension of the equilibrium phase partitioning theory, we hypothesize that a strong association will be observed between biosensor measurement of aqueous phase concentrations and GC–MS measurement of tissue concentrations in field-collected oysters. Based on this association, near real-time biosensor measurements can be used to predict tissue concentrations for rapid quantitative screening. Evaluation of the biosensor screening method consisted of a linear regression analysis comparing biosensor measurements of PAH concentrations to that of GC–MS. To relate the PAH totals screened by biosensor to human health risk, mean biosensor measurements of total PAH concentration per site were then compared to the respective summations of several regulatory PAH subsets involved in determining human health risk. Lastly, to demonstrate the utility of the biosensor screening method in environmental monitoring efforts, biosensor-derived concentrations in oysters throughout the Elizabeth River watershed were mapped and compared to known historic sediment concentrations.
2. Materials and methods
2.1. Sample collection
Oysters were sampled from beach shorelines as well as bridge and pier pilings at twenty-one sites throughout the Elizabeth River watershed (listed in Tables 1 and 2) and transported from the field on ice. In the laboratory, whole oysters were stored at −20 °C and thawed at room temperature for processing. Oyster interstitial fluid, defined as the fluid pooled in the shell cavity upon opening of the thawed oyster, was collected from individual oysters with a glass disposable Pasteur pipet, filtered through a 0.45 μm PTFE syringe filter and then stored in 20 mL glass scintillation vials. Biosensor analysis (see below) was employed to measure PAH concentration in interstitial fluid from six individual animals per site. Soft tissues from the same six individual oysters per site were homogenized and pooled to provide sufficient sample material to achieve a sensitive detection limit for GC–MS analysis. The composite tissue samples were stored at −20 °C until extraction and further preparation for GC–MS analysis. A schematic of the experimental design is presented in Fig. 1.
Table 1.
Evaluation of risk assessment accuracy under EU regulation based on predicted individual oyster tissue concentrations at Elizabeth River sites.
| SITE ID | Predicted individual oyster concn.a | Measured PAH4 concn.a | Measured 64 PAHs concn.a | Prediction accuracy | |||||
|---|---|---|---|---|---|---|---|---|---|
| A | B | C | D | E | F | ||||
| MP2 | U | U | U | U | U | U | 168.7 | 618.3 | 0% |
| JRWS | U | U | U | U | U | U | 23.6b | 201.8 | 100% |
| PARCR | 74.9 | 108.9 | 331.0 | U | 166.8 | 99.9 | 98.3 | 402.8 | 83% |
| JCBH | 363.9 | 432.6 | 568.2 | 539.5 | 384.8 | 516.5 | 162.1 | 607.9 | 100% |
| JCBR | 603.6 | 707.2 | 765.3 | 815.5 | 678.8 | 606.0 | 443.5 | 1648.6 | 100% |
| RS | 1992.0 | 1645.4 | 1215.2 | 1512.0 | 1336.7 | 1832.2 | 1883.6 | 5889.7 | 100% |
| GR | U | U | U | U | U | U | 33.2 | 221.9 | 0% |
| CLY | U | U | U | U | U | U | 33.7 | 219.0 | 0% |
| HB | U | U | U | U | U | 9.9 | 19.1b | 160.1 | 100% |
| HR | 27.6 | U | U | U | U | 9.11 | 79.0 | 357.4 | 17% |
| PB | 60.0 | U | 56.4 | 45.5 | 194.4 | 27.3 | 41.6 | 387.2 | 83% |
| GLM | 39.5 | 28.1 | 62.4 | U | 183.0 | U | 126.2 | 485.8 | 67% |
| 264 | 105.4 | 234.2 | 94.1 | 43.8 | U | 16.1 | 49.2 | 279.0 | 67% |
| HS | 102.9 | 267.8 | 274.2 | 247.2 | 227.1 | 137.1 | 168.5 | 831.4 | 100% |
| NSC | 304.1 | 162.4 | 241.0 | 247.4 | 161.3 | 238.7 | 106.7 | 530.1 | 100% |
| CMP | 467.1 | 178.9 | 249.3 | 121.1 | 63.4 | 179.2 | 183.5 | 804.9 | 100% |
| BK | 283.7 | 103.6 | 138.2 | 748.1 | 222.8 | 376.6 | 204.6 | 751.8 | 100% |
| MPB | 380.7 | 263.5 | 334.4 | 160.0 | 233.1 | 230.7 | 285.1 | 951.4 | 100% |
| PCR | 201.8 | 587.5 | 410.9 | 228.4 | 124.9 | 156.7 | 380.4 | 1263.8 | 100% |
| 164 | 265.1 | 331.5 | 312.5 | 209.7 | 560.9 | 357.3 | 230.7 | 738.7 | 100% |
| JB | 592.1 | 596.5 | 839.2 | 214.0 | 178.7 | 850.1 | 512.1 | 1341.1 | 100% |
Table 2.
Evaluation of risk assessment accuracy under VDH multi-tier advisory based on predicted individual oyster tissue concentrations at Elizabeth River sites.
| SITE ID | Predicted individual oyster concn.a | Measured 15BaPE concn.a | Advisory tierb | Prediction accuracy | |||||
|---|---|---|---|---|---|---|---|---|---|
| A | B | C | D | E | F | ||||
| MP2 | U | 11.7 | 4.8 | 3.4 | 5.5 | 5.8 | 65.3 | 3 | 0% |
| JRWS | 2.3 | U | 1.2 | U | U | U | 16.2 | 1 | 100% |
| PARCR | 18.7 | 23.7 | 56.0 | 5.5 | 32.1 | 22.4 | 20.2 | 1 | 67% |
| JCBH | 60.7 | 70.7 | 90.4 | 86.3 | 63.8 | 82.9 | 40.6 | 2 | 0% |
| JCBR | 95.6 | 110.7 | 119.1 | 126.4 | 106.5 | 95.9 | 54.3 | 3 | 33% |
| RS | 297.4 | 247.0 | 184.5 | 227.7 | 202.2 | 274.2 | 323.0 | 4 | 100% |
| GR | U | U | U | 0.8 | 0.2 | 5.6 | 3.8 | 1 | 100% |
| CLY | U | U | U | 1.9 | U | U | 4.5 | 1 | 100% |
| HB | U | 6.2 | 2.9 | 3.6 | U | 9.3 | 2.2 | 1 | 100% |
| HR | 11.8 | 6.9 | 1.4 | U | 3.7 | 9.2 | 11.5 | 1 | 100% |
| PB | 16.6 | 6.7 | 16.0 | 14.4 | 36.1 | 11.8 | 5.3 | 1 | 83% |
| GLM | 13.6 | 11.9 | 16.9 | 0.3 | 34.4 | 5.0 | 23.4 | 1 | 83% |
| 264 | 23.2 | 41.9 | 21.5 | 14.2 | 7.5 | 10.2 | 3.7 | 1 | 83% |
| HS | 22.8 | 46.8 | 47.7 | 43.8 | 40.9 | 27.8 | 102.0 | 4 | 0% |
| NSC | 52.1 | 31.4 | 42.9 | 43.8 | 31.3 | 42.5 | 26.4 | 2 | 83% |
| CMP | 75.7 | 33.8 | 44.1 | 25.4 | 17.0 | 33.9 | 56.1 | 3 | 17% |
| BK | 49.1 | 22.9 | 27.9 | 116.6 | 40.2 | 62.6 | 30.4 | 2 | 50% |
| MPB | 63.2 | 46.1 | 56.4 | 31.1 | 41.7 | 41.4 | 52.3 | 3 | 33% |
| PCR | 37.2 | 93.2 | 67.6 | 41.0 | 26.0 | 30.6 | 48.5 | 2 | 67% |
| 164 | 46.4 | 56.0 | 53.3 | 38.3 | 89.4 | 59.8 | 27.8 | 2 | 0% |
| JB | 93.9 | 94.6 | 129.8 | 38.9 | 33.8 | 131.4 | 65.6 | 3 | 33% |
U = below range of regression model (Figure S2).
μg/kg wet wt.
Tier allocations: Tier 1: less than 25 μg/kg — no advisory; Tier 2: 25–50 μg/kg — two meals per month; Tier 3: 50–100 μg/kg — one meal per month; Tier 4: greater than 100 μg/kg — do not eat oysters from advisory area.
Fig. 1.
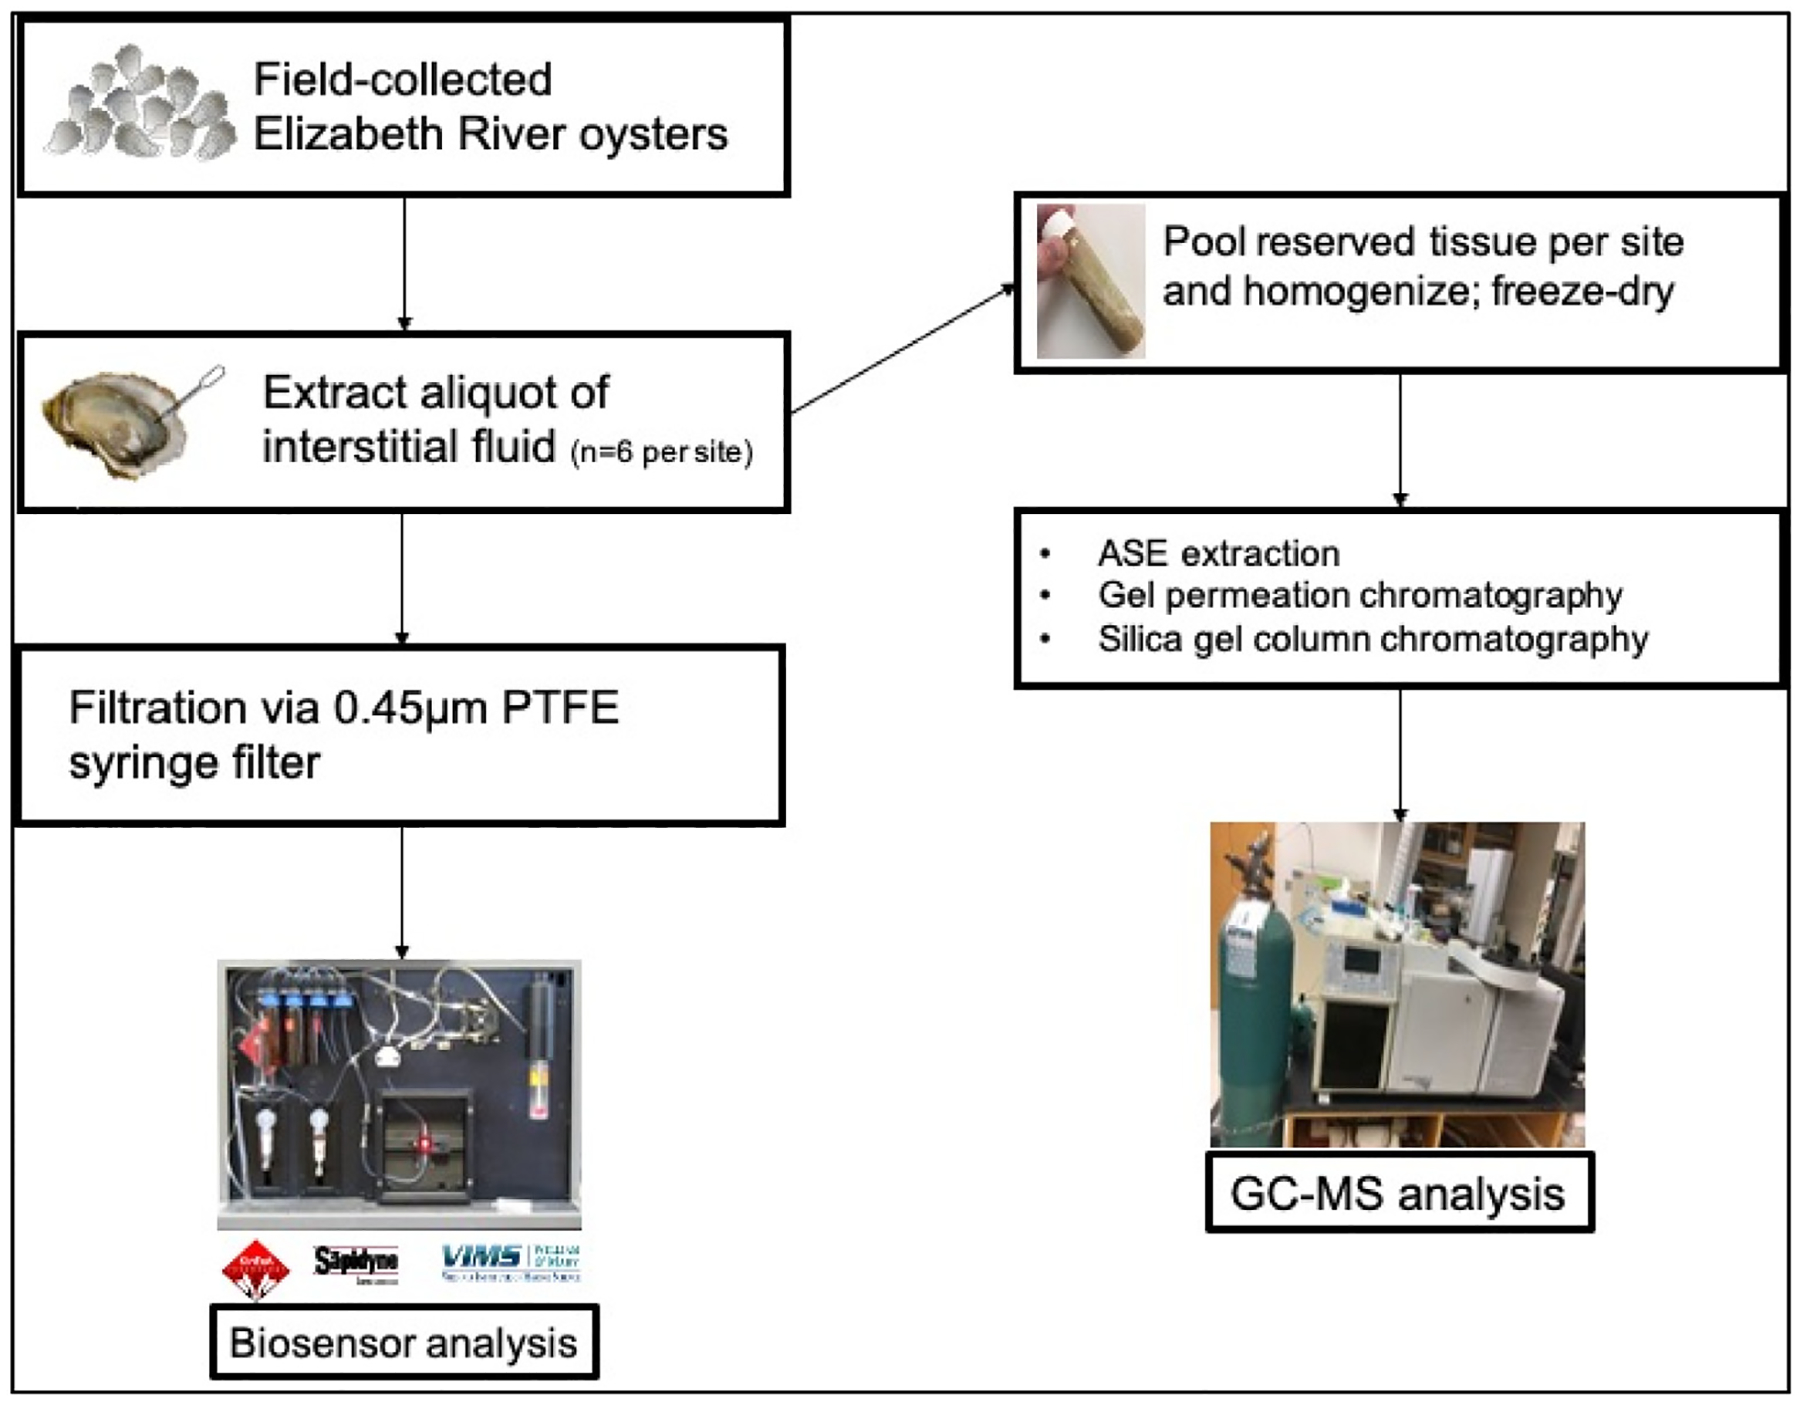
Schematic of study design.
2.2. Biosensor analysis of PAHs
Features and design for the KinExA Inline Sensor as well as development and screening procedures for the monoclonal anti-PAH antibody (mAb 2G8) employed in this study have been previously described (Bromage et al., 2007; Spier et al., 2011; Li et al., 2016). The Inline instrument uses computer programmable fluidics to process up to eight samples in series and provides precise quantitative measurements of the total concentration of 3–5 ring PAHs when using the 2G8 monoclonal antibody (Li et al., 2016). The instrument functions as a kinetic assay: the antibody binds to PAH in the aqueous sample initially, then the sample-antibody mixture is passed over a stationary antigen in the detector flow cell where free unbound antibody is retained and measured. The 2G8 antibody used in this study contains a covalently bound fluorescent tag (648 nm) measured by the instrument so the biosensor signal response (dV) is inversely proportional to the PAH content in the sample. The automated sample processing cycle takes less than ten minutes and includes steps for mixing the sample with the antibody, rinsing the flow cell and replacing and loading of antigen coated beads for the next sample in the cycle. Each day prior to sample analysis a six-point calibration curve is generated using double-deionized water (ddH2O) as an analytical blank and a dilution series of phenanthrene standards with concentrations ranging from 0.5 to 2.5 μg/L to determine the linear range of the detector’s dV response via log-linear regression analysis. Based on the signal response measured in the oyster interstitial fluid sample, PAH concentrations were calculated and reported in μg/L.
2.3. GC–MS analysis
GC–MS analyses were conducted using standard protocols described previously (Unger et al., 2008; Li et al., 2016). In brief, composite tissue samples were freeze-dried in pre-cleaned glass troughs. Samples and laboratory blanks were spiked with a deuterated surrogate PAH standard and extracted using a Dionex® (Bannockburn, IL) accelerated solvent extractor (ASE 300) with 100% dichloromethane. The sample volumes were reduced under a gentle stream of nitrogen at 40 °C in a TurboVap® evaporator. Following a standard protocol, a high-performance liquid chromatograph with a gel permeation column was used for size exclusion separation. The samples were fractionated, and polar compounds removed via open column chromatography containing 10.0 g of deactivated silica gel eluted with 100% hexane followed by an elution with 80/20% hexane/dichloromethane. The extracts were solvent exchanged to 100% dichloromethane, concentrated to a final volume. Calibration standards and samples were spiked with 0.1 mL of internal standard, p-terphenyl. A 7- to 10-point calibration curve was generated for analysis of individual PAH analytes and surrogate standards. A total of 64 analytes — both methylated and parent compounds were measured and include the priority PAHs utilized in subsequent calibrations to regulatory subset lists (Table S1). PAH measurements in tissue are reported in μg/kg wet weight. Average surrogate standard recoveries are also reported.
2.4. Statistical methods
Using R statistical computing and graphics software, simple linear regression models were used to examine associations. A 95% confidence band around the regression was determined through t-based approximation in R. The regression line of best fit is described by the following equation:
where x and y serve as independent and dependent variables, respectively. For this study, x represents biosensor-measured PAH concentrations in oyster interstitial fluid and y serves as the GC–MS-measured PAH concentrations in oyster tissue. The regression slope, b, serves as the partition coefficient between interstitial fluid and soft tissues. The y-intercept for the model is a.
2.5. Evaluation of instrument precision and method detection limit for biosensor
An aliquot of oyster interstitial fluid was measured in triplicate for six oysters from three sites (3 samples per oyster; 18 samples per site; 54 samples total). The three sites, MP2, JCBR, and RS, were selected to represent high-, mid-, and low-range PAH concentrations of the dataset to assess the biosensor’s performance at each level. The method detection limit (MDL) was determined following the EPA standard procedure described in EPA 821 − R − 16 − 006 (EPA, 2016). Briefly, an initial MDL was estimated by subtracting three times the standard deviation of a set of method blanks from the mean-determined concentration. A spiking level of 0.5 μg/L was selected based on the estimated MDL. A minimum of 7 spiked samples and 7 method blanks (ddH2O) were prepared on 6 separate calendar days and analyzed on 6 separate calendar days. A Welch’s t-test was conducted to compare means of method blanks to spiked samples, to ensure spiking levels were significantly different from zero. Based on a p< 0.05, the null hypothesis of equal means could be rejected. An MDL was calculated based on spiked samples and method blanks, MDLs and MDLb respectively. The greater of MDLs and MDLb was selected as the initial MDL.
2.6. Method calibration to priority PAH subsets
Calibration to EU Regulations (EFSA-4)
From the total 64 analytes targeted for GC–MS analysis of Elizabeth River oysters, concentrations for the EFSA-4 subset (benz[a]anthracene, chrysene, benzo[b]fluoranthene, benzo[a]pyrene) were summed for each site (see Table S3 for calculations). The maximum acceptable level for the sum of the 4 PAHs is 30 μg/kg wet weight (Regulation (EU) No. 835/2011) (European Union, 2011). Dry weight concentrations were converted to wet weight by multiplying by the total percent moisture loss from freeze-dried tissue samples. Elizabeth River oyster sampling sites were evaluated against this regulatory limit.
Calibration to VDH oyster consumption advisory guidelines (VDH-15)
Calibration for this assessment was based on the 2012 Health Consultation released by VDH (VDH, 2012). Fifteen PAH compounds were selected on the basis of their known toxicity through evaluations by the Agency for Toxic Substances and Disease Registry (ATSDR) (ATSDR, 1995). The Division of Environment Epidemiology (DEE) of the VDH used toxicity equivalency factors (TEF) to assess the carcinogenic potential of the 15 PAHs analyzed (acenanapthylene, acenapthene, fluorene, phenanthrene, anthracene, fluoranthene, pyrene, benz[a]anthracene, chrysene, benzo[b]fluoranthene, benzo[k]fluoranthene, benzo[a]pyrene, ideno[1,2,3-cd]pyrene, dibenz[a,h]anthrancene, benzo[g,h,i]perylene) (Table S2). By multiplying the concentration of each compound by its respective TEF, the benzo [a] pyrene equivalent concentration can be determined (BaPE). A calibrated model was generated comparing the summation of 15 BaPEs (VDH-15) and biosensor measurements across sites (Figure S2). Concentrations at each Elizabeth River site were evaluated under the advisory guidelines determined by VDH (VDH, 2012). Guidelines developed by the VDH for consumption of PAH-contaminated oysters based on BaPE concentrations are as follows: less than 25 μg/kg — no advisory, 25–50 μg/kg — two meals per month, 50–100 μg/kg — one meal per month, greater than 100 μg/kg — do not eat oysters from advisory area. A meal consists of a dozen 14 g oysters for an adult with an average weight of 80 kg.
Calibration to EPA’s list of 16 priority PAHs (EPA-16)
Unlike EFSA-4 and VDH-15, consumption guidelines or regulatory limits for this subset of priority PAHs in food do not exist but this list is often used in environmental monitoring efforts. Therefore, the association between EPA-16 PAH subset and biosensor measurements of total 3- to 5-ring PAHs across sites was evaluated. Table S4 provides respective compound concentrations and totals for each site.
3. Results and discussion
3.1. Linear regression analysis of biosensor vs. GC–MS technique
A strong association between PAH concentrations measured by biosensor and conventional GC–MS supports the role of biosensor technology as a screening method to assess tissue contamination in oysters via the application of the equilibrium partitioning theory. There was a strong positive relationship (R2 = 0.88) between interstitial fluid PAH concentrations measured by the biosensor and tissue PAH concentrations (64 analytes) measured via GC–MS (Fig. 2).
Fig. 2.
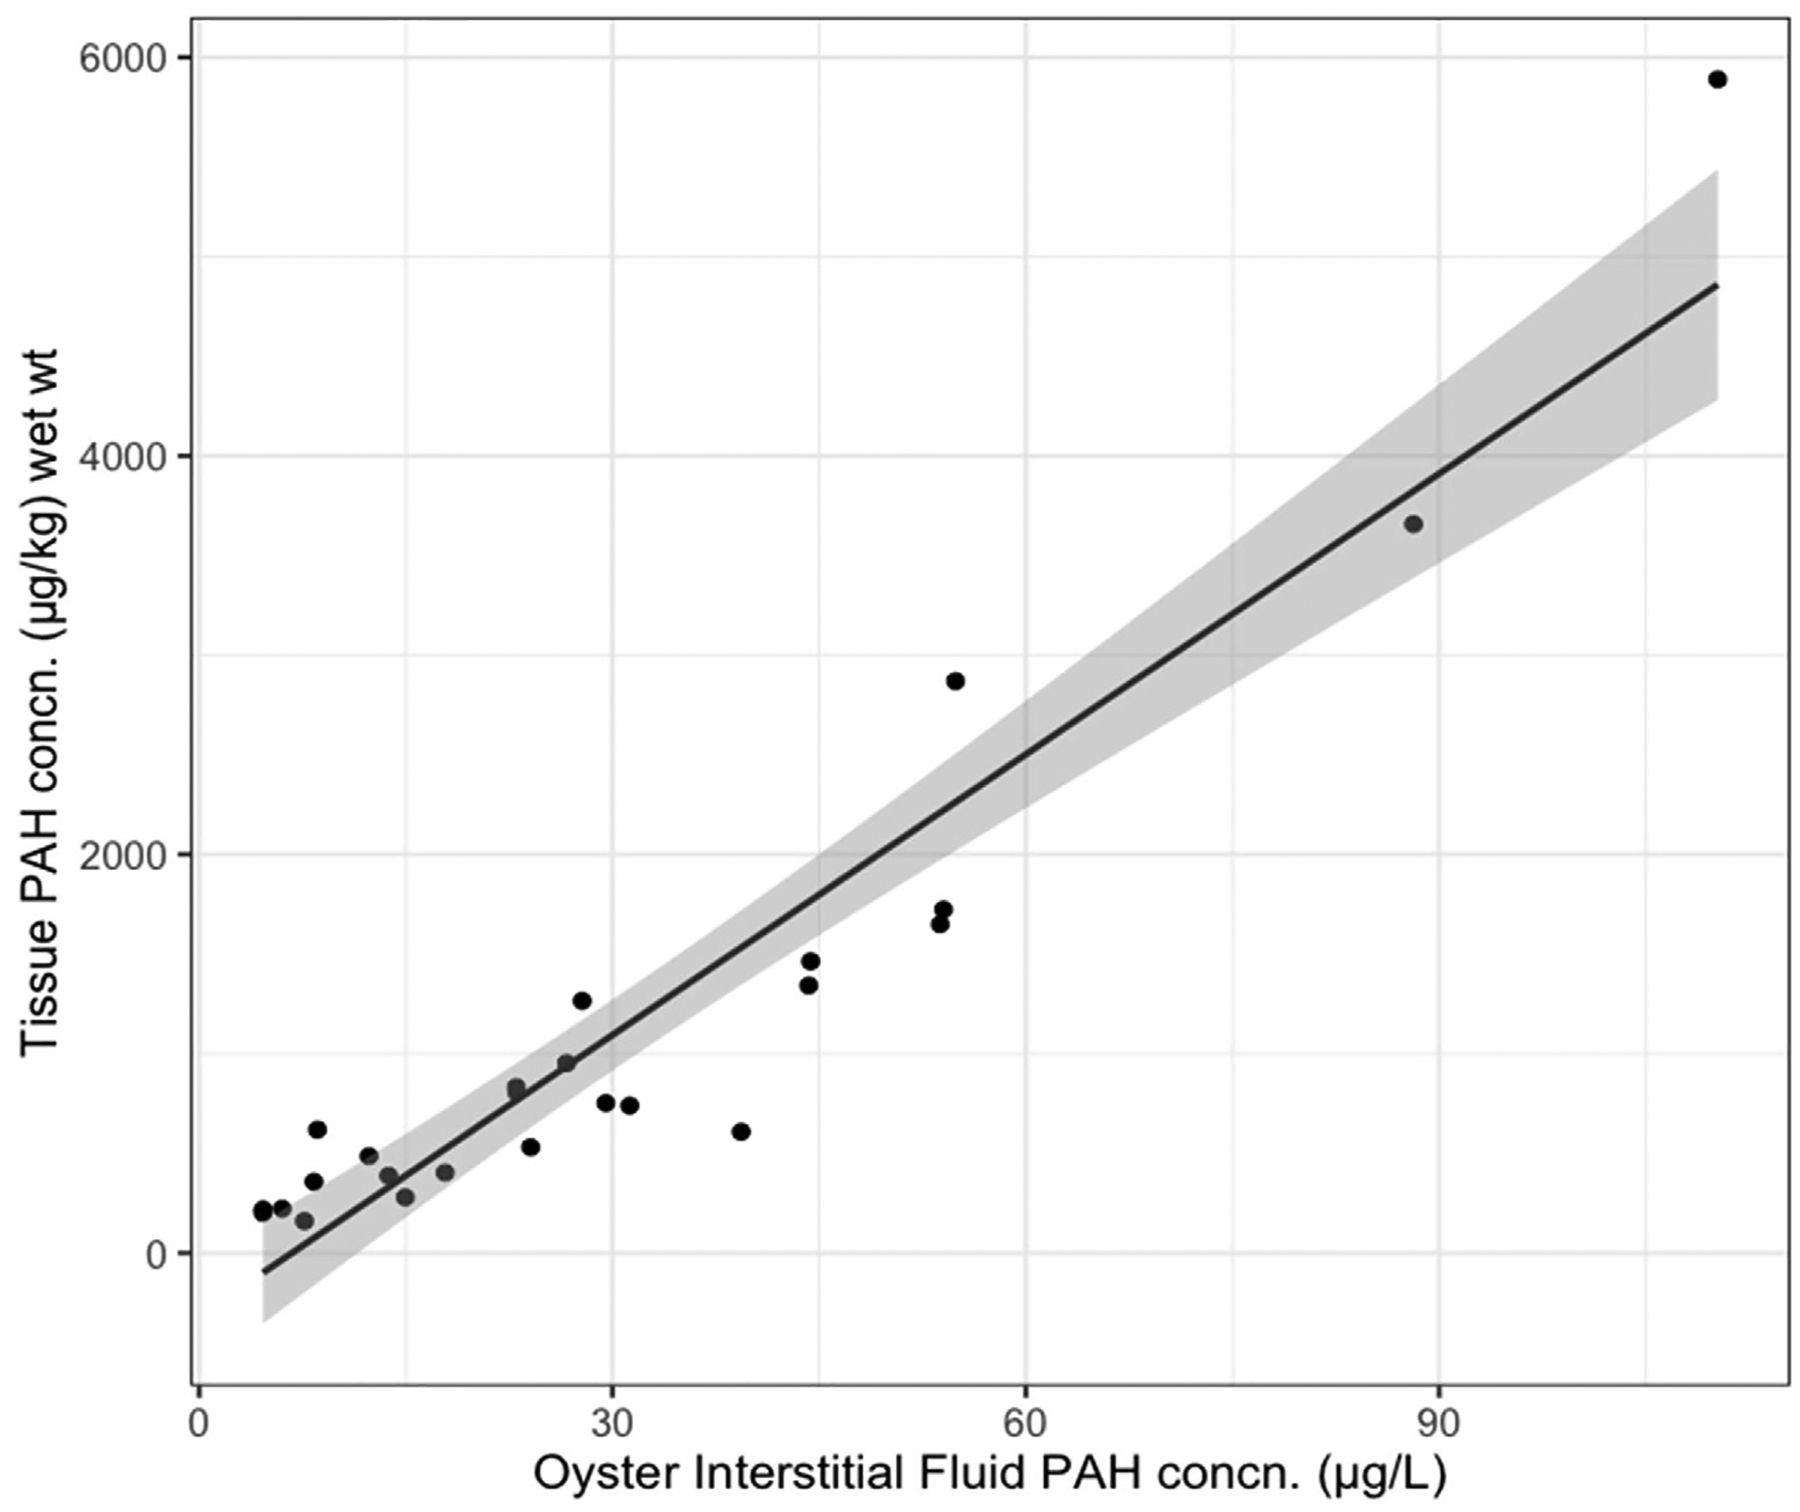
PAH levels in oyster soft tissues in relation to interstitial fluids. Linear regression comparing mean oyster interstitial fluid PAH concentration (n = 6) to pooled, composite tissue samples of the same oysters (64 PAH analytes; y = 47.0; x-316.0; r2 = 0.88; df = 23). Gray band denotes 95% confidence interval around regression.
The following equation was determined from linear regression analysis:
The slope of the fitted regression line, 47.0, serves as the model-derived equilibrium partition coefficient which can be used to predict tissue concentrations (y) from oyster interstitial fluid (x). The y-intercept is −316.0. Additionally, the mean surrogate standard recoveries for GC–MS analysis were as follows: d8-napthalene: 13%; d10-acenaphthene: 26%; d10-phenanthrene: 48%; 1,1’ binaphthyl: 52%; d12-chrysene: 78%; d12-perylene: 66%.
With the development and validation of a steady-state equilibrium partitioning model, unknown phase concentrations can be predicted, particularly if they are within the concentration range evaluated. An order of magnitude difference observed between PAH concentrations measured in interstitial fluid and soft tissue suggests an adherence to equilibrium phase partitioning principles within the organism. Hydrophobic organic contaminants will more readily bind to lipid-rich sites such as fatty tissue; thus, tissue PAH concentrations will be comparatively higher than those in interstitial fluids. Although biosensor measurements are precise (see below), several data points fall outside the 95% confidence band around the regression line (Figs. 2 and 5). The observed variation is reasonable and expected for this study as two entirely different matrices are being compared: average interstitial fluid concentrations of individual oysters and concentrations measured in pooled oyster tissue homogenate. Nonetheless, the strong association indicates that measuring PAH levels in interstitial fluid alone can give reasonably precise estimates of whole animal exposure. Biosensors have had previously demonstrated success as rapid, low-cost methods to analyze pathogens and marine biotoxins in shellfish (Nordin et al., 2017; Campàs et al., 2007; Tian et al., 2021). To our knowledge, this the first study to demonstrate the application of biosensors for measuring environmental contaminants in shellfish, an equally important food safety threat, through a novel implementation of the equilibrium partitioning theory.
Fig. 5.
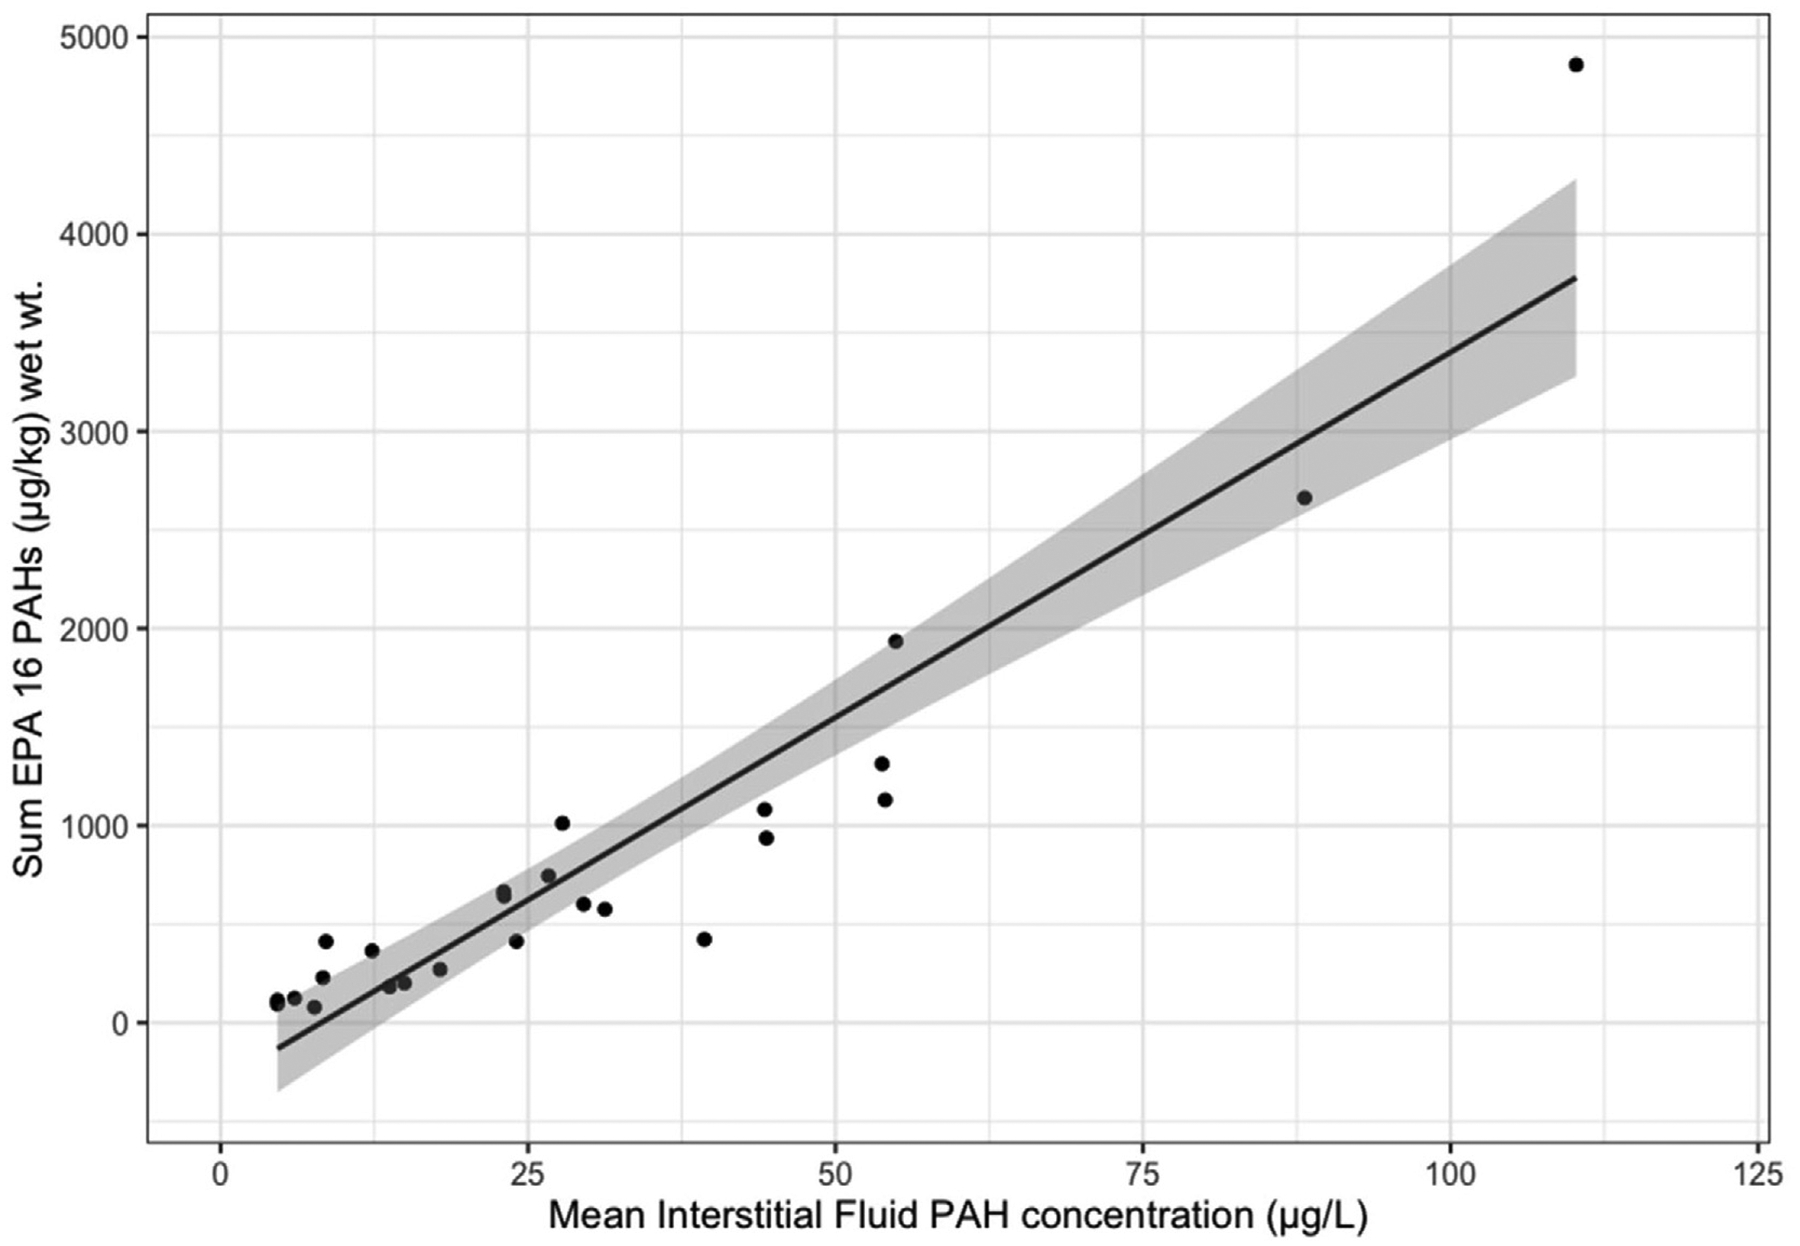
Combined data for PAH analytes (sum EPA 16 PAHs) in oyster soft tissues in relation to mean PAH levels in interstitial fluids. Linear regression comparing mean oyster interstitial fluid PAH concentration (n = 6) to pooled, composite tissue sample.
3.2. Method performance
Small standard deviations observed in the analytical replicates demonstrates the precision of the biosensor measurements (Fig. 3). Moreover, estimated differences between animals within stations indicate that individual variation in uptake is far greater than the precision of the method (Fig. 4).
Fig. 3.
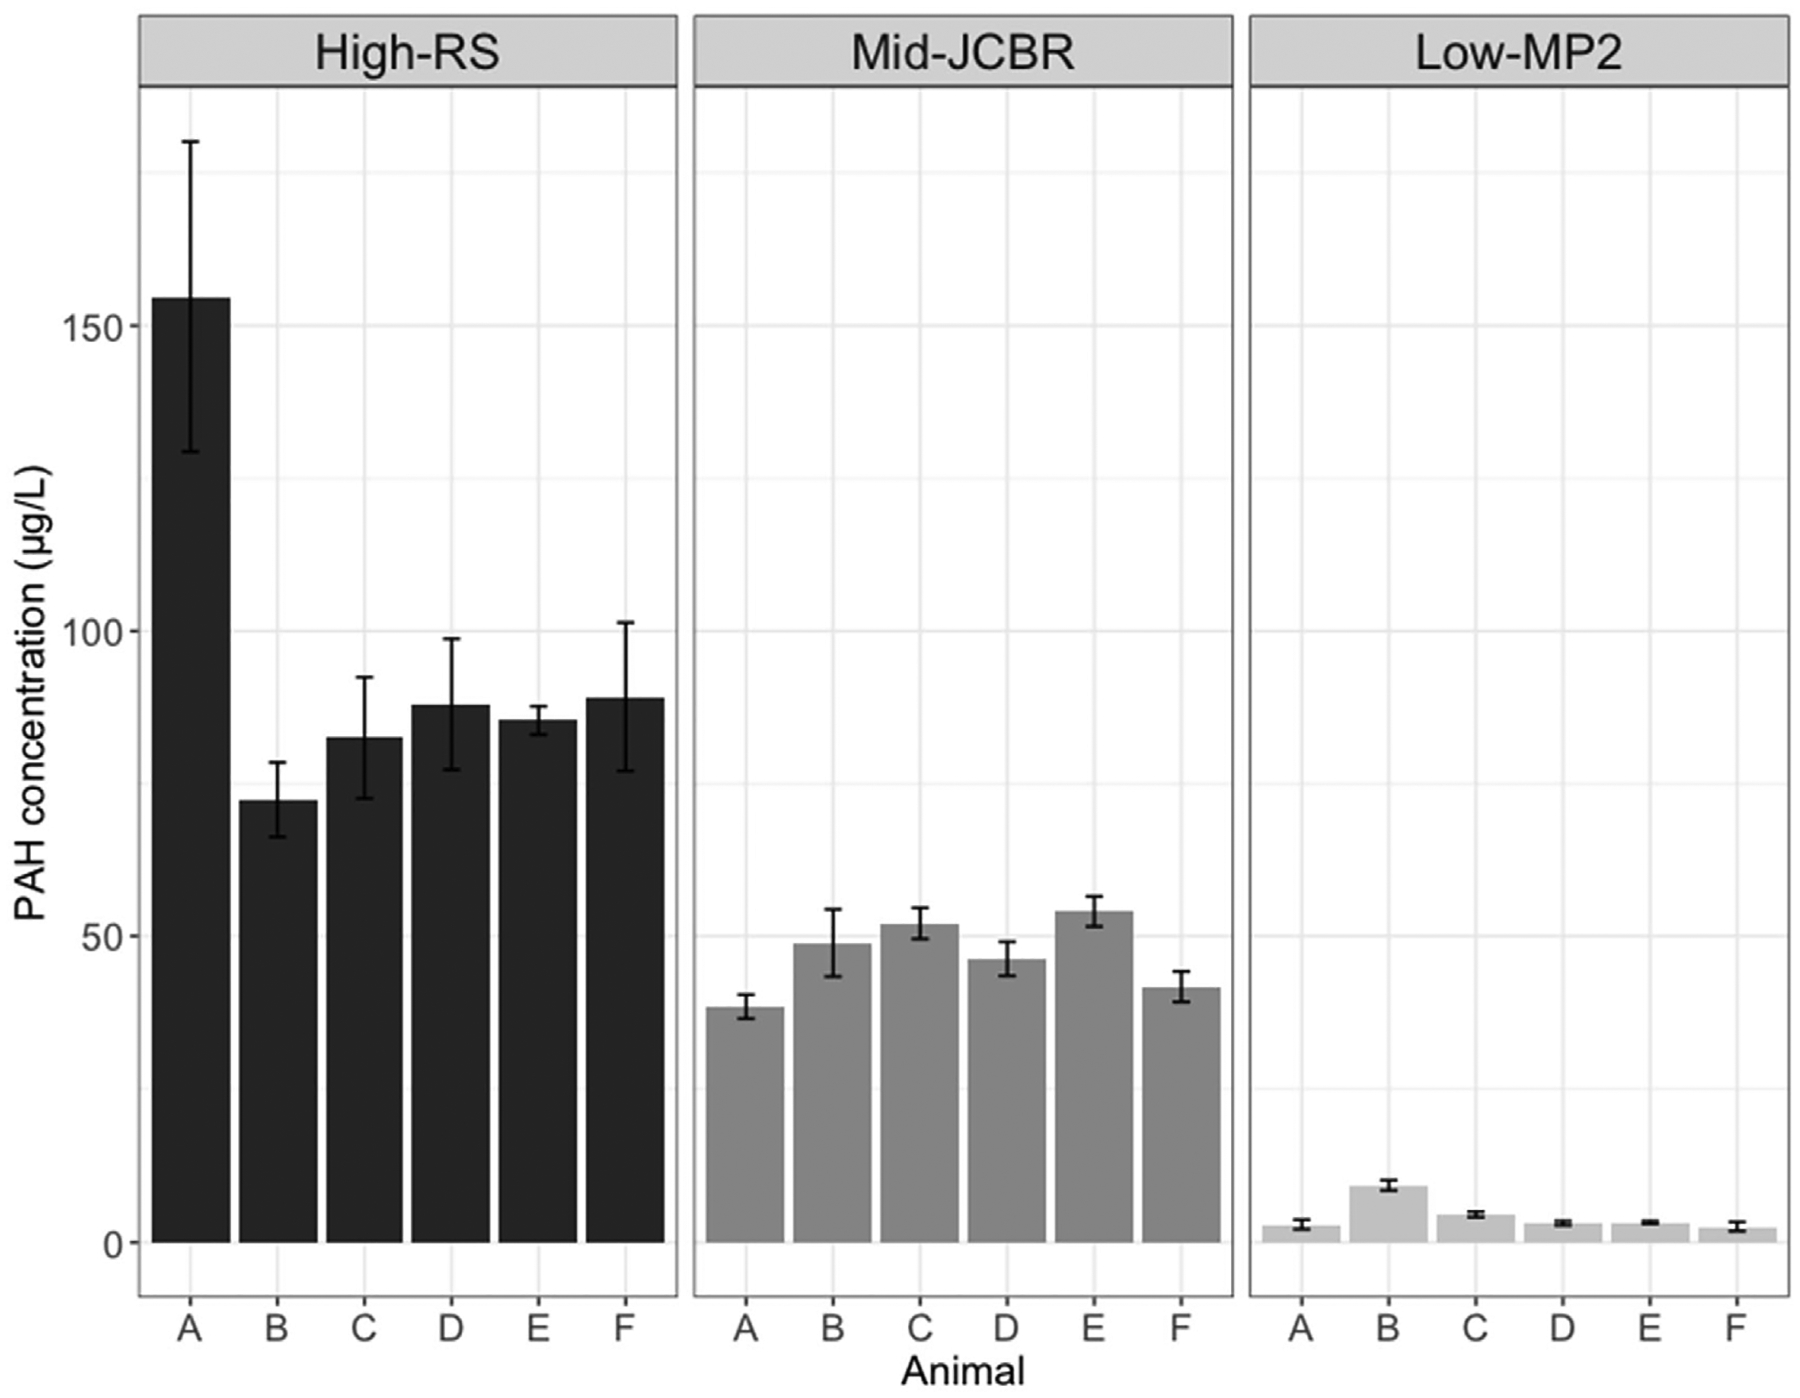
Analytical replication of interstitial fluids from 6 individual oysters at sites with high-, mid-, and low-ranging PAH concentrations using the biosensor method. Triplicate aliquots of interstitial fluid per oyster (A–F) at each site were measured; mean concentrations for each animal are reported. Error bars depict standard deviations.
Fig. 4.
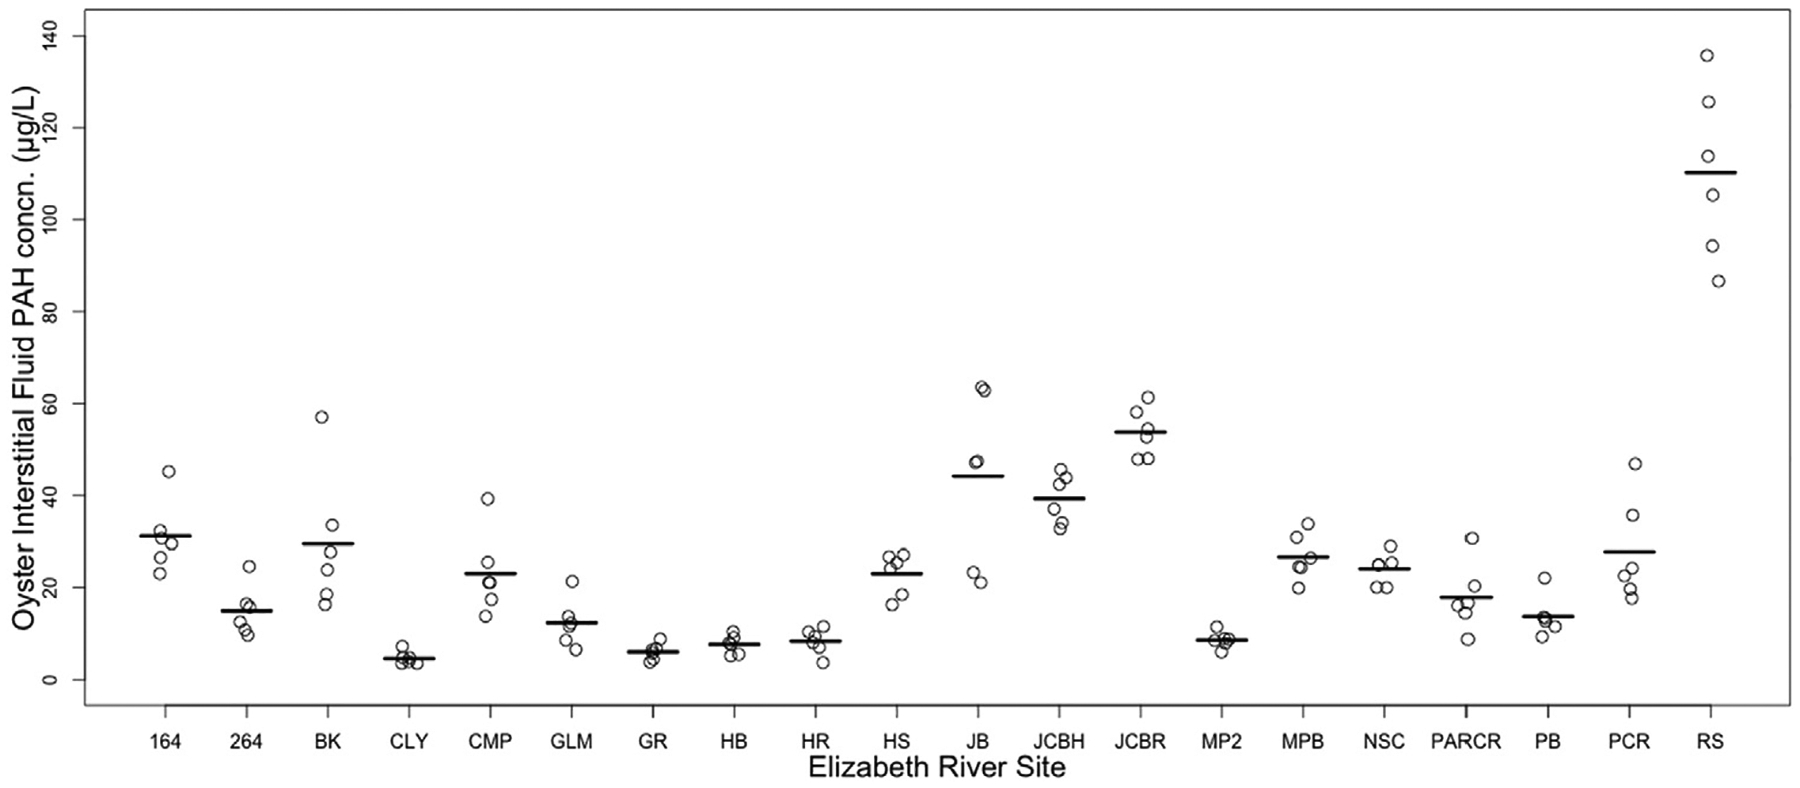
Measurements of PAH concentrations among individual oysters at each site using the biosensor method (n = 6 per site). Line indicates mean for each site.
Notably, because of the high sensitivity, reproducibility, and small sample volume requirement of the biosensor, PAH concentrations can now be measured rapidly and at the scale of individual oysters. With this feature, variability between individual oysters within the population at a specific site can be determined (Fig. 4). An efficient means to measure concentrations in individual animals is valuable as contamination at sites occurs heterogeneously and sample variation is obscured when data are pooled (Bignert et al., 1993). Analysis of individuals also allows for detection of single outliers which may influence the overall trends observed or reveal unknown hotspots. Evaluation of the method detection limit shows that the limit for detecting PAH in interstitial fluid is 0.39 μg/L, an order of magnitude below the lowest concentration measured in any oyster interstitial fluid to date. Previous studies have investigated commercial enzyme-linked immunoassay (ELISA) kits to rapidly screen PAH levels in biological samples such as oiled seabird sera and crab urine and hemolymph (Fritcher et al., 2002; Fillmann et al., 2002). While the applications of these tests were deemed promising for monitoring PAH exposure in biota, these immunoassays were much less sensitive with detection limits in the ppm range. Furthermore, the results from these assays are only semi-quantitative and still required several sample preparation and extraction steps prior to analysis. We present a method that can accurately quantify total PAH concentrations in the sub-ppb range with minimal sample preparation.
3.3. Assessment of sites in context of priority PAH subsets
As revealed in the original regression (targeting 64 PAH analytes for analysis), a significant positive association between mean biosensor measurements of PAH concentration in oyster interstitial fluid and the summation of EPA-16 PAHs in oyster tissues at each site, still held for this subset of PAH compounds (y = 37.1 x −303.5, r2 = 0.88, df = 23) (Fig. 5). Because of the strong association, the regression equation can be used to rapidly estimate total tissue concentrations for this particular subset of PAH compounds. This information then can assist in streamlining environmental monitoring assessments that frequently target these 16 priority compounds.
Across all Elizabeth River sample sites, predicted oyster tissue concentrations at only 2 sites fell below the EFSA-4 threshold of a maximum of 30.0 μg/kg. From the model calibrated to fit EFSA guidelines, with a partition coefficient of 15.8 (Figure S1), concentrations in oyster interstitial fluid must be below 11.5μg/L to adhere to these regulations. When considering the VDH multi-tier advisory approach, 19 of 21 sample sites had predicted tissue concentrations within acceptable levels for human consumption. Oysters at 9 sites met tier 1 VDH guidelines of no advisory; oysters at 5 sites met tier 2 guidelines; and oysters at 5 sites met tier 3 guidelines. Based on the partition coefficient of 2.3 from the model calibrated for the metrics used in the VDH assessment (Figure S2), interstitial fluid concentrations must be below the following thresholds: 17.2 μg/L for no advisory (tier 1), 28.1 μg/L for 2 meals per month (tier 2); and 49.9 μg/L for 1 meal per month (tier 3). If the oyster interstitial fluid is greater than 49.9 μg/L, oysters should not be consumed in that area (tier 4).
The estimates for tissue concentrations based on interstitial fluid concentrations showed a very high accuracy and correspondence (Tables 1 and 2). Respective regressions used to determine tissue concentration predictions are provided in the supplemental data (Figures S1 and S2). For 18 out of 21 sites, individual tissue concentrations were successfully predicted by this screening method as falling above or below the EFSA threshold (80% accuracy or greater). For the VDH multi-tier regulatory approach, individual oysters at 10 out of 21 sites successfully predicted the correct tier in which the oysters at a site fell. The low prediction accuracy (0%–33%) at some sites can be attributed to specific PAH composition and compound variability in individual oysters. For example, in Table 1, individual oysters at site MP2 predicted that the site would fall below the 30 μg/kg limit. However, the concentrations of the 4 individual PAH compounds considered for the threshold comprised almost 30% of the overall concentration of PAH analyzed for the site. The total PAH concentration was low compared to the rest of the sites throughout the Elizabeth River. In another example, predictions for site HS failed across all individuals (Table 2). This was the only site that had a high concentration of dibenz[a,h]anthracene, which has a TEF of 5 (VDH, 2012). When converted to its BaPE concentration, this specific PAH compound accounted for over 50% of the total VDH-15 concentration. Other cases in which individual concentrations inaccurately predicted a site’s performance in meeting regulations included those on the cusp of the threshold value such as GR and CLY in Table 1. When screening sample results are approaching regulatory concerns, conducting more extensive compound specific analyses and further monitoring may be necessary. At present, oysters are not to be consumed from the Elizabeth River or its tributaries; therefore, the interpretations drawn from this assessment are for demonstration purposes only. They do, however, serve as reference points for ongoing studies.
3.4. Survey of PAH concentrations in oysters throughout the river watershed
Since biosensor technology allows for rapid and inexpensive data assessment, a map of concentrations throughout the entire Elizabeth River watershed was efficiently produced (Fig. 6). This could be particularly valuable for documenting concentration gradients, focusing on hot spots, and prioritizing samples for further compound-specific analyses or source identification using GC–MS. Efficient mapping also assists in establishing baseline levels. Baseline measurements are critical for the development of realistic remediation goals as well as impact assessment following environmental disturbances (e.g oil spills, dredging, flood events). The concentrations observed in Fig. 6 show that regression-based predictions of PAH concentrations are good bioindicators of legacy sediment contamination in the system and can be a cost-effective monitoring tool used to map gradients and document remediation effectiveness. The resulting map from this study also elucidated new target areas for future monitoring and remediation as elevated levels were observed in oysters where previous data are limited. A common logistical issue observed in hazardous waste remediation programs such as Superfund is inefficient detection and mapping of contamination at specific sites (US Congress Office of Technology Assessment, 1991). Additionally, increased urbanization and changing land use can greatly impact spatial distribution of contaminants such as PAH and ultimately exposure risk (Chalmers et al., 2007; Nowell et al., 2013). Simplistic, user-friendly, high-throughput methods to rapidly quantify PAH levels allows for more efficient monitoring to track these changes in distribution and bioavailability on a greater spatiotemporal scale.
Fig. 6.
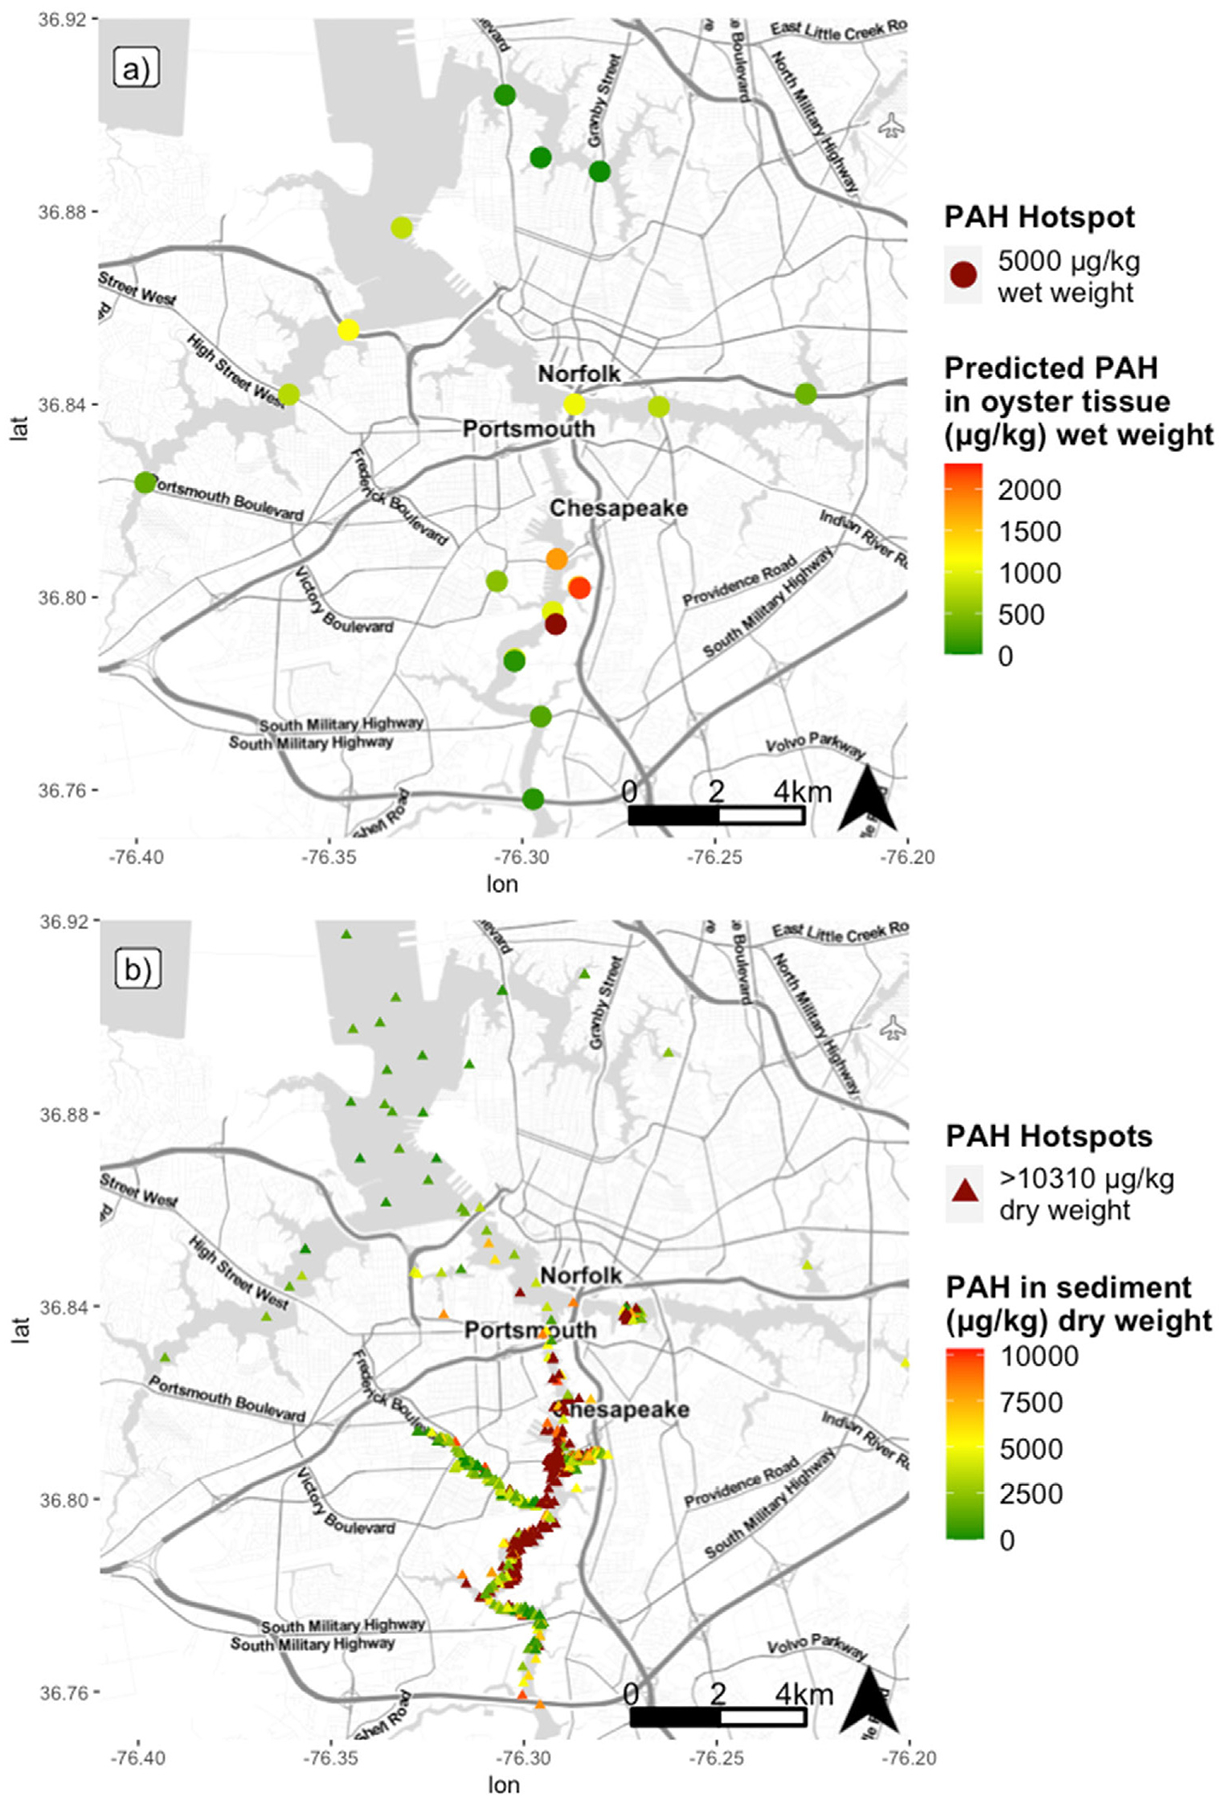
Comparison of (a) mapped predicted oyster tissue concentrations based on regression from present study to (b) mapped historic datasets on total PAH concentration in sediment from 1985 to 2012 (DIVER, 2020). Similar concentration trends and PAH hotspots throughout the watershed are observed in both maps. Concentrations below detection limit were treated as zero for mapping clarity. Note change in scale between maps due to higher concentrations typically observed in sediment. Map tiles used with permission from Stamen Design, under a CC BY license. Data by OpenStreetMap, under ODbL.
4. Conclusions
In this era of global change, tenacious monitoring and assessment of legacy organic contaminants such as PAHs is as vital as ever. Although PAHs have been well-documented as contaminants of interest in a multitude of previous environmental assessments, they are still some of the most commonly detected toxic chemicals of concern at hazardous sites (ATSDR, 2020). The onslaught of more frequent and extreme weather events can lead to the mobilization of these contaminants, shifting their environmental distribution (Knap and Rusyn, 2016; Kibria et al., 2021). Additionally, the continued reliance on oil makes the possibility of oil spills and the resulting PAH contamination a looming threat. The need for cost-effective analytical methods that can operate within a refined spatiotemporal scope is apparent, particularly when human health is at risk. Immunoassays such as antibody-based biosensor technology show great promise in this regard. Although compound-specific analysis is unattainable with this technology, the biosensor can serve as rapid quantitative screening tool to document contamination and prioritize samples or sampling strategies for further GC–MS analysis when needed. With features including near real-time analysis and low-cost per sample, the biosensor screening method can be a valuable tool in the assessment of seafood safety for human consumption or as a monitoring tool to document PAH levels at sites throughout an entire watershed. When biosensor measurements were compared against different regulatory subsets of priority PAHs (EPA-16, EFSA-4, VDH-15), similar trends were observed across sites suggesting that it is highly adaptable. The demonstrated flexibility of the biosensor screening method to different PAH subsets will become more apparent as new toxicity studies redefine priority PAHs (da Silva Junior et al., 2021). In particular, alkylated PAH isomers have garnered increased attention as they have shown higher toxicities than their parent forms but have not been previously included on regulatory PAH lists (Andersson and Achten, 2015; Wise et al., 2015). Reducing the time and expense of conventional analytical methods, antibody-based biosensor screening method expands the spatiotemporal scope of real-world applications for these hydrophobic organic contaminants in the aquatic environment.
Supplementary Material
Acknowledgments
This work was supported through NIEHS Superfund Research Program grant 1R01ES024245. We wish to thank J. Rieger (Elizabeth River Project), T. Egerton (Virginia Department of Health), and M. Mainor (VIMS) for assistance in the field; M.A. Vogelbein (VIMS) and D. Luellen (VIMS) for laboratory and analytical expertise; and J. Shields (VIMS) for manuscript review. This paper is Contribution No. 4090 of the Virginia Institute of Marine Science, William & Mary.
Footnotes
CRediT authorship contribution statement
Kristen M. Prossner: Writing – original draft, Investigation, Formal analysis, Data curation, Conceptualization, Visualization. George G. Vadas: Investigation, Formal analysis, Supervision. Ellen Harvey: Investigation, Formal analysis, Supervision. Michael A. Unger: Investigation, Resources, Formal analysis, Conceptualization, Visualization, Supervision, Funding acquisition, Writing – review & editing.
Declaration of competing interest
The authors declare that they have no known competing financial interests or personal relationships that could have appeared to influence the work reported in this paper.
Appendix A. Supplementary data
Supplementary material related to this article can be found online at https://doi.org/10.1016/j.eti.2022.102567.
References
- Abdel-Shafy HI, Mansour MS, 2016. A review on polycyclic aromatic hydrocarbons: Source, environmental impact, effect on human health and remediation. Egyptian Journal of Petroleum 25, 107–123. [Google Scholar]
- Andersson JT, Achten C, 2015. Time to say goodbye to the 16 EPA PAHs? Toward an up-to- date use of PACs for environmental purposes. Polycycl.Aromat. Compd 35, 330–354. [DOI] [PMC free article] [PubMed] [Google Scholar]
- Agency for Toxic Substances and Disease Registry, 1995. Toxicological Profile for Polycyclic Aromatic Hydrocarbons Technical Report, U.S. Department of Health and Human Services, Public Health Service, Agency for Toxic Substances and Disease Registry, Atlanta, GA, USA. [PubMed] [Google Scholar]
- Agency for Toxic Substances and Disease Registry, 2020. The ATSDR 2019 Substance Priority List. Agency for Toxic Substances and Disease Registry, Division of Toxicology and Human Health Services, Atlanta, GA, USA. [Google Scholar]
- Behera BK, Das A, Sarkar DJ, Weerathunge P, Parida PK, Das BK, Thavamani P, Ramanathan R, Bansal V, 2018. Polycyclic Aromatic Hydrocarbons (PAHs) in inland aquatic ecosystems: Perils and remedies through biosensors and bioremediation. Environ. Pollut 241, 212–233. [DOI] [PubMed] [Google Scholar]
- Bignert A, Göthberg A, Jensen S, Litzén K, Odsjö T, Olsson M, Reutergårdh L, 1993. The need for adequate biological sampling in ecotoxicological investigations: A retrospective study of twenty years pollution monitoring. Sci. Total Environ 128, 121–139. [Google Scholar]
- Bromage ES, Vadas GG, Harvey E, Unger MA, Kaattari SL, 2007. Validation of an antibody- based biosensor for rapid quantification of 2, 4, 6-trinitrotoluene (TNT) contamination in groundwater and river water. Environ. Sci. Technol 41, 7067–7072. [DOI] [PubMed] [Google Scholar]
- Burgess R, Ahrens M, Hickey C, 2003. Geochemistry of PAHs in aquatic environments: source, persistence and distribution. In: Douben, PET (Ed.), PAHs: An Ecotoxicological Perspective Wiley, Chichester, West Sussex, England, pp. 35–45. [Google Scholar]
- Camargo K, Vogelbein MA, Horney JA, Dellapenna TM, Knap AH, Sericano JL, Wade TL, McDonald TJ, Chiu WA, Unger MA, 2022. Biosensor applications in contaminated estuaries: Implications for disaster research response. Environ. Res 204, 111893. [DOI] [PMC free article] [PubMed] [Google Scholar]
- Campàs M, Prieto-Simón B, Marty JL, 2007. Biosensors to detect marine toxins: Assessing seafood safety. Talanta 72, 884–895. [DOI] [PubMed] [Google Scholar]
- Chalmers AT, Van Metre PC, Callender E, 2007. The chemical response of particle-associated contaminants in aquatic sediments to urbanization in New England, USA. J. Contam. Hydrol 91, 4–25. [DOI] [PubMed] [Google Scholar]
- Chapman PM, 1990. The sediment quality triad approach to determining pollution-induced degradation. Sci. Total Environ 97 (98), 815–825. [Google Scholar]
- Conder J, Jalalizadeh M, Luo H, Bess A, Sande S, Healy M, Unger MA, 2021. Evaluation of a rapid biosensor tool for measuring PAH availability in petroleum-impacted sediments. Environ. Adv 3, 1–6. [DOI] [PMC free article] [PubMed] [Google Scholar]
- da Silva Junior FC, Felipe MBMC, Castro DEF, Araújo SCDS, Sisenando HCN, Batistuzzo de Medeiros SR, 2021. A look beyond the priority: A systematic review of the genotoxic, mutagenic, and carcinogenic endpoints of non-priority PAHs. Environ. Pollut 278, 116838. [DOI] [PubMed] [Google Scholar]
- DiGiulio RT, Clark BW, 2015. The Elizabeth River story: a case study in evolutionary toxicology. J. Toxicol. Environ. Health B 18, 259–298. [DOI] [PMC free article] [PubMed] [Google Scholar]
- DiToro D, Zarba C, Hansen D, Berry W, Swartz R, Cowan C, Pavlou S, Allen H, Paquin P, 1991. Technical basis for establishing sediment quality criteria for nonionic organic chemicals using equilibrium partitioning. Environ. Toxicol. Chem 10, 1541–1583. [Google Scholar]
- DIVER, 2020. Web application: Data integration visualization exploration and reporting application, national oceanic and atmospheric administration Retrieved: July, 22, 2021, from https://www.diver.orr.noaa.gov.
- European Food Safety Authority. Scientific Opinion of the Panel on Contaminants in the Food Chain on a request from the European Commission on Polycyclic Aromatic Hydrocarbons in Food, 2008. EFSA J 724, 1–114. [Google Scholar]
- US Environmental Protection Agency (EPA), 1984. Health Effects Assessment for Polycylic Aromatic Hydrocarbons (PAH) EPA-540/1-86-013, Environmental Criteria and Assessment Office, Cinncinnati, OH. [Google Scholar]
- US Environmental Protection Agency (EPA), 1996a. SW-846 Test Method 4000:Immunoassay https://www.epa.gov/hw-sw846/sw-846-test-method-4000-immunoassay.
- US Environmental Protection Agency (EPA), 1996b. SW-846 Test Method 4030: Soil Screening for Petroleum Hydrocarbons by Immunoassay https://www.epa.gov/hw-sw846/sw-846-test-method-4030-soil-screening-petroleum-hydrocarbons-immunoass.
- US Environmental Protection Agency (EPA), 2016. Definition and Procedure for the Determination of the Method Detection Limit, Revision 2. EPA 821-R-16–006 Technical Report, US Environmental Protection Agency, Washington, DC. [Google Scholar]
- European Union, 2011. Commission regulation (EU) no 835/2011. Off. J. Eur. Union L214/5 835/2011 [Google Scholar]
- Farré M, Pérez S, Gonçalves C, Alpendurada MF, Barceló D, 2010. Green analytical chemistry in the determination of organic pollutants in the aquatic environment. TRAC Trends Anal. Chem 29, 1347–1362. [Google Scholar]
- Farrington JW, Goldberg ED, Risebrough RW, Martin JH, Bowen VT, 1983. US mussel watch 1976–1978: an overview of the trace-metal, DDE, PCB, hydrocarbon and artificial radionuclide data. Environ. Sci. Technol 17, 490–496. [DOI] [PubMed] [Google Scholar]
- Farrington JW, Tripp BW, Tanabe S, Subramanian A, Sericano JL, Wade TL, Knap AH, 2016. Edward D. Goldberg’s proposal of the mussel watch: reflections after 40 years. Mar. Pollut. Bull 110, 501–510. [DOI] [PubMed] [Google Scholar]
- Felemban S, Vazquez P, Moore E, 2019. Future trends for in situ monitoring of polycyclic aromatic hydrocarbons in water sources: The role of immunosensing techniques. Biosensors 9, 142. [DOI] [PMC free article] [PubMed] [Google Scholar]
- Fillmann G, Watson GM, Francioni E, Readman JW, Depledge MH, 2002. A non-destructive assessment of the exposure of crabs to PAH using ELISA analyses of their urine and haemolymph. Mar. Environ. Res 54, 823–828. [DOI] [PubMed] [Google Scholar]
- Fritcher DL, Mazet JA, Ziccardi MH, Gardner IA, 2002. Evaluation of two direct immunoassays for rapid detection of petroleum products on marine birds. Mar. Pollut. Bull 44, 388–395. [DOI] [PubMed] [Google Scholar]
- Ghosh U, Driscoll SK, Burgess RM, Jonker MTO, Reible D, Gobas F, Choi Y, Spitz SE, Maruya KA, Gala WR, Mortimer M, Beegan C, 2014. Passive sampling methods for contaminated sediments: Practical guidance for selection, calibration, and implementation. Int. Environ. Assess. Manage 10, 210–223. [DOI] [PMC free article] [PubMed] [Google Scholar]
- Grabowski JH, Brumbaugh RD Robert D, Conrad RF, Keeler AG, Opaluch JJ, Peterson CH, Piehler MF, Powers SP, Smyth AR, 2012. Economic valuation of ecosystem services provided by oyster reefs. BioScience 62, 900–909. [Google Scholar]
- Hartzell S, Unger M, McGee B, Yonkos L, 2017. Effects-based spatial assessment of contaminated estuarine sediments from Bear Creek, Baltimore Harbor, MD, USA. Environ. Sci. Pollut. Res 24, 22158–22172. [DOI] [PMC free article] [PubMed] [Google Scholar]
- James M, 1989. Biotransformation and disposition of PAH in aquatic invertebrates. In: Varanasi U (Ed.), Metabolism of Polycyclic Aromatic Hydrocarbons in the Aquatic Environment CRC Press, Boca Raton, FL, USA, pp. 69–92. [Google Scholar]
- Kibria G, Nugegoda D, Rose G, Yousuf Haroon AK, 2021. Climate change impacts on pollutants mobilization and interactive effects of climate change and pollutants on toxicity and bioaccumulation of pollutants in estuarine and marine biota and linkage to seafood security. Mar. Pollut. Bull 167, 112364. [DOI] [PubMed] [Google Scholar]
- Knap AH, Rusyn I, 2016. Environmental exposures due to natural disasters. Rev. Environ. Health 31, 89–92. [DOI] [PMC free article] [PubMed] [Google Scholar]
- Latimer J, Zheng J, 2003. The sources, transport, and fate of PAHs in the marine environment. In: Douben, PET (Ed.), PAHs: An Ecotoxicological Perspective Wiley, Chichester, West Sussex, England, pp. 7–33. [Google Scholar]
- Lawal AT, 2017. Polycyclic aromatic hydrocarbons. A review. Rev. Cogent Environ. Sci 3, 1339841. [Google Scholar]
- Leslie HA, ter Laak TL, Busser FJ, Kraak MH, Hermens JL, 2002. Bioconcentration of organic chemicals: Is a solid-phase microextraction fiber a good surrogate for biota? Environ. Sci. Technol 36, 5399–5404. [DOI] [PubMed] [Google Scholar]
- Li X, Kaattari SL, Vogelbein MA, Vadas GG, Unger MA, 2016. A highly sensitive monoclonal antibody-based biosensor for quantifying 3–5 ring polycyclic aromatic hydrocarbons (PAHs) in aqueous environmental samples. Sens. Bio-Sens. Res 7, 115–120. [DOI] [PMC free article] [PubMed] [Google Scholar]
- Mastovska K, Sorenson WR, Hajslova J, 2015. Determination of polycyclic aromatic hydrocarbons (PAHs) in seafood using gas chromatography-mass spectrometry: Collaborative study. J. AOAC Int 98, 477–505. [DOI] [PubMed] [Google Scholar]
- Mauseth GS, Challenger GE, 2001. Trends in rescinding seafood harvest closures following oil spills. In: Proceedings, 2001 International Oil Spill Conference, Tampa, FL, USA, March 26–29, 2001. pp. 679–684. [Google Scholar]
- Mayer P, Parkerton T, Adams R, Cargill J, Gan J, Gouin T, Gschwend P Hawthorne S, Helm P, Witt G, You J, Escher B, 2014. Passive sampling methods for contaminated sediments: Scientific rationale supporting use of freely dissolved concentrations. Int. Environ. Assess. Manage 10, 197–209. [DOI] [PMC free article] [PubMed] [Google Scholar]
- Minick DJ, Anderson KA, 2017. Diffusive flux of PAHs across sediment–water and water– air interfaces at urban superfund sites. Environ. Toxicol. Chem 36, 2281–2289. [DOI] [PMC free article] [PubMed] [Google Scholar]
- Moller TH, Dicks B, Whittle KJ, Girin M, 1999. Fishing and harvesting bans in oil spill response. In: Proceedings, 1999 International Oil Spill Conference. Seattle, WA, USA, March 8–11, 1999. pp. 693–699. [Google Scholar]
- Neff JM, Stout SA, Gunster DG, 2005. Ecological risk assessment of polycyclic aromatic hydrocarbons in sediments: Identifying sources and ecological hazard. Integr. Environ. Assess. Manage 1, 22–33. [DOI] [PubMed] [Google Scholar]
- Nisbet IC, LaGoy PK, 1992. Toxic equivalency factors (TEFs) for polycyclic aromatic hydrocarbons (PAHs). Regul. Toxicol. Pharmacol 16, 290–300. [DOI] [PubMed] [Google Scholar]
- National Marine Fisheries Service (NMFS), Eastern Oyster Biological Review Team, 2007. Status Review of the Eastern Oyster (Crassostrea Virginica). NOAA Tech. Memo. NMFS F/SPO-88, Report to the National Marine Fisheries Service, Northeast Regional Office, p. 105, February 16, 2007, Gloucester, MA (USA). [Google Scholar]
- National Marine Fisheries Service (NMFS), 2015. Annual Commercial LandIng Statistics NOAA, Silver Spring, MD, www.st.nmfs.noaa.gov/commercial-fisheries/commercial-landings/annual-landings/index. Viewed 20 Dec 2021. [Google Scholar]
- Nordin N, Yusof NA, Abdullah J, Radu S, Hushiarian R, 2017. A simple, portable, electrochemical biosensor to screen shellfish for vibrio parahaemolyticus. Amb Express 7, 1–9. [DOI] [PMC free article] [PubMed] [Google Scholar]
- Nowell LH, Moran PW, Gilliom RJ, Calhoun DL, Ingersoll CG, Kemble NE, Kuivila KM, Phillips PJ, 2013. Contaminants in stream sediments from seven United States metropolitan areas: part I: Distribution in relation to urbanization. Arch. Environ. Contam. Toxicol 64, 32–51. [DOI] [PubMed] [Google Scholar]
- Plaza-Bolaños P, Frenich AG, Vidal JLM., 2010. Polycyclic aromatic hydrocarbons in food and beverages. Analytical methods and trends. J. Chromatogr. A 1217, 6303–6326. [DOI] [PubMed] [Google Scholar]
- Spier CS, Unger MS, Kaattari SL, 2012. Antibody-based biosensors for small environmental pollutants: Focusing on PAHs. In: Preedy VR, Patel VB (Eds.), Biosensors and Environmental Health CRC Press, Boca Raton, FL, pp. 273–295. [Google Scholar]
- Spier CR, Vadas GG, Kaattari SL, Unger MA, 2011. Near real-time, on-site, quantitative analysis of PAHs in the aqueous environment using an antibody-based biosensor. Environ. Toxicol. Chem 30, 1557–1563. [DOI] [PubMed] [Google Scholar]
- Tian Y, Du L, Zhu P, Chen Y, Chen W, Wu C, Wang P, 2021. Recent progress in micro/nano biosensors for shellfish toxin detection. Biosens. Bioelectron 176, 112899. [DOI] [PubMed] [Google Scholar]
- Unger MA, Harvey E, Vadas GG, Vecchione M, 2008. Persistent pollutants in nine species of deep-sea cephalopods. Mar. Pollut. Bull 56, 1498–1500. [DOI] [PubMed] [Google Scholar]
- US Congress, Office of Technology Assessment, 1991. Complex Cleanup: The Environmental Legacy of Nuclear Weapons Production, OTA-O-484 U.S. Government Printing Office, Washington, DC. [Google Scholar]
- US Food and Drug Administration (FDA), 2010. Protocol for Interpretation and Use of Sensory Testing and Analytical Chemistry Results for Re-Opening Oil-Impacted Areas Closed to Seafood Harvesting Due to the Deepwater Horizon Oil Spill Technical Report, US Food and Drug Administration, Washington, DC. [Google Scholar]
- Van Metre PC, Mahler BJ, Furlong ET, 2000. Urban sprawl leaves its PAH signature. Environ. Sci. Technol 34, 4064–4070. [Google Scholar]
- Virginia Department of Health (VDH), 2012. Health Consultation: Consumption Advisory Guidelines for Oysters Contaminated with Polycyclic Aromatic Hydrocarbons for the Lafayette River Technical Report, Virginia Department of Health, Richmond, Virginia, USA. [Google Scholar]
- Vrana B, Allan IJ, Greenwood R, Mills GA, Dominiak E, Svensson K, Knutsson J, Morrison G, 2005. Passive sampling techniques for monitoring pollutants in water. Trends Anal. Chem 24, 845–868. [Google Scholar]
- Wade TL, Sericano J, Gardinali PR, Wolff G, Chambers L, 1998. NOAA’s ‘Mussel Watch’project: Current use organic compounds in bivalves. Mar. Pollut. Bull 37, 20–26. [Google Scholar]
- Walker SE, Dickhut RM, Chisholm-Brause C, Sylva S, Reddy CM, 2005. Molecular and isotropic identification of PAH sources in a highly industrialized urban estuary. Org. Geochem 36, 619–632. [Google Scholar]
- Wise SA, Sander LC, Schantz MM, 2015. Analytical methods for determination of polycyclic aromatic hydrocarbons (PAHs) — A historical perspective on the 16 U.S. EPA priority pollutant PAHs. Polycycl. Aromat. Compd 35, 187–247. [Google Scholar]
- Wolfe DA, Long ER, Thursby GB, 1996. Sediment toxicity in the hudson-raritan estuary: Distribution and correlations with chemical contamination. Estuaries 19, 901–912. [Google Scholar]
- Yender R, Michel J, Lord C, 2002. Managing Seafood Safety after an Oil Spill Technical Report, National Oceanic and Atmospheric Administration, Office of Response and Restoration, Hazardous Materials Response Division, Seattle, WA, USA. [Google Scholar]
- Zelinkova Z, Wenzl T, 2015. The occurrence of 16 EPA PAHs in food–a review. Polycycl. Aromat. Compd 35, 248–284. [DOI] [PMC free article] [PubMed] [Google Scholar]
- Zhang W, Liu Q, Guo ZH, Lin JS, 2018. Practical application of aptamer-based biosensors in detection of low molecular weight pollutants in water sources. Molecules 23, 344. [DOI] [PMC free article] [PubMed] [Google Scholar]
Associated Data
This section collects any data citations, data availability statements, or supplementary materials included in this article.