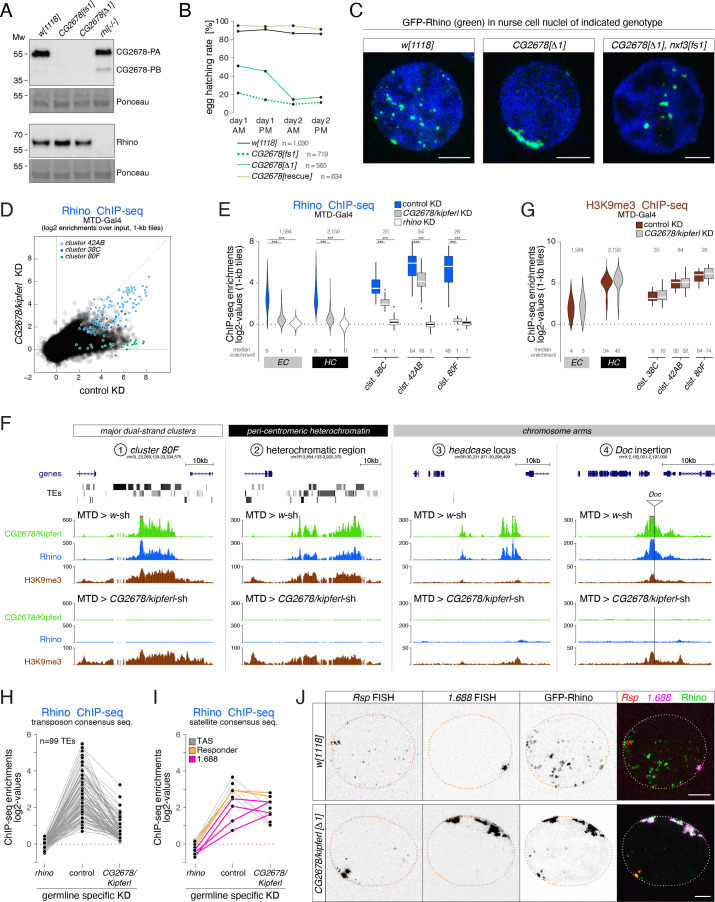
Figure 3. Rhino’s chromatin occupancy changes dramatically in CG2678/kipferl mutants.
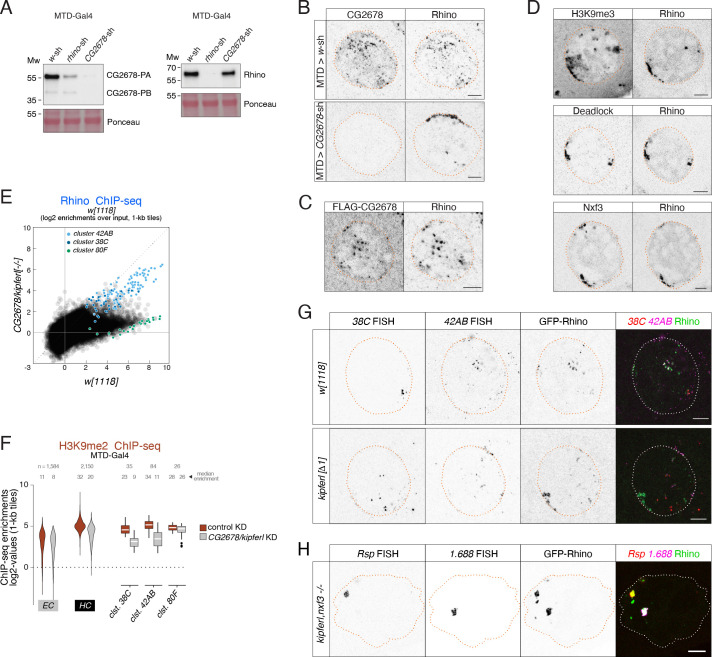
(A) Western blot analysis verifying CG2678 frame shift (fs1) and locus deletion (Δ1) alleles using a monoclonal antibody against CG2678 (top; CG2678-PB is a minor protein isoform) and depicting Rhino levels in the absence of CG2678 (bottom). Ponceau staining: loading control. (B) Time-resolved hatching rates for eggs laid by w1118 control females in comparison to females carrying a CG2678 frame shift (fs1), locus deletion (Δ1), or tagged rescue construct instead of the CG2678 locus, respectively (AM, PM indicates egg laying time). Total number of eggs laid is indicated for each genotype. (C) Confocal images illustrating localization of GFP-Rhino in nurse cell nuclei of w1118, CG2678 locus deletion (Δ1), and CG2678,nxf3 double mutant females (scale bar: 5 µm). (D) Scatter plot of genomic 1-kb tiles contrasting average log2-fold Rhino ChIP-seq enrichment in ovaries with MTD-Gal4 driven CG2678/kipferl knock down versus control ovaries (average of two replicate experiments each). (E) Violin plots showing average log2-fold Rhino ChIP-seq enrichment in control (n=3) as well as CG2678/kipferl (n=2) or rhino (n=1) germline knockdown ovaries on Rhino-bound 1-kb tiles (defined in Figure 1D) in heterochromatin (HC) and chromosome arms (EC). piRNA clusters 38C, 42AB, and 80F are depicted separately. *** corresponds to P<0,001 based on student’s t-test. Box plots show median (center line), with interquartile range (box) and whiskers indicate 1.5x interquartile range. (F) UCSC browser tracks (ChIP-seq) depicting diverse Rhino domains in control and CG2678/kipferl germline knockdown ovaries (signal shown as coverage per million sequenced reads for one representative replicate). (G) Violin plots showing average log2-fold H3K9me3 ChIP-seq enrichment in control (n=3) and CG2678/kipferl (n=2) germline knockdown for Rhino-bound 1-kb tiles (defined in Figure 1D) in heterochromatin (HC) and along chromosome arms (EC). piRNA clusters 38C, 42AB, and 80F are depicted separately. *** and n.s. corresponds to p<0.001 or p>0.05, respectively, based on student’s t-test. Box plots show median (center line), with interquartile range (box) and whiskers indicate 1.5x interquartile range. (H, I) Jitter plots depicting the log2-fold Rhino ChIP-seq enrichments on transposon (H) and Satellite (I) consensus sequences in indicated genetic backgrounds. (J) Confocal images showing Rsp and 1.688 Satellite RNA FISH signal and GFP-Rhino in nurse cells of w1118 or CG2678/kipferl mutant flies (scale bar: 5 µm).


