

Abstract
MicroRNA (miRNA) play an important role in the regulation of biological processes and have demonstrated great promise as biomarkers for the early detection of various diseases, including esophageal adenocarcinoma (EAC) and Barrett’s esophagus (BE), the premalignant metaplasia associated with EAC. Herein, we demonstrate the direct detection of the esophageal cancer biomarker, miR-21, in RNA extracted from 17 endoscopic tissue biopsies using a nanophotonics technology our group has developed, termed inverse molecular sentinel (iMS) nanobiosensor, with surface-enhanced Raman scattering (SERS) detection. The potential of this label-free, homogenous biosensor for cancer diagnosis without the need for target amplification was demonstrated by discriminating esophageal cancer and Barrett’s esophagus from normal tissue with notable diagnostic accuracy. This work establishes the potential of the iMS nanobiosensors for cancer diagnostics via miRNA detection within clinical samples without the need for target amplification, validating the potential of this assay as part of a new diagnostic strategy. Combining miRNA diagnostics with nanophotonics technology will result in a paradigm shift in achieving a general molecular analysis tool that has widespread applicability for cancer research as well as detection of cancer. We anticipate the further development of this technique for future use in point-of-care testing as an alternative to histopathological diagnosis as our method provides a quickly obtained result following RNA isolation, allowing for timely treatment.
Graphical Abstract Text:
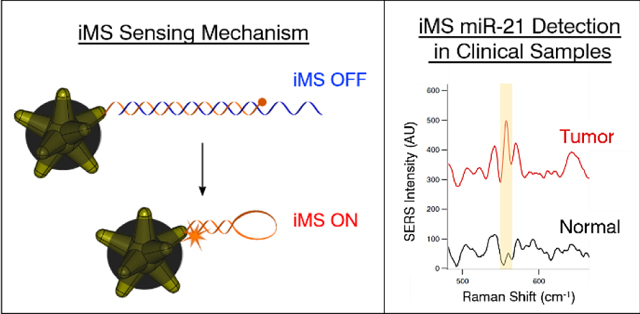
Homogenous iMS biosensor allows for discrimination of esophageal cancer from normal tissue via detection of microRNA biomarkers within clinical samples.
Introduction
The development of accessible strategies for early diagnosis is a major unmet need in cancer screening. Given recent and ongoing discoveries in molecular profiling of cancers, now is an ideal time to link new knowledge to new strategies for cancer research and screening. Nucleic acid-based molecular diagnostics are of critical importance because of their high specificity and sensitivity, and ability to identify molecular markers of interest. Specifically, microRNA (miRNA) play an important role in the regulation of biological processes, opening the door for potential applications as biomarkers in early detection of various diseases, ranging from cancer1 to cardiovascular illnesses2 and neurodegenerative diseases.3 In this study, we use esophageal adenocarcinoma (EAC) and Barrett’s esophagus (BE), the asymptomatic premalignant metaplasia associated with EAC, as a model clinical system. The current screening and surveillance strategy for EAC focuses on performing endoscopy in patients with clinical risk factors associated with EAC; yet this strategy has failed to reverse the increasing incidence of EAC.4 Most patients diagnosed with EAC never had a preceding diagnosis of Barrett’s esophagus (BE), the asymptomatic esophageal metaplasia that represents a pre-malignant condition often associated with EAC.5
Similar to other cancers, esophageal cancers (EC) have unique biomarker profiles that can be found in the tissue, as well as in peripheral blood.6 The dysregulation of several miRNAs have been identified to be associated with EC.7 In particular, miR-21 shows significant differences in expression between squamous and BE/EAC samples. In addition to being identified as a EC biomarker in tissue and blood; its association with other cancer8 makes the proposed technology relevant to other clinical areas as well. Yet, detection of these small molecules has not been implemented in early diagnostics for clinical practice due to challenging analytical aspects.9, 10 Several lab-based analyses can be used to detect RNA, including Northern blotting, quantitative reverse transcription PCR (qRT-PCR), RNA sequencing and microarray assays; however these techniques involve elaborate, time-consuming, and expensive processes that require special laboratory equipment.11–13 In addition, the challenges arising from the intrinsic characteristics of miRNAs, such as the short sequence lengths, low abundance, and high sequence similarity require the development of alternative assay strategies.14
There is currently a technological gap between advancements in molecular diagnostics and their implementation in clinical or point-of-care (POC) settings. Although recent developments15–20 have attempted to close this gap, direct detection of cancer biomarkers has remained challenge. Among recent developments in sensing, those based on surface-enhanced Raman scattering (SERS) are ideal due to their superior diagnostic accuracy and capability for multiplexed sensing, given by the sharp spectral features observed with Raman.21–23 Raman spectroscopy provides unique chemical fingerprints produced from the inelastic scattering of light upon interaction with specific molecules. SERS, which increases the number Raman scattering photons providing amplification on the order of millions, enables the application of this process for extremely sensitive analyte detection.24 Recently, Liu et al. have demonstrated endoscopic imaging of tumors via cell surface receptor-targeted SERS nanoparticles applied topically.25, 26 Other SERS-based diagnostic developments have focused on acquiring intrinsic SERS spectra (i.e. SERS signal from endogenous species) from extracted nucleic acids or tumor and liquid biopsies.27–30 However, prior to this study, SERS analysis of validated nucleic acid biomarkers was limited to the detection of amplified targets, due to their low abundance of these biomarkers and the inadequate sensitivities of previous assays.31–34 The use of amplified targets within a detection scheme brings about the same issues as PCR-based methods in that it requires a complex array of steps, ranging from target labeling or amplification to post-incubation reactions or washing steps.34, 35 More recently, a plasmonic platform based on a nanozyme and utilizing a SERS-signal amplification mechanism demonstrated promising results for the detection of a miRNA biomarker associated with prostate cancer following RNA extraction from patient urine samples.36
To overcome the aforementioned limitations, we have demonstrated the highly sensitive, specific and multiplexed detection of nucleic acids in the development of a unique one-step plasmonic nanobiosensor assay referred to as the “inverse molecular sentinel” (iMS).37–42 The iMS sensing mechanism utilizes plasmonic-active silver-coated gold nanostars (AuNS@Ag) functionalized with hairpin-like DNA strands that change conformation in the presence of a specific biotarget, exploiting the distance dependence of the SERS signal as a transduction mechanism, schematically depicted in Figure 1A. As the iMS homogenous assay does not require target labeling or any subsequent washing steps, the positive-readout platform provides a versatile and powerful tool for a wide variety of applications. . Herein, we demonstrate for the first time the use of the iMS for the direct detection of the early cancer biomarker miR-21 from clinical samples without the need for target amplification. The ubiquitously expressed miR-21 has been well established as an oncogenic miRNA due to its aberrant over-expression in various cancers, including EC.7 To confirm the capability of iMS miR-21 detection in clinical samples, samples were tested in parallel using qRT-PCR. The implications of our miRNA detection technique are vast and significant as our method can provide rapid and simple direct diagnosis, which holds transformative potential for applications within cancer research, as well as in future clinical applications for the direct detection of miRNA in patient biopsies.
Figure 1.

(A) Detection scheme of the SERS iMS nanoprobes. The “OFF-to-ON” signal switch is based on a non-enzymatic strand-displacement process and the conformational change of stem-loop (hairpin) oligonucleotide probes upon target binding. (B) SERS measurements of the iMS nanoprobe designed for the detection of miR21 in the absence of target (black spectrum), in the presence of 1 μM non-complementary DNA with sequences corresponding to miR-194 miRNA (green spectrum), and in the presence of 1μm miR-21 synthetic DNA targets (red spectrum).
Experimental
Materials.
Gold(III) chloride trihydrate (HAuCl4·3H2O), L(+)-ascorbic acid (AA), trisodium citrate dihydrate, sodium borohydride (NaBH4), 1 N hydrochloric acid solution (HCl), Dulbecco’s phosphate buffered saline (PBS), Tween-20 and 6-mercapto-1-hexanol (MCH) were purchased from Sigma-Aldrich (St. Louis, MO) at the highest purity grade available. Silver nitrate (AgNO3, 99.995%) was supplied by Alfa Aesar (Ward Hill, MA). Thiol PEG (mPEG-SH, MW 5000) was purchased from Nanocs (New York, NY). Ammonium hydroxide (NH4OH, 29.5%), carbon-coated copper TEM grids were obtained through VWR (Radnor, PA). All oligonucleotides were purchased from Integrated DNA Technologies, Inc (Coralville, IA). All glassware and stir bars were thoroughly cleaned with aqua regia and dried prior to use. Ultrapure water (18 MΩ·cm) was used in all preparations.
Patient Selection and Collection of Clinical Samples.
All experiments were performed in accordance with the Guidelines for Good Clinical Practice, and approved by the Duke University Institutional Review Board (IRB Pro00001662). Informed consent was obtained from the human participants of this study. The Duke GI Tissue Repository enrolled patients who presented for endoscopic procedures and/or surgical resection of the esophagus at the Duke Department of Medicine Gastroenterology Clinic or Duke Surgery Division of Cardiovascular and Thoracic Surgery. Enrollment was also offered to patients who presented for BE surveillance endoscopy, as well as those patients who received endoscopic ultrasound for EC staging. Participation in the study did not alter the clinical management of patients. Tissue samples were collected at the time of endoscopy or surgery. Samples were snap frozen in liquid nitrogen, and then stored at −80 °C. A summary of the tissue sample characteristics is shown in Table S1. De-identified and singly blinded samples were delivered to the operator performing the SERS iMS assay procedure.
RNA Extraction.
Patient tissue samples were recovered from −80˚C OCT using chilled DEPC water. Tissue was placed in tubes with 2.8mm ceramic beads (Omni International) containing 500 µl of chilled lysis buffer included in the miRVana™ miRNA Isolation kit (Thermo Scientific) and homogenized using a TissueLyser LT (Qiagen). Total RNA was extracted using miRVana™ miRNA Isolation kit following manufacture’s protocol.
qRT-PCR.
RNA was quantified using an Infinite 200 Pro (Tecan). The cDNA pre-amplification reaction utilized 40 ng of RNA with an RT primer pool including RNU48 and miR-21 (Thermo Scientific) as well as a “spike-in control” of cel-miR-39 to 5 nM. The cDNA reaction was carried out according to the TaqMan MicroRNA Assay Protocol (Thermo Scientific). cDNA was diluted 1:100 and qRT-PCR was performed with TaqMan primer probes against RNU48, miR-21, and cel-miR-39 on a StepOnePlus Real-Time PCR System (Thermo Scientific). Average CT values were determined for each sample based on a combination of all replicates for that sample and miRNA probe. The delta-delta CT method was used to normalize miR-21 results to the spiked in control, cel-miR-39 (e.g. ).
Synthesis of silver-coated gold nanostars.
Gold Nanostars (AuNS) were synthesized with a previously described procedure.43 Briefly, 12nm gold seed solution was first prepared using a modified Turkevich method. AuNS were then synthesized by the simultaneous addition of 50 μL of 2 mM AgNO3 and 50 μL of 0.1 M ascorbic acid to a solution containing 10 mL of 0.25 mM HAuCl4, 10 μL of 1 N HCl, and 100 μL of the 12 nm gold seed solution under gently stirring at room temperature. The process was completed in less than a minute along with color change from a light orange to dark blue within 10 seconds, indicating formation of AuNS. The stock concentration of AuNS is approximately 0.1 nM, as determined by nanoparticle tracking analysis (NTA 2.1, build 0342).
The silver-coated gold nanostars (AuNS@Ag) were prepared as previously described.44 For synthesis of AuNS@Ag, unfunctionalized AuNS were kept stirring and 50 µL of AgNO3 0.1 M and 10 µL of NH4OH were added to the solution. The color of the solution changed from blue to dark brown. The obtained solution was used for further functionalization without purification. The AuNS@Ag were functionalized 3 h after the synthesis to obtain iMS-nanoprobes for nucleotide detection and imaging.
Inverse Molecular Sentinel (iMS) nanoprobe design.
Inverse Molecular Sentinel (iMS) nanoprobes were designed for the detection of miR-21 The sequences for the molecular sentinel (MS) and the placeholder (PH) were chosen to maximize the sensitivity by optimizing the melting temperatures of the probe-placeholder and placeholder-target hybrid complexes. The MS and PH sequences were designed as 5′- thiol modifier C6 S-S -AAA AAG TCT GTA TTA AAA AAT AGC TTA TCA GAC AAA AAG TCT GTA TTA AAA AAT AGC TTA TCA GAC-Cy5 −3′ and 5′- TCA ACA TCA GTC TGA TAA GCT ATT TT −3′, respectively. The thiol termination allows for binding of the 5′ end of the MS to the metallic surface of the nanoparticle. We have tested the use of TCEP to reduce the dithiol to produce single thiol groups; however, we did not observe any difference in the functionality of iMS between this and using the thiol modified nucleotide as it was provided by IDT. We believe that the dithiol is reduced on the surface of the particles.45–47 The synthetic miR-21 DNA and RNA targets are 5′- TAG CTT ATC AGA CTG ATG TTG A −3′ and 5′- UAG CUU AUC AGA CUG AUG UUG A −3′, respectively. The synthetic noncomplementary negative control (miR-194) DNA target is 5′- TGT AAC AGC AAC TCC ATG TGG A −3′.
Synthesis of SERS iMS nanoprobes.
The iMS nanoprobes were synthesized as described in a previously optimized procedure.38 In brief, stem-loop DNA (MS) probe solution was added to the AuNS@Ag as synthesized at a concentration of 0.2µM in 2.5 mM MgCl2 and incubated overnight at room temperature. To stabilize the nanoprobes, 1 µM of HS-mPEG(5k) was added to the solution and left for 30 min. The solution was then centrifugal washed (3,500 rcf, 10 min) and resuspended in Tris-HCl buffer (10 mM, pH 8.0) containing 0.01% Tween-20. The metallic surface of AuNS@Ag was then passivated using 0.1 mM 6-mercapto-1-hexanol (MCH) for 10 min at 37°C followed by three additional centrifugal washing steps. To turn the iMS SERS signal ‘OFF,’ the nanoprobes (0.1 nM) were incubated with placeholder strand (0.2 µM) in PBS buffer solution containing 0.01% Tween-20 for 3 hours at 37°C. The excess placeholder strands were removed using repeated centrifugation and finally redispersed in PBS Tween-20 buffer at a probe concentration of 0.05nM. For positive control, the iMS was turned ‘ON’ by incubating with synthetic target analytes (2 µM) at 37°C for 1 hr.
iMS nanoprobe characterization.
Transmission electron microscopy (TEM) micrographs were acquired using the FEI Tecnai G2 twin transmission electron microscope (Hillsboro, OR) to confirm morphology (Figure S1). Synthesis was found to be consistent to results previously reported.44 To test the stability of the nanostars and nanoprobes, absorption spectra were collected with a FLUOstar Omega plate reader (BMG LABTECH GmbH, Ortenberg, Germany). Particle hydrodynamic size distribution, concentration and ζ-potential were determined by nanoparticle tracking analysis (NTA) on a NanoSight NS500 (Nanosight Ltd. Amesbury, UK). To ensure nanoprobes were not aggregated, the absorption spectra were monitored, and the size distributions were evaluated by NTA. No significant shift in absorption spectra or increase in hydrodynamic size was observed throughout iMS functionalization, indicating the stability of the particles and absence of dimerization (Figure S2).
iMS Assay Procedure.
Tests using total small RNA extracted from patient tissue biopsies were done in triplicate using 1pM iMS solution incubated with 100 ng of total small RNA samples in 10 μL PBS Tween-20 buffer at room temperature for 30 minutes. Mineral oil was added to the mixture to prevent evaporation. After the reaction, 2 μL of the mixture was transferred to a glass capillary tube for the SERS measurements using a Renishaw InVia confocal Raman microscope equipped with a 632.8 nm HeNe laser. The light from the laser was passed through a laser line filter, and focused into the sample solution with a 10x microscope objective. Three SERS measurements (5 accumulations of 30 seconds) were performed per 10 μL sample (on different 2 μL aliquots). The iMS assay procedure was repeated three times to account for pipet error (i.e. nine SERS measurements performed per sample in total). SERS measurements were averaged and background subtraction was performed in Matlab using a Savitsky-Golay filter (five-point window and first-order polynomial). For quantitative analysis, the same procedure was followed using different amount of miR-21 target RNA (0.05, 0.1, 0.5, 1, 5, 10, 50, 100 femtomoles). Figure S3 provides the spectra obtained from this analysis (offset for clarity). The Raman peak chosen for analysis in this study (557cm−1) is the main Cy5 peak. The performance evaluation of the iMS nanoprobes, including detection specificity and the potential for single nucleotide polymorphism detection, has been reported elsewhere.37, 38, 48
Statistical Analysis.
The analyses were conducted using the R statistical environment49 along with its extension packages Kendall50 and MASS51 and carried out with adherence to the principles of reproducible analysis using the knitr package.52 These analyses were not adjusted for multiple testing. The analyses were programmed and managed using mercurial and stored in a source code repository (https://bitbucket.org/dcibioinformatics/vo-dinh_mir21/src/default/).
Results and discussion
The iMS nanoprobe to detect miR-21 was designed and synthesized as previously described.38 In the absence of miR-21 target, the SERS signal of the iMS assay remains low, as the placeholder strands effectively maintain a linear duplex configuration, keeping the Raman label away from the nanostar plasmonic surface. In contrast, the presence of miR-21 target provides a significantly increased SERS signal, indicating that the Raman labels are brought close to the nanoparticle surface and therefore experience the enhanced electromagnetic field. Such a response can be seen in Figure 1B. Additionally, in the presence of a non-complementary sequence (miR-194), the iMS remained in the ‘OFF’ configuration. This result indicates that only in the presence of complementary target did the hybridization between targets and placeholders enable the formation of the stem-loop structure. The binding constant based on our calibration was found to be (1.2 ± 0.1) x 109 M-1. This value was calculated as 1/KD, where KD is the dissociation constant from a surface saturation Hill fit (KD = 850 ± 90 pM). These results make our assay more sensitive) than for antibody-antigen interaction53 and in the pM concentration range, as for other ultrasensitive SERS miRNA sensing systems.54 Note that we can only report the observed KD, which could be influenced by factors such as the limit of detection of our optical system. A performance evaluation of iMS nanoprobes including detection specificity and the potential for single nucleotide polymorphism detection has been reported elsewhere.37, 38, 48
For quantitative analysis of the iMS nanobiosensors for miR-21 detection, a logarithmic fit was obtained (Figure 2). As shown in the inset, a linear trend line was fitted to the data between 0 and 1 nM. Evaluation of the detection sensitivity provided a limit of detection (LOD) of 4.6 pM (46 attomoles).
Figure 2.

Evaluation of the detection sensitivity of the iMS nanobiosensors for miR-21 detection. The calibration data were fitted using a Langmuir-like surface saturation fit (KD = 850 ± 90 pM).
A total of 20 blinded and de-identified samples were received from the Duke GI Tissue Repository under an IRB-approved protocol. The samples were obtained from 10 consented patients who underwent upper endoscopy procedures related to EC and/or BE. Both diseased and adjacent normal tissue areas (paired samples) of the esophagus were collected from individual patients. Endoscopic assessment was verified with histopathological diagnoses from paired clinical biopsy samples. Research biopsies were classified as normal tissue, EAC, esophageal squamous cell carcinoma (ESCC), or BE. Enriched small RNA was extracted from endoscopic biopsies. Three samples, each from a different patient pair, were unable to be tested due to insufficient amounts of extracted RNA (100 ng required per test).
The iMS nanoprobe sensing mechanism was maintained within clinical samples, exhibited no particle dimerization, and allowed for the detection of miR-21 target. Such a response can be seen in Figure 3, which shows SERS spectra exemplifying the iMS nanobiosensor response when testing un-amplified enriched small RNA from a normal and tumor biopsy pair from a single patient. The SERS intensity of the prominent peak of the Raman label (Cy5, 557 cm−1) is significantly increased when testing tumor tissue as compared to normal tissue, indicating the greater abundance of miR-21 in the tumor tissue sample.
Figure 3.

Representative SERS spectra of the iMS response to RNA extracted from a paired biopsy from a single patient; normal (black), tumor (red). The region of the 557cm−1 peak of the Raman label (Cy5) used for area-under-curve analysis is highlighted.
A blinded study was performed to determine diagnostic capabilities of the iMS nanoprobes via detection of miRNA in clinical samples. Using our miR-21 iMS nanoprobes, the iMS assay was applied in a blinded manner to 17 tissue samples in triplicate. The area under the curve (AUC) of the 557cm−1 peak was used in analysis for each sample, as shown in Figure 4. After unblinding, a threshold was determined for this pilot cohort (420 counts). The iMS diagnostic results using this threshold were then compared to the independently conducted histopathological diagnosis of each tissue sample. Provided by this set threshold, the true positive and true negative rates were calculated (Tables S2 and S3). In this pilot cohort, the miR-21 iMS assay demonstrated notable diagnostic accuracy with 100% true positive rate and 100% true negative rate when discriminating tumor from normal tissue. When including BE tissue samples as positive (i.e. normal vs. BE & EC), the miR-21 iMS assay demonstrated 90% true positive and 100% true negative rates. The receiver operating characteristics (ROC) curve was generated to determine the ability of the iMS technique to distinguish between normal and unhealthy samples (Figure S4). The AUC of the ROC was found to be 0.957, indicating the strong capability of the iMS technique to distinguish between the two diagnostic groups.
Figure 4.

SERS intensities (AUC of the 557cm−1 peak; arbitrary units) against the threshold for normal (black), Barrett’s esophagus (BE, grey), and tumor (red) samples.
Results presented by patient pair for iMS and the histopathological diagnosis can be found in Figure S5. Of note, the iMS miR-21 detection for samples diagnosed as EC or BE are greater than those of normal tissue samples within the same patient pair. One patient pair within this cohort provided samples with histopathological diagnosis of both BE and EC. The iMS results of this pair indicated higher iMS SERS intensity for the tumor sample as compared to the BE sample.
To verify the iMS assay for miR-21 detection, Taqman qRT-PCR was performed on all samples. As seen in Figure 5, SERS and qRT-PCR show agreeing trends when comparing the average response to miR-21 for the two detection methods, with an observed increase in miR-21 between normal, BE, and EC samples. To further evaluate the relationship between RT-PCR and iMS, a linear regression was performed (Figure 6). The concordance and correlation between the two measurements were evaluated using Kendall Tau 55 and Pearson correlation, respectively. The following results were observed: n=17; tau=0.8, p-value<0.001; Pearson corr=0.63, p-value=0.007. Concordance was observed between SERS and qRT-PCR data although the strength was varied among normal, BE and EC (Table S4). It is noteworthy that one group BE data point lies outside the expected range. There is potential for this point to be a outlier; however, with a low sample number, we have hesitated to claim it as such. If the BE data were an outlier, then the coefficient of determination for the linear regression between iMS and PCR for miR-21 detection is significantly improved.
Figure 5.

(A) Correlation of PCR delta delta CT values with histopathological diagnosis and (B) correlation of iMS detection of miR-21 (AUC) with pathology.
Figure 6.

Regression between miR-21 PCR results (normalized by cel-39) and SERS intensity (area-under-curve of the 557cm−1 peak). The solid line indicates a robust linear fit while the dashed line indicates a normal linear fit.
When considering the combined data, the relatively small sample size may cause the relationship to appear nonlinear. An alternate reasoning could be that there is a nonlinear relationship between the two methods, which could potentially be due to the different response of the two assays as a function of concentration of miRNA. SERS-based sensors function by having the analyte directly interact with surface sites on the nanoparticle and therefore, the sensor response follows a surface saturation curve, similar to a Langmuir isotherm. Due to this saturation response, the target detection is achieved in a specific range of concentrations, the ends of which exhibit a dramatically spiked analytical sensitivity. This specific range depends on the parameters of the assay, including the number of particles and the probe strand loading. Such behavior produces a nonlinear response to the presence of target in certain concentration ranges, as previously reported.37 On the other hand, the mechanism of qRT-PCR detection provides a large linear range, in which the number of cycles constantly increases depending on concentration. This difference in operating behaviors between the two methods can be partially observed in Figure 6, where the SERS response does not follow linearly to the qRT-PCR response, due to the analytical sensitivity of SERS varying in the range of concentrations under analysis.
As technology advancements continue to progress diagnostic capabilities in clinical care, SERS-based methods have become of great interest in nucleic acid detection due to their high sensitivity.34, 56, 57 However, most of the proposed methods still require amplification of extracted RNA for the potential of clinical application. Our homogenous assay method allows for the direct detection of miRNA in un-amplified small RNA extracts from human tissue biopsies with excellent diagnostic accuracy when discriminating between EC and normal tissue as well as notable diagnostic accuracy when including BE in the unhealthy sample set. The qRT-PCR data indicate the overlap of miR-21 present in BE tissue samples with that of normal and EC tissue samples. This suggests the inability for the single biomarker miR-21 to perfectly differentiate BE from either normal or EC tissue, as is consistent with previous research.7 The great benefit of the iMS nanobiosensor is the potential for multiplexed detection. Future studies will incorporate multiple EC biomarkers for more robust diagnostic capability.
Conclusions
To our knowledge, this is the first study demonstrating detection of cancer biomarkers in esophageal tissue biopsy clinical specimens using SERS-based detection without the need for target amplification. We report the promising results of this pilot cohort for the potential of the iMS SERS-based assay for detection of cancer biomarkers without the need for target amplification. In this first pilot study for detection of miRNA within clinical samples, we are very encouraged that the miR-21 biomarker has produced reasonably good comparative data. Future studies will involve the use multiple miRNA biomarkers (e.g., miR-21, miR-194 and miR-133) to create a more robust panel for improved diagnostic capability. It is worth noting that this pilot study was performed using a small sample size in order to establish future development of this technology. Further studies will expand the sample number to create a large training and validation cohort.
The iMS sensing method, being based on a single-particle biosensor, requires no secondary signal amplification, target labeling, or washing steps and therefore has the potential to transform nucleic acid sensing with the possibility to be used in vivo or even intracellularly.40, 58 In addition to the simplicity of this homogenous assay technique, our method yields an output of a binary diagnosis based on SERS signal intensity following training and validation, rather than a qRT-PCR curve. We envision that future studies, along with advancements in PCR, will allow for determination of absolute miRNA copy number (rather than relative fold change) associated with disease state, which could then be used to develop normative values. While the current progress of our method requires RNA isolation, there are several methods to extract RNA within POC systems.59, 60 Compared to diagnosis by histopathology, this method can be completed in a matter of minutes following RNA isolation. We anticipate that ultimately this method will be incorporated into an integrated device for use in POC testing as a diagnostic alternative to histopathology, thereby simplifying the testing process and allowing clinicians to focus on providing quality patient care in a timely manner. Our method provides a user-friendly, resource-efficient alternative to gastrointestinal cancer diagnostics and warrants additional refinement as well as additional clinical testing and validation.
Supplementary Material
Acknowledgements
This material is based upon work supported by the National Institutes of Health (1R21CA196426). BMC acknowledges the support of the National Science Foundation Graduate Research Fellowship under Grant No. 1106401.
Footnotes
Electronic Supplementary Information (ESI) available. See DOI: 10.1039/x0xx00000x
Conflicts of interest
There are no conflicts to declare.
References
- 1.Meng X, Pan J, Sun S and Gong Z, Transl Cancer Res, 2017, 7, S226–S242. [Google Scholar]
- 2.Romaine SP, Tomaszewski M, Condorelli G and Samani NJ, Heart, 2015, 101, 921–928. [DOI] [PMC free article] [PubMed] [Google Scholar]
- 3.Basak I, Patil KS, Alves G, Larsen JP and Møller SG, Cell. Mol. Life Sci, 2016, 73, 811–827. [DOI] [PMC free article] [PubMed] [Google Scholar]
- 4.A. G. Association, Gastroenterology, 2011, 140, 1084–1091. [DOI] [PubMed] [Google Scholar]
- 5.Dulai GS, Guha S, Kahn KL, Gornbein J and Weinstein WM, Gastroenterology, 2002, 122, 26–33. [DOI] [PubMed] [Google Scholar]
- 6.Zhang K, Wu X, Wang J, Lopez J, Zhou W, Yang L, Wang SE, Raz DJ and Kim JY, Am J Cancer Res, 2016, 6, 2713–2721. [PMC free article] [PubMed] [Google Scholar]
- 7.Garman KS, Owzar K, Hauser ER, Westfall K, Anderson BR, Souza RF, Diehl AM, Provenzale D and Shaheen NJ, Dig. Dis. Sci, 2013, 58, 3178–3188. [DOI] [PMC free article] [PubMed] [Google Scholar]
- 8.Nair VS, Maeda LS and Ioannidis JP, J. Natl. Cancer Inst, 2012, 104, 528–540. [DOI] [PMC free article] [PubMed] [Google Scholar]
- 9.Di Leva G, Garofalo M and Croce CM, Annu. Rev. Pathol. Mech. Dis, 2014, 9, 287–314. [DOI] [PMC free article] [PubMed] [Google Scholar]
- 10.Hayes J, Peruzzi PP and Lawler S, Trends Mol. Med, 2014, 20, 460–469. [DOI] [PubMed] [Google Scholar]
- 11.Nelson PT, Baldwin DA, Scearce LM, Oberholtzer JC, Tobias JW and Mourelatos Z, Nat Methods, 2004, 1, 155–161. [DOI] [PubMed] [Google Scholar]
- 12.Tran N, Biochemistry Insights, 2009, 2, BCI. S2257. [Google Scholar]
- 13.Johnson BN and Mutharasan R, Analyst, 2014, 139, 1576–1588. [DOI] [PubMed] [Google Scholar]
- 14.Wang H, Ach RA and Curry B, Rna, 2007, 13, 151–159. [DOI] [PMC free article] [PubMed] [Google Scholar]
- 15.Grossman HB, Messing E, Soloway M, Tomera K, Katz G, Berger Y and Shen Y, JAMA, 2005, 293, 810–816. [DOI] [PubMed] [Google Scholar]
- 16.Tsujimoto M, Nakabayashi K, Yoshidome K, Kaneko T, Iwase T, Akiyama F, Kato Y, Tsuda H, Ueda S, Sato K, Tamaki Y, Noguchi S, Kataoka TR, Nakajima H, Komoike Y, Inaji H, Tsugawa K, Suzuki K, Nakamura S, Daitoh M, Otomo Y and Matsuura N, Clin. Cancer Res, 2007, 13, 4807–4816. [DOI] [PubMed] [Google Scholar]
- 17.Hsieh K, Patterson AS, Ferguson BS, Plaxco KW and Soh HT, Angew. Chem., Int. Ed, 2012, 51, 4896–4900. [DOI] [PMC free article] [PubMed] [Google Scholar]
- 18.Zagorovsky K and Chan WCW, Angew. Chem., Int. Ed, 2013, 52, 3168–3171. [DOI] [PubMed] [Google Scholar]
- 19.Soler M, Estevez MC, Villar-Vazquez R, Casal JI and Lechuga LM, Anal. Chim. Acta, 2016, 930, 31–38. [DOI] [PubMed] [Google Scholar]
- 20.Mabbott S, Fernandes SC, Schechinger M, Cote GL, Faulds K, Mace CR and Graham D, Analyst, 2020. [DOI] [PubMed] [Google Scholar]
- 21.Alvarez-Puebla RA and Liz-Marzán LM, Small, 2010, 6, 604–610. [DOI] [PubMed] [Google Scholar]
- 22.Henry A-I, Sharma B, Cardinal MF, Kurouski D and Van Duyne RP, Anal. Chem, 2016, 88, 6638–6647. [DOI] [PubMed] [Google Scholar]
- 23.Laing S, Gracie K and Faulds K, Chem. Soc. Rev, 2016, 45, 1901–1918. [DOI] [PubMed] [Google Scholar]
- 24.Jeanmaire DL and Van Duyne RP, J. Electroanal. Chem. Interf. Electrochem, 1977, 84, 1–20. [Google Scholar]
- 25.Wang YW, Kang S, Khan A, Bao PQ and Liu JTC, Biomed. Opt. Express, 2015, 6, 3714–3723. [DOI] [PMC free article] [PubMed] [Google Scholar]
- 26.Kang S, Wang Y, Reder NP and Liu JT, PloS one, 2016, 11, e0163473. [DOI] [PMC free article] [PubMed] [Google Scholar]
- 27.Feng S, Lin J, Cheng M, Li Y-Z, Chen G, Huang Z, Yu Y, Chen R and Zeng H, Appl. Spectrosc, 2009, 63, 1089–1094. [DOI] [PubMed] [Google Scholar]
- 28.Feng S, Chen R, Lin J, Pan J, Chen G, Li Y, Cheng M, Huang Z, Chen J and Zeng H, Biosensors and Bioelectronics, 2010, 25, 2414–2419. [DOI] [PubMed] [Google Scholar]
- 29.Chen Y, Chen G, Feng S, Pan J, Zheng X, Su Y, Chen Y, Huang Z, Lin X, Lan F, Chen R and Zeng H, BIOMEDO, 2012, 17, 1–7, 7. [Google Scholar]
- 30.Jenkins CA, Jenkins RA, Pryse MM, Welsby KA, Jitsumura M, Thornton CA, Dunstan PR and Harris DA, Analyst, 2018, 143, 6014–6024. [DOI] [PubMed] [Google Scholar]
- 31.Koo KM, Wang J, Richards RS, Farrell A, Yaxley JW, Samaratunga H, Teloken PE, Roberts MJ, Coughlin GD, Lavin MF, Mainwaring PN, Wang Y, Gardiner RA and Trau M, ACS Nano, 2018, 12, 8362–8371. [DOI] [PubMed] [Google Scholar]
- 32.Wee EJH, Wang Y, Tsao SC-H and Trau M, Theranostics, 2016, 6, 1506–1513. [DOI] [PMC free article] [PubMed] [Google Scholar]
- 33.Koo KM, Wee EJH, Mainwaring PN, Wang Y and Trau M, Small, 2016, 12, 6233–6242. [DOI] [PubMed] [Google Scholar]
- 34.Vohra P, Strobbia P, Ngo H, Lee W and Dinh TV, Sci Rep, 2018, 8, 11410. [DOI] [PMC free article] [PubMed] [Google Scholar]
- 35.Ngo HT, Freedman E, Odion RA, Strobbia P, De Silva Indrasekara AS, Vohra P, Taylor SM and Vo-Dinh T, Sci Rep, 2018, 8, 4075. [DOI] [PMC free article] [PubMed] [Google Scholar]
- 36.Li J, Koo KM, Wang Y and Trau M, Small, 2019, 15, 1904689. [DOI] [PubMed] [Google Scholar]
- 37.Wang H, Fales A and Vo-Dinh T, Nanomedicine: NBM, 2015, 11, 811. [DOI] [PubMed] [Google Scholar]
- 38.Wang H-N, Crawford BM, Fales AM, Bowie ML, Seewaldt VL and Vo-Dinh T, J. Phys. Chem. C, 2016, 120, 21047–21055. [DOI] [PMC free article] [PubMed] [Google Scholar]
- 39.Wang H-N, Crawford BM and Vo-Dinh T, Nanotechnology in Biology and Medicine: Methods, Devices, and Applications, 2017, 289. [Google Scholar]
- 40.Wang H-N, Register JK, Fales AM, Gandra N, Cho EH, Boico A, Palmer GM, Klitzman B and Vo-Dinh T, Nano Research, 2018, 1–12. [Google Scholar]
- 41.Crawford BM, Strobbia P, Wang H-N, Zentella R, Boyanov MI, Pei Z-M, Sun T-P, Kemner KM and Vo-Dinh T, ACS Appl. Mater. Interfaces, 2019. [DOI] [PubMed] [Google Scholar]
- 42.Strobbia P, Ran Y, Crawford BM, Cupil-Garcia V, Zentella R, Wang H-N, Sun T-P and Vo-Dinh T, Anal Chem, 2019. [DOI] [PubMed] [Google Scholar]
- 43.Yuan H, Khoury CG, Hwang H, Wilson CM, Grant GA and Vo-Dinh T, Nanotechnology, 2012, 23, 075102. [DOI] [PMC free article] [PubMed] [Google Scholar]
- 44.Fales AM, Yuan H and Vo-Dinh T, J Phys Chem C, 2014, 118, 3708–3715. [DOI] [PMC free article] [PubMed] [Google Scholar]
- 45.Li F, Zhang B, Li X, Qiao J and Li G, Journal of Raman Spectroscopy, 2004, 35, 1–3. [Google Scholar]
- 46.Lopez-Tobar E, Hernández B. n., Ghomi M and Sanchez-Cortes S, The Journal of Physical Chemistry C, 2013, 117, 1531–1537. [Google Scholar]
- 47.Ulman A, Chem. Rev, 1996, 96, 1533–1554. [DOI] [PubMed] [Google Scholar]
- 48.Ngo HT, Wang H-N, Fales AM, Nicholson BP, Woods CW and Vo-Dinh T, Analyst, 2014, 139, 5655–5659. [DOI] [PubMed] [Google Scholar]
- 49.Team RC, 2013. [Google Scholar]
- 50.McLeod AI, R Package Kendall, 2005. [Google Scholar]
- 51.W. Venables, B. Ripley and S. Isbn, 2002.
- 52.Xie Y, Dynamic Documents with R and knitr, Chapman and Hall/CRC, 2016. [Google Scholar]
- 53.Landry JP, Fei Y and Zhu X, Assay Drug Dev. Technol, 2012, 10, 250–259. [DOI] [PMC free article] [PubMed] [Google Scholar]
- 54.Schechinger M, Marks H, Mabbott S and Choudhury M, Analyst, 2019, 144, 4033–4044. [DOI] [PubMed] [Google Scholar]
- 55.Kendall MG, Biometrika, 1938, 30, 81–93. [Google Scholar]
- 56.Ngo HT, Gandra N, Fales AM, Taylor SM and Vo-Dinh T, Biosensors and Bioelectronics, 2016, 81, 8–14. [DOI] [PMC free article] [PubMed] [Google Scholar]
- 57.Donnelly T, Smith WE, Faulds K and Graham D, Chemical Communications, 2014, 50, 12907–12910. [DOI] [PubMed] [Google Scholar]
- 58.Dardir K, Wang H, Martin BM, Atzampou M, Brooke CB and Fabris L, The Journal of Physical Chemistry C, 2020. [Google Scholar]
- 59.Boom R, Sol C, Salimans M, Jansen C, Wertheim-van Dillen P and Van der Noordaa J, J. Clin. Microbiol, 1990, 28, 495–503. [DOI] [PMC free article] [PubMed] [Google Scholar]
- 60.Bordelon H, Adams NM, Klemm AS, Russ PK, Williams JV, Talbot HK, Wright DW and Haselton FR, ACS Appl. Mater. Interfaces, 2011, 3, 2161–2168. [DOI] [PMC free article] [PubMed] [Google Scholar]
Associated Data
This section collects any data citations, data availability statements, or supplementary materials included in this article.