Abstract
Objective:
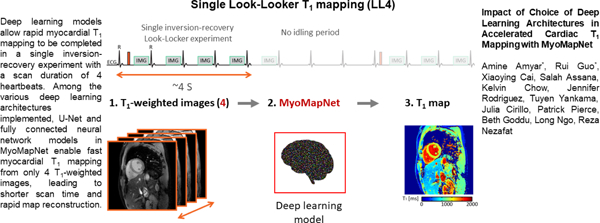
To investigate the performance of various deep learning (DL) architectures for MyoMapNet, a DL model for T1 estimation using accelerated cardiac T1 mapping from four T1-weighted images collected after a single inversion pulse (Look-Locker, LL4).
Methods:
We implemented and tested three DL architectures for MyoMapNet: (a) a fully connected neural network (FC), (b) convolutional neural networks (VGG19, ResNet50), and (c) encoder-decoder networks with skip connections (ResUNet, U-Net). Modified Look-Locker Inversion Recovery (MOLLI) images from 749 patients at 3T were used for training, validation, and testing. The first four T1-weighted images from MOLLI5(3)3 and/or MOLLI4(1)3(1)2 protocols were extracted to create accelerated cardiac T1 mapping data. We also prospectively collected data from 28 subjects using MOLLI and LL4 to further evaluate model performance.
Results:
Despite rigorous training, conventional VGG19 and ResNet50 models failed to produce anatomically correct T1 maps, and T1 values had significant errors. While ResUNet yielded good quality maps, it significantly under-estimated T1. Both FC and U-Net, however, yielded excellent image quality with good T1 accuracy for both native (FC/U-Net/MOLLI= 1217 ± 64/ 1208 ± 61/ 1199 ± 61 ms, all P<0.05) and post-contrast myocardial T1 (FC/U-Net/MOLLI= 578 ± 57/ 567 ± 54/ 574 ± 55 ms, all P<0.05). In terms of precision, the U-Net model yielded better T1 precision compared to the FC architecture (standard deviation of 61 ms vs. 67 ms for the myocardium for native (P<0.05), and 31 ms vs. 38 ms (P<0.05), for post-contrast). Similar findings were observed in prospectively collected LL4 data.
Conclusion:
U-Net and FC DL models in MyoMapNet enable fast myocardial T1 mapping using only four T1-weighted images collected from a single Lock-Locker sequence with comparable accuracy. U-Net also provides slight improvement in precision.
Keywords: Inversion-recovery cardiac T1 mapping, Deep learning, Cardiac MRI, Myocardial tissue characterization
Graphical Abstract
Introduction
Over the past decade, there has been increasing interest in myocardial T1 mapping as a quantitative technique for assessing interstitial diffuse fibrosis (1,2). Various T1 mapping pulse sequences have been proposed for pixel-wise measurement of myocardial T1 relaxation times with several recent attempts aimed at improving accuracy, precision, coverage, and imaging efficiency (3–5). Among these T1 mapping sequences, Modified Look-Locker Inversion Recovery (MOLLI) remains a commonly used part of the myocardial tissue characterization clinical protocol due to its excellent image quality and availability (6). However, technical improvements are still needed to overcome limitations such as lengthy scan times that require long breath-holds.
With advances in artificial intelligence (AI), particularly deep learning (DL), several studies have sought AI-based methods for improving cardiac T1 mapping during data acquisition, reconstruction, or automatic analysis. Shao et al. developed a DL model for rapid calculation of myocardial T1/T2 values based on Bloch equation simulation with improvement in accuracy (7). Our group has previously shown how DL-based reconstruction networks can reduce the window of a single-shot acquisition and alleviate cardiac motion-induced artifacts in the T1 map (8). DL-based reconstruction networks have also been used in MR fingerprinting to reduce the time required to calculate MR relaxation times from undersampled spiral data (9). Several other DL-based techniques have also been presented to automate analysis, motion correction, and quality control (10–12). Recently, we proposed MyoMapNet, a fully connected neural network (FC) for building a T1 map from only four T1-weighted images and thus shorten the imaging time of MOLLI with minimal loss in T1 precision (13). The MyoMapNet reduces the scan time of standard MOLLI from 11 second to 4 seconds. In addition, the map reconstruction time remains very fast with near instantaneous inline map estimation. However, we did not rigorously study the optimal DL architecture for this model.
When estimating T1, the input to the neural network can be pixel-wise, image-patch, or whole image, depending on the type of neural network and training strategy. A pixel-wise neural network, such as FC, is similar to the conventional curve-fitting method for performing T1 calculation at a single pixel (7,9,13). However, this approach does not incorporate neighboring pixels. In contrast, two-dimensional (2D) convolutional neural networks such as VGG19 (14), ResNet50 (15), ResUnet (16), and U-Net (17) can be advantageous for extracting deep features and have successfully been used in various image classification and segmentation problems (18,19). Such convolutional or encoder-decoder methods utilize neighboring pixels within the same tissue to improve T1 map quality, albeit potentially reducing sensitivity. The impact of alternate DL architectures on MyoMapNet performance has not been rigorously investigated.
In this study, we sought to investigate the performance (i.e., accuracy and precision) of different DL architectures on MyoMapNet by implementing pixel-wise (i.e., FC) and convolutional-based neural networks. MOLLI T1 data were used for training, validation, and testing of each model. Model performance was further studied using a Look-Locker 4 (LL4) sequence collected from four T1-weighted images after a single inversion pulse.
Methods
Figure 1 shows the study overview. Existing MOLLI data was used for training, validation, and testing (Figure 1A). Additional independent testing was done in a prospectively collected LL4 imaging dataset (Figure 1D). Specifically, the first four images from MOLLI were used for network training (Figure 1B-C) followed by testing using (a) the first four T1-weighed images of MOLLI, and (b) prospectively collected LL4 images from phantom and in-vivo scans (Figure 1E-F).
Figure 1:
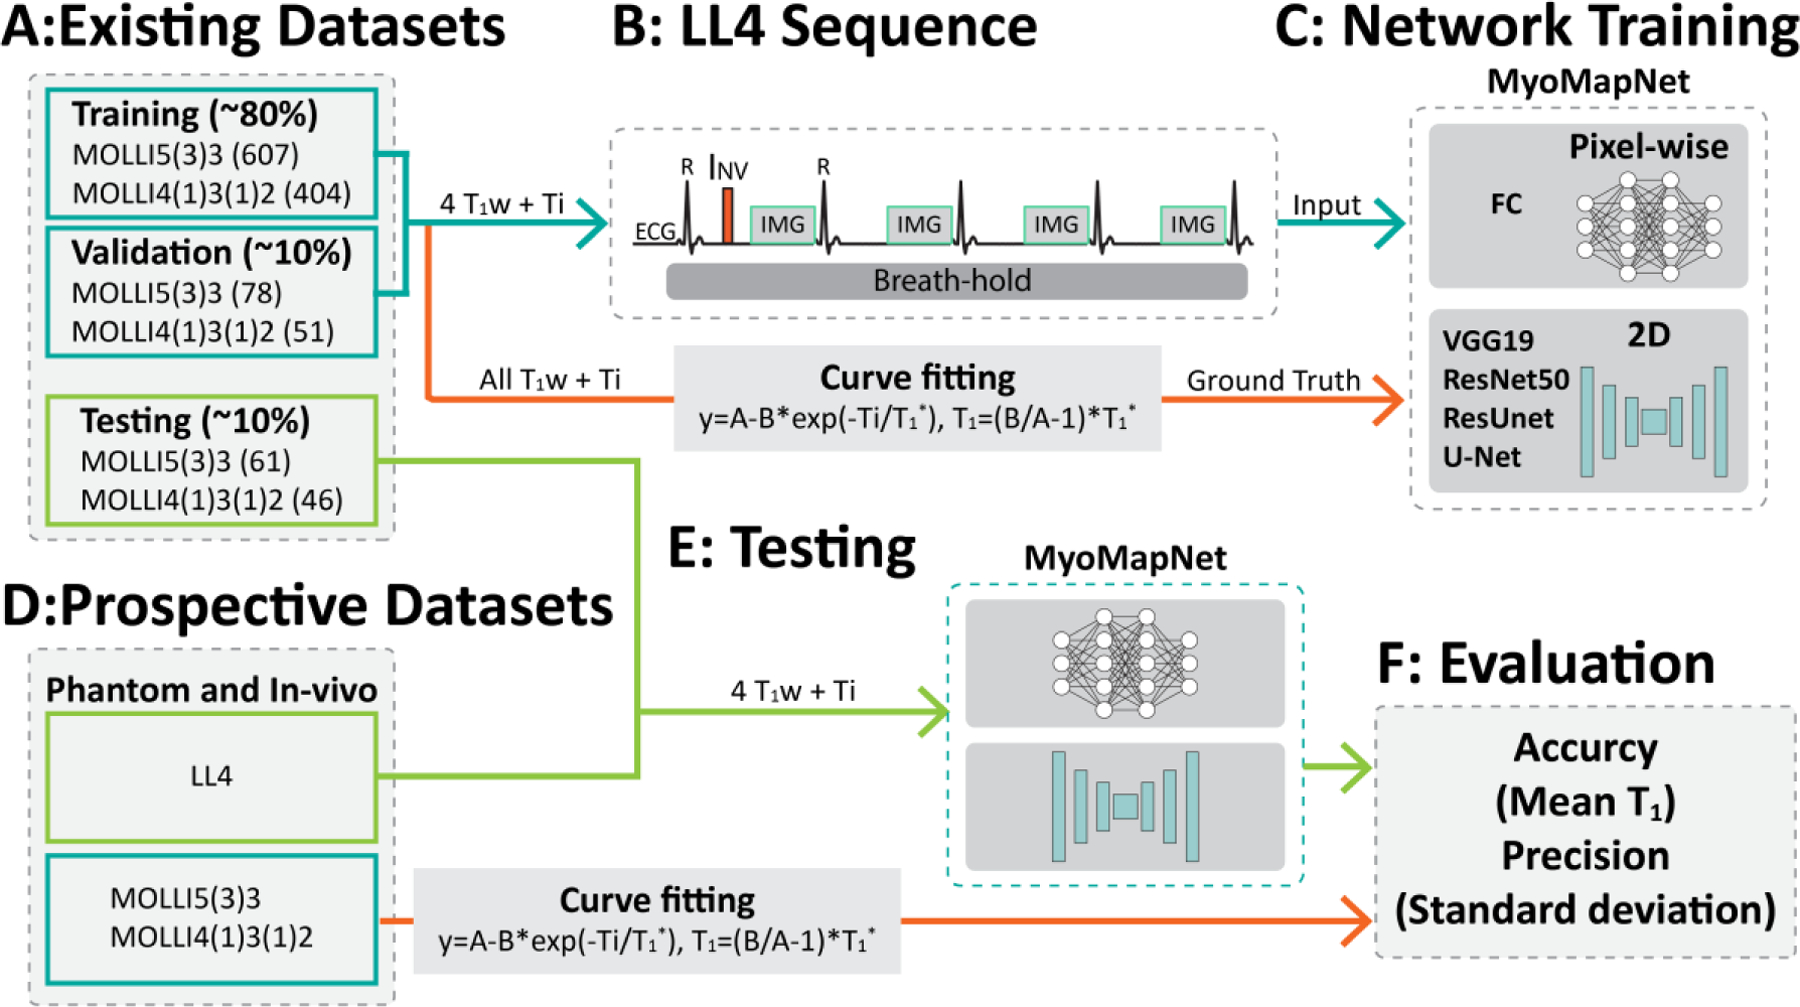
Study overview. (A) The retrospectively collected dataset is divided into three subsets: training, validation, and testing. (B-C) The input to the neural network is 4 T1-weighted images and four inversion times. FC uses pixel-wise values as the input, while convolutional neural networks use the whole image. (D-F) Study design for evaluation of MyoMapNet in the retrospective dataset and the prospectively accelerated LL4 myocardial T1 mapping sequence in four heartbeats.
To investigate DL architecture performance, we studied five state-of-the-art models: FC, VGG19, ResNet50, ResUnet, and U-Net. Each architecture and their hyper-parameters were selected based on their reported DL performance (20). The input to the FC network consisted of four T1-weighted signals and their corresponding inversion-recovery times. The input for other networks consisted of four T1-weighted images and their corresponding inversion-recovery times. To use inversion times as input to the neural network, the T1-weighted images and inversion times were combined into eight channels: the first four channels consisted of the T1-weighted images, and the last four channels comprised the inversion times (Supplementary Figures 1, 2, and 3).
The FC consisted of 6 layers with 400 neurons in the first two layers, 100 neurons in the 3rd and 4th layers, 50 neurons in the 5th layer, and one in the output. The activation function was Leaky ReLU. VGG19 (14) consisted of 19 layers with small convolutional filters size 3×3 and an ReLU activation function, and the number of feature maps was doubled after each max-pooling operation. The last fully connected layer contained 1000 neurons adjusted to 160×160 neurons to output the T1 map.
ResNet50 (15) is a very deep neural network consisting of 50 layers and a residual block designed to tackle the vanishing/exploding gradient problem of deep convolutional neural networks (CNN) (21). A residual block consists of 2 convolutional layers, with each followed by an activation function ReLU and a batch normalization. Identity mapping of the input to the block is created and concatenated to the output of the second convolutional layer allowing for skip connections. ResUnet (16) uses a U-Net encoder/decoder as its backbone in combination with residual connections. There are no fully connected layers in the network, and the output is a 2D matrix directly representing the T1 map of size of 160×160 (Supplementary Figure 3).
The last architecture we investigated is U-Net (17), an encoder-decoder neural network with skip connections. The encoder is used to obtain the disentangled feature representation. The encoder consists of eight convolutional layers with convolution filters of 3×3 and a max-pooling of 2×2 after every two convolutional layers. After the first convolutional operation, the resulted feature map has 64 channels, which will be combined later with the latest convolutional layers with the same number of channels (64). This is followed by the last convolutional operation with a kernel size of 1×1 to output the T1 map (Supplementary Figure 2). The number of feature maps increases from 64 for the two first layers to 512 for the last two layers. We opted for ReLU activation function. Each decoder level began with an up-sampling layer followed by a convolution to reduce the number of features by a factor of 2. Then, the up-sampled features were combined with features from the corresponding level of the encoder part using concatenation. All the neural networks were trained from scratch and optimized for T1 estimation.
DL Models and Training
Our local Institutional Review Board (IRB) approved use of a consent waiver for retrospective data and written informed consent was prospectively collected from subjects prior to scanning. Patient information was handled in compliance with the Health Insurance Portability and Accountability Act. We retrospectively identified 749 subjects (407 male, 56±16 years) who underwent clinical scans at Beth Israel Deaconess Medical Center (BIDMC) from January 2019 to October 2020, in whom native and/or post-contrast T1 images were collected. All patients were imaged on a 3T MRI scanner (MAGNETOM Vida Siemens Healthcare, Erlangen, Germany). Native and post-contrast T1 mapping in three short-axis views of the left ventricle were imaged using MOLLI5(3)3 and MOLLI4(1)3(1)2 with the following imaging parameters: balanced steady-state free-precession readout, field-of-view = 360×325 mm2, spatial resolution = 1.7×1.7×8 mm3, TR/TE/flip angle= 2.5 ms/1.02ms/35°, receiver bandwidth= 1093 Hz/pixel, GRAPPA acceleration rate = 2, readout lines per shot = 75, and slice gap = 16 mm. T1-weighted images were motion-corrected using vendor-provided inline motion correction. Pixel-wise MOLLI T1 maps were reconstructed off-line by fitting T1-weighted signals at each pixel to a three-parameters conventional fitting model (22). T1 maps were not scaled to account for inversion pulse inefficiency. The database was divided into training (~80%), validation (~10%) and testing (~10%). To create T1 mapping using only four T1-weighted images collected after a single inversion pulse, we used the first four images collected after the first inversion pulse of MOLLI5(3)3 and MOLLI4(1)3(1)2 and discarded the remaining T1-weighted images.
All models were implemented using PyTorch and trained on an NVIDIA DGX-1 system equipped with 8 Tesla V100 graphics processing units (GPUs; each with 32 GB memory and 5120 cores) and a central processing unit (CPU) of 88 cores: Intel Xeon 2.20 GHz each, and 504 GB RAM.
Images from 607 patients and 78 patients were used for training and validation, respectively. Each model was trained by minimizing the mean absolute error (MAE) between the ground truth and the estimated T1. All networks were trained with a mini-batch of 64, an Adam optimizer with a learning rate of 0.01, and a weight decay of 0.0001. To avoid overfitting or underfitting, T1 estimation errors of the training and validation dataset were monitored during training. Error monitoring in the blood pool and myocardium also ensured that the model learned a good representation of these two regions of interest. For the training dataset, the T1 estimation error across the entire image was calculated. For validation, the T1 estimation error of the myocardium and blood were used to select the best model.
Evaluation
We first evaluated all trained models using existing MOLLI images from 64 patients (36 male, 56±17 years), 47 of which had post-contrast T1 images. T1 maps for MyoMapNet were estimated from the first four images collected after the first inversion pulse of MOLLI5(3)3 or MOLLI4(1)3(1)2 and compared to original MOLLI T1 values, estimated from all T1-weighted images. In addition, we prospectively collected phantom and in-vivo data to further evaluate the performance of all trained models (Figure 1D). An LL4 sequence was implemented in which four T1-weighted images were collected after the first inversion time. All imaging parameters and inversion times were matched with MOLLI. To assess accuracy and precision, a phantom experiment was performed with an agarose gel-based phantom using nickel chloride as the paramagnetic relaxation modifier with twelve vials (23). Reference T1 and T2 times of each vial were measured by inversion-recovery spin-echo (IR-SE) and Carr-Purcell-Meiboom-Gill spin-echo (CPMG-SE) sequences, respectively, as previously reported (24). MOLLI5(3)3 and LL4 were performed at a simulated heart rate of 60 bpm. Each sequence was repeated 10 times, and repetitions of all sequences were performed in a random order.
Prospective in-vivo T1 mapping data were collected in 28 subjects, consisting of eight healthy subjects (5 male; 27±14 years) and 20 patients (12 male, 61±12 years) undergoing a clinically-indicated cardiac MRI. Native T1 mapping with MOLLI5(3)3 and post-contrast T1 mapping by MOLLI4(1)3(1)2 (if applicable) were included in their clinical protocols. LL4 images were collected at one mid-cavity short axis slice before and after contrast in patients with clinically indicated use of gadolinium. For patients who received contrast, MOLLI4(1)3(1)2 and LL4 were scanned ~15 min after administration of 0.1 mmol/kg Gd-DTPA (Gadavist, Bayer Healthcare, Berlin, Germany).
Data Analysis
T1 values in each vial were manually measured by drawing a region of interest (ROI) to calculate the mean and standard deviation (SD). The mean and SD of T1 of each vial were averaged across all measurements. SD was used to compare T1 precision among different methods. For each in-vivo T1 map, the endocardium, epicardium, and blood pool were manually delineated to measure the mean and SD of T1 of the left ventricle (LV) myocardium and blood pool.
The paired two-tailed Student’s t-test was used to assess statistical significance, and a p-value less than 0.05 was considered statistically significant. Bland-Altman was used to investigate agreement in T1 measurements between MOLLI and the different MyoMapNet DL models. All data analysis was performed using MATLAB R2009b and R2018b (MathWorks, Natick, MA, USA). Statistical analyses were performed using GraphPad Prism version 9.2.0 (GraphPad Software, San Diego, CA, USA), and python library scikit-learn (0.19.1).
Results
All models converged before reaching the 3000 maximum iterations. U-Net was the fastest model during learning with less than 500 iterations, while FC continued learning to more than 1000 iterations. CNN based models converged at approximately 500 iterations. Learning was stopped if the model did not improve after 70 iterations to avoid overfitting. The loss curves and trained models are publicly available (https://github.com/HMS-CardiacMR/MyoMapUnet).
In-Vivo Evaluation using Existing MOLLI Data
Figures 2 and 3 show representative native and post-contrast T1 maps for one subject. VGG19 and ResNet50 could not correctly predict T1. ResUnet yielded a map that preserves anatomical regions without visual artifacts; however, there were substantial errors in the estimated T1 in both the blood and myocardium. Visually, FC and U-Net provided excellent T1 maps with similar image quality as MOLLI5(3)3. Similar results were achieved for post-contrast T1 maps.
Figure 2:
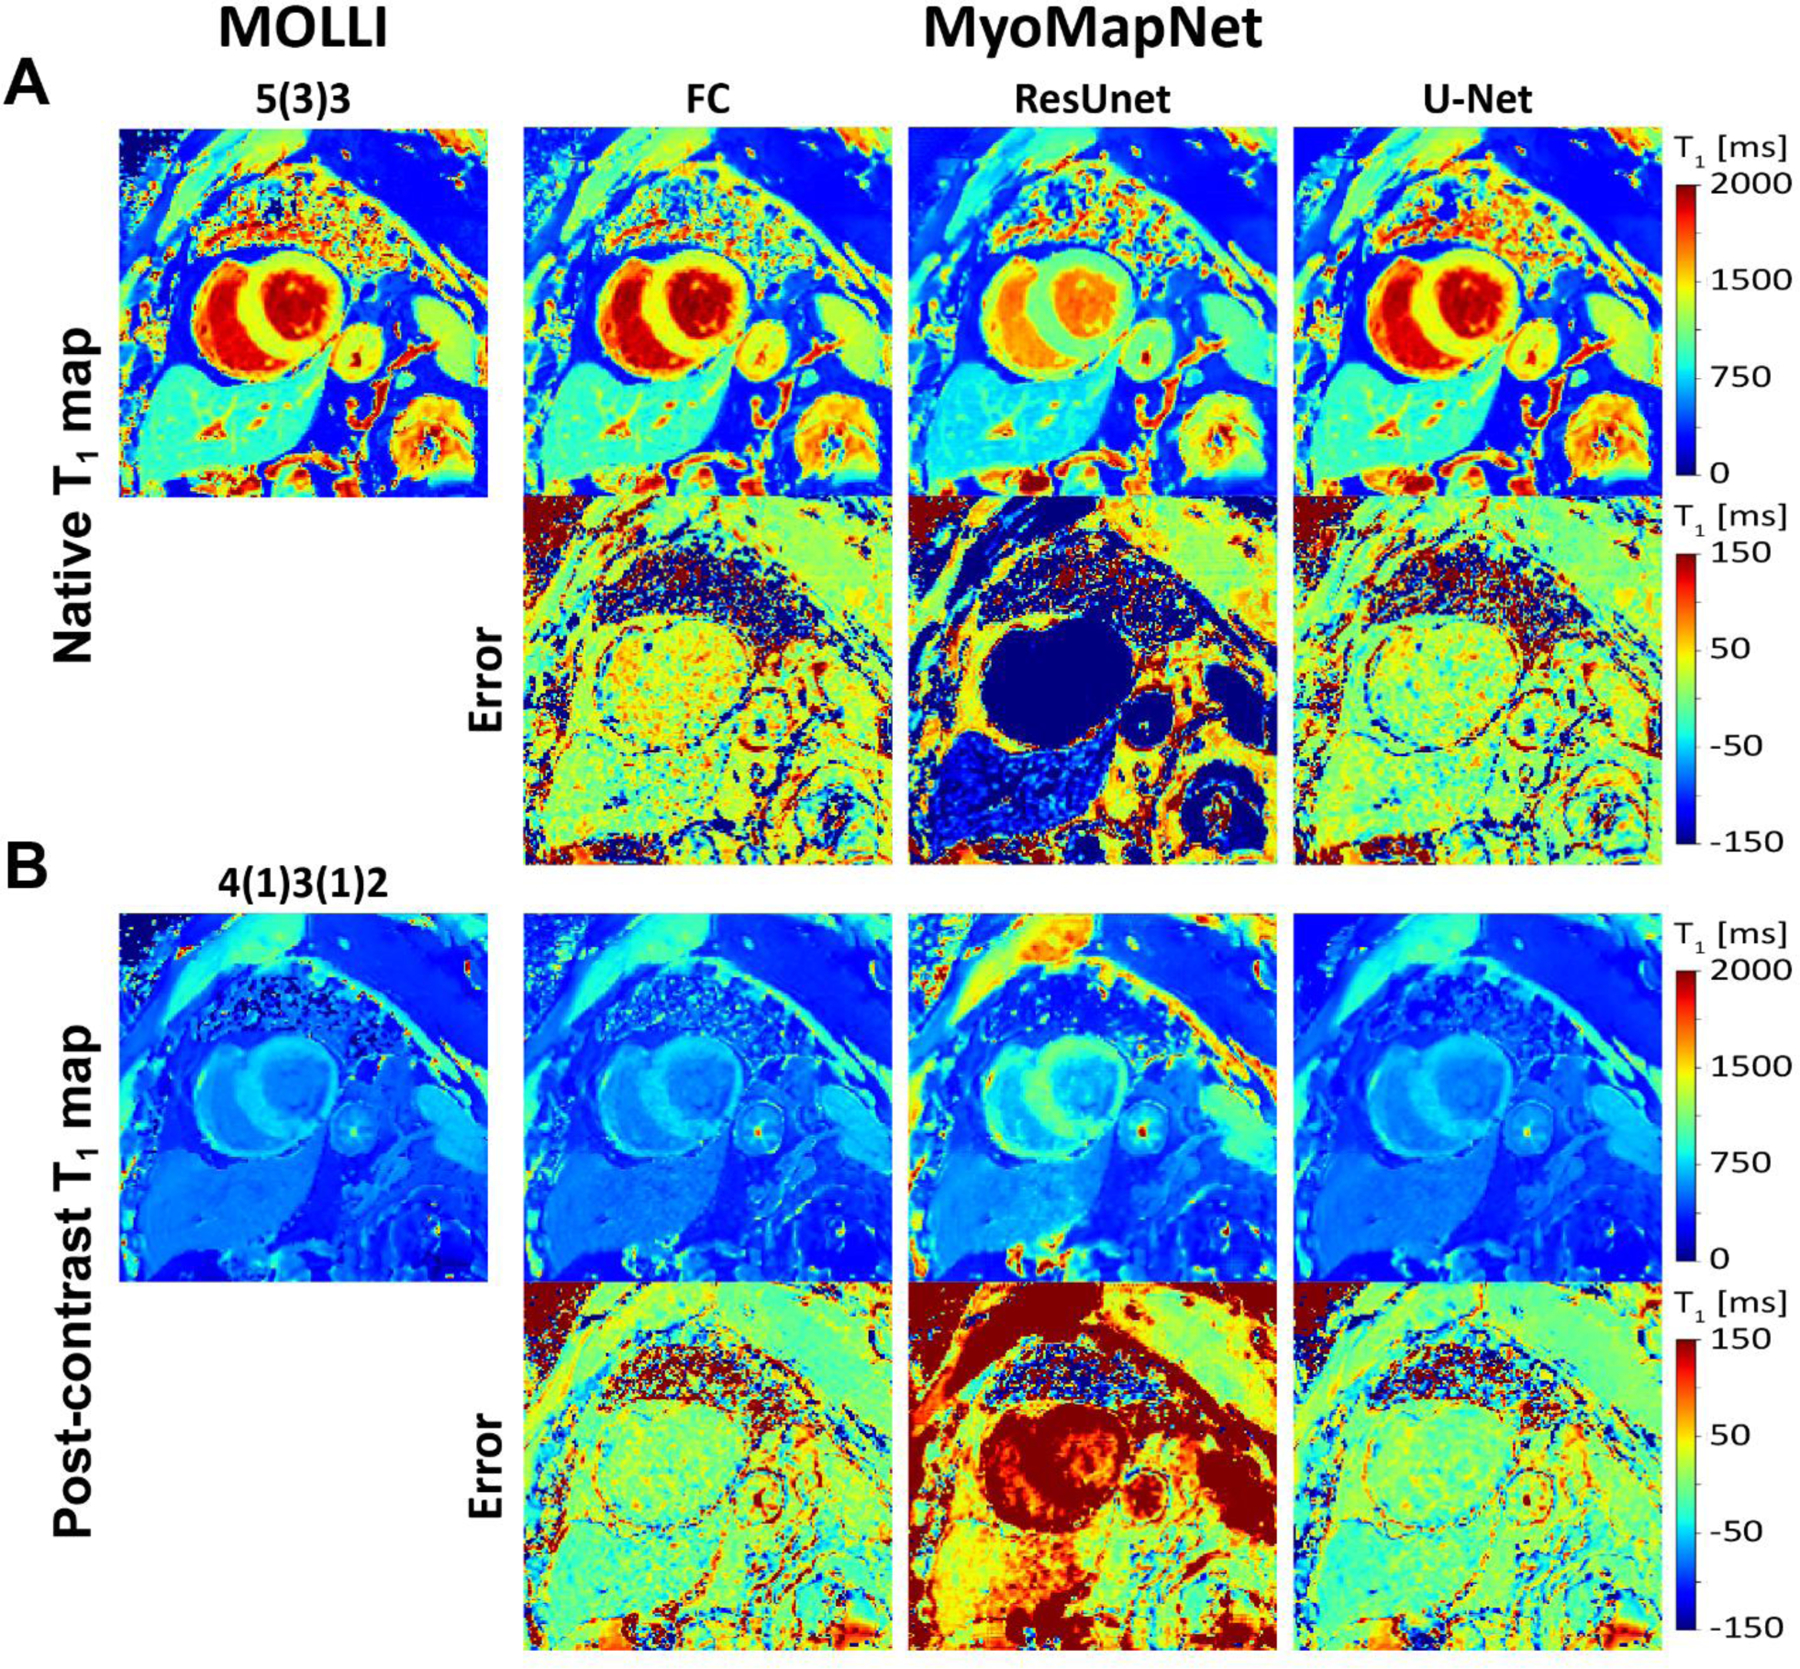
Native and post-contrast T1 maps generated using MOLLI and MyoMapNet for three different DL architectures calculated from the first four T1-weighted images, extracted from corresponding MOLLI sequence and their differences. ResUNet created anatomically correct images but with significant T1 errors. Both U-Net and FC resulted in similar image quality as MOLLI.
Figure 3:
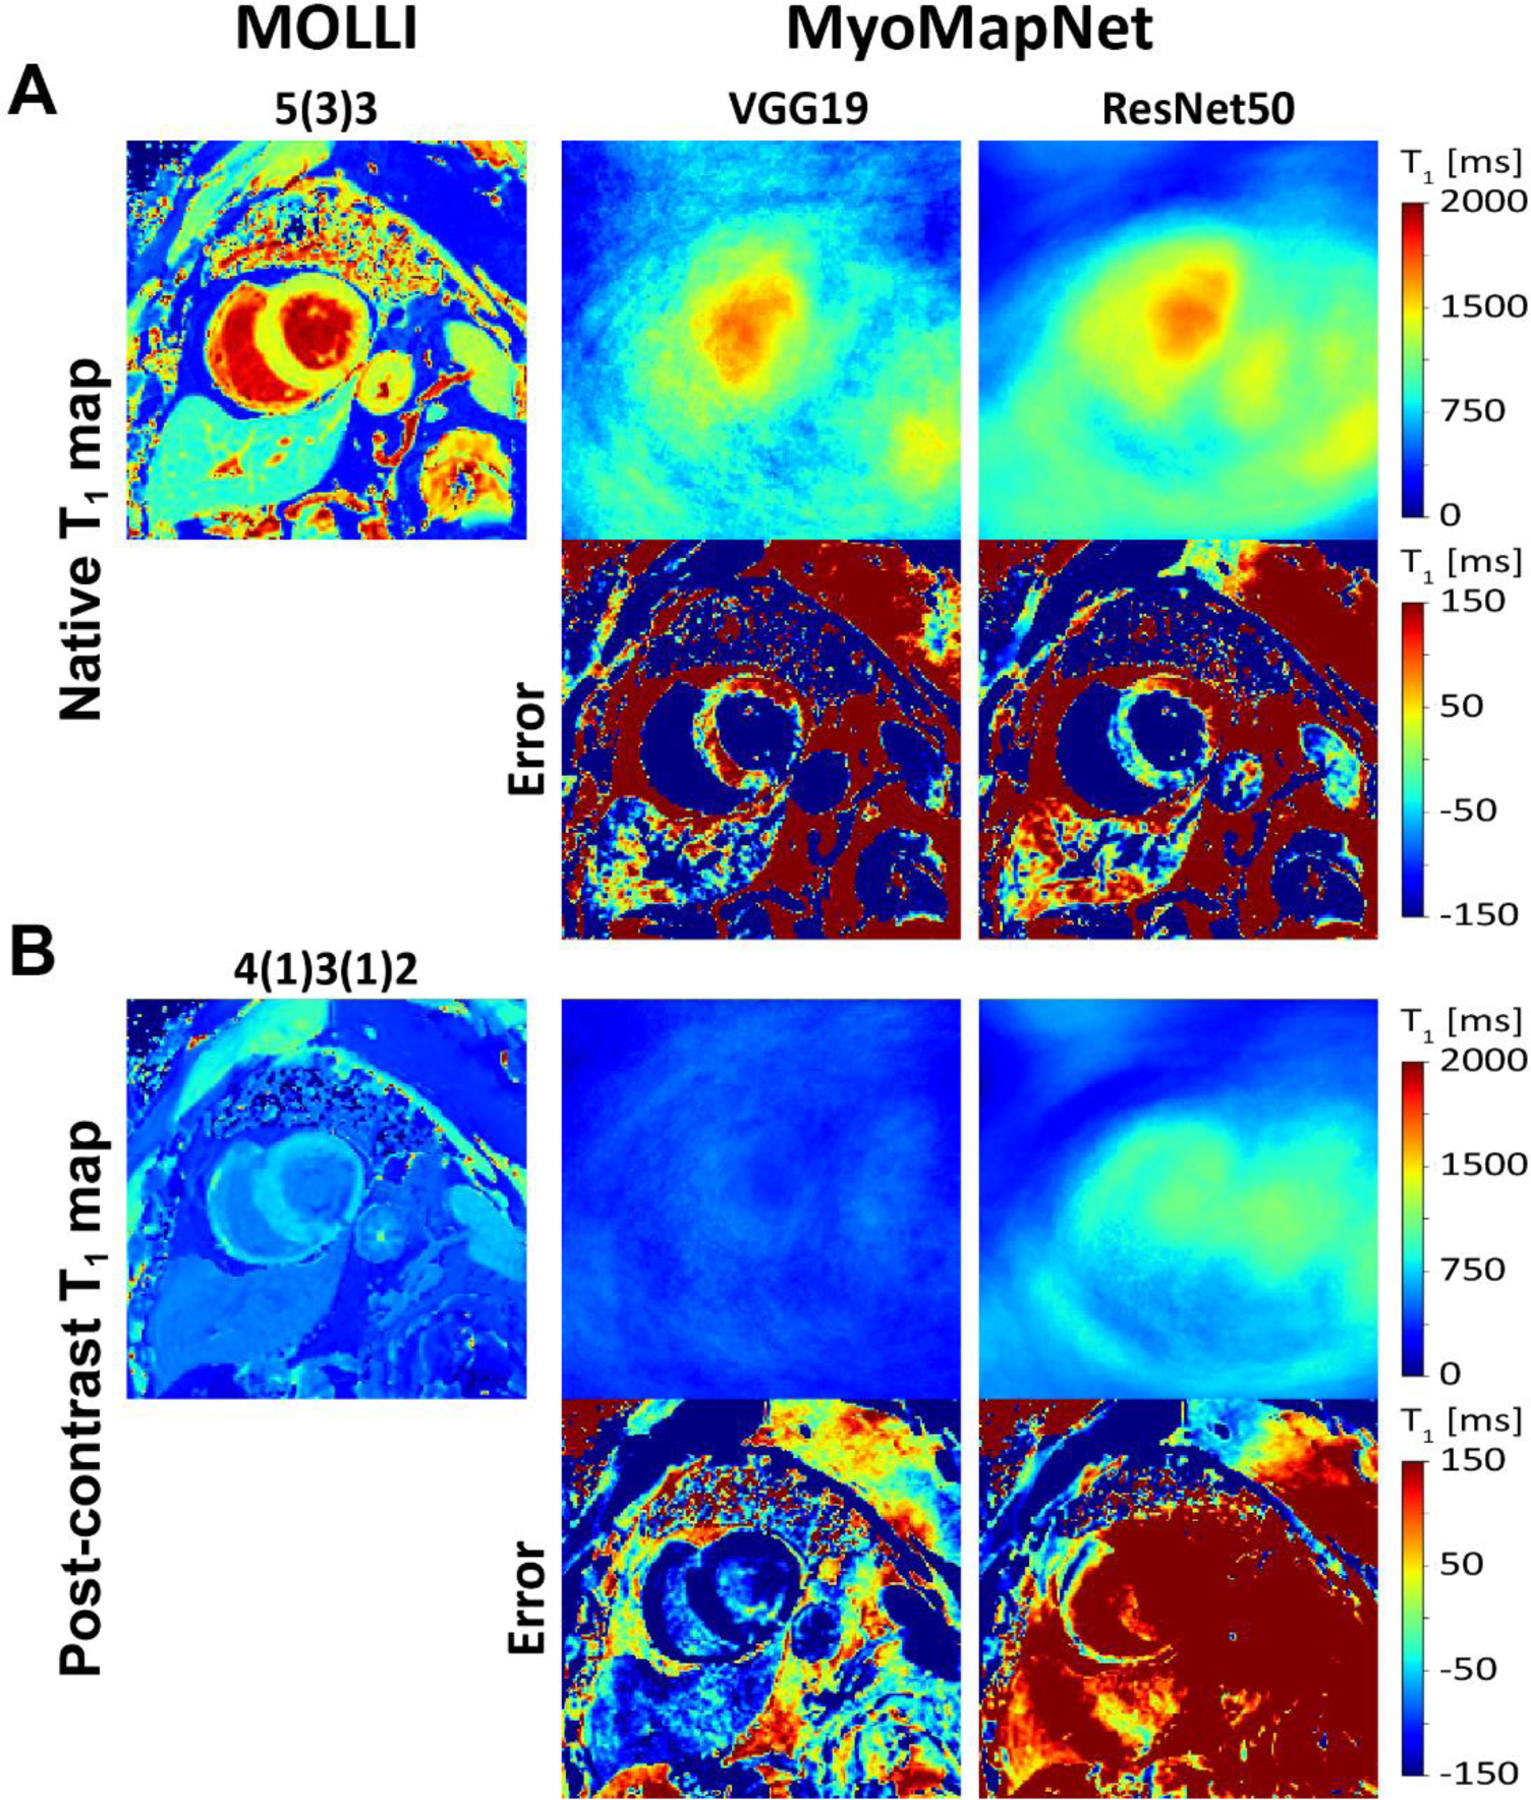
Native and post-contrast T1 maps generated using MOLLI and MyoMapNet using two different DL architectures calculated from the first four T1-weighted images, extracted from the corresponding MOLLI sequence and their differences. The VGG19 and ResNet50 failed to estimate T1 maps and resulted in blurry images.
Table 1 summarizes mean and SD values of myocardial and blood native post-contrast T1 values across all subjects. For native myocardial and blood T1, good agreement was achieved between (1) FC and MOLLI5(3)3 and (2) U-Net and MOLLI5(3)3. FC had a mean T1 difference of 18 ms and 15 ms, and U-Net had a mean T1 difference of 9 ms and −12 ms (all P<0.05). Bland-Altman plots (Figure 4) confirmed this agreement. The 95% confidence interval (CI) of T1 differences between FC and MOLLI5(3)3 ranged from −1.8 ms to 39.3 ms for myocardial T1 and from −45.6 ms to 75.5 ms for blood T1. The 95% CI of T1 differences between U-Net and MOLLI5(3)3 ranged from −10.8 ms to 29.6 ms for myocardial T1 and from −54.1 ms to 30.2 ms for blood T1. Bland-Altman analysis (Figure 4C-D) demonstrated FC and U-Net were in excellent agreement with MOLLI4(1)3(1)2 for post-contrast T1. Mean myocardial and blood T1 differences between them were 4.2 ms and 3.7 ms (FC vs. MOLLI4(1)3(1)2) and −6.2 ms and 0.1 ms (U-Net vs MOLLI4(1)3(1)2), all P<0.05 except for U-Net vs. MOLLI for blood T1 (P=0.91). Due to large estimation errors from the other MyoMapNet models, the Bland-Altman analysis is not shown.
Table 1.
Myocardium and blood T1 at 3T as measured by MOLLI and retrospectively estimated by MyoMapNet for existing dataset (N=64)
| Native T1 | Post-Contrast T1 | |||||||
|---|---|---|---|---|---|---|---|---|
| Myocardium | Blood | Myocardium | Blood | |||||
| Accuracy | Precision | Accuracy | Precision | Accuracy | Precision | Accuracy | Precision | |
| FC | 1217 ± 64 | 67 ± 15 | 1866 ± 85 | 51 ± 22 | 578 ± 57 | 38 ± 12 | 432 ± 69 | 17 ± 5 |
| VGG19 | 1259 ± 192 | 132 ± 33 | 1365 ± 202 | 69 ± 19 | 450 ± 56 | 48 ± 16 | 447 ± 64 | 27 ± 8 |
| ResNet50 | 1057 ± 47 | 110 ± 32 | 1177 ± 66 | 54 ± 21 | 1052 ± 48 | 107 ± 25 | 1155 ± 49 | 54 ± 15 |
| ResUnet | 1033 ± 104 | 57 ± 12 | 1702 ± 120 | 37 ± 11 | 736 ± 85 | 66 ± 23 | 502 ± 77 | 28 ± 12 |
| U-Net | 1208 ± 61 | 61 ± 13 | 1839 ± 87 | 27 ± 7 | 567 ± 54 | 31 ± 13 | 428 ± 68 | 12 ± 5 |
| MOLLI | 1199 ± 61 | 60 ± 13 | 1851 ± 94 | 30 ± 9 | 574 ± 55 | 30 ± 9 | 428 ± 70 | 9 ± 3 |
Figure 4:
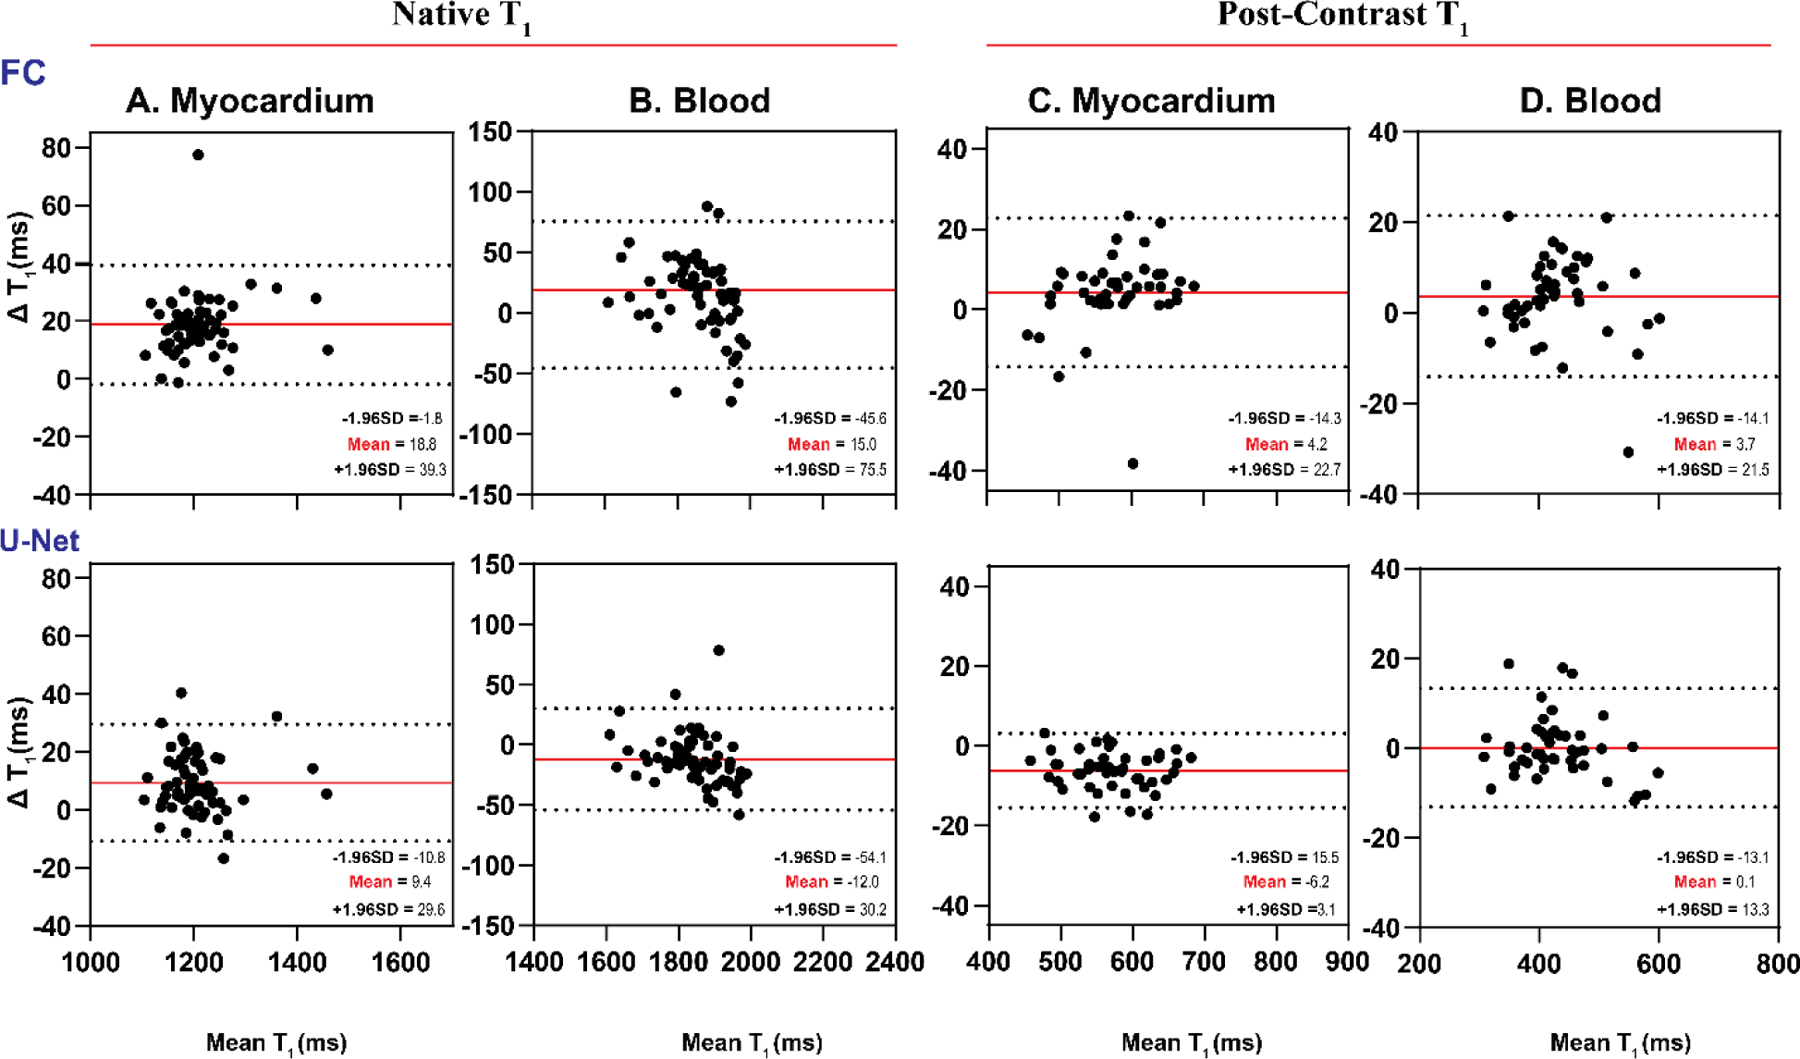
Bland-Altman plots demonstrating agreement between MOLLI and MyoMapNet for myocardial and blood T1 values as calculated by FC and U-Net models using the existing in-vivo dataset (N=64). Mean differences and 95% limits of agreement are indicated in red and dotted lines, respectively. Each data point is averaged across three left-ventricular slices for each subject.
Box-and-whisker plots show T1 precision (SD) of different DL models for native and post-contrast myocardium and blood pool (Figure 5). In native T1 images, the U-Net model yielded better T1 precision than the FC architecture (61 ms vs. 67 ms for the myocardium (P<0.05) and 27 ms vs. 51 ms for the blood pool for native T1 (P<0.05)). Similar results were observed for post-contrast T1 values (31 ms vs. 38 ms (P<0.05) for the myocardium and 12 ms vs. 17 ms for the blood pool (P<0.05)) (Table 1 and Figure 5).
Figure 5:
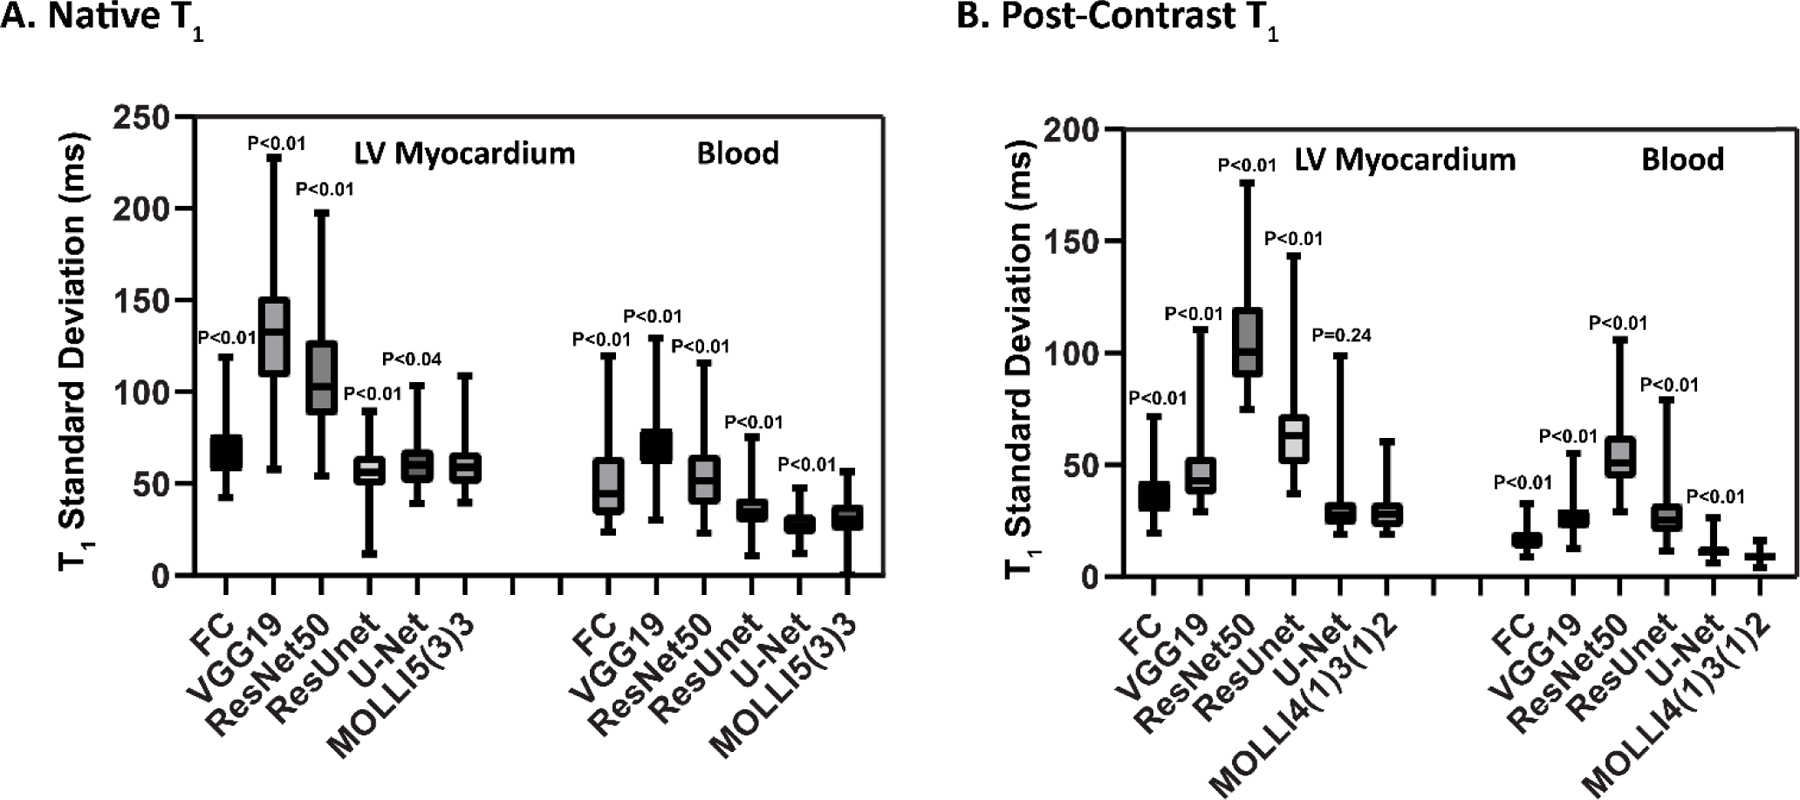
Box-and-whisker plots showing T1 standard deviation of the myocardium and blood for existing MOLLI data from two MOLLI sequences (MOLLI5(3)3 for native T1 and MOLLI4(1)3(1)2 for post-contrast T1) and MyoMapNet via different DL architectures.
Phantom Experiments
Figures 6 and 7 show the accuracy and precision of T1 values in different phantom vials with various T1 and T2 values across different DL models. Table 2 shows the measured T1 values. Consistent with in-vivo findings in the existing dataset, MyoMapNet with VGG19, ResNet50, and ResUnet had large T1 estimation errors compared to MOLLI. Both FC and U-Net yielded excellent maps (Supplementary Figure 4) with a T1 mean difference of 10.6 ms and −5.57 ms, respectively (all P<0.05).
Figure 6:
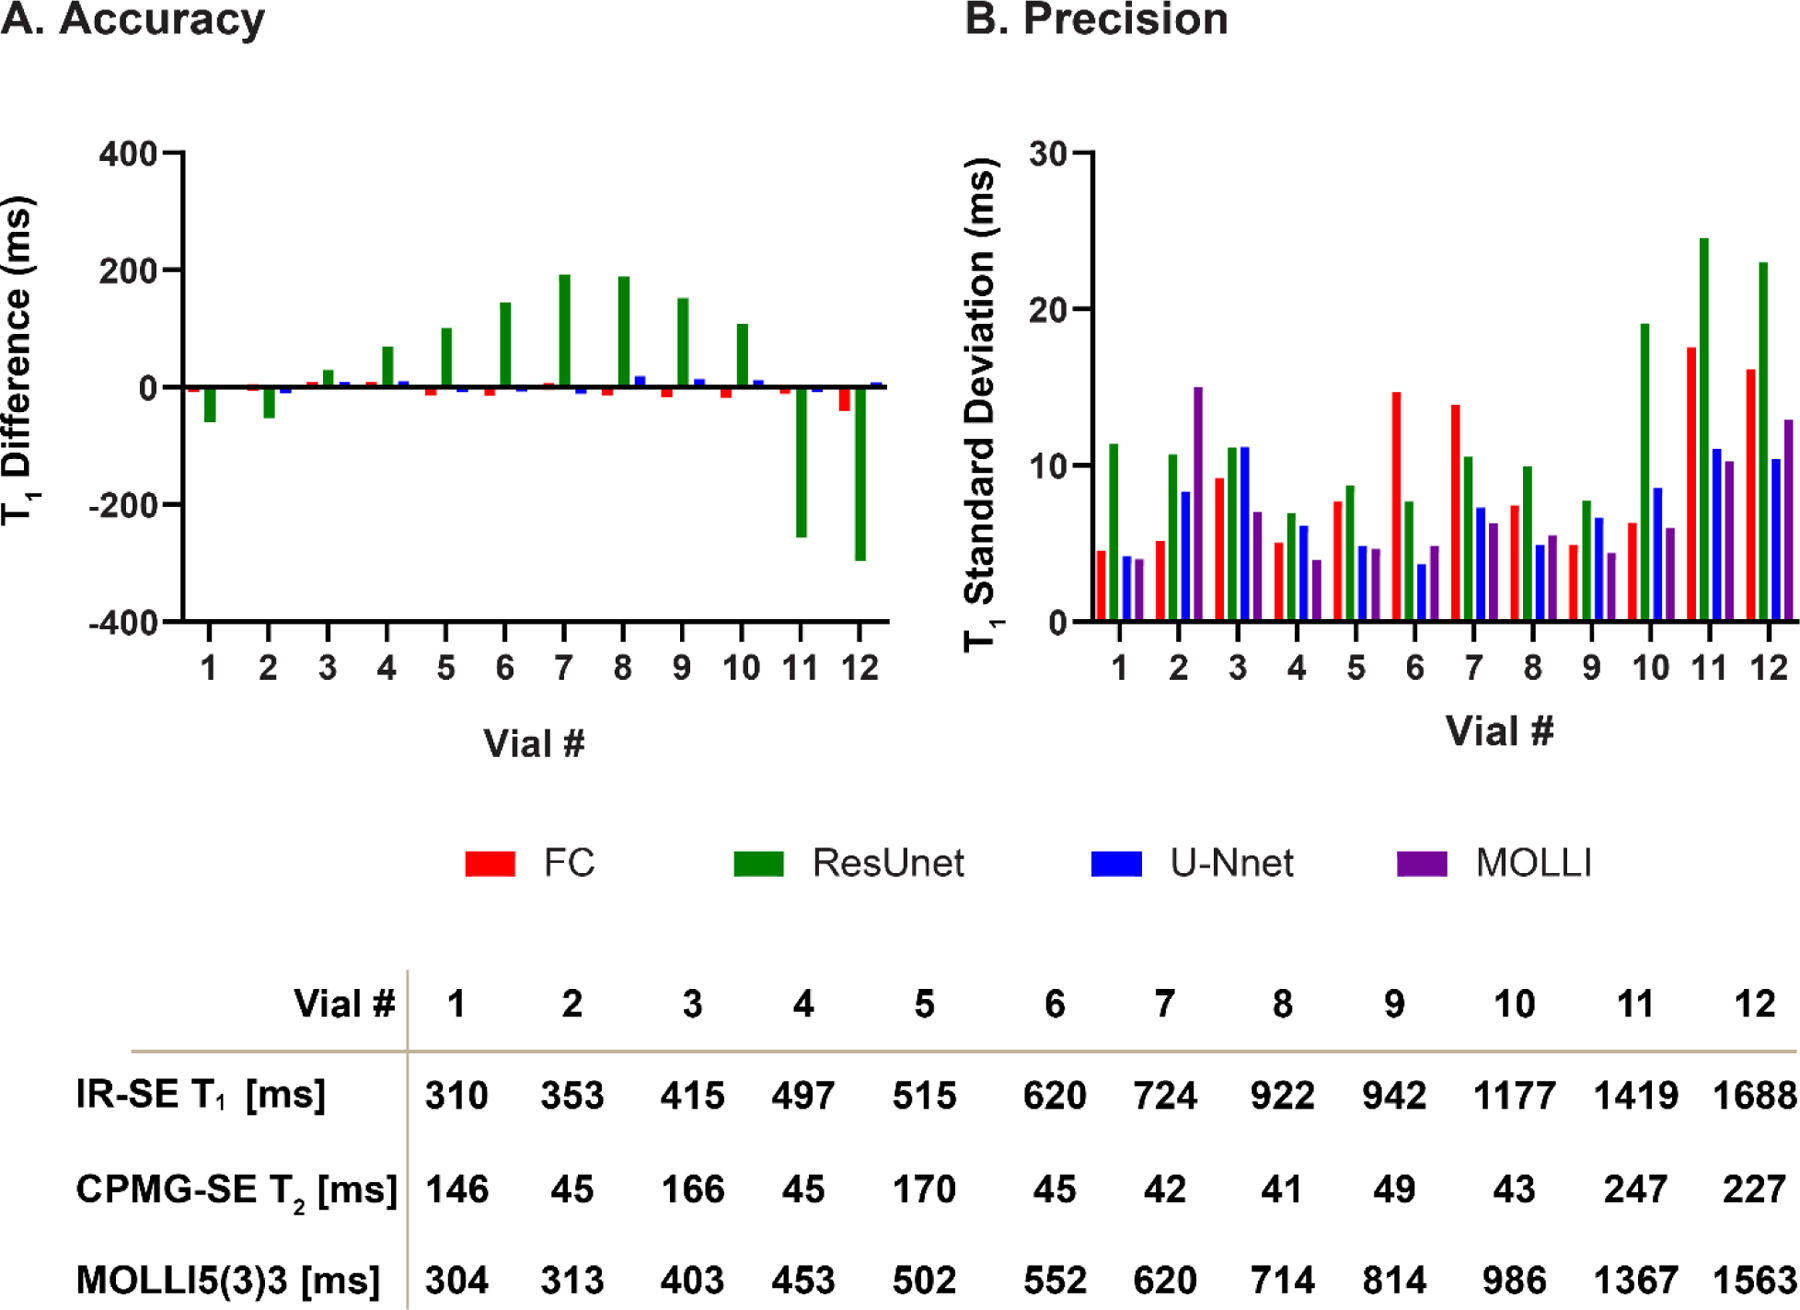
T1 accuracy and precision across phantom vials for MOLLI and MyoMapNet with FC, ResUnet, and U-Net models. FC and U-Net showed good precision, while ResUnet resulted in substantial measurement errors for different vials.
Figure 7:
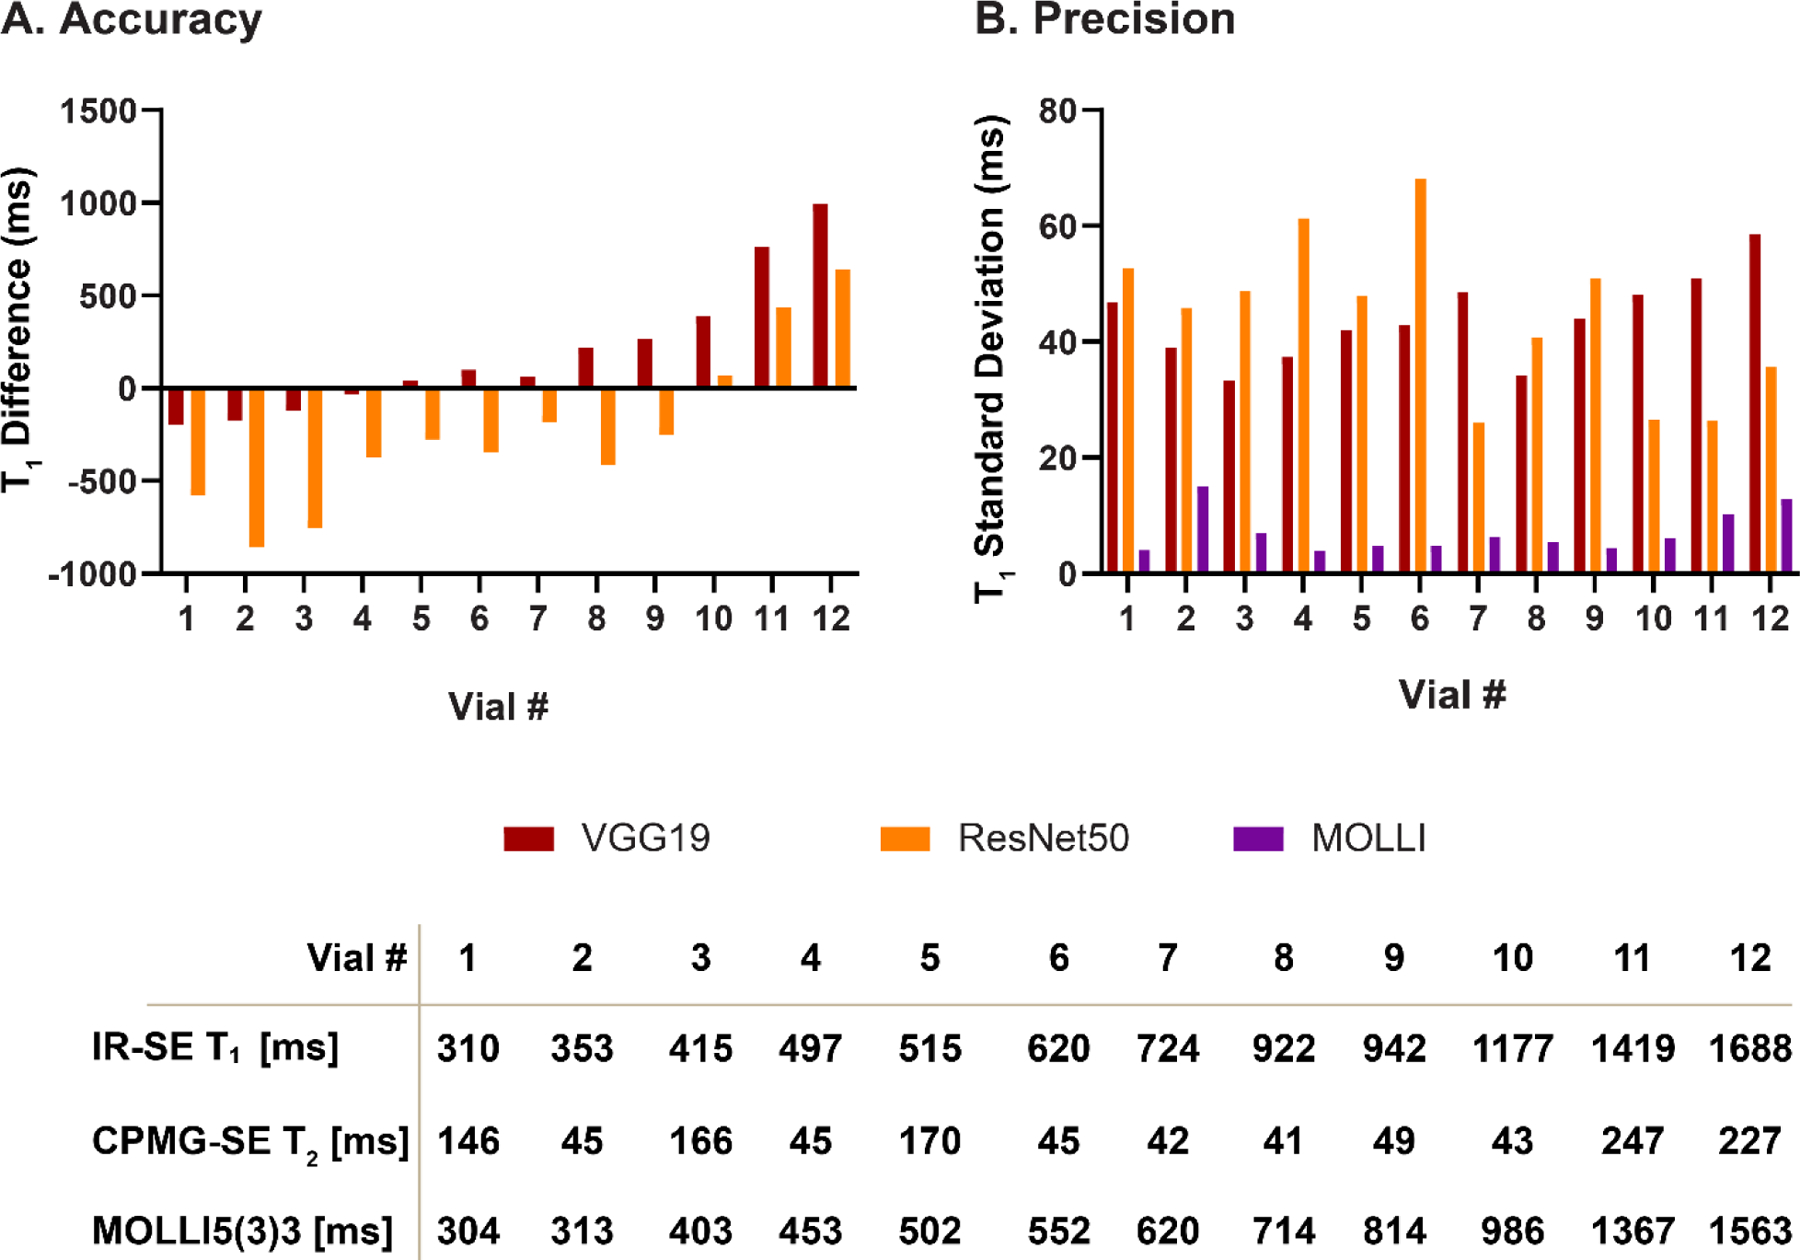
T1 accuracy and precision across phantom vials for MOLLI and MyoMapNet with VCG19 and ResNet50 models. Both VCG19 and ResNet50 resulted in large errors for different vials.
Table 2.
Mean and standard deviation of T1 for each phantom vial measured by MOLLI and LL4 with MyoMapNet across different DL models
| Phantom Vials T1 | ||||||||||||
|---|---|---|---|---|---|---|---|---|---|---|---|---|
| #1 | #2 | #3 | #4 | #5 | #6 | #7 | #8 | #9 | #10 | #11 | #12 | |
| FC | 300 ±4 | 307 ±5 | 405 ±9 | 455 ±5 | 516 ± 8 | 567 ±14 | 625 ±13 | 728 ±7 | 831 ±4 | 1004 ±6 | 1377 ±17 | 1604 ±16 |
| VGG19 | 502±46 | 486 ±38 | 526 ±33 | 485±37 | 460±42 | 454±42 | 560±48 | 494±34 | 546±44 | 599 ±48 | 602±50 | 571 ±58 |
| ResNet50 | 884±52 | 1168±45 | 1157±48 | 824±61 | 777±47 | 900±68 | 805±26 | 1128±40 | 1065±51 | 919 ±26 | 933±26 | 924 ±35 |
| ResUnet | 363±11 | 365 ±10 | 373 ±11 | 383 ±6 | 401 ± 8 | 407±7 | 428±10 | 525±9 | 661±7 | 878±19 | 1623 ±24 | 1859±22 |
| U-Net | 303 ±4 | 312 ±8 | 393 ±11 | 442 ±6 | 498 ±4 | 548±3 | 619±7 | 695±4 | 799 ±6 | 974±8 | 1374±11 | 1567±10 |
| MOLLI | 304 ±4 | 313 ±15 | 403 ±7 | 453 ±3 | 502±4 | 552 ±4 | 620 ±6 | 714 ±5 | 814 ±4 | 986 ±6 | 1367 ±10 | 1563±12 |
In-Vivo Evaluation using Prospectively Collected LL4
In the prospective LL4 study, the models exhibited similar performance as in the retrospective dataset (Figure 8). VGG19 and ResNet50 failed to generate anatomically correct images and had significant artifacts. ResUnet provided anatomically correct T1 maps; however, T1 values were significantly lower than those by MOLLI (Table 3). FC and U-Net yielded excellent image quality compared to MOLLI (Figure 8). Bland-Altman plots showed very good agreement between MOLLI and FC (mean-difference: 29.5 ms, 36.5 ms, 7.4 ms, 10.8 ms for native and post-contrast myocardium and blood pool) and between MOLLI and U-Net (mean-difference: 26.5 ms, 30.6 ms, 7.9 ms, 3.6 ms for native and post-contrast myocardium and blood pool) (Figure 9).
Figure 8:
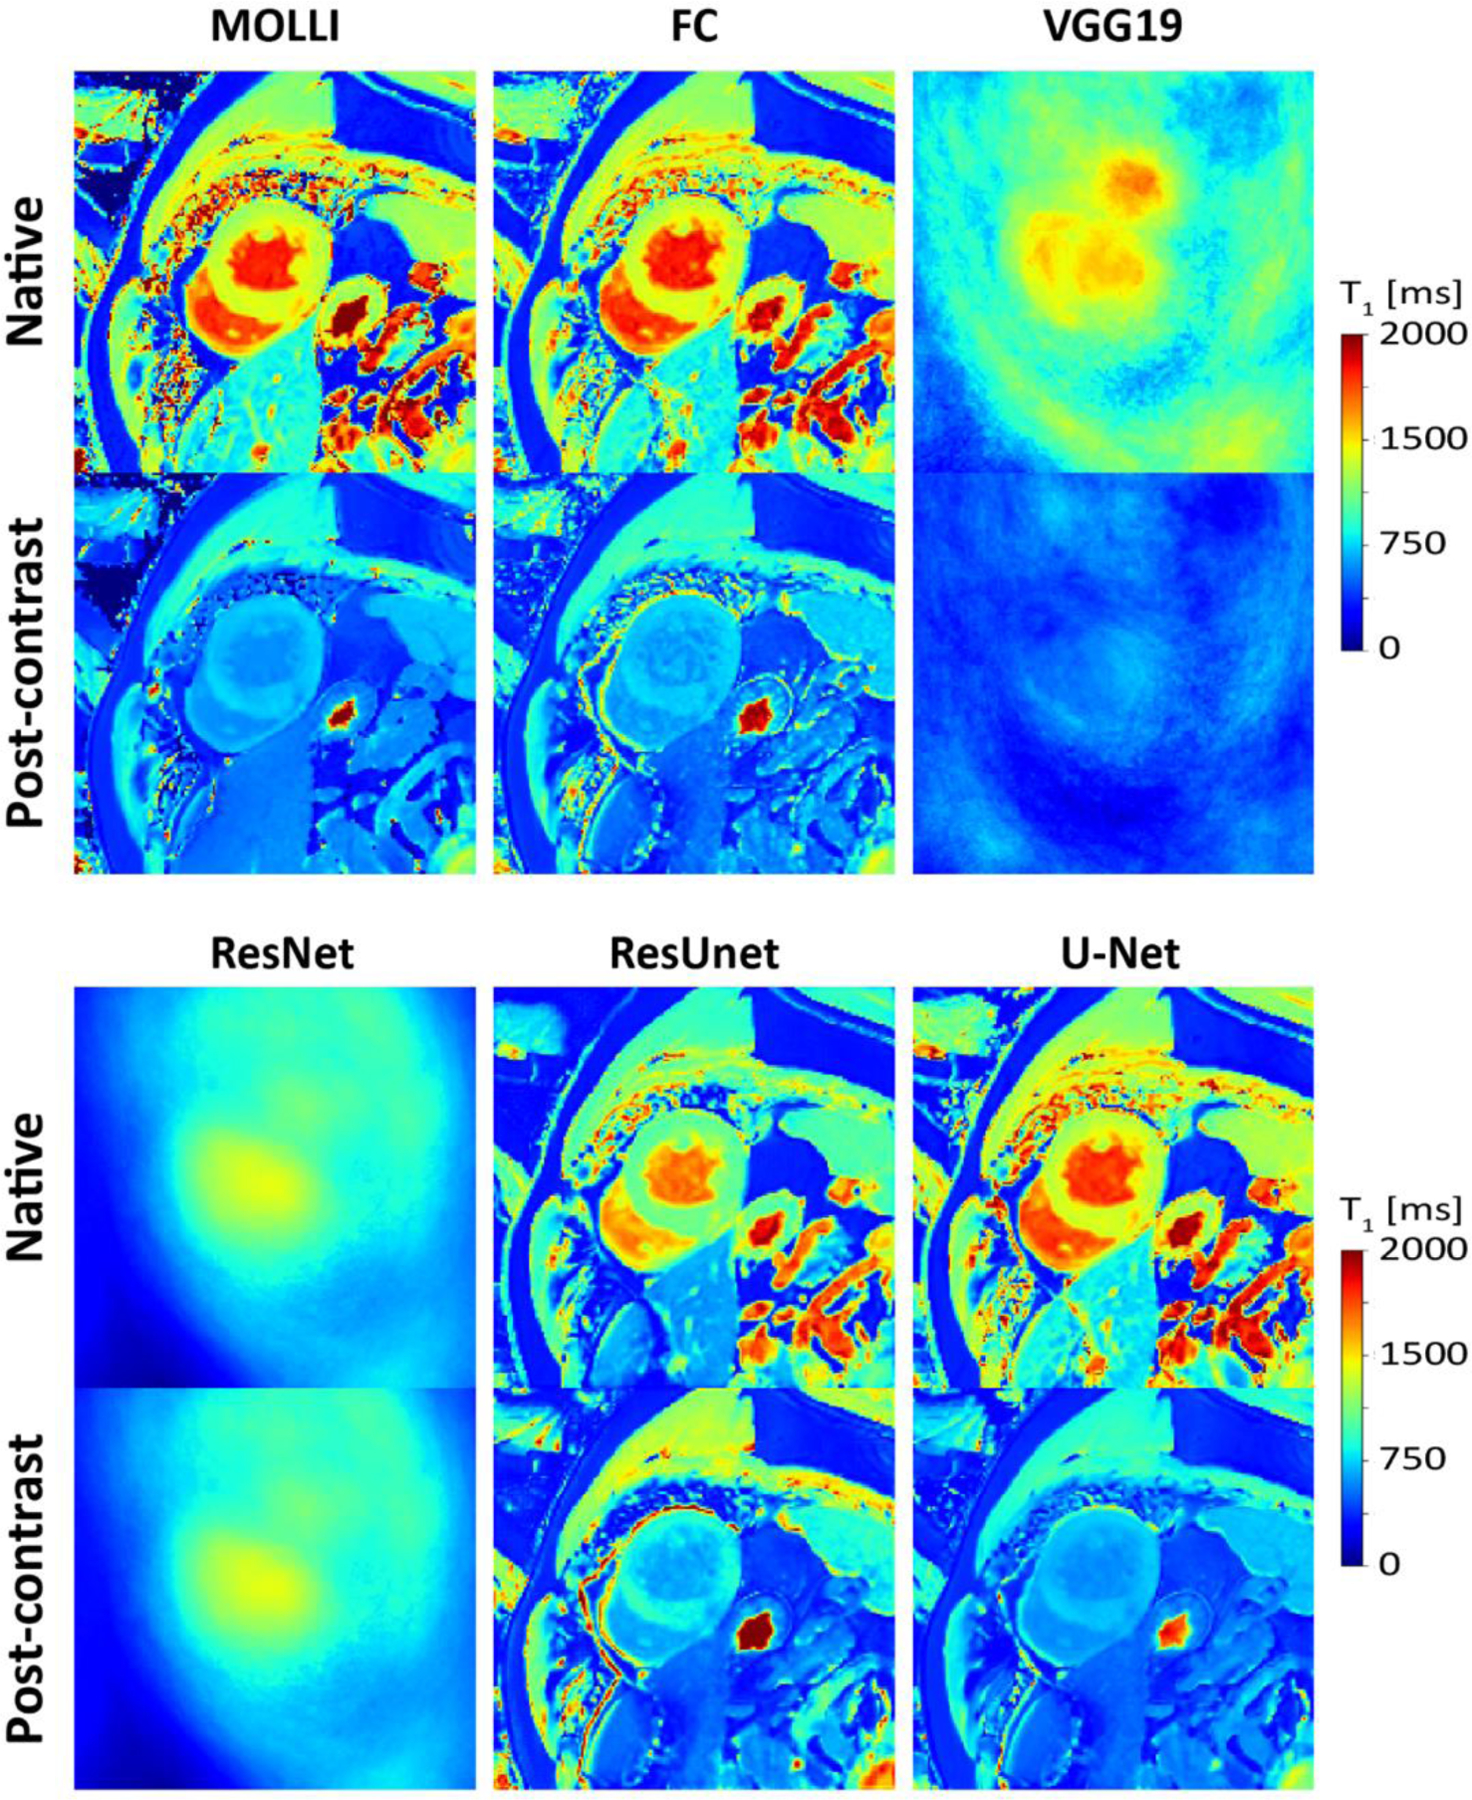
Native (A) and post-contrast (B) T1 maps generated using MOLLI and MyoMapNet with different DL architectures calculated from the prospectively collected LL4 sequence. VGG19 and ResNet50 failed to correctly estimate T1 maps and resulted in blurry images. ResUNet was able to create anatomically correct images but with significant T1 errors. Both U-Net and FC resulted in similar image quality as MOLLI.
Table 3.
Myocardium and blood T1 at 3T as measured by original MOLLI and estimated by MyoMapNet using four T1-weighted images collected in a separate LL4 sequence (not MOLLI) (N= 28).
| Native T1 | Post-Contrast T1 | |||||||
|---|---|---|---|---|---|---|---|---|
| Myocardium | Blood | Myocardium | Blood | |||||
| Accuracy | Precision | Accuracy | Precision | Accuracy | Precision | Accuracy | Precision | |
| FC | 1199 ± 42 | 63 ± 20 | 1856 ± 96 | 50 ± 24 | 639 ± 48 | 31 ± 11 | 517 ± 69 | 20 ± 9 |
| VGG19 | 1269 ± 189 | 133 ± 41 | 1387 ± 187 | 63 ± 20 | 458 ± 61 | 47 ± 17 | 452 ± 72 | 26 ± 9 |
| ResNet50 | 1055 ± 40 | 96 ± 29 | 1187 ± 57 | 47 ± 17 | 1030 ± 42 | 88 ± 33 | 1158 ± 65 | 51 ± 16 |
| ResUnet | 997 ± 138 | 51 ± 11 | 1657 ± 156 | 35 ± 13 | 811 ± 98 | 63 ± 20 | 615 ± 74 | 25 ± 12 |
| U-Net | 1196 ± 47 | 57 ± 12 | 1850 ± 88 | 25 ± 10 | 624 ± 42 | 25 ± 8 | 510 ± 66 | 12 ± 4 |
| MOLLI | 1170 ± 34 | 55 ± 12 | 1819 ± 85 | 28 ± 13 | 632 ± 44 | 26 ± 10 | 506 ± 63 | 10 ± 8 |
Figure 9:
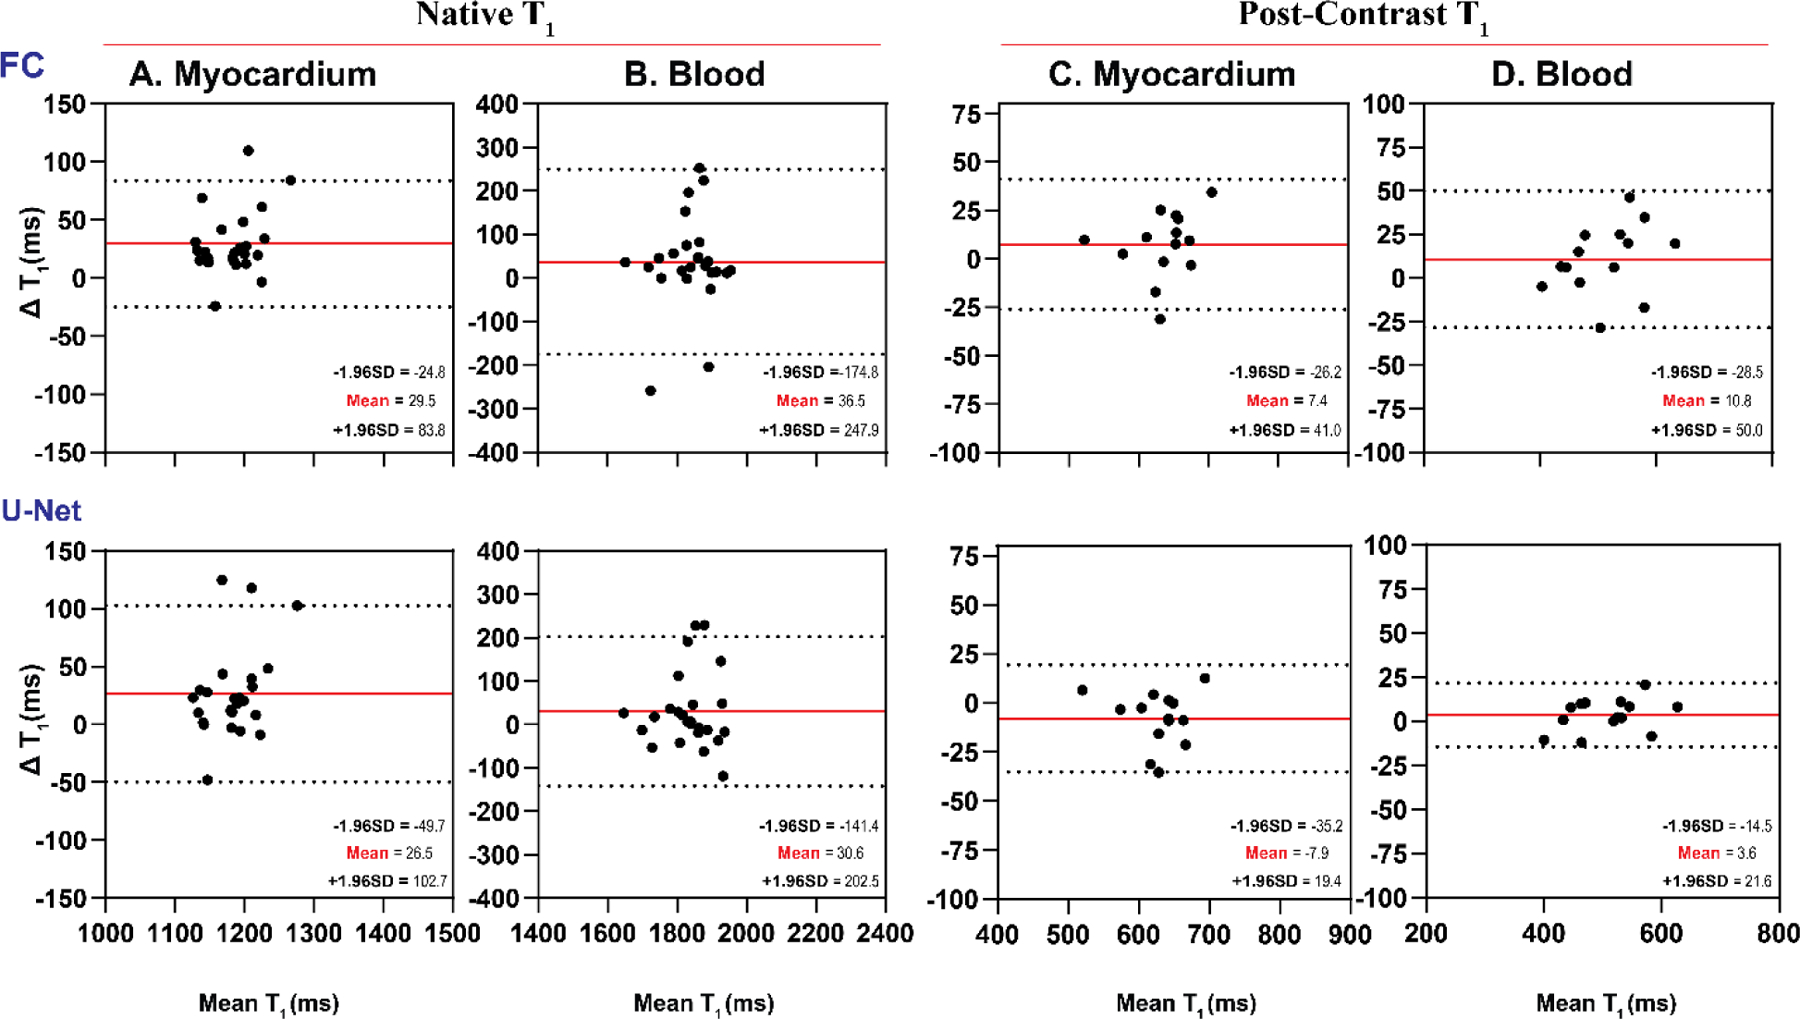
Bland-Altman plots demonstrating agreement between MOLLI and MyoMapNet for myocardium and blood T1 values as calculated by FC and U-Net in patients imaged using the prospectively collected LL4 sequence (N=28). Mean differences and 95% limits of agreement are shown in red and dotted lines, respectively.
Similar to the retrospective dataset, LL4 box-and-whisker plots show good T1 precision for FC and U-Net for native and post-contrast myocardium and blood pool (Figure 10). In native T1 images, the U-Net model yielded better T1 precision than the FC architecture (57 ms vs. 63 ms for the myocardium (P<0.05) and 25 ms vs. 50 ms for the blood pool for native T1 (P<0.05)). There was no difference in precision between MOLLI and U-Net for native T1 of blood or post-contrast T1 of myocardium or blood (all P>0.05) (Figure 10).
Figure 10:
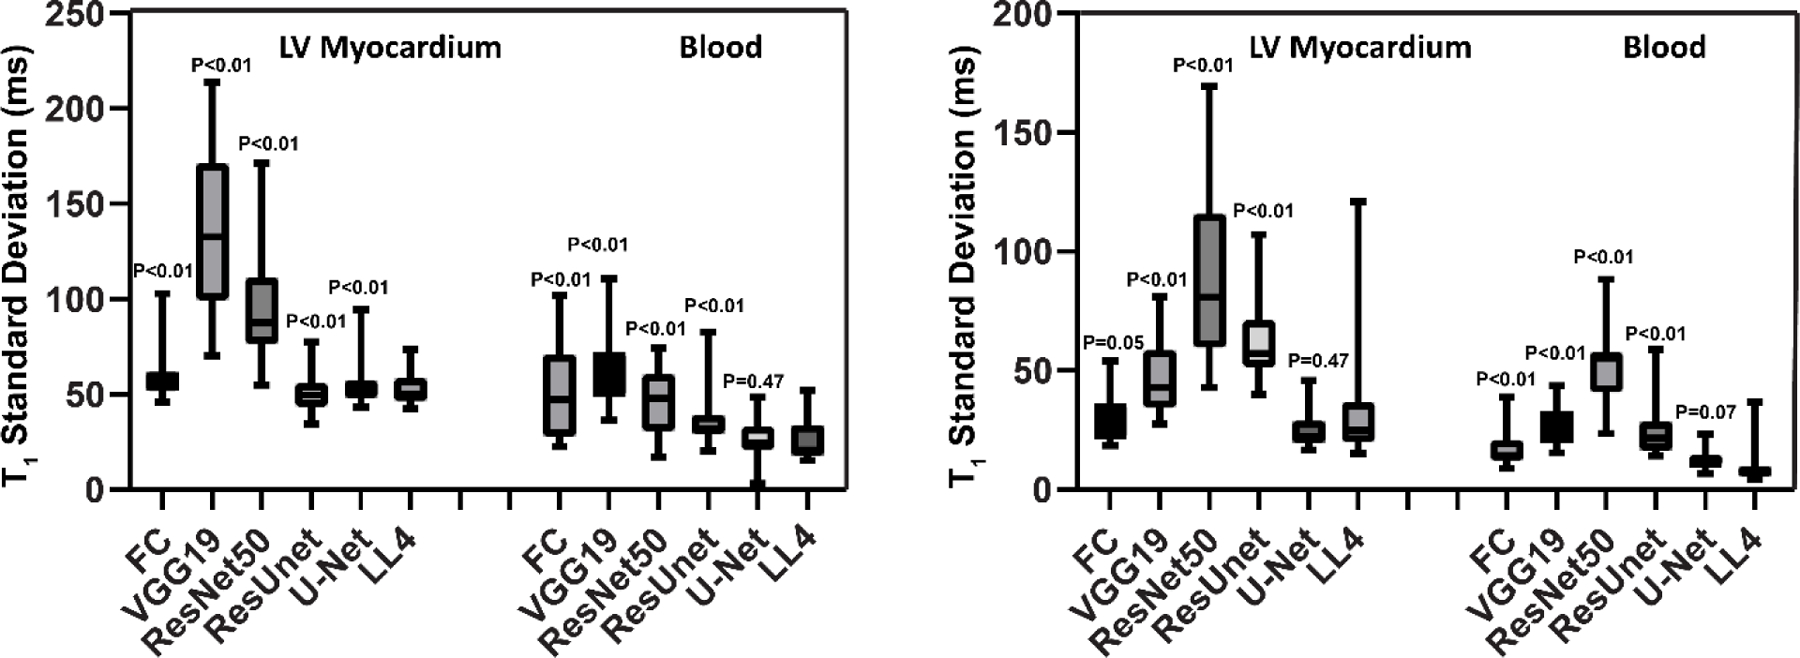
Box-and-whisker plots for the prospective LL4 dataset showing T1 standard deviation of the myocardium and blood using MyoMapNet via different DL models.
Discussion
In this study, we evaluated the performance of several DL architectures for estimating T1 values using MyoMapNet, an accelerated T1 mapping sequence, in four heartbeats. Our results show that both FC and U-Net can successfully create T1 maps from only four images with similar accuracy and precision as MOLLI. Furthermore, other DL convolutional networks such as VGG19 and ResNet50 failed to reliably estimate T1 values. While the accuracy was similar between U-Net and FC, our finding shows a statistically significant improvement in T1 precision with U-Net. Despite higher precision, the difference between the two methods yielded values that would likely not change clinical interpretation. Therefore, both ML models are potentially interchangeable.
ResUnet has shown promising results generating visually correct maps; however, it significantly underestimated T1. ResUnet uses both U-Net and residual learning (ResNet). Since ResNet failed with respect to T1 estimation, we hypothesize that its combination with U-Net degraded its performance instead of improving it, as usually expected when adding residual blocks to U-Net. Further studies are needed to investigate what caused this failure.
The FC network does not consider the information available in neighboring pixels since each pixel is treated independently. With the use of a convolutional-based network, we hypothesized that an improvement in precision could potentially be achieved even if accuracy did not improve. Nonetheless, in our study, well-established CNNs, such as VGG19 and ResNet50, performed poorly. The presence of max-pooling layers and fully connected layers after convolutions could be the main reason for this low performance. In a pilot study, we investigated the performance of the modified architectures based on VGG19 (mVGG) and ResNet50 (mResNet) without max pooling or fully connected layers after convolution and reported our preliminary findings (Supplementary Materials). The mVGG yielded improved map estimation and the mResNet exhibited better results; however, there was significant T1 estimation error. We further investigated the cause of the failure and found that it was due to batch normalization in the residual blocks. We also modified the original ResUnet (mResUnet) which showed underestimation of T1 values by updating the residual blocks containing batch normalization (the source of the issue). Next, the identity map was replaced by a convolutional layer followed by an activation function ReLU before concatenation, which resulted in a significant improvement. Further investigation is needed to rigorously study the impact of such architectures on MyoMapNet. Jun et al. (25) recently demonstrated that reasonably accurate brain T1 values can be achieved by removing max pooling and fully connected layers. Another solution, albeit expensive in terms of calculation, could be the use of small patches as input and estimates the T1 value of the central pixel of each patch (26,27).
Our choice of the various architectures was based on their previously reported performance (20). It is well known that the basic choice for image processing is CNN and rarely FC. Unlike U-Net, CNN uses FC after the last convolutional layer. As a result, CNN uses global information where the spatial arrangement of the input disappears. Thus, CNNs do not take into account spatial relationships between underlying objects. While this is an advantage for image classification and prediction, spatial relationship is important for T1 estimation. Without the ability to preserve the structural integrity of images, the CNN was not able to generate anatomically correct T1 maps. Indeed, in classification, learning feature mapping of an image allows conversion of it into a vector with high-level features that can be used with an FC to learn a non-linear combination of these features and generate an output. The use of pixel-wise based information with FC, or whole image information with an encoder-decoder U-Net, results in better representation learning and thus improved estimation.
To further facilitate clinical adoption of MyoMapNet, we integrated the two top-performing models for inline reconstruction of T1 mapping such that MyoMapNet T1 maps could be readily available upon completion at the scanner. This allows visualization of the maps on the scanner console without the need for off-line processing. While U-net has more significant computational burden, we did not notice any differences in computation time for map processing.
One of the major challenges of DL is its generalizability and robustness. Due to limited data access and widespread challenges due to the COVID-19 pandemic at the time of this study, we were unable to test the performance of our models on different MRI systems or field strengths. It is difficult to speculate how the performance of the models could be impacted by acquiring data from different scanners. We have previously reported rigorous analysis of various training schemes and their required number of T1-weighted images for MyoMapNet with the FC model (13). In this study, we did not perform a similar analysis, as we expect the result to be similar. In an ad-hoc study, we evaluated whether we could measure T1 values using only three T1-weighted images with U-Net; however, we found significant errors in T1 values (data not shown). The imaging parameters could potentially impact accuracy of T1 estimates using MyoMapNet. All images were also collected at 3T. Further studies are needed to evaluate the performance of the model for different field strengths and vendors. Further transfer learning-based training may be necessary to further develop this approach for different systems.
In our training, we used the MOLLI sequence for the training of the model. However, MOLLI underestimates actual T1 values (3,4). It also suffers from many confounders such as T2, inflow, and B0 and B1 inhomogeneity (3,4). Other sequences, such as SASHA or SAPPHIRE (28,29) with improved accuracy could potentially be used to train MyoMapNet; however, since we did not have a large dataset for training using these sequences, MOLLI data was used. Numerical simulation can also potentially further improve accuracy by simulating T1 recovery using the Bloch equation. There are several potential solutions for improving MyoMapNet accuracy using different training schemes, but further investigation is warranted.
Conclusion
U-Net and FC DL models in MyoMapNet enable fast myocardial T1 mapping from only four T1-weighted images collected by a single Lock-Locker sequence with comparable accuracy and precision.
Supplementary Material
Acknowledgment
Reza Nezafat receives grant funding from the National Institutes of Health (NIH) 1R01HL129185, 1R01HL129157, 1R01HL127015 and 1R01HL154744 (Bethesda, MD, USA); and the American Heart Association (AHA) 15EIA22710040 (Waltham, MA, USA). Xiaoying Cai and Kelvin Chow are employees of Siemens Medical Solutions USA, Inc. Reza Nezafat has a research agreement with Siemens.
Abbreviations
- DL
Deep learning
- AI
Artificial Intelligence
- FC
Fully connected neural networks
- CNN
Convolutional neural network
- LL
Look-Locker
- CI
Confidence interval
- CPU
Central processing unit
- GPU
Graphics processing units
- MOLLI
Modified look-locker inversion recovery
- MAE
Mean-absolute error
- IR-SE
Inversion-recovery spin-echo
- CPMG-SE
Carr-Purcell-Meiboom-Gill spin-echo
- ROI
Region of interest
- LV
Left ventricle
- SD
Standard deviation
- RAM
Random access memory
Footnotes
Availability of data and materials
MyoMapNet is an investigational technique and is not available by the vendor as a research tool or product. MyoMapNet codes are openly available on GitHub (https://github.com/HMS-CardiacMR/MyoMapUnet).
Ethics approval and consent to participate
This study was approved by the BIDMC Institutional Review Board (IRB) and was Health Insurance Portability and Accountability Act (HIPPA)-compliant.
Consent for publication
All other authors have reported that they have no relationships relevant to the contents of this paper to disclose.
References
- 1.Messroghli DR, Moon JC, Ferreira VM, Grosse-Wortmann L, He T, Kellman P, Mascherbauer J, Nezafat R, Salerno M, Schelbert EB, Taylor AJ, Thompson R, Ugander M, van Heeswijk RB, Friedrich MG. Clinical recommendations for cardiovascular magnetic resonance mapping of T1, T2, T2* and extracellular volume: A consensus statement by the Society for Cardiovascular Magnetic Resonance (SCMR) endorsed by the European Association for Cardiovascular Imaging (EACVI). J Cardiovasc Magn Reson 2017;19(1):75. [DOI] [PMC free article] [PubMed] [Google Scholar]
- 2.Haaf P, Garg P, Messroghli DR, Broadbent DA, Greenwood JP, Plein S. Cardiac T1 mapping and extracellular volume (ECV) in clinical practice: a comprehensive review. J Cardiovasc Magn Reson 2017;18(1):1–12. [DOI] [PMC free article] [PubMed] [Google Scholar]
- 3.Roujol S, Weingartner S, Foppa M, Chow K, Kawaji K, Ngo LH, Kellman P, Manning WJ, Thompson RB, Nezafat R. Accuracy, precision, and reproducibility of four T1 mapping sequences: a head-to-head comparison of MOLLI, ShMOLLI, SASHA, and SAPPHIRE. Radiology 2014;272(3):683–689. [DOI] [PMC free article] [PubMed] [Google Scholar]
- 4.Kellman P, Hansen MS. T1-mapping in the heart: accuracy and precision. J Cardiovasc Magn Reson 2014;16(1):1–20. [DOI] [PMC free article] [PubMed] [Google Scholar]
- 5.Ugander M, Oki AJ, Hsu L-Y, Kellman P, Greiser A, Aletras AH, Sibley CT, Chen MY, Bandettini WP, Arai AE. Extracellular volume imaging by magnetic resonance imaging provides insights into overt and sub-clinical myocardial pathology. Eur Heart J 2012;33(10):1268–1278. [DOI] [PMC free article] [PubMed] [Google Scholar]
- 6.Messroghli DR, Radjenovic A, Kozerke S, Higgins DM, Sivananthan MU, Ridgway JP. Modified Look-Locker inversion recovery (MOLLI) for high-resolution T1 mapping of the heart. Magn Reson Med 2004;52(1):141–146. [DOI] [PubMed] [Google Scholar]
- 7.Shao J, Ghodrati V, Nguyen KL, Hu P. Fast and accurate calculation of myocardial T1 and T2 values using deep learning Bloch equation simulations (DeepBLESS). Magn Reson Med 2020;84(5):2831–2845. [DOI] [PMC free article] [PubMed] [Google Scholar]
- 8.Nezafat M, El-Rewaidy H, Kucukseymen S, Hauser TH, Fahmy AS. Deep convolution neural networks based artifact suppression in under-sampled radial acquisitions of myocardial T1 mapping images. Phys Med Biol 2020;65(22):225024. [DOI] [PubMed] [Google Scholar]
- 9.Hamilton JI, Currey D, Rajagopalan S, Seiberlich N. Deep learning reconstruction for cardiac magnetic resonance fingerprinting T1 and T2 mapping. Magn Reson Med 2021;85(4):2127–2135. [DOI] [PMC free article] [PubMed] [Google Scholar]
- 10.Fahmy AS, El-Rewaidy H, Nezafat M, Nakamori S, Nezafat R. Automated analysis of cardiovascular magnetic resonance myocardial native T1 mapping images using fully convolutional neural networks. J Cardiovasc Magn Reson 2019;21(1):7. [DOI] [PMC free article] [PubMed] [Google Scholar]
- 11.Zhu Y, Fahmy AS, Duan C, Nakamori S, Nezafat R. Automated myocardial T2 and extracellular volume quantification in cardiac MRI using transfer learning–based myocardium segmentation. Radiol Artif Intel 2020;2(1):e190034. [DOI] [PMC free article] [PubMed] [Google Scholar]
- 12.Hann E, Popescu IA, Zhang Q, Gonzales RA, Barutcu A, Neubauer S, Ferreira VM, Piechnik SK. Deep neural network ensemble for on-the-fly quality control-driven segmentation of cardiac MRI T1 mapping. Med Image Anal 2021;71:102029. [DOI] [PMC free article] [PubMed] [Google Scholar]
- 13.Guo R, El-Rewaidy H, Assana S, Cai X, Amyar A, Chow K, Bi X, Yankama T, Cirillo J, Pierce P. Accelerated cardiac T1 mapping in four heartbeats with inline MyoMapNet: a deep learning-based T1 estimation approach. J Cardiovasc Magn Reson 2022;24(1):1–15. [DOI] [PMC free article] [PubMed] [Google Scholar]
- 14.Simonyan K, Zisserman A. Very deep convolutional networks for large-scale image recognition. Int Conf Learn Represent 2015.
- 15.He K, Zhang X, Ren S, Sun J. Deep residual learning for image recognition. Proc IEEE Comput Soc Conf Comput Vis Pattern Recognit 2016:770–778.
- 16.Diakogiannis FI, Waldner F, Caccetta P, Wu C. ResUNet-a: A deep learning framework for semantic segmentation of remotely sensed data. ISPRS J Photogramm Remote Sens 2020;162:94–114. [Google Scholar]
- 17.Ronneberger O, Fischer P, Brox T. U-net: Convolutional networks for biomedical image segmentation. Int Conf Med Image Comput Assist Interv 2015:234–241.
- 18.Liu X, Faes L, Kale AU, Wagner SK, Fu DJ, Bruynseels A, Mahendiran T, Moraes G, Shamdas M, Kern C. A comparison of deep learning performance against health-care professionals in detecting diseases from medical imaging: a systematic review and meta-analysis. The Lancet Digit Health 2019;1(6):e271–e297. [DOI] [PubMed] [Google Scholar]
- 19.Fahmy AS, Neisius U, Chan RH, Rowin EJ, Manning WJ, Maron MS, Nezafat R. Three-dimensional deep convolutional neural networks for automated myocardial scar quantification in hypertrophic cardiomyopathy: a multicenter multivendor study. Radiology 2020;294(1):52–60. [DOI] [PMC free article] [PubMed] [Google Scholar]
- 20.Aggarwal R, Sounderajah V, Martin G, Ting DS, Karthikesalingam A, King D, Ashrafian H, Darzi A. Diagnostic accuracy of deep learning in medical imaging: a systematic review and meta-analysis. NPJ Digit Med 2021;4(1):1–23. [DOI] [PMC free article] [PubMed] [Google Scholar]
- 21.Pascanu R, Mikolov T, Bengio Y. On the difficulty of training recurrent neural networks. Proc Mach Learn Int Conf Mach Learn 2013:1310–1318.
- 22.Taylor AJ, Salerno M, Dharmakumar R, Jerosch-Herold M. T1 mapping: basic techniques and clinical applications. JACC Cardiovasc Imaging 2016;9(1):67–81. [DOI] [PubMed] [Google Scholar]
- 23.Captur G, Gatehouse P, Keenan KE, Heslinga FG, Bruehl R, Prothmann M, Graves MJ, Eames RJ, Torlasco C, Benedetti G. A medical device-grade T1 and ECV phantom for global T1 mapping quality assurance—the T 1 Mapping and ECV Standardization in cardiovascular magnetic resonance (T1MES) program. J Cardiovasc Magn Reson 2016;18(1):1–20. [DOI] [PMC free article] [PubMed] [Google Scholar]
- 24.Captur G, Gatehouse P, Keenan KE, Heslinga FG, Bruehl R, Prothmann M, Graves MJ, Eames RJ, Torlasco C, Benedetti G, Donovan J, Ittermann B, Boubertakh R, Bathgate A, Royet C, Pang W, Nezafat R, Salerno M, Kellman P, Moon JC. A medical device-grade T1 and ECV phantom for global T1 mapping quality assurance-the T1 Mapping and ECV Standardization in cardiovascular magnetic resonance (T1MES) program. J Cardiovasc Magn Reson 2016;18(1):58. [DOI] [PMC free article] [PubMed] [Google Scholar]
- 25.Jun Y, Shin H, Eo T, Kim T, Hwang D. Deep model-based magnetic resonance parameter mapping network (DOPAMINE) for fast T1 mapping using variable flip angle method. Med Image Anal 2021;70:102017. [DOI] [PubMed] [Google Scholar]
- 26.Hirra I, Ahmad M, Hussain A, Ashraf MU, Saeed IA, Qadri SF, Alghamdi AM, Alfakeeh AS. Breast Cancer Classification From Histopathological Images Using Patch-Based Deep Learning Modeling. IEEE Access 2021;9:24273–24287. [Google Scholar]
- 27.Li Y, Wu J, Wu Q. Classification of breast cancer histology images using multi-size and discriminative patches based on deep learning. IEEE Access 2019;7:21400–21408. [Google Scholar]
- 28.Chow K, Flewitt JA, Green JD, Pagano JJ, Friedrich MG, Thompson RB. Saturation recovery single‐shot acquisition (SASHA) for myocardial T1 mapping. Magn Reson Med 2014;71(6):2082–2095. [DOI] [PubMed] [Google Scholar]
- 29.Weingartner S, Akcakaya M, Basha T, Kissinger KV, Goddu B, Berg S, Manning WJ, Nezafat R. Combined saturation/inversion recovery sequences for improved evaluation of scar and diffuse fibrosis in patients with arrhythmia or heart rate variability. Magn Reson Med 2014;71(3):1024–1034. [DOI] [PubMed] [Google Scholar]
Associated Data
This section collects any data citations, data availability statements, or supplementary materials included in this article.


