

Abstract
Polo-like kinase 1 (Plk1) plays an important role in cell cycle regulation. Recent work has suggested that Plk1 could be a biomarker of gemcitabine response in pancreatic ductal adenocarcinoma (PDAC). Although targeting Plk1 to treat PDAC has been attempted in clinical trials, the results were not promising, and the mechanisms of resistance to Plk1 inhibition is poorly understood. In addition, the role of Plk1 in PDAC progression requires further elucidation. Here, we showed that Plk1 was associated with poor outcomes in PDAC patients. In an inducible transgenic mouse line with specific expression of Plk1 in the pancreas, Plk1 overexpression significantly inhibited caerulein-induced acute pancreatitis and delayed development of acinar-to-ductal metaplasia (ADM) and pancreatic intraepithelial neoplasia (PanIN). Bioinformatics analyses identified the regulatory networks in which Plk1 is involved in PDAC disease progression, including multiple inflammation-related pathways. Unexpectedly, inhibition or depletion of Plk1 resulted in upregulation of PD-L1 via activation of the NFκB pathway. Mechanistically, Plk1-mediated phosphorylation of RB at S758 inhibited the translocation of NFκB to nucleus, inactivating the pathway. Inhibition of Plk1 sensitized PDAC to immune checkpoint blockade therapy through activation of an anti-tumor immune response. Together, Plk1 suppresses PDAC progression and inhibits NFκB activity, and targeting Plk1 can potentiate the efficacy of immunotherapy in PDAC.
Keywords: Plk1, AP, PanIN, PDAC, PD-L1
Introduction
Pancreatic ductal adenocarcinoma (PDAC) has the highest mortality rate of all cancers (1). PDAC formation starts with acinar-to-ductal metaplasia (ADM), the hallmark of acute pancreatitis, followed by pancreatic intraepithelial neoplasia (PanIN), the precursor lesion of most PDACs (2). In contrast, only a minority of PDACs arise from cystic neoplasms, such as an intraductal papillary mucinous neoplasm (IPMN) (3). The standard of care therapy, in addition to surgery in eligible patients, is gemcitabine; however, this treatment strategy has shown limited success (4). Interestingly, involvement of polo-like kinase 1 (Plk1) in cell cycle progression and in the response to cellular stresses has shown that Plk1 plays an important role in aberrant cell proliferation and survival associated with tumorigenesis (5). Inhibition and knockdown of Plk1 induces apoptosis in many cancers, and it is currently a promising anti-tumor target (6). Importantly, a recent study suggests that Plk1 might be a mediator for gemcitabine resistance in pancreatic cancer. Among approximately 40 potential target genes, Plk1 was the only gene that could distinguish gemcitabine-sensitive versus gemcitabine-resistant tumors (7). However, a Plk1 inhibitor as a single reagent to treat PDAC showed little efficacy (8). As a result, the further investigation of additional pathways is required.
Programmed death-ligand 1 (PD-L1) is a ligand for the programmed death-1 (PD-1), a costimulatory molecule that negatively regulates T-cell responses (9). Binding of PD-L1 to PD-1 suppresses T-cell activation and proliferation and induces apoptosis. In patients with PDAC, the intratumoral expression of PD-L1 correlates with a poor prognosis (10). This observation makes sense because increased PD-L1 expression by cancer cells and in the tumor microenvironment is a fundamental escape mechanism from host immunity. Therefore, blockage of T-cell checkpoint receptors with neutralizing antibodies (Abs) has emerged as a promising immunotherapeutic approach. Unfortunately, to date, attempts at immunotherapy in PDAC have achieved limited clinical benefits as single agents (11). This finding may be a result in part of a uniquely and more complex immunosuppressive tumor microenvironment (TME), which is dominant in most human PDACs. The immunosuppressive TME is an important regulator of disease progression and is responsible for poor responses to conventional therapy. Recent studies have shown that the tumor microenvironment of PDAC—including cancer-associated fibroblasts (CAFs) (12,13), extracellular matrix (14), immune cells (15), and cytokines (16)—is involved in the progression of PDAC through complex interactions with cancer cells.
Understanding these interactions requires a fundamental understanding of the altered pathways commonly present in PDAC. For example, the retinoblastoma protein, RB, is a tumor suppressor known to regulate the cell cycle, DNA damage response, and cellular differentiation. In addition, Cyclin-dependent kinase inhibitor 2A (CDKN2A) is either mutated or its promoter methylated in 95% of PDACs (17). The CDKN2A gene products, p16/Ink4a and p14/Arf, are inhibitors of Cyclin-dependent kinase 4/6 (CDK4/6) (18,19). CDK4/6 hyperactivation leads to inactivation of the RB tumor suppressor, resulting in increased proliferation (18,20). Jin et al, reported the interaction between RB and nuclear factor κB (NFκB) protein p65, which is primarily dependent on CDK4/6-mediated serine-249/threonine-252 (S249/T252) phosphorylation of RB. RNA-seq analysis shows a subset of NFκB pathway genes, including PD-L1, are selectively upregulated by RB knockdown or CDK4/6 inhibition (21).
Although many studies have shown that inhibition of Plk1 benefits tumor therapy, its role in tumor immunosuppression has not been described. Particularly, the function of Plk1 has not yet been examined in the context of mutant KrasG12D, a common driver mutation in PDAC. In this study, we examined the effects of concomitant conditional Plk1 overexpression and KrasG12D activation. By unbiased bioinformatics analyses, we observed dynamic changes of Plk1-associated inflammation during PDAC development. To our surprise, we observed a delayed phenotype of ADM, leading to repression of inflammation and a significantly slower progression of PanIN in mice upon Plk1 induction. Of interest, we discovered a negative association between Plk1 and PD-L1 in PDAC cells and human specimens, indicating that Plk1 regulates expression of PD-L1. Mechanistically, inhibition of Plk1 activates the NFκB pathway in an RB-dependent manner, leading to upregulation of PD-L1. Furthermore, combination therapy with a Plk1 inhibitor significantly potentiated the efficacy of anti-PD-L1 in treating PDAC cell line-derived allograft tumors by re-activating antitumor responses. Finally, the levels of Plk1 and PD-L1 are associated with outcomes of PDAC patients, which can be distinguished by differences in T-cell infiltration. Our data have demonstrated a tumor-suppressive role of Plk1 during the early stage of pancreatic cancer and a negative regulation of PD-L1 by Plk1 in PDAC, suggesting a new possibility to improve immunotherapy treatment of PDAC by combination with inhibition of Plk1.
Materials and Methods
Mouse Strains
In brief, to prevent chromosomal positional effects associated with the random nature of transgenic integration, we inserted the cassette into the well-characterized euchromatic locus Rosa26. Standard transfection procedures using this exchange vector were followed by recombinase-mediated integration and resulted in more than 90% positive embryonic stem (ES) cell clones. Induction of CreER activity was accomplished by administration of tamoxifen (200 μl of 20 mg/ml) via oral gavage to adult mice (6–8 wk). Mice, housed in the animal facility with free access to standard rodent chow and water, were under pathogen-free conditions and maintained in a 12-hr light/12-hr dark cycle.
The Plk1 knock-in mouse (Plk1LSL) was designed by the Xiaoqi Liu lab at Purdue University, and constructed by Taconic, Germany. Plk1LSL mice and were subsequently obtained from these recombinant ES cells. Mist1Cre/+/KrasG12D/+ mice were generated by the Konieczny lab at Purdue University, whereas Rosa26CreERt2 mice were purchased from the Jackson Laboratory. To generate Mist1CreER/+/Plk1LSL mice, we crossed the Plk1LSL line to the Mist1CreER/+ line. To generate Mist1CreER/+/KrasG12D/+/Plk1LSL mice, we crossed the Mist1CreER/+/KrasG12D/+ line to the Plk1LSL line. To generate Rosa26CreERt2/Plk1LSL mice, we crossed the Plk1LSL line to the Rosa26CreERt2 line. All procedures involving mice were approved by Purdue University Animal Care and Use Committee (Protocol no: 1111000133E001) and University of Kentucky Animal Care and Use Committee (Protocol no: 2020–3685).
Induction of acute pancreatitis
Acute pancreatitis was induced by caerulein via intraperitoneal (i.p) injections. Adult mice (6–8 wk) were given eight hourly i.p. injections of caerulein (Sigma-Aldrich, St. Louis, MO) for two consecutive days (50 μg/kg body weight), with control mice receiving phosphate buffered saline (PBS). Mice were sacrificed and pancreata samples were harvested for paraffin blocks, following the final caerulein injection. For all analyses, 2–5 mice per time point/genotype/experimental condition were analyzed.
Cell lines
While Panc1, BxPC3 and HeLa cells were purchased from American Type Culture Collection (ATCC), HEK293T was purchased from Sigma. Mouse KPC tumor cell lines were generated from individual primary tumors of KPC (KrasG12D/+/p53R172H/+/ElasCreER/+) mice. Panc1, HeLa and HEK293T cells were cultured in DMDM (Sigma) supplemented with 10% fetal calf serum (FCS, Atlantic), 100U/ml penicillin–streptomycin (Sigma), whereas BxPC-3 and KPC cells were maintained in RMPI1640 (Gibco) supplemented with 10% FCS (Atlantic) and 100U/ml penicillin/streptomycin (Sigma) and L-glutamine (Sigma). IFNγ treatment was performed over a period of 24h at a concentration of 10 ng/ml, if not indicated otherwise. Short Tandem Repeat (STR) profiling, provided by ATCC was used for testing and authentication of all cell lines. All cells were within 50 passages and Mycoplasma were detected every 3 months using MycoAlert PLUS Mycoplasma Detection Kit (Lonza, LT07–705).
Differential expression analysis among pancreatitis, acute pancreatitis, PanIN, and PDAC.
All RNA-Sequence raw counts were normalized to TPM (Transcripts Per Kilobase Million) by R17. Because small sample sizes would result in unstable gene lists and a poor prediction power, we developed a rank method for differential expression gene analysis to fit small sample size scenarios. Each gene expression profile was ranked and a one-way ANAVO analysis was used for the differential expression analysis among groups for pancreatitis, acute pancreatitis, PanIN, and PDAC. With a p-value of <0.001, we selected 4,097 out of 18,130 significantly differentially expressed genes.
Differential expression analysis for Plk1 molecular function disclosure
To observe the Plk1-associated functions in disease progression, differential expression analyses were performed in baseline (no caerulein injection), acute pancreatitis (2-day post caerulein injection), and PanIN (25-day post caerulein injection) samples of mice with or without Plk1 knock-in and PDAC. Differential expression was calculated by the Wilcoxon signed-rank test after the TPM scale normalization. The top genes out of the 4,097 significantly modulated genes were used for pathway function enrichment and network analyses by the QIAGEN Ingenuity Pathway Analysis (QIAGEN IPA) software. For pathway enrichment analysis, we used the DAVID Bioinformatics Resources 6.8 tool to annotate these significant genes’ molecular functions referring to the KEGG pathways annotations. Heatmaps of these genes were generated by the GENE-E (https://software.broadinstitute.org/GENE-E) online tool.
Subcutaneous and orthotopic tumor growth assays
Mouse KPC tumor cell lines were generated from individual primary tumors derived from KPC (KrasG12D/+/p53R172H/+/ElasCreER/+) mice. For the subcutaneous tumor studies, cells were injected into the interscapular region. For the tumor microenvironment (TME) study, we injected KPC cells orthotopically into the pancreas of Rosa26CreERT2/Plk1f/+mice, in which Plk1 was depleted upon tamoxifen injection. Tumors were measured over time, and the tumor volume was calculated as Volume = (Length × Width2)/2.
Plk1 kinase assay
Kinase assays were performed with TBMD buffer (50 mM Tris [pH 7.5], 10 mM MgCl2, 5 mM dithiothreitol, 2 mM EGTA, 0.5 mM sodium vanadate, 20 mM p-nitrophenyl phosphate) supplemented with 125 μM ATP and 10 μCi of [γ-32P] ATP at 30°C for 30 min. After the mixtures were resolved by SDS-PAGE, the gels were stained with Coomassie brilliant blue, followed by autoradiography.
Molecular model and simulation detail
The simulation box size is determined to ensure that the protein does not interact with its mirror. The 3.5 nm shell of NaCl solution is used to ensure the protein is surrounded by enough aqueous solution. This work deploys the AMBER14 force field with OL15 modifications (22) to describe bonded and non-bonded interactions in the systems. The non-bonded interactions are a sum of short-range Lennard-Jones 12–6 potential and long-range coulombic potential, as shown in Equation 1. The bonded interactions are a sum of the bond, angle, and dihedral potentials, as described in the force field.
| (1) |
where Eij is the potential energy due to the non-bonded interactions between atoms i and j, rij is the distance between atoms i and j, εij is the energetic parameter, σij is the geometric parameter and ei is the partial charge of atom i.
A three-step simulation process is conducted for every simulation system. First, energy minimization was conducted to remove any too-close contacts between atoms. Second, a 200-ns canonical (NVT, T=310 K) ensemble MD simulation (integral step = 2 fs) was conducted to let the system reach thermodynamic equilibrium. Third, a 300-ns canonical (NVT, T=300 K) ensemble MD simulation (integral step = 2 fs) was conducted to collect the trajectory at a frequency of 200 ps. The Berendsen method (23) is used to control the temperature and pressure of the system in the second step because it allows the system to reach the desired pressure and temperature at a fast pace. The velocity-rescaling method (24) is used to control the temperature of the system in the third step. The short-range van der Waals interactions use a 1.2-nm cut-off, and the long-range electrostatic interactions were calculated using the particle mesh Ewald sum.(25) All bonds involving H atoms were constrained during the simulations. The energy minimization and MD simulations for all the systems were conducted using Gromacs-2021.(26)
All-atom models were used to describe the wild-type RB protein and the mutant (RB-S758D), water molecules and ions. The initial structures of wild-type RB and RB-S758D were predicted by AlphaFold2 (27) using the sequences published by UniProt (P06400). The simulation systems were created by placing an RB protein or Rb-mutant protein in the center of a cubic box measuring 24 × 24 × 24 nm3 and the protein was associated with a 3.5nm-thick shell of 0.15M NaCl solution. Counter-ions were added to neutralize the system.
Statistics
Inflammation scoring, immunofluorescence (IF) staining, chemokine and cytokine quantification, qRT-PCR, immunohistochemistry (IHC) staining, tumor mass, and flow cytometry data were analyzed by an unpaired Student t test, with Welch correction being applied when unequal variances were present between groups. The statistic of survival was calculated by the Kaplan-Meier log rank analysis. All data were presented as the mean ± SEM. *, P < 0.05; **, P < 0.01; ***, P < 0.001; ****, P < 0.0001; n.s., not significant.
Data availability statement
The data generated in this study are available upon request from the corresponding author.
More details can be found in Supplementary Materials and Methods.
Results
Plk1 is associated with PDAC prognosis
In our previous study, we reported that the inhibition of Plk1 sensitized PDAC to gemcitabine, a standard chemotherapy for advanced pancreatic cancer (7). This finding renders a plausibility to investigate the efficacy of Plk1 inhibition in the treatment of PDAC. To this end, we firstly evaluated the levels of Plk1 in human PDAC tumors and found that the levels of Plk1 were gradually elevated in tumors with higher grades. The p-value for Plk1 with respect to G1 tumors vs G2 tumors was 0.0017, which is statistically significant. The p-value for G2 tumors vs G3 tumors was 0.0656, which implies an increasing trend with respect to Plk1 expression. The p-value for G3 tumors vs G4 tumors was 0.843, indicating no significant difference, likely due to a small sample size of G4 group (n=2) tumors. In general, the levels of Plk1 were clearly elevated in high-grade pancreatic tumors. Moreover, tumors with higher grades gained more TP53 mutations than those of tumors with lower grades (Figure 1A). Intriguingly, a significantly higher level of Plk1 was observed in TP53-mutant patients than that in TP53 non-mutant patients, implying that Plk1 may facilitate PDAC progression in a p53-dependent manner. Interestingly, TP53-mutant tumors were most likely to be higher grade than TP53 wild-type tumors (Figure 1B). To investigate the clinical significance of Plk1 in PDAC, we grouped tumors into those that were well-differentiated, moderately-differentiated and poorly-differentiated. As shown in Figure 1C, a higher level of Plk1 expression was observed in patients with more poorly differentiated tumors, indicating the role of Plk1 in the aggressiveness of PDAC. To investigate the roles of Plk1 on the clinical outcomes of PDAC patients, we utilized a pancreas tissue microarray with matched normal, chronic pancreatitis, PanIN, and PDAC to analyze the survival outcomes in patients. In agreement with the observed properties of Plk1 in PDAC progression, patients with a higher level of Plk1 had a significantly shorter overall survival compared to those with a lower level of Plk1 (Figure 1D). These collective data suggest the possibility of Plk1 as a therapeutic target for PDAC treatment. Indeed, a number of Plk1 inhibitors have been explored in the laboratory or in clinical studies (28). One phase Ⅱ study with the single agent Plk1-inhibitor BI2536 was completed in patients with advanced, unresectable pancreatic cancer (NCT00710710). Unfortunately, such inhibition as a single agent failed to induce tumor regression in advanced cancer patients (8). Herein, we must investigate the reasons resulting in the failure of Plk1 inhibition so that we can create alternative strategies to improve the efficacy of treatment for PDAC. Toward this aim, we sought to explore the role that Plk1 plays in PDAC development. Although the potential that Plk1 plays in PDAC prognosis was mentioned above, the role that Plk1plays in the initiation and progression of PDAC is not fully understood.
Figure 1. Plk1 is associated with a poor prognosis in PDAC and is involved in PDAC progression.
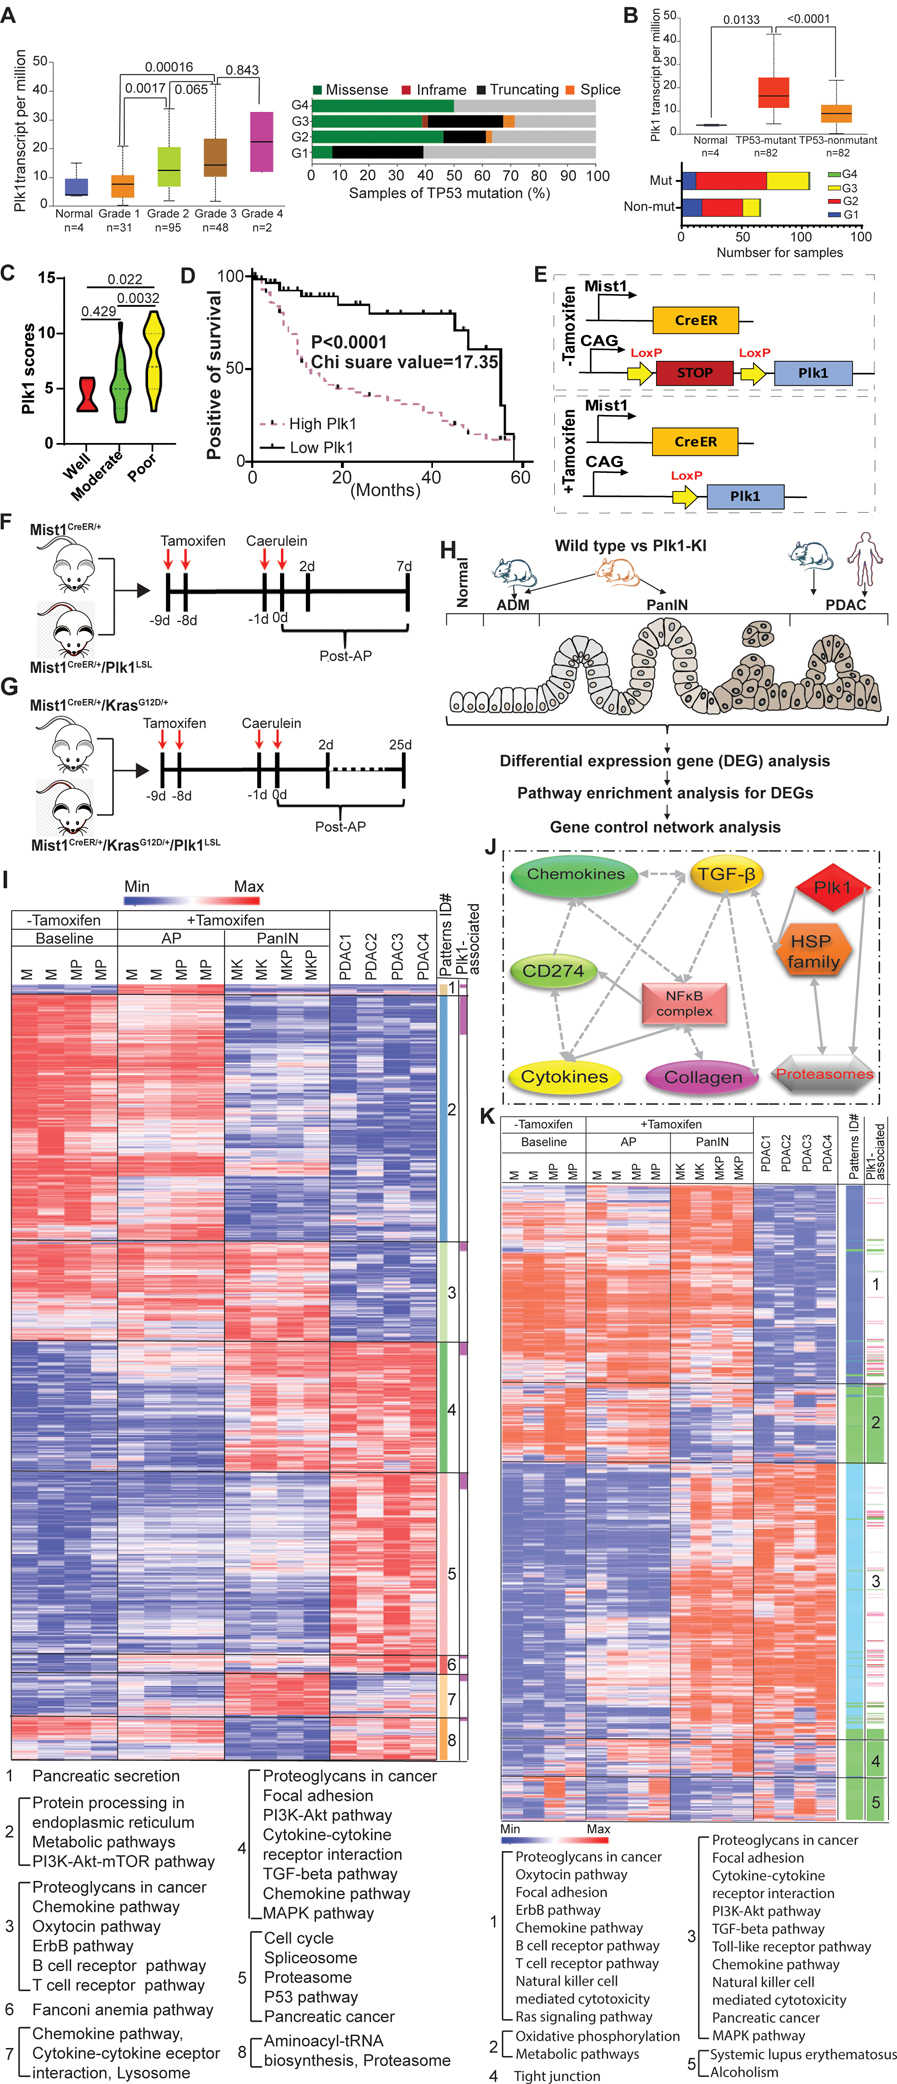
A, Plk1 expression and TP53 mutation status in pancreatic cancer patients with different tumor grades from TCGA. B, Plk1 expression and tumor grades in patients with different TP53 mutation status. Transcription data were analyzed by unpaired Student t test. C, The levels of Plk1 in tumor samples with different differentiation status. Statistical analysis of IHC staining was performed by unpaired Student t test. D, Correlation analysis between survival and expression level of Plk1 in a tissue microarray. Wilcoxon test was used to calculate patient survival. E, Schematic representation of the Plk1LSL alleles from tamoxifen-untreated and -treated mice. F, Time course of caerulein-induced acute pancreatitis. G, Time course of KrasG12D/+-driven PanIN development. H, Overview of bioinformatics analysis strategy. I, Heatmap for genes differentially expressed across AP, PanIN, and PDAC. Mouse PDAC were derived from Mist1CreER+/KrasG12D/+/p53R172H/+ mice. J, IPA network analysis identified the enrichment of immune-associated pathways across baseline, AP, PanIN, and PDAC. One-way ANAVO analysis was used to evaluate the statistical significance (p-value <0.001). The node colored in red denotes its variation significance of p-value. Solid lines denote direct interactions, whereas broken lines denote indirect interactions. K, Heatmap for genes identified by mapping Plk1-associated genes and gene signature of patterns 3 and 4 in I. M: Mist1CreER/+, MP: Mist1CreER/+/Plk1LSL, MK: Mist1CreER/+/KrasG12D/+, MKP: Mist1CreER/+/KrasG12D/+/Plk1LSL.
Plk1 is involved in PDAC progression via regulating inflammation pathways
While chronic pancreatitis (CP) predisposes to the development of PDAC, both CP and PDAC share a common etiology. A central role has been proposed for the development of ADM in the inflammatory environment that is associated with chronic pancreatitis. This metaplastic change is now recognized as a precursor to PDAC (29). In the present study, we explored the roles of Plk1 in the initiation and progression of pancreatitis, PanIN, and PDAC. To this end, we developed an inducible transgenic mouse line (Figure 1E) with the specific expression of Plk1 in the pancreas by crossing Plk1LSL mice to Mist1CreER/+ mice to generate Mist1CreER/+/Plk1LSL offspring (Figure S1A). Plk1-expression was observed as early as 1 week after tamoxifen treatment (Figures S1B and S1C). As indicated by hematoxylin and eosin (H&E) staining, no overt phenotype was observed in the acinar, ductal, or islet cell compartments of Mist1CreER/+/Plk1LSL mice (Figures S1D and S1E). To investigate the role of Plk1 in PanIN development, we generated Mist1CreER/+/KrasG12D/+ and Mist1CreER/+/KrasG12D/+/Plk1LSL mouse lines.
Caerulein injection was administrated to induce acute pancreatitis (AP) in Mist1CreER/+ and Mist1CreER/+/Plk1LSL mice 2 -days post-treatment (Figure 1F) and in PanIN with Mist1CreER/+/KrasG12D/+ and Mist1CreER/+/KrasG12D/+/Plk1LSL mice 25-days post-treatment (Figure 1G), respectively. To understand the mechanism of PDAC progression, an unbiased bioinformatics analysis was performed with mouse AP, PanIN, and PDAC samples (Figure 1H). 4,097 genes were identified to be differentiated among various disease statuses (Table S1). All genes were classified into 8 patterns which were enriched in different pathways. As showed in Figure 1I, a dynamic change of pathways was observed during the progression of PDAC in mice. Upon annotation, we found that pathways enriched in patterns 3 and 4 were involved in the process of disease development. Of note, the majority of the pathways were associated with immune response, including chemokine, cytokine, T cell, B cell, and TGF-β pathways. These collective data suggest that inflammation may be involved in the progression of PDAC. Herein, we hypothesize that Plk1 may be associated with inflammation pathways during disease development. To test this concept, we constructed an interaction network to investigate the interactions between inflammation pathways and Plk1. As shown in Figures 1J, we performed Ingenuity Pathway Analysis (IPA) and identified the potential connections among inflammation pathways, including cytokine, chemokine, collagen, NFκB, and TGF-β (Figures S2A and S2B). These connections might interact with Plk1, implying that Plk1 possibly engages in immune response during PDAC progression via the NFκB pathway. To further study the possible interaction between Plk1 and inflammation during PDAC progression, we identified the top genes associated with Plk1 by a differential expression analysis (Table S2), and we overlapped the genes of multiple inflammation pathways identified in patterns 3 and 4. Upon annotation, Plk1-associated pathways were classified into 5 new patterns in which different pathways were enriched. Of note, major pathways were clustered with the immune response and were involved in AP and PanIN (pattern 1) or PanIN and PDAC (pattern 3) (Figure 1K). This observation suggests that Plk1-associated inflammation may be involved in PDAC progression. To validate our findings, we then mined public databases of mouse pancreatitis and human PDAC samples. Upon investigation, differences in the pathways identified in Figure 1I can be observed in the reported mouse AP (Figure S3A) and human PDAC samples (Figure S3B). In summary, Plk1 is involved in PDAC progression possibly by regulating inflammatory pathways.
Induction of Plk1 significantly retarded the acinar acute pancreatitis response
ADM of the pancreas is a process by which pancreatic acinar cells differentiate into ductal-like cells. To evaluate the importance of Plk1 during ADM, we characterized Plk1 expression during the damage and subsequent recovery phases of acute pancreatitis (30). The major phenotype associated with caerulein-induced acute pancreatitis is a loss of acinar cell integrity (31,32). To validate the findings in Figure 1, Mist1CreER/+ and Mist1CreER/+/Plk1LSL mice were used to investigate the role of Plk1 in AP. Caerulein treatment in Mist1CreER/+/Plk1LSL mice led to a significant and rapid damage to the exocrine acinar cells. By 2 days post-acute pancreatitis, significant increases in inflammatory cell infiltration were observed, accompanied by the extensive formation of ADM lesions (Figures S1E and 2A–D). Likewise, we observed significant decreases of IL-1b, IL-3, IL-10, IL-12(p70), IL-17, IFN-γ, TNF-α, KC, IL-6, IL-9, MCP-1a, and G-CSF upon Plk1 induction in mice with caerulein-induced acute pancreatitis, suggesting that Plk1 attenuates acute pancreatitis via decreasing levels of inflammation (Figure 2B). Intriguingly, expression of Plk1 in the pancreas reduced edema and the inflammatory infiltrate caused by caerulein. Despite the significant development of ADM lesions, acute pancreatitis metaplasia was transient, as the lesions resolved 7-days post-acute pancreatitis (Figure 2C). In addition, the expression of the acinar cell marker amylase was decreased and was accompanied with an increased expression of the ductal cell marker K19 at 2-days post-caerulein treatment of Mist1CreER/+ mice. In striking contrast, such a process was clearly antagonized in Mist1CreER/+/Plk1LSL mice. In all cases, K19 protein levels returned to normal states at 7 d post-caerulein treatment (Figure 2D).
Figure 2. Effect of induction of Plk1 on progression of KrasG12D/+-driven PanINs in the pancreas.
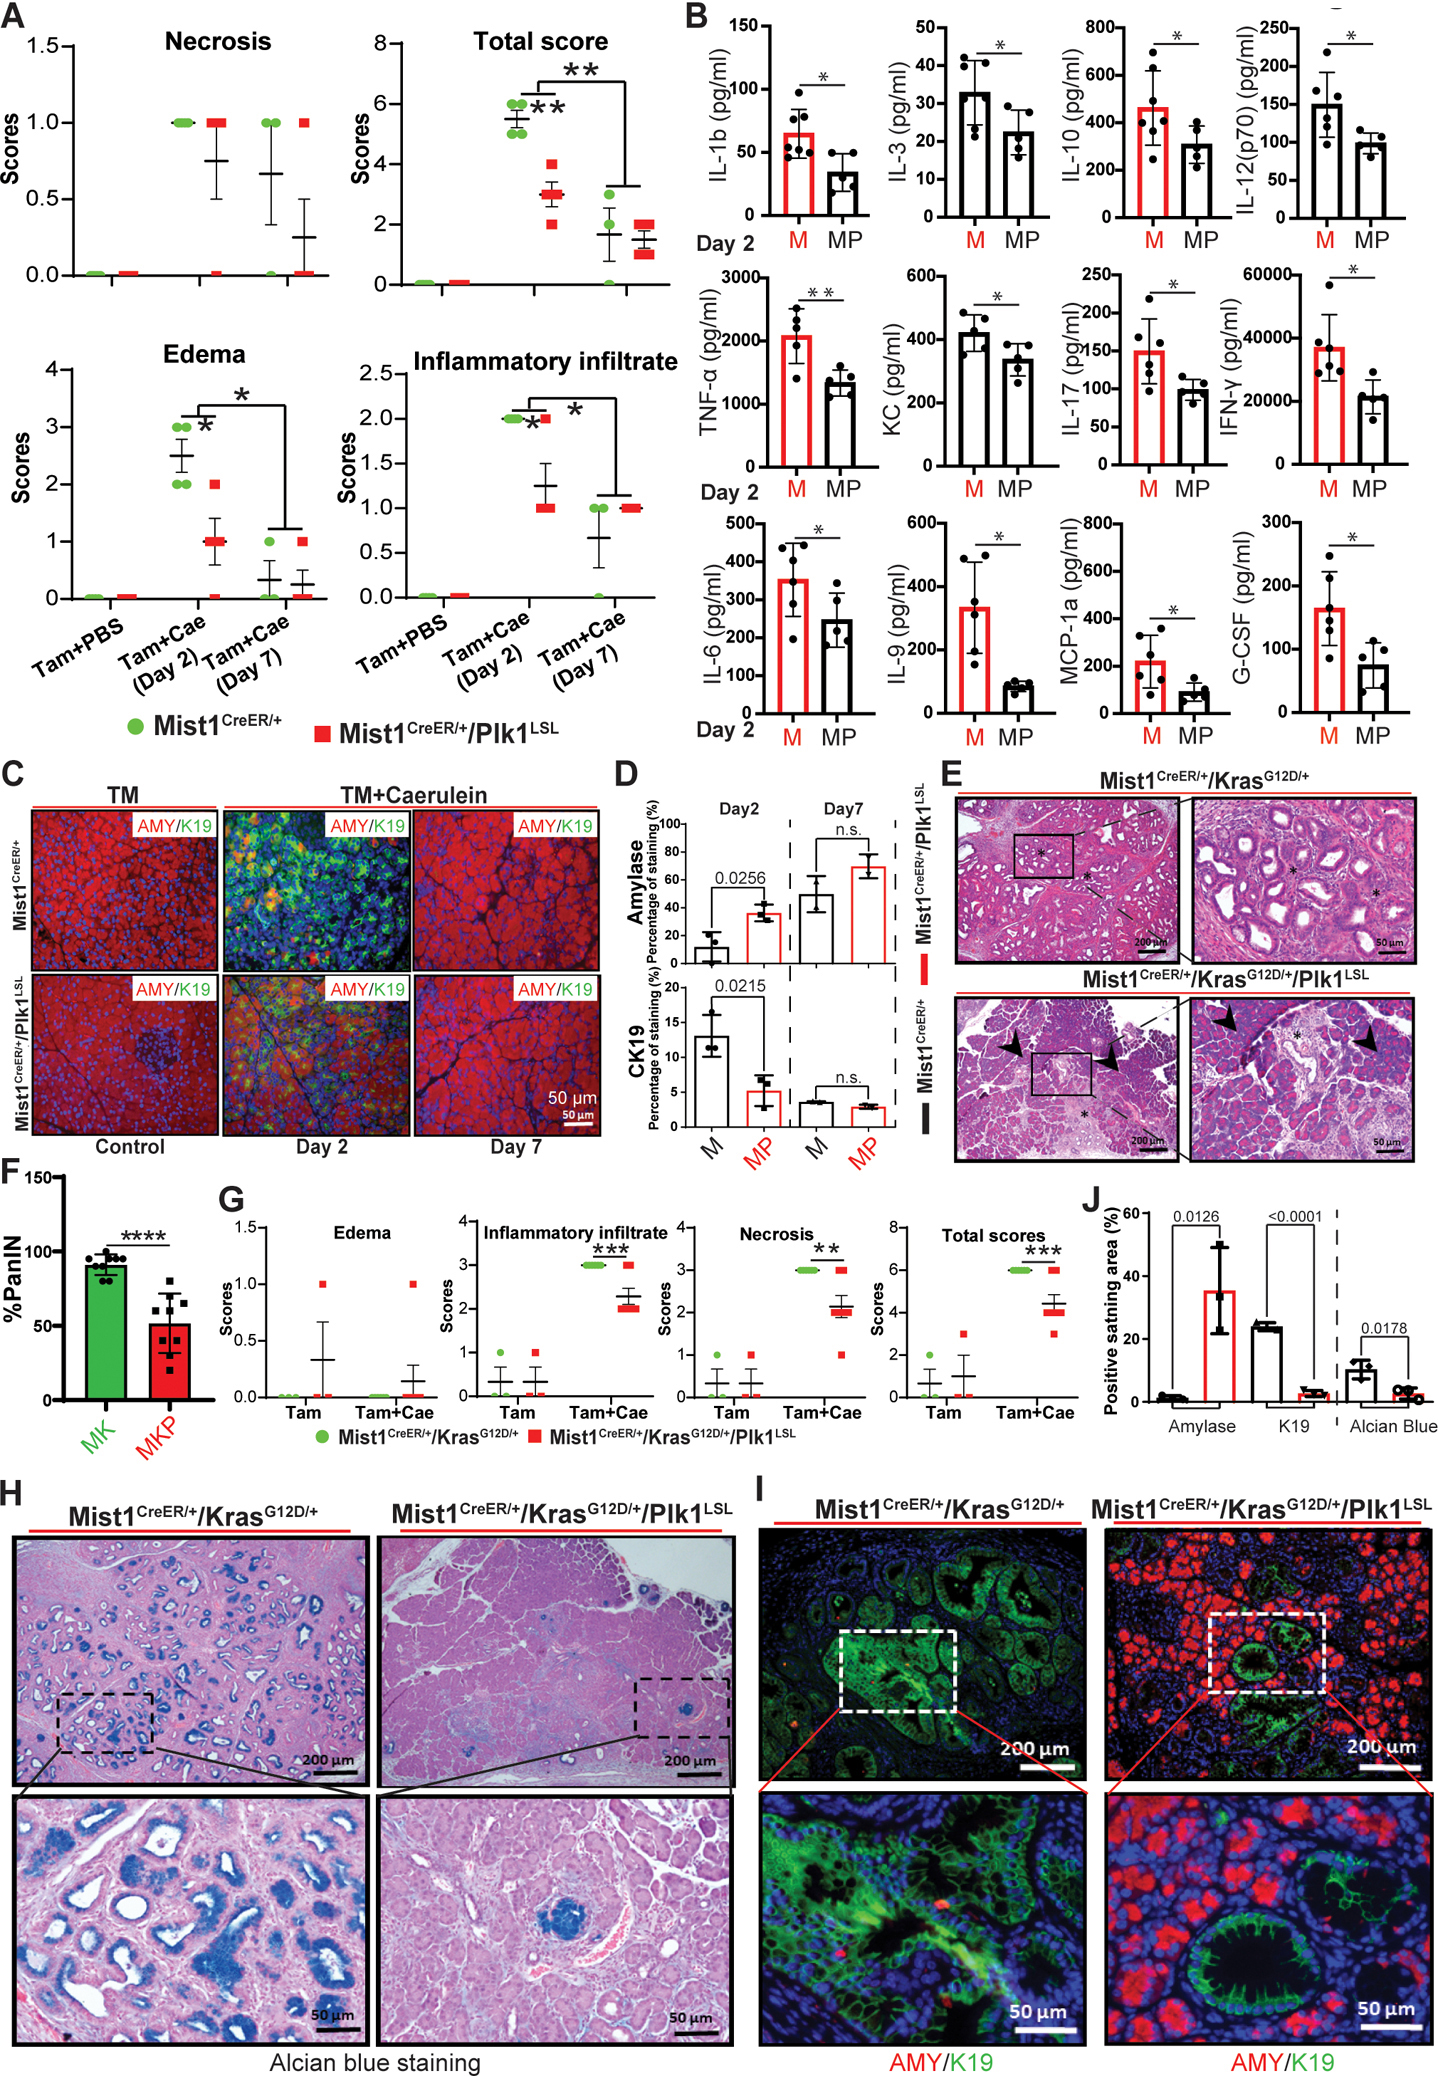
A, Quantification of H&E staining of Mist1CreER/+ pancreas samples with or without Plk1 expression in the absence of caerulein treatment or post-treatment for the indicated times. B, Detection of inflammatory cytokines and chemokines by ELISA in mice 2 days post-caerulein injection. C, IF staining with acinar cell marker amylase (AMY) and ductal cell marker K19 from pancreas samples. D, Statistical analysis of IF staining of amylase and CK19 in C. n=3. Representative images (E) and quantification (F) of PanIN lesions in mouse pancreas. G, Quantification of H&E staining of mouse pancreas samples with or without Plk1 expression 25 days post-caerulein injection. Asterisks indicate areas of PanIN lesions, whereas arrowheads highlight areas of normal acinar tissue. H, Alcian blue staining of ducts for detection of mucin (dark blue) was performed on paraffin sections prepared from the indicated pancreas samples. I, IF staining with markers of acinar cells (amylase) and ductal cells (K19) on paraffin sections prepared from Mist1CreER/+/KrasG12D/+ pancreas samples with or without Plk1 expression. J, Quantification of amylase/K19/Alcian blue-positive areas in Mist1CreER/+/KrasG12D and Mist1CreER/+/KrasG12D/+/Plk1LSL pancreata. Multiple pancreas sections were examined (means ± sem of the means). n=3. Inflammation and staining data were analyzed by unpaired Student t test. *, p<0.05, **, p<0.01, ***, p<0.001. M: Mist1CreER/+, MP: Mist1CreER/+/Plk1LSL; MK: Mist1CreER/+/KrasG12D/+, MKP: Mist1CreER/+/KrasG12D/+/Plk1LSL.
Induction of Plk1 delays progression of KrasG12D/+-driven PanINs
Since the induction of Plk1 prevents caerulein-induced pancreatitis that may lead to PanIN, we next examined whether PanIN development was also delayed. For this purpose, we generated Mist1CreER/+/KrasG12D/+ and Mist1CreER/+/KrasG12D/+/Plk1LSL mouse lines with caerulein injection to induce pancreatitis. Histologic examination showed evidence of accelerated PanIN development in Mist1CreER+/KrasG12D/+ mice 25-days-post acute pancreatitis. In contrast, Mist1CreER+/KrasG12D/+/Plk1LSL mice exhibited limited early stage PanIN lesions and were well protected from PanIN formation (Figures 2E–F). We also observed a reduction in the inflammatory infiltrate and the necrosis induced by caerulein treatment upon Plk1-overexpression in the pancreas (Figure 2G). We further characterized the impact of Plk1-induction on Kras-induced lesion formation by alcian-blue staining, which confirms areas of authentic pancreatic lesion formation. As we show, overexpression of Plk1 indeed reduced alcian-blue staining in the pancreas, indicating a reduction in lesion formation (Figures 2H and 2J). Next, the conversion of acinar cells to ductal cells was analyzed by IF staining against amylase (red) and K19 (green). In agreement, pancreata of Mist1CreER+/ KrasG12D/+/Plk1LSL mice showed little formation of K19, and they exhibited limited early-stage PanIN lesions in comparison with that in Mist1CreER+/KrasG12D/+ mice (Figures 2I and 2J), indicating that Plk1 induction significantly delayed the development of PanIN. Taken together, these data suggest that the overexpression of Plk1 delays KrasG12D/+-initiated PanIN.
Plk1 represses inflammation likely via inactivating NFκB pathway
As shown in Figure 2, the induction of Plk1 inhibited caerulein-induced inflammation in the pancreas. To further understand the underlying mechanisms, we performed RNA-seq with mouse pancreas lines described in Figures 1F and 1G. We observed that Plk1-overexpression was associated with a reduction of chemokines and interleukins and served to suppress immune cells in mice with acute pancreatitis. Further, while reductions of IL-2, IL-4, IL-7, IL-9, and IL-21 could suppress T-cell proliferation/survival, the decrease of IL-12 and IL-27 could inhibit interferon gamma production, thus inhibiting an inflammatory response. The reduction of chemokines, including CXCL9, CCL5, CCL19, CCL21, CCL22, CXCR5, CCR7, and CCR8, could affect functions of immune cells by affecting cell trafficking, cell-cell interaction, migration, and homing (Figure 3A). This reduction of chemokines and interleukins could be partially recovered when it progressed to PanIN (Figure 3B). However, how Plk1 inhibits inflammation in pancreas is still not clear. As suggested in Figure 1J, Plk1 may regulate inflammation in the pancreas through the NFκB pathway. In addition, caerulein induces AP by activating NFκB and cytokine expression (33). Thus, we performed IHC staining against phospho-NFκB in acute pancreatitis and observed a decrease in the nuclear localization of phospho-NFκB in mice with Plk1 overexpression (Figures 3C and 3D). To dissect the alteration of the NFκB pathway in PanIN, we also examined phospho-NFκB in tissues from Mist1CreER+/KrasG12D/+ and Mist1CreER+/ KrasG12D/+/Plk1LSL mouse pancreata. Similarly, we observed a reduction in the nuclear localization of phospho-NFκB in mouse pancreas upon Plk1-overexpression (Figures 3E and 3F). Furthermore, we performed immunoblotting with lysates of mouse pancreas. In agreement, we observed a reduction in phospho-NFκB at S536 and S468 upon Plk1-overexpression, suggesting that there is inactivation of the NFκB pathway in Plk1-overexpressing samples (Figure 3G). These data indicate that overexpression of Plk1 in the mouse pancreas inactivates the NFκB pathway by blocking the translocation of NFκB to the nucleus.
Figure 3. Plk1 inhibits inflammation via silencing NFκB signaling in precursor of PDAC.
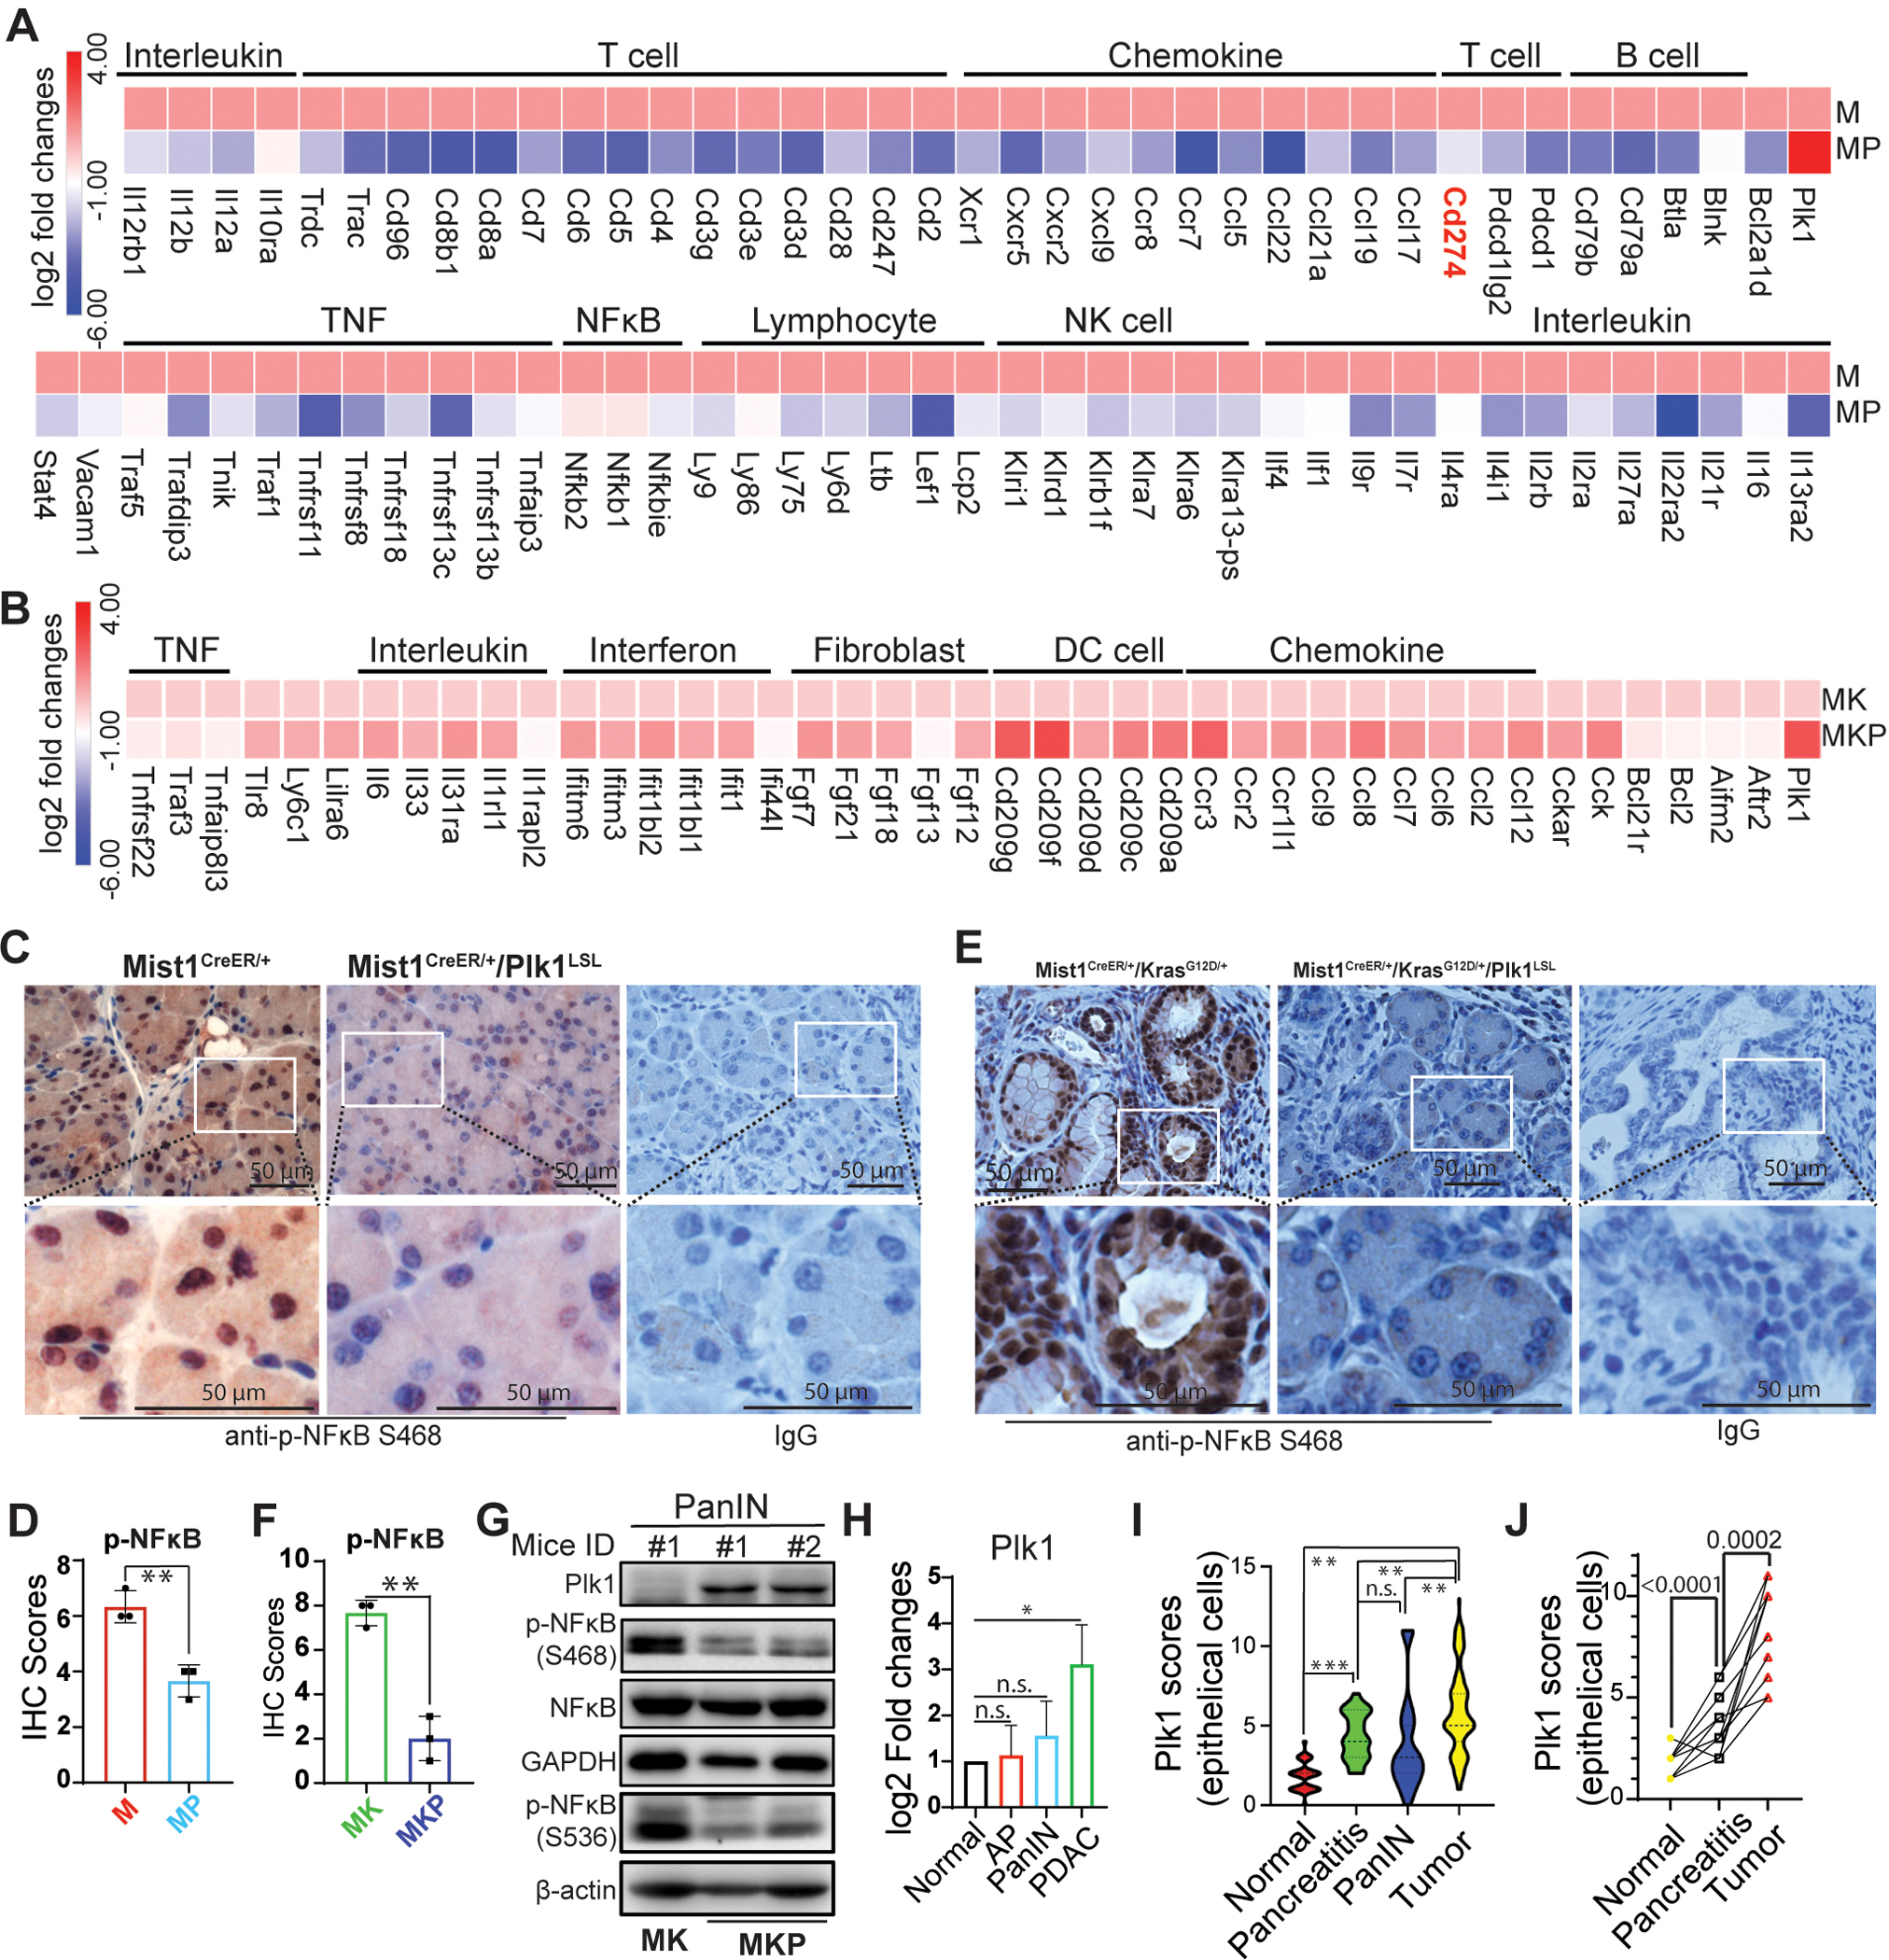
RNAseq analysis in acute pancreatitis (2 days post caerulein injection) (A) and PanIN (25 days post caerulein injection) (B). C, IHC staining against phosphor-NFκB in Mist1CreER/+ pancreas samples with or without Plk1 expression in the absence of caerulein treatment or post-treatment for 2 days. D, Quantification of IHC staining in C. E, IHC staining against phosphor-NFκB in Mist1CreER/+/KrasG12D/+ pancreas samples with or without Plk1 expression 25 days post caerulein injection. F, Quantification of IHC staining in E. G, Whole lysates of pancreas of mice with PanIN were harvested for IB. H, The endogenous levels of Plk1 in normal, acute pancreatitis (AP), PanIN, and PDAC tissues. AP: Mist1CreER+, PanIN: Mist1CreER+/KrasG12D/+, PDAC: Mist1CreER+/KrasG12D/+/p53R172H/+. I, Detection of the levels of Plk1 in various human pancreatic samples by IHC. J, Measuring dynamic changes of expression of Plk1 in the human matched normal, pancreatitis and tumors samples from the same patients (n=17). M: Mist1CreER/+, MP: Mist1CreER/+/Plk1LSL, MK: Mist1CreER/+/KrasG12D/+, MKP: Mist1CreER/+/KrasG12D/+/Plk1LSL. TM: Tamoxifen. Data was analyzed by unpaired Student t test. *, p<0.05, **, p<0.01, ***, p<0.001.
Given the suppressive effects of Plk1 in acute pancreatitis and PanIN, we next sought to investigate the dynamic changes of Plk1 during disease progression in both mouse and human tissues. As showed in Figure 3H, we observed an increase of the level of endogenous Plk1 in mouse PDAC in comparison with acute pancreatitis and PanIN. However, no significant changes of Plk1 were observed between pancreatitis and PanIN. Furthermore, we then investigated the levels of Plk1 in human patients by immunohistochemistry (IHC) and found a higher level of Plk1 in human tumors than in human pancreatitis and PanIN. Similarly, no obvious changes of Plk1 were observed between pancreatitis and PanIN in human patients, which is in accordance with the observations in mice (Figure 3I). Moreover, increased Plk1 was observed in samples derived from the same patients indicating a dynamic role of Plk1 in the human disease (Figure 3J). In summary, the collective data implies that Plk1 could prevent pancreatic inflammation and PanIN via inactivating NFκB pathway.
Plk1 negatively associates with PD-L1
Although Plk1 shows important roles in PDAC progression, the mechanisms that attribute to the failure of Plk1 inhibitors as single agents are still elusive. Dissection of this puzzle could largely benefit the clinical practice. As shown above, Plk1-induction reduced the level of IFN-γ (Figure 2B). Considering the established role of IFN-γ in inducing PD-L1 expression and the role of PD-L1 in inhibiting antitumor immunity, we hypothesize that Plk1 inhibition might induce an unexpected increase in PD-L1, thus antagonizing an antitumor immune response and the eventual failure of Plk1 inhibition. To test this hypothesis, we harvested pancreas from Mist1CreER/+ and Mist1CreER/+/Plk1LSL mice and determined the levels of PD-L1 by IB. As shown in Figure S4A, the level of PD-L1 was surprisingly reduced upon Plk1 induction.
Since an elevation of Plk1 was observed in PDAC, it is reasonable to further investigate the possibility of Plk1-targeted therapy in PDAC. However, the limited efficacy for Plk1 inhibition alone was observed in a clinical trial (NCT00710710), implying that unexpected mechanisms might exist to contribute to the poor response rates (8). To validate the association between Plk1 and PD-L1, we used murine cancer cells, derived from individual primary tumors of KPC (ElasCreER/+/KrasG12D/+/p53R172H/+) mice. As indicated, depletion of Plk1 in KPC cells increased the level of PD-L1 (Figure S4B), whereas Plk1-overexpression dramatically suppressed PD-L1 in KPC cells (Figure S4C). To further validate the association between Plk1 and PD-L1in human patients, IHC staining against Plk1 and PD-L1 was performed. As indicated, a higher level of Plk1 corresponded to a lower level of PD-L1 expression in both tumor cells and tumor infiltrating lymphocytes and monocytes (Figures S4D and S4E). Taken together, Plk1-expression was negatively associated with the level of PD-L1, implying that Plk1 might be a negative regulator of PD-L1. These findings could partially explain the failure of Plk1 inhibitors as monotherapy in PDAC.
Plk1 negatively regulates PD-L1 via inactivating the NFκB pathway
Because Plk1 negatively associates with the level of PD-L1, we then sought to explore whether and how Plk1 regulates the expression of PD-L1. First, we showed that treatments with the Plk1 inhibitors, BI6727 and GSK461364A, significantly elevated the expression level of PD-L1 with or without INF-γ administration (Figure 4A). To ask whether the elevation of PD-L1 was due to Plk1 inhibition-induced mitotic arrest, we treated cells with nocodazole and GSK461364A. More elevation of the levels of PD-L1 was observed in the group treated with GSK461364A than that in the group treated with nocodazole, suggesting that the Plk1 inhibition-induced elevation of PD-L1 is not only due to mitotic arrest (Figure S5A). In agreement, the depletion of Plk1 also elevated the expression of PD-L (Figure S5B), and the elevation of PD-L1, was likely due to increased transcription upon Plk1-depletion (Figure 4B). Further, Plk1 expression-induced inhibition of PD-L1 is kinase activity dependent, as overexpression of constitutively active Plk1-T210D mutant showed a more dramatic effect on the level of PD-L1 (Figure 4C). Because TNF-α can induce PD-L1 expression via the NFκB pathway and because Plk1 was associated with inactivation of the TNF pathway and the NFκB pathway in mice and human pancreatic cancers (Table S3), we hypothesized that Plk1 regulates PD-L1 via the NFκB pathway. To this end, we investigated the possible activation of the NFκB pathway by inhibiting the activity of Plk1. As indicated, inhibition of Plk1 dramatically increased the NFκB phosphorylation on Ser468 but not Ser536 (Figures 4D and S5C). It has been documented that the translocation of NFκB from the cytoplasm to the nucleus activates its transcription factor activity. Accordingly, we performed IF to examine the translocation of NFκB upon Plk1 overexpression. As indicated in Figure 4E, expression of the kinase-defective Plk1-K82M mutant also resulted in more nuclear localization of NFκB than that in cells expressing wild type (WT) and the constitutively active Plk1-T210D mutant form.
Figure 4. Plk1 inhibition-induced upregulation of PD-L1 is NFκB dependent.
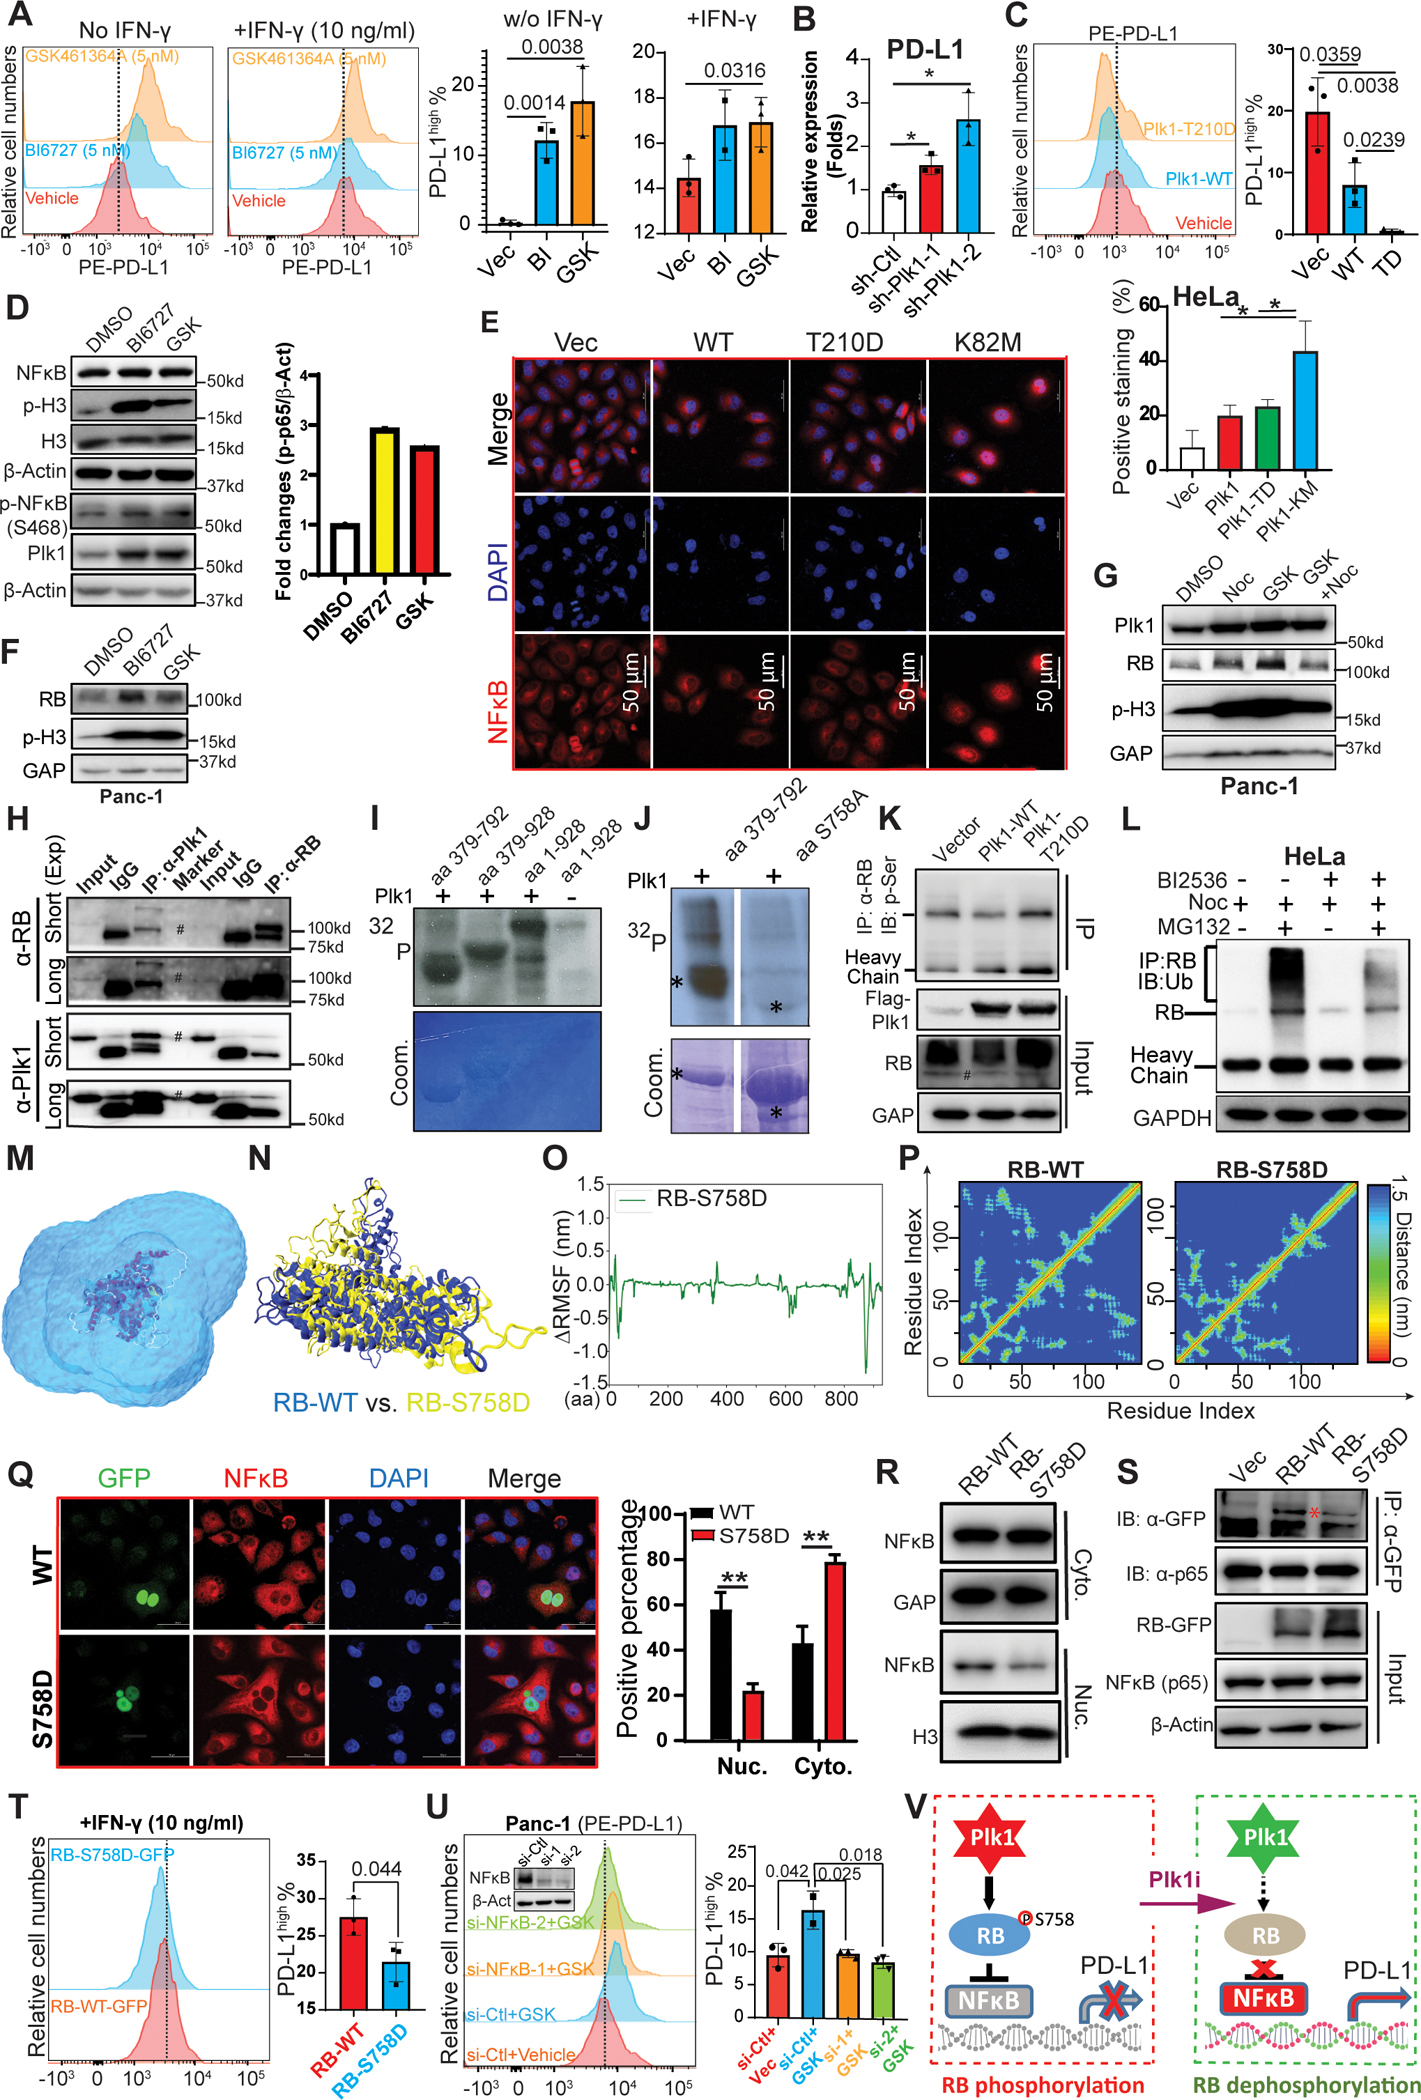
A, Panc-1 cells were pre-treated with inhibitors of Plk1, BI6727 (BI: 5 nM) and GSK461634A (GSK: 5 nM), for 8 hours, incubated with IFN-γ and Plk1 inhibitors overnight, and were harvested for flow cytometry assay. B, Transcriptions of Plk1 and PD-L1 were measured by Q-PCR in Panc-1 cells upon Plk1 depletion. n=3. C, Cells were transfected with Plk1-WT or -T210D mutant, followed by flow cytometry assay. D, Panc-1 cells were treated with BI6727 (50 nM) or GSK461634A (GSK: 50 nM) overnight, and harvested for IB. E, IF staining against NFκB in HeLa cells overexpressing different forms of Plk1 (WT, constitutively active T210D mutant, kinase-defective K82M mutant). n=3. F & G, Panc-1 cells were treated with Plk1 inhibitors in the absence or presence of nocodazole and were harvested for IB against RB. H, Detection of the interaction of Plk1 and RB in Panc-1 cells were analyzed by reciprocal IP. I, Plk1 targets middle domain of RB. Purified Plk1 was incubated with purified GST-RB regions (aa1–928, aa379–792, aa379–928) in the presence of [γ−32P] ATP. The reaction mixtures were resolved by SDS-PAGE, stained with Coomassie brilliant blue (Coom.) and detected by autoradiography. J, Plk1 was incubated with recombinant RB-aa379–792 (WT or S758A) as in I. K, HEK293T cells were transfected with Plk1 (WT or T210D mutant) and were harvested for IP with anti-RB, followed by IB against p-Ser. L, HeLa cells were synchronized with nocodazole (30 ng/ml), then incubated with 50 nM BI2536 and 8 μg/ml MG132 for 18 hours. Cells were harvested for IP with anti-RB, followed by IB against ubiquitin. M, The snapshot of a simulation system containing wild-type RB in an explicit solvent. The RB protein: New-Cartoon model, colored based on the secondary structure. The water molecules, Na+ and Cl− ions are shown in the QuickSurf model, colored by ColorID: blue2. N, The snapshot of the final conformations of RB-S758D (yellow) and RB-WT (blue). O, ΔRMSF of Cα atoms on the RB-S758D protein. The value of ΔRMSFi is calculated as RMSFi (mutant) – RMSFi (wild type), where i refers to the Cα atom on amino acid residue i. A RMSF value >0 means the mutant is more flexible compared with wild type RB. A RMSF value <0 indicates the mutant is more rigid than the wild type RB protein. P, Mean smallest distance between Cα atoms of amino acid residues on RB-C domain for RB-WT and RB-S758D. Q, HeLa cells were transfected with GFP-RB (WT or S758D), and subjected to IF staining with antibodies against GFP and NFκB, followed by quantification. n=3. R, Detection of subcellular localization of NFκB by IB in Panc-1 cells transfected with different forms of RB (WT or S758D). S, Detection of interactions between NFκB (p65) and RB mutants in HEK293T cells. T, Detection of PD-L1 level by flow cytometry in Panc-1 cells transfected with different forms of RB (WT or S758D) upon IFN-γ treatment. U, Panc-1 cells were depleted of NFκB, treated with 5 nM GSK461364 overnight, and harvested for flow cytometry to measure the level of PD-L1, followed by quantification. V, A model depicting RB-S758 phosphorylation-mediated regulation of NFκB activity and PD-L1 expression. Q-PCR, IF staining and flow cytometry data were analyzed by unpaired Student t test. *, p<0.05, **, p<0.01, ***, p<0.001.
It has been reported that phosphorylation of RB inhibits NFκB activation by inferring translocation of NFκB from the cytoplasm to the nucleus (21). To examine whether the translocation of NFκB upon Plk1 depletion is RB-dependent, we performed IB and found that RB was elevated upon Plk1 inhibition (Figure 4F). To rule out whether the elevation of RB is due to mitotic arrest, we treated cells with nocodazole ± GSK461364A. In agreement, inhibition of Plk1 resulted in the elevation of RB beyond a level observed in cells treated with nocodazole, which only slightly resulted in an increase in RB (Figure 4G). Moreover, Plk1 and RB can be co-immunoprecipitated with each other (Figure 4H), suggesting that RB is an interacting partner of Plk1. We then tested whether Plk1 directly phosphorylates RB with in vitro kinase assays and showed that a recombinant GST-fusion RB fragment containing amino acids (aa) 379 to 792 was a robust Plk1 substrate (Figure 4I). To map the phosphorylation site(s), we mutated every single serine/threonine within the region to alanine and eventually identified S758 as a Plk1 phosphorylation site (Figure 4J). We also observed an increase in the phospho-serine level of RB upon transfection of constitutively activate Plk1-T210D (Figure 4K). Furthermore, nocodazole treatment significantly increased ubiquitination of RB, which can be attenuated by BI2536 co-treatment, suggesting that Plk1 phosphorylation of RB induces degradation of RB (Figure 4L and S5D).
To further investigate the function of the Plk1 phosphorylation of RB, we predicted the initial structures of wild-type RB (RB-WT) and the RB-S758D mutant based upon the sequences published on UniProt (P06400) using AlphaFold2(27). We also investigated the structure and flexibility of the RB-WT and the RB-S758D mutant in explicit aqueous solution using molecular dynamics (MD) simulations (Figure 4M). The final configurations of the MD simulations showed that the RB-S758D (yellow) mutant presents a conformation different from the RB-WT (blue) (Figure 4N). In addition, the positive value of the root mean square deviation (RMSD) for Cα atoms also showed that the conformation of RB-S758D should differ from that of the RB-WT protein. The difference in conformation implies a distinct function between RB-WT and RB-S758D mutant forms (Figure S6A). Next, we characterized the flexibility of RB-WT and RB-S758D proteins using the root mean square fluctuation (RMSF) and ΔRMSF of their Cα atoms. As illustrated in Figures S6B and 4O, the flexibility of RB-S758D presents the largest change around RES874–879 (ΔRMSF < −1.0 nm) on the RB-C domain, and RES822–826 presents a positive ΔRMSF value (>0.2 nm) on the same domain. Such variation in this observed flexibility may impact the functions of the RB-S758D protein compared with the RB-WT protein. Furthermore, residues on the RB-N domain also present a variation in flexibility upon the mutation: RES28–43 presents ΔRMSF <−0.4 nm and RES20–24 shows ΔRMSF >0.2 nm. It is reported that the RB-N domain interacts with NFκB, which can be enhanced by its phosphorylation (21). Thus, the changes of residue flexibility on the RB-N and RB-C domain may impact the binding affinity of the RB protein.
We then investigated the mutation-induced changes of secondary and tertiary structures of the RB protein. The secondary structure vs. time plots do not show significant differences (Figure S6C) between RB-WT and RB-S758D. However, the mutation induces a change in the tertiary structure. We calculated the residue-residue contact map for RB-N, RB-P, and RB-C domains. The contact map of RB-C domain shows the loss of some close residue-residue contact within the domain. (Figure 4P). RB-N domain also presents some changes in the residue-residue contact map but not as significant as the RB-C domain (Figures S6D and 6E). These collective data render the plausibility that the S758D mutation induces protein structure changes, leading to distinct functions and downstream consequences.
Considering that the phosphorylation of RB inhibits the translocation of NFκB from the cytoplasm to the nucleus (21), we hypothesized that Plk1 phosphorylation induces a structure change in RB that might cause dysregulation of NFκB translocation. To ask how the Plk1 phosphorylation of RB regulates the NFκB pathway, we showed that the RB-S758D mutant repressed translocation of NFκB to the nucleus in comparison with wild typ-RB (Figures 4Q and 4R). To elucidate the molecular mechanisms by which RB regulates NFκB function, we examined whether RB interacts with NFκB. Co-IP demonstrated that endogenous NFκB interacted with exogenous RB-GFP, and the interaction was weakened by RB phosphorylation at S758 (Figure 4S). These findings validate the prediction for the distinct function of a S758D mutation induced-protein structure change using ΔRMSF of their Cα atoms. Consequently, we observed that cells expressing the RB-S758D mutant showed less PD-L1 expression than those expressing wild-type RB (Figure 4T). To further determine whether Plk1-mediated regulation of PD-L1 is NFκB-dependent, we treated NFκB-depleted cells with GSK461364A and observed that a Plk1 inhibition-induced elevation of PD-L1 was rescued by depletion of NFκB (Figure 4U). Taken together, we concluded that depletion/inhibition of Plk1 increases the level of PD-L1 via promoting nuclear translocation of NFκB in an RB-dependent manner (Figure 4V).
Inhibition of Plk1 re-establishes the response to immune checkpoint blockade
Given that PDAC is an immunological “cold” cancer, it is not surprising to observe the limited efficacy of immune checkpoint inhibitors in this disease. Although elevation of Plk1 in PDAC implies administration of Plk1 inhibitors to treat PDAC, there has been limited efficacy for Plk1 inhibition alone, probably due to the undesirable elevation of PD-L1. However, the rather unexpected elevation of PD-L1 upon Plk1 inhibition provides the rationale to treat PDAC through combination of Plk1 inhibition and α-PD-L1. To explore this opportunity, we tested the efficacy of α-PD-L1 blockade plus inhibition of Plk1 in mouse models. To recapitulate the intra-pancreatic immune response to PDAC, we constructed a pancreatic orthotopic allograft model by injecting KPC cells into wild-type mouse pancreas with intact immune functions, followed by treatments with anti-PD-L1 and BI2536. As indicated, monotherapies of anti-PD-L1 and BI2536 showed minimal effects on tumor suppression, but the effects of combination treatment were significant. Combination treatment synergistically reduced tumor volume and tumor weight (Figures 5A and 5B). IF staining indicated a reduction in cell proliferation and a proclivity for apoptosis (Figures 5C and S7A). A significant prolongation in overall survival was observed in mice treated with the combination of BI2536 and anti-PD-L1 as compared with mice receiving isotype control or single treatments (Figure 5D). Long-term exposure to this treatment regimen did not alter the body weight of these animals, indicating its tolerability during a sustained period of administration (Figure S7B).
Figure 5. Depletion of Plk1 re-sensitizes immune response in PDAC.
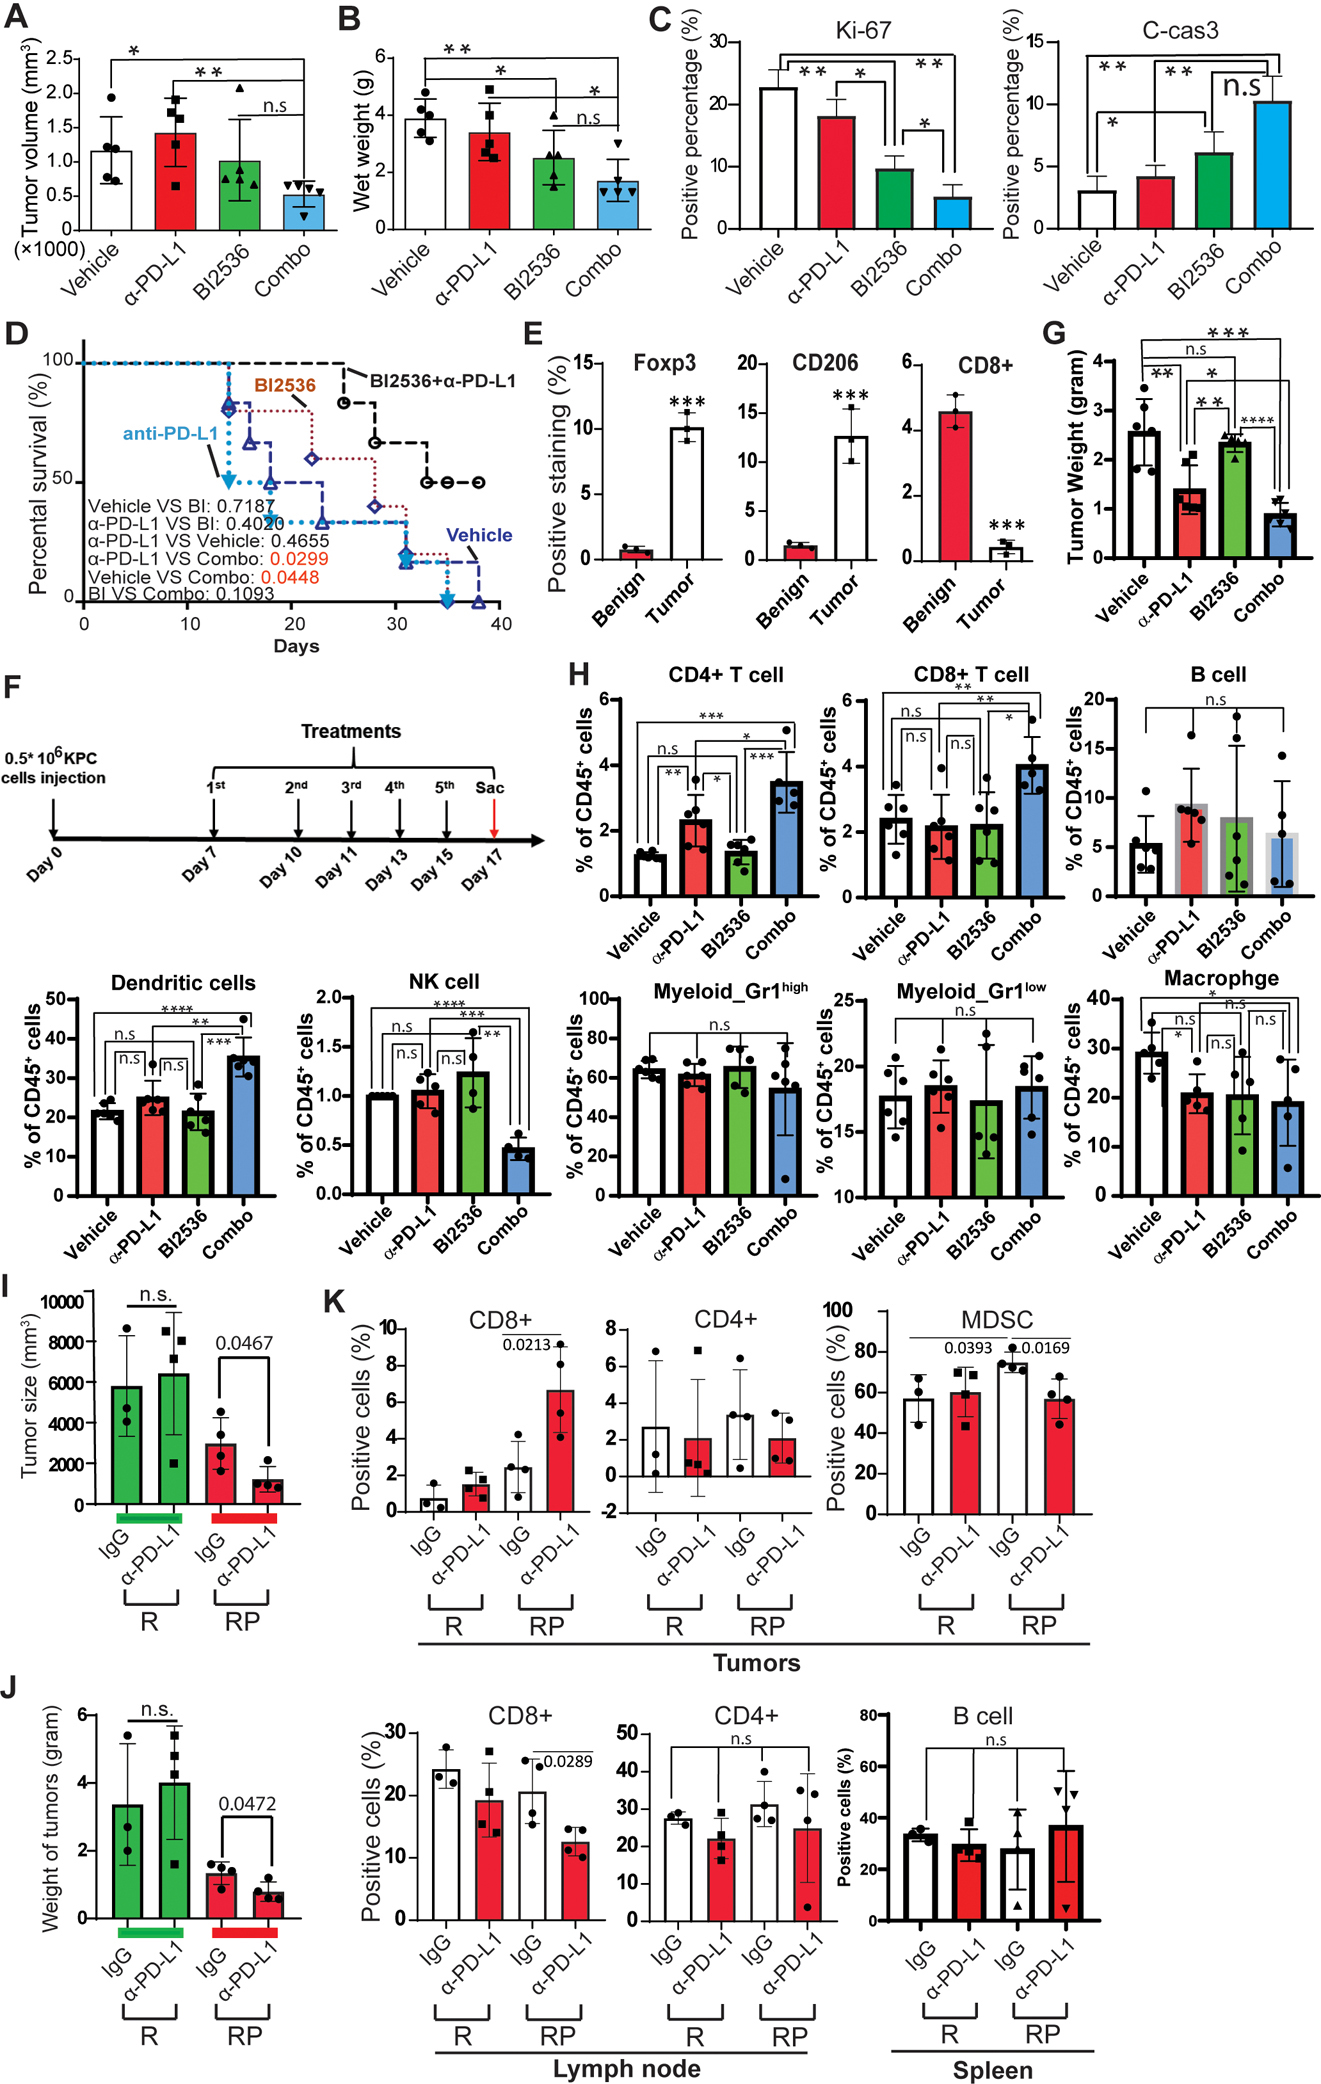
A-D, KPC cells were orthotopically injected into wild type mouse pancreas, followed by treatment with BI2536 and α-PD-L1 antibody. Volume (A) and wet weight (B) of KPC tumors from selected treatment groups. C, Statistical analysis of IF staining of Ki-67 and cleaved caspase 3 with unpaired Student t test. n=3. D, Kaplan-Meier survival analysis of KPC mice treated with vehicle or BI2536 ± anti-PD-L1. Wilcoxon test was performed to analyze mice survival with different treatments. E, Quantification of IF staining against CD206, Foxp3 and CD8 in human patient samples. F, Time course of treatments with BI2536 and/or α-PD-L1 antibodies. After wild type mice were injected orthotopically with 5×10⁵ KPC cells, mice were treated with BI2536 (200 μg/mouse) and α-PD-L1 (250 μg/mouse) 7 days post KPC cell injection. G, Tumor weight at the end of the experiment. H, Flow cytometry was performed to analyze infiltration of immune cells in tumors after the indicated treatments. I-K, Rosa26CreERt2/Plk1f/+ mice were treated with 1.5 mg/per 20g body weight tamoxifen for 3 consecutive days, then with 200 μg/mouse α-PD-L1 every other day for 3 weeks. I, Tumor size. J, Tumor weight. K, Statistic analysis of flow cytometry analysis of CD8+ and CD4+ cells in lymph nodes (left), tumors (middle) and MDSCs in tumors (right). R: Rosa26CreERt2, RP: Rosa26CreERt2/Plk1f/+. IF staining, tumor mass and flow cytometry data were analyzed by unpaired Student t test. *, p<0.05, **, p<0.01, ***, p<0.001, ****, p<0.0001
Depletion of Plk1 re-sensitizes PDAC to immune checkpoint blockade through reactivating the anti-tumor immunity
Next, we sought to dissect how Plk1 inhibition re-sensitizes PDAC to anti-PD-L1 treatment. One of the roles of PD-L1 in cancer is to prevent cancer cells from immune attack. Because the immunosuppressive TME in PDAC contributes to the limitation of immune checkpoint blockade, one approach to treat PDAC is to reverse this pro-tumorigenic microenvironment. We firstly evaluated various immune cell markers in patient samples by IF to examine the properties of the TME. In tumors, we observed fewer toxic T-cells but more immunosuppressive cells, such as Foxp3+ and CD206+ cells, infiltrated in the tumors, indicating immunosuppression in these tumors (Figures 5E and S8A).
Because Plk1 is associated with an immunosuppressive TME in human PDAC, the re-establishment of the efficacy of anti-PD-L1 by administration of Plk1i in PDAC supports the possibility that Plk1-inhibition may alter the immunosuppressive TME in PDAC. To test this concept, we injected KPC cells into wild-type mice orthotopically, followed by treatment with BI2536 and anti-PD-L1 (Figure 5F). As observed, monotherapy with anti-PD-L1 inhibited tumor growth. However, the tumor-suppressive effect was more significant upon combination treatment, whereas a single treatment with BI2536 showed no dramatic effect on tumorigenicity (Figure 5G). To further dissect the role of Plk1 on the TME, we analyzed the immune infiltrates in PDAC. As shown in Figure 5H and S8B, we analyzed the infiltrations of immune cells in tumors, including DCs, B cells, MDSC, macrophages, CD4+ T cells, CD8+ T cells, and NK cells. As demonstrated, monotherapy with anti-PD-L1 increased CD4+ cells but decreased macrophages in orthotopic tumors and no changes of infiltrations of any immune cells were observed in tumors treated with BI2536 alone. However, combination treatment increased the populations of CD4+ cells, CD8+ cells, and DCs, and decreased NK cells and macrophages but not B cells and MDSCs in the tumors. These collective data indicate combinational treatment of anti-PD-L1 and BI2536 suppresses tumorigenicity through enhancing an anti-tumor immune response by increasing immune infiltrates.
To further validate the effects of Plk1-inhibition on the TME, we created Rosa26CreERt2/Plk1f/+ mice, in which Plk1 was depleted upon tamoxifen injection (Figure S8C). These Plk1-depleted mice were injected with KPC cells, followed by anti-PD-L1 treatment. As indicated in Figures 5I–K and S8D, a PD-L1 antibody alone was not enough to inhibit tumor growth in wild-type mice but did suppress KPC tumor formation in Plk1-depleted mice. Of note, tumors implanted in Rosa26CreERt2/Plk1f/+ mice appeared smaller than those in wild-type mice indicating that the level of Plk1 in the TME affects tumor growth as well. Next, we sought to examine the effects of Plk1 on immune cell infiltration. As illustrated in Figures 5K and S8E, α-PD-L1 alone in wild-type mice did not affect toxic T cells or MDSCs in tumors. However, upon Plk1 depletion, anti-PD-L1 increased CD8+ cells but decreased MDSCs in tumors, eventually reactivating the immune response in the tumor. Moreover, anti-PD-L1 alone showed no effect on CD8+ and CD4+ cell counts in lymph nodes and B cells in spleen of wild-type mice, but it induced a reduction in CD8+ cell counts in peripheral lymph nodes of Plk1-depleted mice (Figure 5K).
Plk1 is known to control mitotic progression and chromosomal stability (34–37). An alternative explanation for the enhanced immunotherapy response is that Plk1 antagonism might expose cryptic antigens via induced chromosomal instability that leads to enhanced checkpoint blockade by targeting PD-L1. To exclude this possible explanation for the observed antineoplastic actions, we investigated chromosomal instability upon Plk1-inhibition in pancreatic cancer cells. No obvious changes for γ-H2AX upon Plk1-inhibition by administrating BI6727 and GSK461364A were observed, indicating there is no DNA damage upon Plk1 inhibition in the pancreatic cancer cells (Figure S9). In summary, the depletion of Plk1 re-establishes the antitumor responses by altering the immunosuppressive TME.
Plk1 and PD-L1 are associated with poor prognosis in human PDAC
Based on the finding that Plk1 regulates expression of PD-L1 through the NFκB pathway, we hypothesized that Plk1 and PD-L1 may play a role in the clinical outcome of PDAC patients. To test this possibility, we explored the correlations between the levels of Plk1 and PD-L1 and the survivability in PDAC patients. As demonstrated, we observed a higher level of Plk1 associated with a shorter overall survival in the TCGA data (Figure 6A, upper). In addition, patients with a higher level of PD-L1 expression were associated with a dramatically shorter overall survival as well (Figure 6A, lower). To further investigate the effects of the identified negative correlation between Plk1 and PD-L1 on the clinical outcomes of PDAC patients, we grouped tumors into those with low and high PD-L1 expression, and then investigated the relationship between the level of Plk1 and patient survival. As illustrated in Figure 6B, a higher level of Plk1 was associated with a shorter overall survival than those with a lower level of Plk1 in patients, regardless of the level of PD-L1. Similarly, we also grouped tumors into those with low and high Plk1 expression and then investigated the relationship between the levels of PD-L1 and patient survival. Interestingly (Figure 6A), a high level of PD-L1 was associated with a shorter overall survival than those with a low level of PD-L1 only in patients with a higher level of Plk1. No significant changes in overall survival were observed in those with lower Plk1 expression (Figure 6C). These collective data suggest that high levels of Plk1 and PD-L1 are associated with a poorer prognosis in PDAC, and the level of PD-L1 does not affect the association between the level of Plk1 and overall survival. However, even though the level of PD-L1 is associated with the overall survival, only patients with a higher level of Plk1 can be distinguished by PD-L1 expression.
Figure 6. Plk1 and PD-L1 association with poor prognosis in human PDAC is immune cell filtration determined.
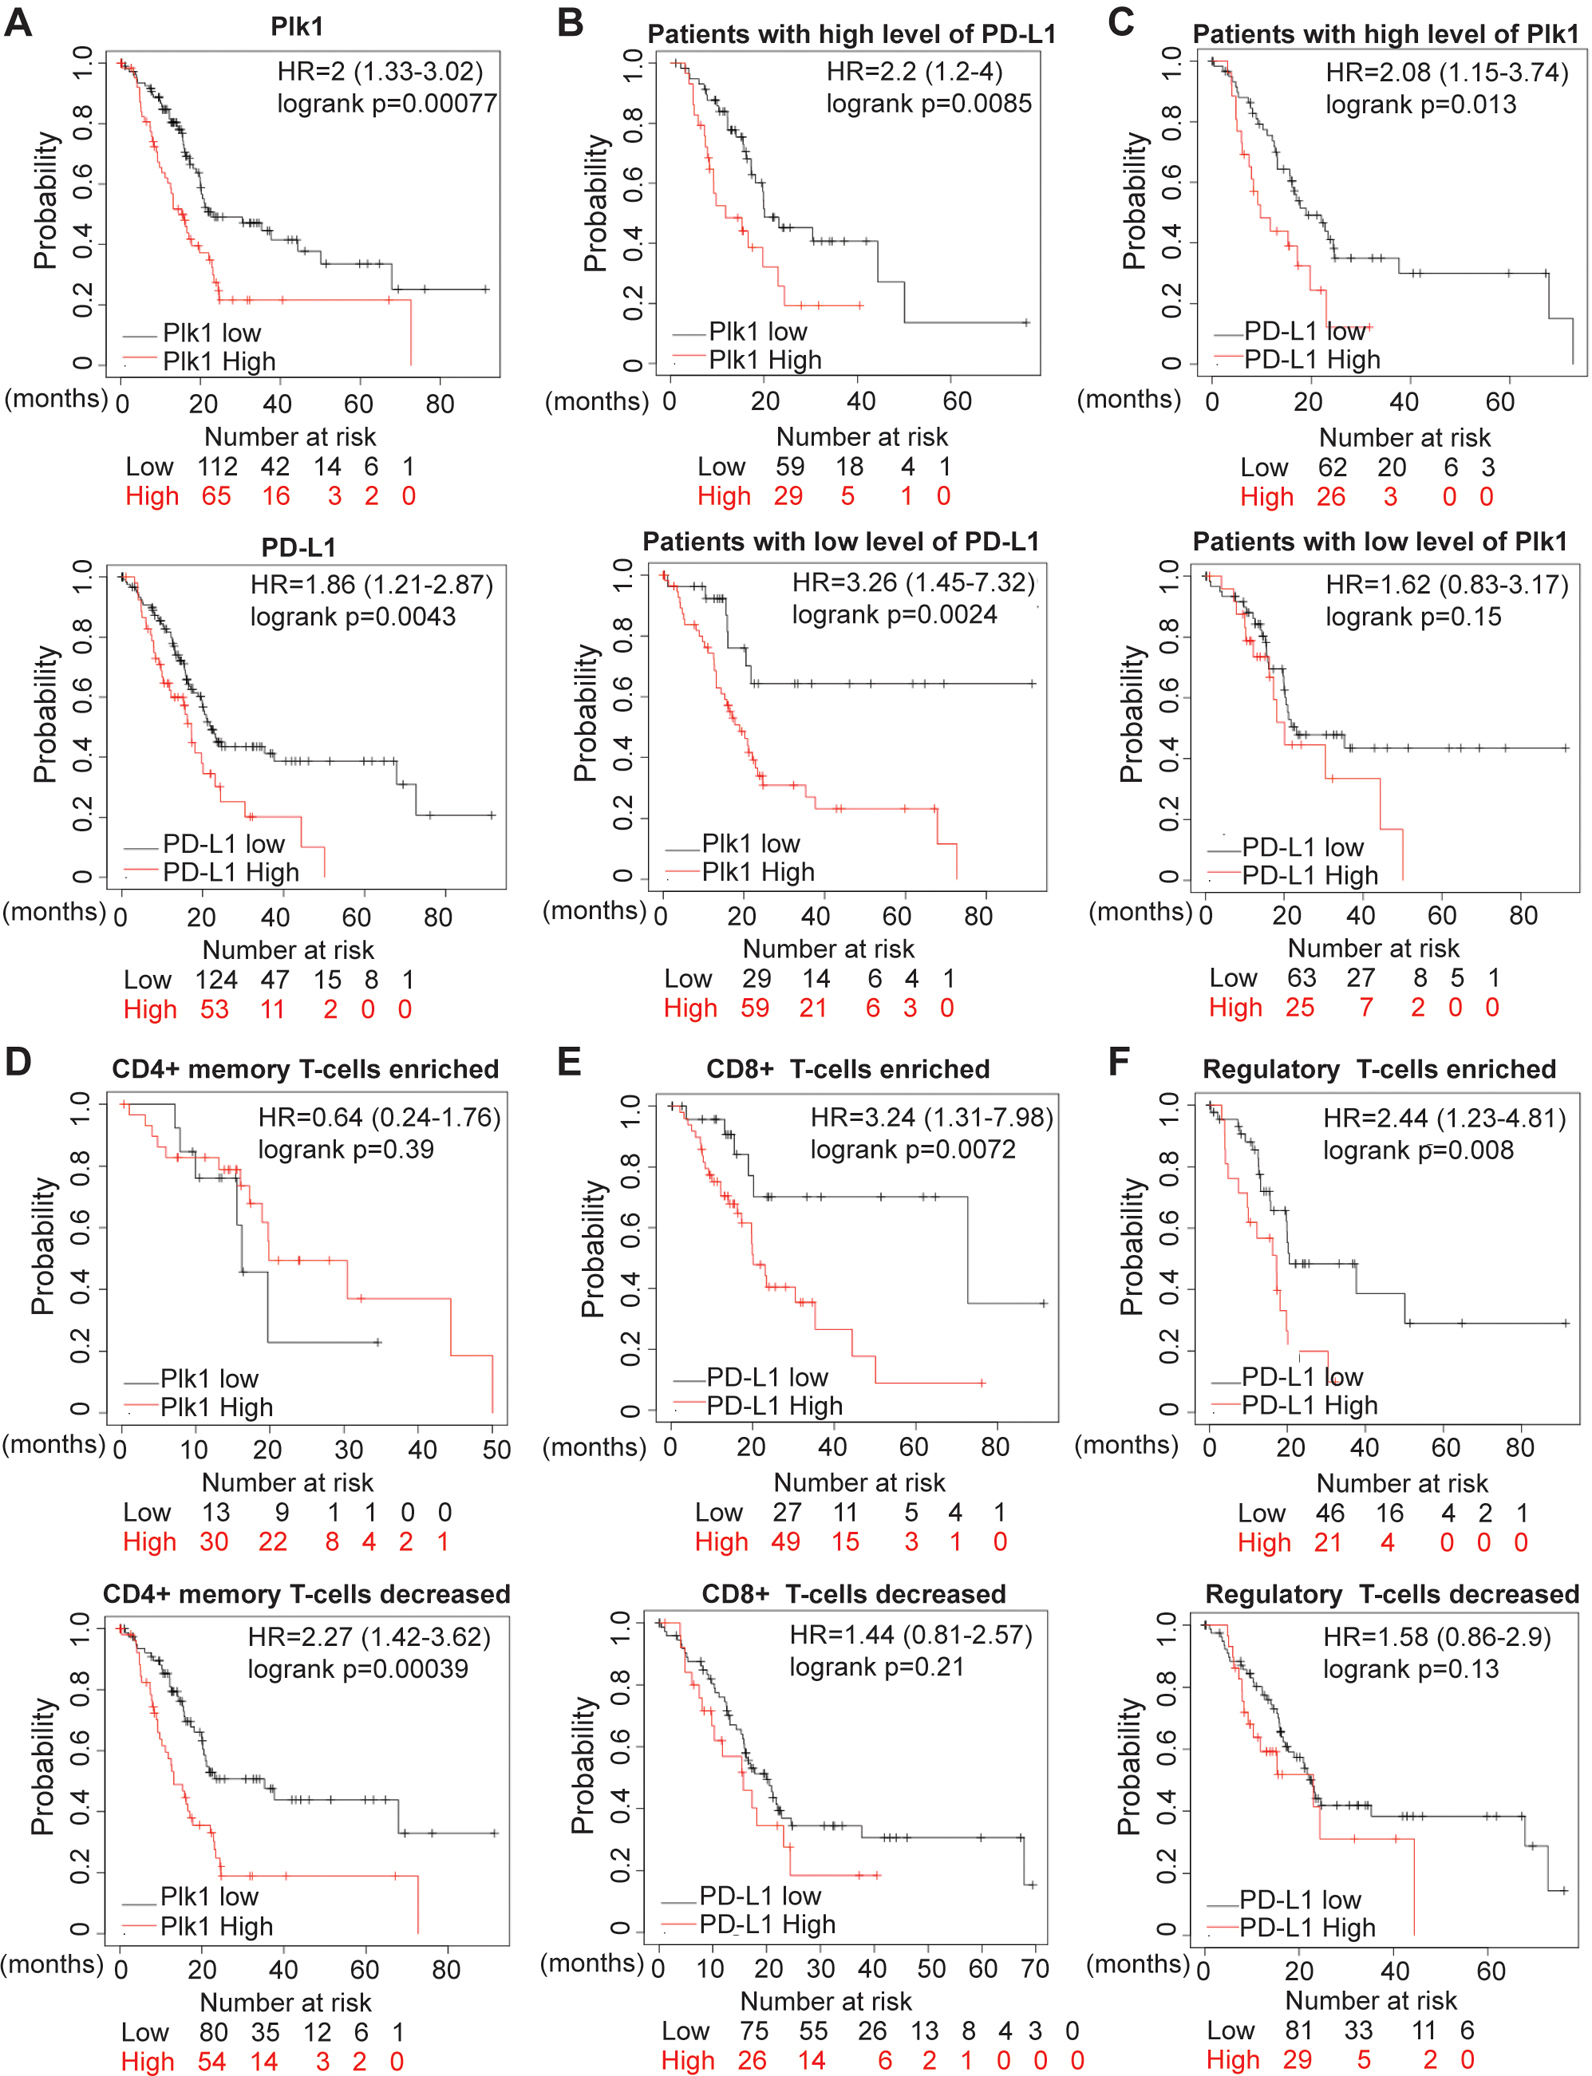
A, Survival analysis of pancreatic cancer patients with Plk1 and PD-L1 expressions in patients from TCGA. B, Survival analysis of patients with low and higher Plk1 expression in patients grouped by expression levels of PD-L1. C, Survival analysis of patients with low and higher PD-L1 expression in patients grouped by expression levels of Plk1. D, Survival analysis of patients with low and higher Plk1 expression in patients grouped by enrichment of CD4+ T-cells. E, Survival analysis of patients with low and higher PD-L1 expression in patients grouped by enrichment of CD8+ T-cells. F, Survival analysis of patients with low and higher PD-L1 expression in patients grouped by enrichment of Tregs.
As shown in Figure 5, a combination of a Plk1-inhibitor and anti-PD-L1 reactivated an anti-tumor immune response by regulating T-cells. To explore the correlations of Plk1 and PD-L1 with clinical outcomes in the context of different immune infiltrates, we grouped patients based on enrichments of CD4+, CD8+, and regulatory T-cells, respectively. As illustrated in Figure 6D, in patients with decreased CD4+ memory T-cells, a higher level of Plk1 was associated with a shorter overall survival than those with a lower level of Plk1. However, no significant changes were observed in those enriched with CD4+ memory T-cells. In addition, a higher level of PD-L1 was associated with a shorter overall survival than those with a lower level of PD-L1 in patients with enriched CD8+ T-cells but not in those with decreased CD8+ T-cells (Figure 6E). Similarly, a higher level of PD-L1 was associated with a shorter overall survival than those with a lower level of PD-L1 in patients with enriched regulatory T-cells (Tregs) but not in those with decreased Tregs (Figure 6F).
To validate our findings in Figure 6, we analyzed the data cohorts from ICGC database. In agreement with our findings in Figures 6A–C, we found that high levels of Plk1 and PD-L1 were associated with a shorter overall survival (Figures S10A–C). To further investigate the roles of Plk1 and PD-L1 in the clinical outcomes of patients with different immune cell infiltrations, we grouped patients based on the infiltration status of different immune cell subtypes. In accordance with our findings in Figures 6D–F, we observed that a higher level of Plk1 was associated with a shorter overall survival than those with a lower level of Plk1 in patients with decreased CD4+ memory T-cells. However, no significant changes were observed in those with enriched CD4+ memory T-cells (Figures S10D). No significant changes were observed in patients with either enriched or decreased CD8+ T cells (Figures S10E). Similarly, a higher level of PD-L1 was associated with a shorter overall survival than those with a lower level of PD-L1 in patients with enriched regulatory T cells (Tregs) but not in those with decreased Tregs (Figure S10F). These collective data suggest that the levels of Plk1 and PD-L1, associated with outcomes of PDAC patients, can be used to distinguish patients under differential T cell infiltration.
Discussion
As described in a phase Ⅱ study, Plk1 inhibition via a single agent has failed to induce tumor regression in advanced pancreatic cancer patients (NCT00710710) (8). Thus, it is of high clinical relevance to dissect the underlying mechanisms and to develop novel approaches to reverse the limited efficacy of Plk1 inhibitors in PDAC. Our data in murine PDAC models support the clinical observations, as we found disease stabilization rather than PDAC regression in KPC mice (Figure 5). Due to the fact that anti-PD-L1 antibodies seem to be effective with only certain cancer types, combination therapy trials are being actively pursued in a variety of clinical settings. The data presented here suggest that combination therapies with inhibition of Plk1 and α-PD-L1 may achieve durable tumor regression in PDAC. Herein, we show that the pharmacologic or genetic targeting of Plk1 augmented tumor immunity, and thereby potentiated the efficacy of immunotherapy in PDAC.
In this study, we focus on the role of Plk1 signaling in malignant cells and its role as a driver of the inflammatory TME that alters immune surveillance and limits immunotherapy. Plk1 represents a new negative regulator of the pathway that induces IFN (38), which is well known for its role in T cell proliferation, antigen sensitivity, cytokine production, and migration in these contexts (39). The effect of pharmacologic inhibition of Plk1 on the function of T cells in PDAC is likely important to the clinical application of inhibition of Plk1 and immunotherapeutic combinations (Figure 5).
The next frontier of immune checkpoint therapy is improvement of the efficacy of checkpoint inhibitors, such as antibodies against PD-1 and PD-L1, through combination approaches, especially in cancers that have shown little benefit, such as PDAC. As Plk1 plays an important role in cell-cycle progression in normal proliferating tissues, it is not surprising that Plk1 is overexpressed in numerous cancer types (40). However, the role of Plk1 in driving the suppressive tumor microenvironment is not well understood. We found that inhibition of Plk1 altered the production of pro-inflammatory cytokines and blunted to the avoidance of immune surveillance. Together, these findings indicate that Plk1 is a driver of immune escape in PDAC; and, thus, it is a target for combination with immunotherapy.
The response to immune checkpoint therapy in patients is expected to be highly correlated with PD-L1 expression in tumor cells (41). Our study showed a negative association between Plk1 and PD-L1 in mouse and human PDAC (Figure S4) and identifies a previously uncharacterized role of S758-phosphorylated RB in suppressing NFκB activity and PD-L1 transcription (Figure 4). In agreement with the essential role of RB in repressing PD-L1 expression, we demonstrated that inhibition of S758 phosphorylation by Plk1-inhibition and depletion can enhance PD-L1 expression. Thus, our findings support a model in which Plk1inhibition may trigger an undesirable upregulation of PD-L1, thereby causing immune evasion of cancer cells (Figure 7). This finding could partially explain the failure of Plk1 inhibitors as single reagents to treat PDAC. In addition to the role of Plk1 in the downregulation of PD-L1 in pancreatic cancer cells, we also demonstrated that Plk1 inhibited pancreatitis and delayed PanIN formation in mouse models (Figure 2). Of interest, the novel dual roles of Plk1 at the early stage of PDAC (pancreatitis and PanIN) and in PDAC are both through dysregulating NFκB pathway. For the first time, we demonstrate that the Plk1-associated inactivation of NFκB plays significantly distinct roles in different stages of PDAC (Figure 7, left). More interestingly, the observations that the negative association of Plk1 and PD-L1 and Plk1-associated inactivation of the NFκB pathway in precursor of PDAC strongly support the notion that Plk1 regulates PD-L1 through NFκB pathway. This hypothesis has been verified by the experiments in Figure 4. The rather unwanted role of Plk1 in upregulating PD-L1 raises the promise to treat PDAC through combining Plk1-inhibition plus anti-PD-L1 (Figure 5). In other words, Plk1-inhibition re-establishes the antitumor response by sensitizing immune checkpoint blockade (anti-PD-L1) in PDAC. Upon Plk1 inhibition or depletion, absence of phosphorylation of RB prevents the translocation of NFκB to the nucleus, resulting in the undesirable upregulation of PD-L1. The combination of a Plk1i and anti-PD-L1 is expected to change an immunologically “cold” tumor to an immunological “hot” tumor, resulting in an anti-tumor immune response to PDAC (Figure 7, right). This novel combination strategy kills two birds with one stone. In other words, Plk1 inhibition-induced an undesirable upregulation of PD-L1, resulting in a failure of Plk1 inhibition in PDAC. However, upregulation of PD-L1 also re-establishes the responses to anti-PD-L1 and finally induces tumor inhibition, which in turn overcomes the failure of Plk1 inhibition in PDAC. To support this conclusion, we showed that the combination of Plk1 inhibition and anti-PD-L1 increased CD8+ T-cell infiltration into tumors (Figure 5). A positive response of a patient to immune checkpoint therapy depends mainly on T-cell infiltration into the tumors (41,42). T-cell infiltration into tumors will render a subject more likely to respond to immunotherapy. Combination of Plk1 inhibition and anti-PD-L1 could improve - cell trafficking and change the profile of T-cells in the tumor. In view of the multiple facets of Plk1 in regulating the progression of PDAC and immune suppression, this study presents a reasonable approach for a clinical application. To be noted, the orthotopic tumors we generated are characterized by high DC infiltrates, which may explain the finding of response to immune checkpoint therapy combination. In contrast, other groups have shown that DCs comprise only about 1–3% of CD45+ cells in human PDAC and KPC tumors (43,44). Our study could benefit from the same treatment studies in additional KPC cell lines that are reflective of the immune phenotype shared by the majority of human PDAC and demonstrating the immune cell composition of the TME at baseline and after treatment.
Figure 7. Schematic summary.
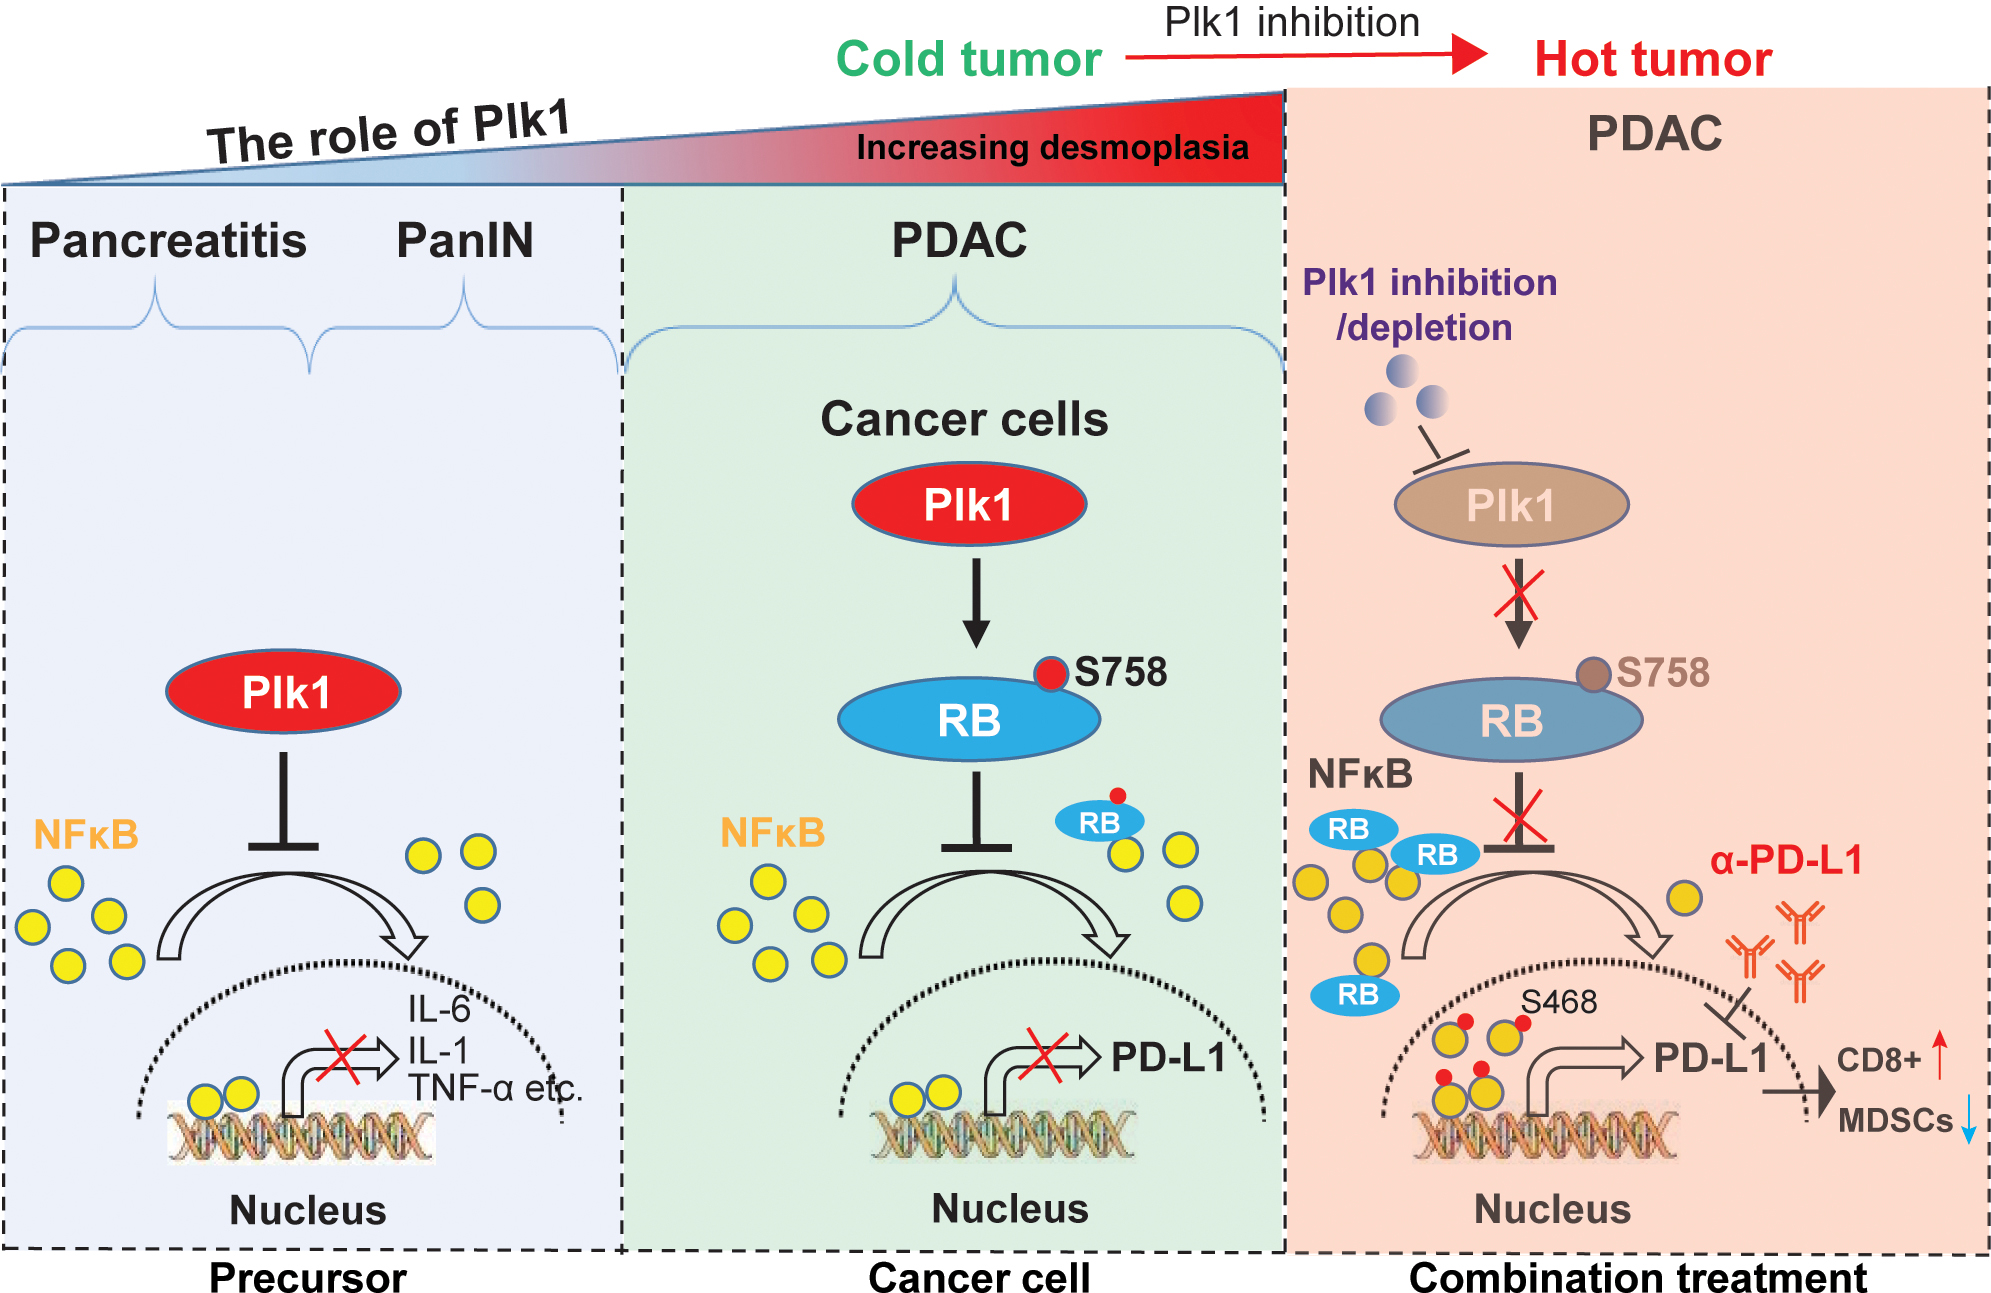
The mechanisms underlying the role of Plk1 in PDAC initiation and progression. At the stages of pancreatitis and PanIN, Plk1 expression inhibits induction of inflammation and delays ADM and PanIN by inactivating NFκB pathway through blocking nuclear translocation of NFκB (Left). When disease progresses to PDAC, Plk1 phosphorylation of RB at S758 inhibits its association with NFκB, contributing to reduced nuclear localization of NFκB and reduced expression of PD-L1 (Middle). Upon treatment with Plk1i, lack of RB phosphorylation promotes its association with NFκB, resulting in increased nuclear localization of phosphor NFκB and elevated expression of PD-L1 (Right). Plk1 inhibition-induced undesirable upregulation of PD-L1 provides a strong rationale for combination Plk1i and α-PD-L1 to treat PDAC. The combination of Plk1i and α-PD-L1 changes the “cold” tumor to “hot” tumor by restoring anti-tumor immune response via promoting CD8 positive T-cells and reducing MDSC cells populations and finally sensitizes PDAC to α-PD-L1 treatment again (Right).
In human pancreatic cancer, the TP53 gene is frequently mutated (50–75%), predominantly through missense mutations (45). Interestingly, we observed that the level of Plk1 was higher in TP53 mutant patients than those of TP53 non-mutant patients (Figure 1B). Both Plk1 and PD-L1 showed positive associations with a poor prognosis in PDAC patients. However, the roles of Plk1 and PD-L1 in clinical outcomes are distinct. In contrast to the expression levels of PD-L1 in patients, there are no differences for the roles of Plk1 in prognosis. Upon grouping patients into those with low and higher levels of Plk1, we observed that PD-L1 could distinguish the patients with a higher level of Plk1 but no significant differences in those with a lower level of Plk1 were observed (Figures 6A–C). These results imply that Plk1 may be involved in an immune evasion process through PD-L1 and could be used to classify patients for targeted therapy. As we have shown, the status of T-cells infiltration exhibited differences of patient survival between the levels of Plk1 and PD-L1 in PDAC (Figures 6D–F). Of note, the level of PD-L1 can significantly distinguish survival for the patients who have tumors enriched with CD8+ T-cells, suggesting the potential efficacy of anti-PD-L1 in this patient population.
Supplementary Material
Significance:
Inhibition of Plk1 induces upregulation of PD-L1 expression in pancreatic ductal adenocarcinoma, stimulating anti-tumor immunity and sensitizing tumors to immunotherapy.
Acknowledgements:
This research was supported by NIH R01 CA157429 (X. Liu), NIH R01 CA264652 (X. Liu), NIH R01 CA256893 (X. Liu), and NIH R01 CA196634 (X. Liu). This research was also supported by the Biospecimen Procurement & Translational Pathology, Biostatistics and Bioinformatics, Flow Cytometry and Immune Monitoring Shared Resources of the University of Kentucky Markey Cancer Center (P30CA177558). We deeply appreciate the editing service provided by Eleanor Erikson.
Footnotes
Declaration of interests: The authors declare no potential conflicts of interest.
References:
- 1.Siegel RL, Miller KD, Fuchs HE, Jemal A. Cancer Statistics, 2021. CA Cancer J Clin 2021;71:7–33 [DOI] [PubMed] [Google Scholar]
- 2.Seton-Rogers S Tumorigenesis: Pushing pancreatic cancer to take off. Nat Rev Cancer 2012;12:739. [DOI] [PubMed] [Google Scholar]
- 3.Mizrahi JD, Surana R, Valle JW, Shroff RT. Pancreatic cancer. Lancet 2020;395:2008–20 [DOI] [PubMed] [Google Scholar]
- 4.Amrutkar M, Gladhaug IP. Pancreatic Cancer Chemoresistance to Gemcitabine. Cancers (Basel) 2017;9. [DOI] [PMC free article] [PubMed] [Google Scholar]
- 5.Strebhardt K Multifaceted polo-like kinases: drug targets and antitargets for cancer therapy. Nat Rev Drug Discov 2010;9:643–60 [DOI] [PubMed] [Google Scholar]
- 6.Mahajan UM, Teller S, Sendler M, Palankar R, van den Brandt C, Schwaiger T, et al. Tumour-specific delivery of siRNA-coupled superparamagnetic iron oxide nanoparticles, targeted against PLK1, stops progression of pancreatic cancer. Gut 2016;65:1838–49 [DOI] [PMC free article] [PubMed] [Google Scholar]
- 7.Song B, Liu XS, Rice SJ, Kuang S, Elzey BD, Konieczny SF, et al. Plk1 phosphorylation of orc2 and hbo1 contributes to gemcitabine resistance in pancreatic cancer. Mol Cancer Ther 2013;12:58–68 [DOI] [PMC free article] [PubMed] [Google Scholar]
- 8.Mross K, Dittrich C, Aulitzky WE, Strumberg D, Schutte J, Schmid RM, et al. A randomised phase II trial of the Polo-like kinase inhibitor BI 2536 in chemo-naive patients with unresectable exocrine adenocarcinoma of the pancreas - a study within the Central European Society Anticancer Drug Research (CESAR) collaborative network. Br J Cancer 2012;107:280–6 [DOI] [PMC free article] [PubMed] [Google Scholar]
- 9.Ohaegbulam KC, Assal A, Lazar-Molnar E, Yao Y, Zang X. Human cancer immunotherapy with antibodies to the PD-1 and PD-L1 pathway. Trends Mol Med 2015;21:24–33 [DOI] [PMC free article] [PubMed] [Google Scholar]
- 10.Yamaki S, Yanagimoto H, Tsuta K, Ryota H, Kon M. PD-L1 expression in pancreatic ductal adenocarcinoma is a poor prognostic factor in patients with high CD8(+) tumor-infiltrating lymphocytes: highly sensitive detection using phosphor-integrated dot staining. Int J Clin Oncol 2017;22:726–33 [DOI] [PMC free article] [PubMed] [Google Scholar]
- 11.Patel K, Siraj S, Smith C, Nair M, Vishwanatha JK, Basha R. Pancreatic Cancer: An Emphasis on Current Perspectives in Immunotherapy. Crit Rev Oncog 2019;24:105–18 [DOI] [PMC free article] [PubMed] [Google Scholar]
- 12.Karagiannis GS, Poutahidis T, Erdman SE, Kirsch R, Riddell RH, Diamandis EP. Cancer-associated fibroblasts drive the progression of metastasis through both paracrine and mechanical pressure on cancer tissue. Mol Cancer Res 2012;10:1403–18 [DOI] [PMC free article] [PubMed] [Google Scholar]
- 13.von Ahrens D, Bhagat TD, Nagrath D, Maitra A, Verma A. The role of stromal cancer-associated fibroblasts in pancreatic cancer. J Hematol Oncol 2017;10:76. [DOI] [PMC free article] [PubMed] [Google Scholar]
- 14.Bi S, Wang Y, Guan J, Sheng X, Meng J. Three new Jurassic euharamiyidan species reinforce early divergence of mammals. Nature 2014;514:579–84 [DOI] [PubMed] [Google Scholar]
- 15.Chang JH, Jiang Y, Pillarisetty VG. Role of immune cells in pancreatic cancer from bench to clinical application: An updated review. Medicine (Baltimore) 2016;95:e5541. [DOI] [PMC free article] [PubMed] [Google Scholar]
- 16.Murakami T, Hiroshima Y, Matsuyama R, Homma Y, Hoffman RM, Endo I. Role of the tumor microenvironment in pancreatic cancer. Ann Gastroenterol Surg 2019;3:130–7 [DOI] [PMC free article] [PubMed] [Google Scholar]
- 17.Schutte M, Hruban RH, Geradts J, Maynard R, Hilgers W, Rabindran SK, et al. Abrogation of the Rb/p16 tumor-suppressive pathway in virtually all pancreatic carcinomas. Cancer Res 1997;57:3126–30 [PubMed] [Google Scholar]
- 18.Serrano M, Hannon GJ, Beach D. A new regulatory motif in cell-cycle control causing specific inhibition of cyclin D/CDK4. Nature 1993;366:704–7 [DOI] [PubMed] [Google Scholar]
- 19.Pomerantz J, Schreiber-Agus N, Liegeois NJ, Silverman A, Alland L, Chin L, et al. The Ink4a tumor suppressor gene product, p19Arf, interacts with MDM2 and neutralizes MDM2’s inhibition of p53. Cell 1998;92:713–23 [DOI] [PubMed] [Google Scholar]
- 20.Weinberg RA. The retinoblastoma protein and cell cycle control. Cell 1995;81:323–30 [DOI] [PubMed] [Google Scholar]
- 21.Jin X, Ding D, Yan Y, Li H, Wang B, Ma L, et al. Phosphorylated RB Promotes Cancer Immunity by Inhibiting NF-kappaB Activation and PD-L1 Expression. Mol Cell 2019;73:22–-35 e6. [DOI] [PMC free article] [PubMed] [Google Scholar]
- 22.Zgarbová M, Sponer J, Otyepka M, Cheatham III TE, Galindo-Murillo R, Jurecka P. Refinement of the sugar–phosphate backbone torsion beta for AMBER force fields improves the description of Z-and B-DNA. Journal of chemical theory and computation 2015;11:5723–36 [DOI] [PubMed] [Google Scholar]
- 23.Berendsen HJ, Postma Jv, van Gunsteren WF, DiNola A, Haak JR. Molecular dynamics with coupling to an external bath. The Journal of chemical physics 1984;81:3684–90 [Google Scholar]
- 24.Bussi G, Donadio D, Parrinello M. Canonical sampling through velocity rescaling. The Journal of chemical physics 2007;126:014101. [DOI] [PubMed] [Google Scholar]
- 25.Darden T, York D, Pedersen L. Particle mesh Ewald: An N⋅ log (N) method for Ewald sums in large systems. The Journal of chemical physics 1993;98:10089–92 [Google Scholar]
- 26.Abraham MJ, Murtola T, Schulz R, Páll S, Smith JC, Hess B, et al. GROMACS: High performance molecular simulations through multi-level parallelism from laptops to supercomputers. SoftwareX 2015;1:19–25 [Google Scholar]
- 27.Jumper J, Evans R, Pritzel A, Green T, Figurnov M, Ronneberger O, et al. Highly accurate protein structure prediction with AlphaFold. Nature 2021;596:583–9 [DOI] [PMC free article] [PubMed] [Google Scholar]
- 28.Liu Z, Sun Q, Wang X. PLK1, A Potential Target for Cancer Therapy. Transl Oncol 2017;10:22–32 [DOI] [PMC free article] [PubMed] [Google Scholar]
- 29.Pinho AV, Chantrill L, Rooman I. Chronic pancreatitis: a path to pancreatic cancer. Cancer Lett 2014;345:203–9 [DOI] [PubMed] [Google Scholar]
- 30.Guerra C, Collado M, Navas C, Schuhmacher AJ, Hernandez-Porras I, Canamero M, et al. Pancreatitis-induced inflammation contributes to pancreatic cancer by inhibiting oncogene-induced senescence. Cancer Cell 2011;19:728–39 [DOI] [PMC free article] [PubMed] [Google Scholar]
- 31.Siveke JT, Lubeseder-Martellato C, Lee M, Mazur PK, Nakhai H, Radtke F, et al. Notch signaling is required for exocrine regeneration after acute pancreatitis. Gastroenterology 2008;134:544–55 [DOI] [PubMed] [Google Scholar]
- 32.Jensen JN, Cameron E, Garay MV, Starkey TW, Gianani R, Jensen J. Recapitulation of elements of embryonic development in adult mouse pancreatic regeneration. Gastroenterology 2005;128:728–41 [DOI] [PubMed] [Google Scholar]
- 33.Kim H Cerulein pancreatitis: oxidative stress, inflammation, and apoptosis. Gut Liver 2008;2:74–80 [DOI] [PMC free article] [PubMed] [Google Scholar]
- 34.de Carcer G, Venkateswaran SV, Salgueiro L, El Bakkali A, Somogyi K, Rowald K, et al. Plk1 overexpression induces chromosomal instability and suppresses tumor development. Nat Commun 2018;9:3012. [DOI] [PMC free article] [PubMed] [Google Scholar]
- 35.Gheghiani L, Wang L, Zhang Y, Moore XTR, Zhang J, Smith SC, et al. PLK1 Induces Chromosomal Instability and Overrides Cell-Cycle Checkpoints to Drive Tumorigenesis. Cancer Res 2021;81:1293–307 [DOI] [PMC free article] [PubMed] [Google Scholar]
- 36.Strebhardt K, Raab M, Sanhaji M. The role of PLK1 in cancer exhibiting chromosomal instability. Mol Cell Oncol 2018;5:e1485539. [DOI] [PMC free article] [PubMed] [Google Scholar]
- 37.Yamamoto Y, Matsuyama H, Kawauchi S, Matsumoto H, Nagao K, Ohmi C, et al. Overexpression of polo-like kinase 1 (PLK1) and chromosomal instability in bladder cancer. Oncology 2006;70:231–7 [DOI] [PubMed] [Google Scholar]
- 38.Vitour D, Dabo S, Ahmadi Pour M, Vilasco M, Vidalain PO, Jacob Y, et al. Polo-like kinase 1 (PLK1) regulates interferon (IFN) induction by MAVS. J Biol Chem 2009;284:21797–809 [DOI] [PMC free article] [PubMed] [Google Scholar]
- 39.Mandai M, Hamanishi J, Abiko K, Matsumura N, Baba T, Konishi I. Dual Faces of IFNgamma in Cancer Progression: A Role of PD-L1 Induction in the Determination of Pro- and Antitumor Immunity. Clin Cancer Res 2016;22:2329–34 [DOI] [PubMed] [Google Scholar]
- 40.Cholewa BD, Liu X, Ahmad N. The role of polo-like kinase 1 in carcinogenesis: cause or consequence? Cancer Res 2013;73:6848–55 [DOI] [PMC free article] [PubMed] [Google Scholar]
- 41.Herbst RS, Soria JC, Kowanetz M, Fine GD, Hamid O, Gordon MS, et al. Predictive correlates of response to the anti-PD-L1 antibody MPDL3280A in cancer patients. Nature 2014;515:563–7 [DOI] [PMC free article] [PubMed] [Google Scholar]
- 42.Vassilakopoulou M, Avgeris M, Velcheti V, Kotoula V, Rampias T, Chatzopoulos K, et al. Evaluation of PD-L1 Expression and Associated Tumor-Infiltrating Lymphocytes in Laryngeal Squamous Cell Carcinoma. Clin Cancer Res 2016;22:704–13 [DOI] [PubMed] [Google Scholar]
- 43.Elyada E, Bolisetty M, Laise P, Flynn WF, Courtois ET, Burkhart RA, et al. Cross-Species Single-Cell Analysis of Pancreatic Ductal Adenocarcinoma Reveals Antigen-Presenting Cancer-Associated Fibroblasts. Cancer Discov 2019;9:1102–23 [DOI] [PMC free article] [PubMed] [Google Scholar]
- 44.Li J, Byrne KT, Yan F, Yamazoe T, Chen Z, Baslan T, et al. Tumor Cell-Intrinsic Factors Underlie Heterogeneity of Immune Cell Infiltration and Response to Immunotherapy. Immunity 2018;49:178–93 e7 [DOI] [PMC free article] [PubMed] [Google Scholar]
- 45.Scarpa A, Capelli P, Mukai K, Zamboni G, Oda T, Iacono C, et al. Pancreatic adenocarcinomas frequently show p53 gene mutations. Am J Pathol 1993;142:1534–43 [PMC free article] [PubMed] [Google Scholar]
Associated Data
This section collects any data citations, data availability statements, or supplementary materials included in this article.
Supplementary Materials
Data Availability Statement
The data generated in this study are available upon request from the corresponding author.
More details can be found in Supplementary Materials and Methods.