

Abstract
The success of e-commerce (EC) platforms depends heavily on word of mouth (WOM). Therefore, it is important to understand the characteristics of WOM, an aspect of consumer behavior, and using this knowledge to create customer experiences that helps the business to remain competitive. The factors that influence consumer behavior are classified into four types: the amount of WOM, text characteristics, reviewer characteristics and valence. However, the perspective of rating distribution is missing. This information has been provided to consumers on major EC platforms to help them improve their product quality product quality. Previous research is limited because it is difficult to quantify the improvement in their judgments. Therefore, this study investigates the impact of rating valence and distribution of ratings for personal computers through a randomized controlled trial in an online survey environment. The results show that rating valence has a greater impact on purchase intention than rating distribution. However, rating distribution, which is polarized both positively and negatively, contributes to WOM intention to help. In addition, the polarized rating distribution has a positive impact on consumers who prefer online purchases but a negative impact on consumers who prefer offline purchases as it gives the impression of risk. Therefore, EC platform operators should consider rating distribution as a recommended product algorithm.
Keywords: EC, Personal computers, Word of mouth, Monotonous rating distribution, Polarized rating distribution
Introduction
Trust has the highest priority for consumers who make online purchases where they cannot touch the product. A low price is attractive, but trust dominates purchasing behavior (Reichheld and Schefter 2000). This is especially true for consumer durables such as electric appliances, which are expensive and have elevated levels of involvement (Kaushik et al. 2018). Although electric appliances account for the highest percentage of e-commerce (EC) sales (global EC electronic device sales are expected to reach US$ 1.04 trillion in 2022; Shopify 2022), consumers prefer to buy them offline rather than online (Statista 2017). Regardless of technological advances, trust is an important aspect of online purchasing (Kim and Peterson 2017). Accordingly, the source of information that consumers trust is consumers’ word of mouth ([WOM] Cheung and Thadani 2012; Flanagin et al. 2014; Roy et al. 2017; Wan et al. 2018). WOM acts as a guide to reduce uncertainty about product quality and drives consumer attitudes and behaviors (for example, Roy et al. 2019; Ullal et al. 2021). This is because it has no commercial intention and covers both the positive and negative aspects of the product (Filieri and Mariani 2021). In an American survey, more than 80% of consumers read WOM online reviews before buying a product (Smith and Anderson 2016; Murphy 2020).
With the rapid development of EC and social media, WOM has replaced traditional face-to-face interactions with electronic formats (Eisingerich et al. 2015). WOM posting and browsing platforms can be broadly divided into EC websites (EC-WOM) and social media (SM-WOM). EC consumers prefer not to refer to SM-WOM because a vast amount of information increases their cognitive costs. During decision-making, consumers refer to SM-WOM only if EC-WOM is insufficient (Yan et al. 2016). Customer feedback is also introduced on the company’s official website, but WOM, which is independent of the company, is more influential (Meuter et al. 2013).
This study focuses on purchasing behavior in EC and EC-WOM. The success of an EC platform depends heavily on WOM (Liu and Pang 2018). EC retailers are well aware of this and leverage WOM to create purchasing experiences (Barton 2006). For example, product endorsements based on valence, which are rated on a five-point scale, enhance the quality of consumers’ purchasing experiences (Lin 2014). EC retailers understand the importance of WOM and utilize this knowledge in system construction, which is a source of competitiveness (Filieri 2015).
In academic research, WOM has gained significant importance over the past few decades, owing to its enormous influence (Chu and Kim 2018; King et al. 2014). The WOM factors influencing consumer behavior are classified into the following four types. The first is the amount of WOM. There is a positive correlation between WOM volume and sales (Babić Rosario et al. 2016; Berger et al. 2010; Godes and Mayzlin 2004; Khare et al. 2011). The second is text features. The length of WOM reviews (Palese and Usai, 2018; Pan and Zhang 2011) and positive emotional tone (Ghose and Ipeirotis 2010; Ismagilova et al. 2020; Ren and Hong 2019; Salehan and Kim 2016) promote reader’s purchasing behavior. The third is reviewer features. For example, consumer opinions are more effective than expert opinions (Flanagin and Metzger 2013; Jacobsen 2018; Zhang et al. 2010). The fourth is rating valence. Rating valence, which enables comprehensive judgment at a glance no matter how many WOM reviews there are, has a greater impact on consumers than the amount of WOMs (Maslowska et al. 2017; Yang et al. 2016). However, the viewpoint of the rating distribution is lacking here. In major ECs, in addition to the above viewpoints, rating distribution has been shown to promote a comprehensive understanding. This allows consumers to improve the quality of their decision-making. However, due to lack of academic knowledge, the implications for business have been insufficient compared with other perspectives. For example, even if the amount of WOM and the rating valence are the same, the rating distribution may differ, such as in terms of being monotonous and polarized. In addition, its impact can vary with the purchasing channel preferences. By understanding the impact of these distributions, e-commerce companies can implement more personalized experiences. At present, these findings are surprisingly few compared to the above four viewpoints, and this study fills that gap. Accordingly, the main research questions of this study are: Does the WOM valence affect purchase intention and (WOM) helpfulness?; Does the WOM rating distribution affect purchase intention and (WOM) helpfulness?; Is there a difference in its effect depending on consumer preferences (regarding purchasing channels)? For the verification, randomized controlled trials (RCTs), which are expected to be highly reliable, were adopted for personal computers (PCs). These results complement the missing perspectives of academic WOM research and provide useful suggestions for EC retailers.
Literature review and hypotheses development
The hypotheses of this study were derived from previous studies on WOM factors that influence consumer behavior.
Amount of WOM
A study of electric appliances on Amazon reported that the amount of WOM affects the sales of new products (Cui et al. 2012). Similar results have been obtained for movies (Duan et al. 2008; Liu 2006) and online games (Zhu and Zhang 2010). A meta-analysis of 96 studies covering 40 platforms and 26 product categories also found a positive correlation between WOM volume and sales (Babić Rosario et al. 2016). This is because people often talk about products that attract the attention of other consumers (Godes and Mayzlin 2004; Khare et al. 2011). Hence, it has been argued that even negative WOM can contribute to raising product awareness and sales (Berger et al. 2010). However, high volatility, such as a sudden rise in the amount of WOM, can give an enterprise the impression of intentional manipulation and adversely affect WOM reliability and product preferences (Kim and Yoo 2020).
Text features
There are three main text features. (1) WOMs with titles that contain positive emotions attract more readers (Salehan and Kim 2016). (2) Sentence length or WOM length positively affects usefulness (Pan and Zhang 2011). In addition, the higher the number of topics mentioned in one WOM item, the higher is the review rating (Palese and Usai 2018). However, if the amount of information is too large, the reader will experience information overload. Therefore, prioritizing the display of medium-length WOMs is more effective than unreliable WOMs that are too short, have high cognitive costs, and are too long to promote purchasing behavior (Furner et al. 2016). (3) The content of WOM text, which is a mixture of objective and subjective information, is considered useful (Ghose and Ipeirotis 2010). In particular, the emotions embedded in WOM attract readers’ attention (Ismagilova et al. 2020; Ren and Hong 2019). Negative content has a more significant effect than positive content (Aggarwal et al. 2012; East et al. 2008; Kim et al. 2016; Lo and Yao 2019). A study of books on Amazon concluded that most samples had a greater effect on 1-star WOM than 5-star WOM (Chevalier and Mayzlin 2006). Therefore, companies spend far more resources managing negative WOMs than actively promoting WOMs (Williams and Buttle 2014).
Reviewer features
There are five main features of reviewers: First, reviewers are ordinary consumers. Consumers value genuine opinions without commercial intent; therefore, the opinions of ordinary consumers are more influential than those of experts (Zhang et al. 2010). If the amount of information about the target product is small, experts may be preferred; however, there is a strong tendency to value consumer opinions (Flanagin and Metzger 2013). For the same reason, credibility diminishes when EC retailers provide reviewer incentives (Jacobsen 2018). Second, the reviewers are product purchasers. On Amazon, WOM written by consumers who purchase products are tagged with “verified purchase,” and reviews that include this tag strongly influence purchasing behavior (Kaushik et al. 2018). Third, reviewers have a high level of specialized knowledge. WOM written by highly knowledgeable reviewers is highly reliable (Lo and Yao 2019). Fourth is the approval of reviewers or reviews through a function of EC. EC platforms have a mechanism for evaluating reviewers so that consumers can efficiently discover useful information. For example, on Amazon, consumers can indicate the helpfulness of a review by clicking on the WOM with which they agree, which is displayed as a “helpfulness” count. This helpfulness count positively affects product sales (Kaushik et al. 2018). Additionally, top customer reviewers are determined by the amount of WOM and helpful counts (Amazon, n.d.), and WOM by top-ranked reviewers is evaluated as highly useful (Baek et al. 2012). The fifth section contains avatars and profile images of the reviewers. In the online world, avatars are important sources of information (Utz and Jankowski 2016). The extent to which a user considers an avatar an extension of themselves represents loyalty to the service (Teng 2019). Avatars on EC platforms are also important sources of information, and their characteristics change readers’ perceptions of WOM (Lee et al. 2013; Karimi and Wang 2017).
Rating valence
When consumers post WOM on an EC platform, it is common to provide a rating. Owing to its prominent placement, rating valence is one of the most recognized and compelling sources of information (Karabas et al. 2021). Rating valence is more influential than the amount of WOM (Maslowska et al. 2017; Yang et al. 2016). This is because when WOM is large, consumers suffer from “information overload,” making it difficult to understand WOM comprehensively. Conversely, rating valence enables comprehensive judgment at first glance (Park and Lee 2008). Therefore, consumers pay more attention to rating valence than the number of ratings (Flanagin et al. 2014) and seek products with excellent attributes and high average ratings (Von Helversen et al. 2018). For mobile phones (Gopinath et al. 2014) and movies (Chintagunta et al. 2010), rating valence has been confirmed to have a greater effect than the amount of WOM. However, a 4.2-star WOM is more likely to influence a purchase than a perfect 5-star WOM that gives the impression of tampering (Karabas et al. 2021; Maslowska et al. 2017). Additionally, as attention is paid to rating valence, individual WOMs with large deviations from this value are less useful to consumers (Baek et al. 2012). Accordingly, the following hypotheses are derived based on the literature:
H1-1: An increase in rating valence positively affects purchase intention.
H1-2: An increase in rating valence positively affects WOM helpfulness.
Rating distribution
Rating valence does not necessarily reveal the true product quality (Hu et al. 2006). Consumer ratings are not normally distributed; in most cases, they are polarized (J-shaped distributions) with prominent 5-star ratings and select 1-star ratings (Hu et al. 2009). Although this distribution is noteworthy for consumers, it is difficult to quantify information posted on WOM. Therefore, despite recognizing its importance for consumer decision-making, it is significantly less controversial than other factors (Lee et al. 2021). Therefore, this study focused on the effects of different distributions.
The polarized rating distribution, which has a high 5-star rating, enables easy access to consumers’ trust for several reasons. First, WOM, which describes both positive and negative aspects, is a valuable feature for consumers (Filieri and Mariani 2021). Second, as stated above, many products on ECs have a polarized rating distribution; therefore, they are considered familiar. Conversely, a monotonous rating distribution (monotonous increase) is rarely observed. Accordingly, the following hypotheses are derived:
H2-1: Compared to monotonous rating distribution, polarized rating distribution has a positive effect on purchase intention.
H2-2: Compared with the monotonous rating distribution, the polarized rating distribution has a positive effect on the helpfulness of WOM.
Furthermore, Hypotheses H2-1 and H2-2 are expected to change depending on the purchasing channel preference. In EC, trust governs purchasing behavior (Kim and Peterson 2017; Reichheld and Schefter 2000). This is particularly true for electronic appliances, which are expensive and risk-averse (Kaushik et al. 2018). Therefore, about half of the consumer base still prefers to purchase offline (Statista 2017). Hence, consumers who value offline purchases are at risk of buying products with polarized opinions, even if the percentage is positive. However, consumers who prefer to buy online are accustomed to seeing negative WOM as well as positive WOM reviews. WOM is reliable because it highlights a product's positive and negative aspects (Filieri and Mariani 2021). Therefore, a perfect 5-star WOM gives the impression of tampering (Karabas et al. 2021; Maslowska et al. 2017). In other words, the effect of polarized evaluation changes depending on the preferred purchase channel. Therefore, the following hypotheses are derived:
H3-1: For consumers who prefer to purchase online, a polarized rating distribution positively impacts purchase intention.
H3-2: For consumers who prefer to purchase offline, a polarized rating distribution negatively impacts purchase intention.
Method
Stimulus materials production
This study focuses on PCs as a product category, which enables high motivation to gather information and level of involvement (Chen and Wang 2013; Kaushik et al. 2018) and has many WOM reviews on EC platforms (Cui et al. 2012). RCTs were adopted because of their high reliability in verifying causal effects (Torgerson and Torgerson 2008).
To conduct this experiment, it was necessary to set the target brand, rating valence, rating distribution, EC platform, and WOM volume. First, as shown in Table 1, Lenovo (IdeaPad), which had the highest market share in 2020 (IDC 2021), and Apple (MacBook Air), which had the highest customer satisfaction in 2020 (The American Customer Satisfaction Index 2021), were selected as the target brands. Next, in rating valence, the following two viewpoints were considered. First, WOM reviews with 4.2 stars are more likely to influence purchase than perfect 5-star ones, as stated above (Karabas et al. 2021; Maslowska et al. 2017). Second, EC platforms use product information and accumulated WOM data to recommend products that are presumed to be easy to purchase and are present at the top of the search page (Barton, 2006; Liu and Pang 2018; Lin 2014). In this highly competitive category, products rarely have a valence rating of less than 3. Hence, 3.2 was set as middle-rated, and 4.2 was set as high-rated. Subsequently, as shown in Table 2, the monotonous and polarized ratings distribution were defined, with each rating valence fixed. The amount of WOM, which is not the subject of the hypotheses, was set as the control variable in 528 cases.
Table 1.
Global market share and customer satisfaction index for PCs by brand in 2020
| Brand | Shipments (thousands of units) | Market sharea | Satisfaction Indexb |
|---|---|---|---|
| Lenovo | 72,669 | 24.0% | 76 |
| HP | 67,646 | 22.4% | 77 |
| Dell | 50,298 | 16.6% | 77 |
| Apple | 23,102 | 7.6% | 82 |
| Acer | 20,989 | 6.9% | 78 |
| Others | 67,901 | 22.4% | 76 |
| Total | 302,605 | 100.0% | − |
aIDC (2021)
bThe American Customer Satisfaction Index (2021)
Table 2.
Rating valences and rating distributions used in the survey
| Score | Middle-rated | High-rated | ||
|---|---|---|---|---|
| Monotonous | Polarization | Monotonous | Polarization | |
| 5 | 132 | 187 | 259 | 391 |
| 4 | 112 | 71 | 170 | 29 |
| 3 | 103 | 69 | 55 | 13 |
| 2 | 93 | 65 | 31 | 10 |
| 1 | 88 | 136 | 13 | 85 |
| Total | 528 | 528 | 528 | 528 |
| Mean | 3.20 | 3.20 | 4.20 | 4.20 |
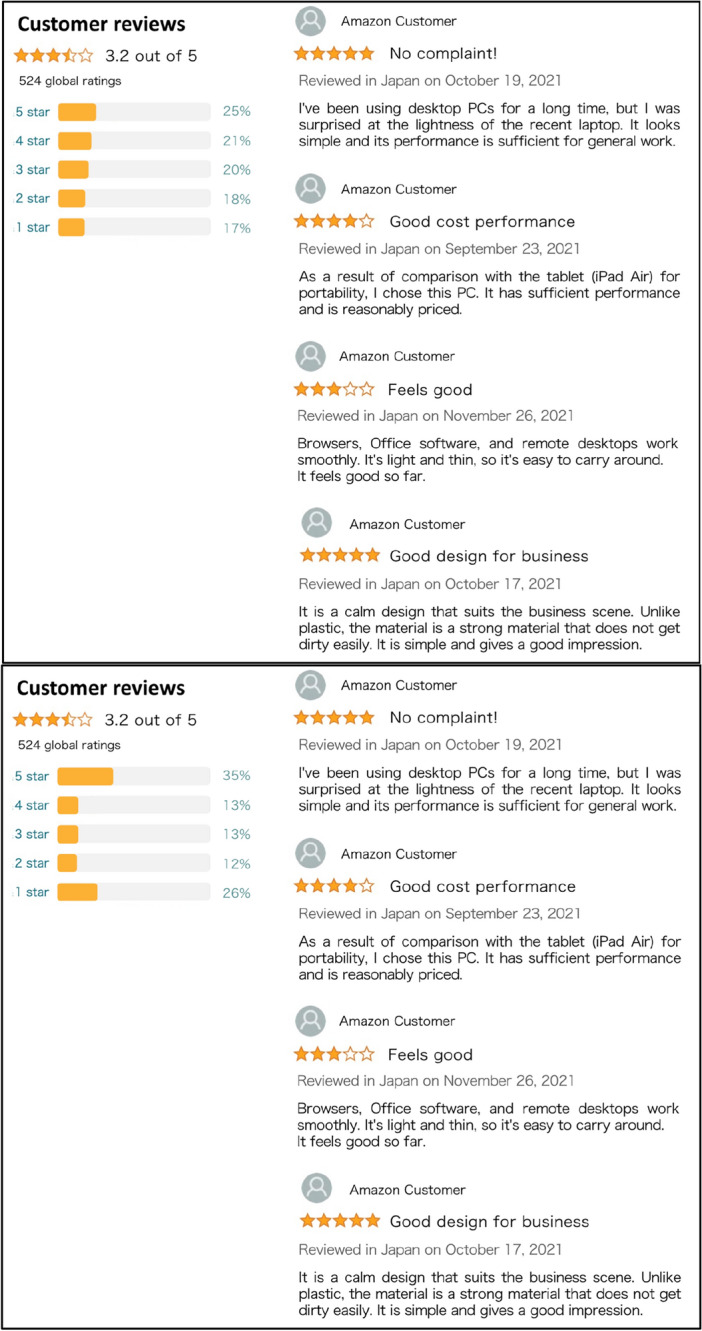
Amazon, which is the most popular EC platform, was used in this study. Figure 1 shows the rating distribution produced by this EC design, and Figs. 2 and 3 show the product pages. Finally, four WOM reviews on the Amazon target product page were extracted, and WOM pages were created, as shown in Figs. 4 and 5. All information except the distribution was set under the same conditions. The WOM page, including the product page and rating distribution, is hereafter referred to as “stimulus materials.” As shown in Table 3, the RCT groups had two rating valences × two rating distributions × two brands = eight groups.
Fig. 1.

Rating pattern (2 rating valences × 2 rating distributions)
Fig. 2.

Product page about Apple MacBook Air (rating valences: high-rated)
Fig. 3.

Product page about Lenovo IdeaPad (rating valences: middle-rated)
Fig. 4.

WOM page about Apple MacBook Air (upper: monotonous, lower: polarization; High-rated)
Fig. 5.
WOM page about Lenovo IdeaPad (upper: monotonous, lower: polarization; middle-rated)
Table 3.
Group settings for RCT
| Group | Rating valence | Rating distribution | Target |
|---|---|---|---|
| Group1 | Middle-rated | Monotonous | Apple |
| Group2 | Middle-rated | Monotonous | Lenovo |
| Group3 | Middle-rated | Polarized | Apple |
| Group4 | Middle-rated | Polarized | Lenovo |
| Group5 | High-rated | Monotonous | Apple |
| Group6 | High-rated | Monotonous | Lenovo |
| Group7 | High-rated | Polarized | Apple |
| Group8 | High-rated | Polarized | Lenovo |
Survey
An online survey of PCs was conducted in Japan between December 19 and 21, 2021. The sample size was 800 participants, with 100 participants in each group. The conditions for the respondents were as follows: (a) age 20–39 years, (b) possession of PCs. Since the members of this generation that prefers online shopping, the subject of this study, are in their 20s–30s (Finical 2021), they were set as the target. The survey was delivered via e-mail to a panel that a major Japanese research company used. The pre-survey questionnaire included 10 items: (1) device used to respond, (2) gender, (3) age, (4) PC ownership status, (5) PC ownership brand, (6) time elapsed since purchase, (7) usage frequency of PCs, (8) preferred channel for purchasing PCs (online or offline), (9) habit of checking WOM reviews before purchase (seven-point Likert scale; e.g., 1: do not have a habit of seeing reviews at all; 7: have a strong habit of seeing reviews), and (10) repurchase intention for owned brands (seven-point Likert scale; e.g., 1: do not want to purchase at all; 7: want to very much purchase). For (1), information (PCs or smartphones [SPs]) was automatically acquired using the survey system. For questions (2) to (4), only 688 people who met respondent conditions (a) and (b) participated in the subsequent survey. The distribution of respondent attributes is shown in Table 4. Question (8) assessed H3-1 and H3-2. 28.2% of respondents said they preferred online shopping, and as with the worldwide survey (Statista 2017), many people still value an offline experience when buying PCs. Questions (5), (6), (7), (9), and (10) are control variables for precise verification. Given that psychological barriers to purchase intention differ depending on the respondents, the repurchase intention for the owned PC brand was heard before the presentation of the stimulus materials.
Table 4.
Distribution of respondent attributes
| Item | Content | Number of respondents | Composition ratio |
|---|---|---|---|
| Gender | Male | 348 | 50.6% |
| Female | 340 | 49.4% | |
| Prefer not to say | 0 | 0.0% | |
| Age | 20 s | 364 | 52.9% |
| 30 s | 324 | 47.1% | |
| Owned brand | Fujitsu | 103 | 15.0% |
| NEC | 99 | 14.4% | |
| Apple | 71 | 10.3% | |
| HP | 71 | 10.3% | |
| Dell | 59 | 8.6% | |
| Lenovo | 47 | 6.8% | |
| Panasonic | 21 | 3.1% | |
| Acer | 12 | 1.7% | |
| Others | 205 | 29.8% | |
| Response Device | PC | 338 | 49.1% |
| SP | 350 | 50.9% | |
| Group | Group1 | 86 | 12.5% |
| Group2 | 82 | 11.9% | |
| Group3 | 91 | 13.2% | |
| Group4 | 89 | 12.9% | |
| Group5 | 84 | 12.2% | |
| Group6 | 88 | 12.8% | |
| Group7 | 83 | 12.1% | |
| Group8 | 85 | 12.4% |
After presenting the stimulus materials, two questions were asked regarding: (11) purchase intention for the presented product (seven-point Likert scale) and (12) the information that was the most helpful in answering (11). There are two ways to measure helpfulness in research: counting the number of instances considered helpful using EC data (Baek et al. 2012; Karimi and Wang 2017; Kaushik et al. 2018; Lee et al. 2021; Pan and Zhang 2011; Ren and Hong, 2019; Salehan and Kim 2016); directly asking about perceived helpfulness for WOM (Filieri, 2015; Ismagilova et al. 2020; Park and Lee 2008). This study corresponds to the latter method. However, if the above question is adopted, the concern is that it will be biased. Therefore, to obtain highly accurate results, (12) presented the following PC features as options for multiple answers: brand, design, battery, weight, quietness, storage, processing, display, price, WOM (reputation), and others. As shown in Fig. 6, 11% of the respondents chose WOM.
Fig. 6.

Result of the most helpful information
Verification
The chi-square test was employed to verify H1-1, H1-2, H2-1, and H2-2. Helpfulness was judged by whether WOM was selected for question (12). For H1-1, the chi-square test was applied to the rating valence × purchase intention matrix. The null hypothesis is as follows; “there is no difference in purchase intention in each group.” The significance level was 5%. In other cases, matrices were created and tested similarly.
An ordered probit model with interactions was applied to verify H3-1 and H3-2: Table 5 presents the variables used in this study. The objective variable purchase intention (No.1 in Table 5) was measured on a seven-point Likert scale. The explanatory variables are high-rated (No. 2), which indicates rating valences, and polarized (No. 3), which indicates rating distribution. In addition, control variables (Nos. 5–14) such as target brand, response device, basic attributes, and PC status were used. The explanatory variables Habit and Repurchase converted the top two answers on the seven-point Likert scale to 1 and the others to 0. First, Model 1 was built as an ordered probit model using the above input variables. Variables were selected using a stepwise method. Then, Model 2 was built, in which rating valences and “prefer to purchase online” (No. 4) interactions were adopted in addition to the control variables selected in Model 1. To verify H3-1 and H3-2, Model 3 was built, in which rating distributions and “prefer to purchase online” interactions were adopted in addition to the control variables selected in Model 1. The analysis environment was R, and the pwr.chisq.test function of the pwr package was used for the power analysis, the chisq.test function was used for the chi-squared test, the stepAIC function of the MASS package was used for the stepwise method, and the clm function of the ordinal package was used for the ordered probit model with interactions.
Table 5.
Variable list
| No | Variable | Description | Data Type | Mean | SD |
|---|---|---|---|---|---|
| 1 | Purchase | Purchase intention | 7-point Likert scale | 3.885 | 1.347 |
| 2 | High-rated | High-rated dummy | 0/1 (0: 3.2, 1: 4.2) | 0.494 | − |
| 3 | Polarization | Polarized distribution dummy |
0/1 (0: Monotonous, 1: Polarization) |
0.506 | − |
| 4 | Online | Prefer to purchase online | 0/1 (0: Offline, 1: Online) | 0.282 | − |
| 5 | Target_Apple | Evaluation target Apple dummy | 0/1 (0: Lenovo, 1: Apple) | 0.500 | − |
| 6 | SP | Answer dummy with SPs | 0/1 (0: PCs, 1: SPs) | 0.509 | − |
| 7 | Female | Female dummy | 0/1 (0: Male, 1: Female) | 0.494 | − |
| 8 | Age_30s | Age 30 s dummy | 0/1 (0: 20 s, 1: 30 s) | 0.471 | − |
| 9 | Own_Apple | Dummy of owning Apple PCs | 0/1 (0: No, 1: Yes) | 0.103 | − |
| 10 | Own_Lenovo | Dummy of owning Lenovo PCs | 0/1 (0: No, 1: Yes) | 0.068 | − |
| 11 | Elapsed_Time | Elapsed time from purchase |
0: Don't know, 1: Less than a year, 2: Less than two years, …, 6: Less than six years, 7: Seven years or more |
2.820 | 2.406 |
| 12 | Frequency | PC usage frequency |
1: Less than once a week, 2: Once a week, 3: Two–three times a week, 4: Four-six times a week, 5: Every day |
4.246 | 1.232 |
| 13 | Habit | Habit to check WOM before purchase | 7-point Likert scale | 4.515 | 1.2136 |
| 14 | Repurchase | Repurchase intention for the owned brand | 7-point Likert scale | 4.484 | 1.2549 |
Note: SD means standard deviation
Results
First, the results for H1-1, H1-2, and H2-2 were confirmed using the chi-squared test. Focusing on the rating valences, as shown in Table 6, the high-rated group shows a higher purchase intention than the middle-rated group. As a result of the chi-square test, the p-value was less than 5%, the null hypothesis was rejected, and a significant difference was detected. In other words, improving the rating valences from 3.2 to 4.2 has a positive impact on purchase intention. Hence, H1-1 is supported. Equally, focusing on the rating distributions, both groups show approximately the same degree of purchase intention responses. As a result of the chi-squared test, the p-value = 0.749, and no significant difference was detected; hence, H1-2 was unsupported.
Table 6.
Chi-square test results of the effects of rating valences and rating distributions on purchase intention
| Group | Purchase intention | Total | Mean | p-value | |||||||
|---|---|---|---|---|---|---|---|---|---|---|---|
| 1 | 2 | 3 | 4 | 5 | 6 | 7 | |||||
|
Rating Valences |
Middle-rated | 23 | 34 | 30 | 201 | 38 | 14 | 8 | 348 | 3.779 | 0.005** |
| High-rated | 28 | 27 | 28 | 159 | 48 | 34 | 16 | 340 | 3.994 | ||
|
Rating Distributions |
Monotonous | 25 | 32 | 27 | 174 | 42 | 24 | 16 | 340 | 3.918 | 0.749 |
| Polarization | 26 | 29 | 31 | 186 | 44 | 24 | 8 | 348 | 3.853 | ||
*** p < 0.001, ** p < 0.01, * p < 0.05
Similarly, when the effect on the helpfulness of WOM was examined, the result was the opposite of purchase intention. Focusing on the rating valences, as shown in Table 7, 11.2% and 10.0% of those who were middle- and high-rated, respectively, felt helpfulness of WOM. As a result of the chi-square test, the p-value = 0.696, and no significant difference was detected. Focusing on the rating distributions, 7.9 and 13.2% of those who were monotonous and polarization, respectively, felt helpfulness of WOM. The results of the chi-square test detected a significant difference at the 5% level. The odds ratio was 1.766, and the 95% confidence interval (CI) was 1.070–2.914. In other words, the polarized distribution positively affects Helpfulness of WOM.
Table 7.
Chi-square test results of the effects of rating valences and rating distributions on the helpfulness of WOM
| Group | Helpfulness of WOM | Total | Ratio | p-value | Odds Ratio | 95% CI | ||
|---|---|---|---|---|---|---|---|---|
| No | Yes | |||||||
| Rating Valences | Middle-rated | 309 | 39 | 348 | 11.2% | 0.696 | 0.880 | 0.541–1.432 |
| High-rated | 306 | 34 | 340 | 10.0% | ||||
| Rating Distributions | Monotonous | 313 | 27 | 340 | 7.9% | 0.034* | 1.766 | 1.070–2.914 |
| Polarization | 302 | 46 | 348 | 13.2% | ||||
CI confidence interval
*** p < 0.001, ** p < 0.01, * p < 0.05
Next, the result for H3-1 and H3-2 was confirmed using an ordered probit model with interactions. Model 1 in Table 8 shows that rating valences became significant at the 5% level, and rating distributions did not. This result was consistent with the conclusions of H1-1 and H1-2. As shown in Table 8, average marginal effects are high-rated 0.008, and polarization, −0.001. As a control variable, SPs’ responses showed a positive effect. This is because, as the screen is small, consumers find it difficult to concentrate on questions while commuting, such as on trains (Kato 2021; Lugtig and Toepoel 2016); therefore, the psychological barrier to intention is lowered. In addition, the habit of checking WOM and repurchase intention to own a brand had a positive effect, and the time elapsed since purchase had a negative effect. In Model 2, no significant interactions were found with rating valences and preference-to-purchase online interactions, in addition to these variables. Rating valence demonstrates a higher willingness to purchase regardless of the channel of choice. Finally, Model 3 shows that significant interactions were detected in rating distributions. As shown on the right side of Fig. 7, the result of simple slope analysis shows that polarized rating distribution has a positive effect when online purchases are preferred and a negative effect when offline purchases are preferred. Therefore, H3-1 and H3-2 were supported.
Table 8.
Estimation results of the ordered probit model
| Variable | Model 1 | Model 2 | Model 3 | |||||||
|---|---|---|---|---|---|---|---|---|---|---|
| Estimate | SE | p-value | AME | Estimate | SE | p-value | Estimate | SE | p-value | |
| High-rated | 0.335 | 0.145 | 0.021* | 0.008 | 0.267 | 0.168 | 0.111 | |||
| Polarization | −0.032 | 0.144 | 0.823 | −0.001 | −0.223 | 0.167 | 0.182 | |||
| Online | −0.465 | 0.231 | 0.044* | −0.726 | 0.241 | 0.003** | ||||
| Target_Apple | 0.226 | 0.144 | 0.117 | 0.006 | 0.238 | 0.145 | 0.100 | 0.229 | 0.144 | 0.112 |
| SP | 0.384 | 0.151 | 0.011* | 0.009 | 0.359 | 0.151 | 0.018* | 0.348 | 0.152 | 0.022* |
| Own_Apple | 0.485 | 0.251 | 0.053 | 0.012 | 0.549 | 0.254 | 0.031* | 0.558 | 0.256 | 0.029* |
| Elapsed_Time | −0.062 | 0.151 | 0.683 | −0.002 | −0.025 | 0.152 | 0.871 | −0.013 | 0.152 | 0.931 |
| Habit | 1.316 | 0.215 | 0.000*** | 0.032 | 1.322 | 0.214 | 0.000*** | 1.344 | 0.215 | 0.000*** |
| RepurchaseIntention | 0.278 | 0.194 | 0.152 | 0.007 | 0.330 | 0.196 | 0.091 | 0.346 | 0.197 | 0.079 |
| High*Online | 0.262 | 0.328 | 0.425 | |||||||
| Polarization*Online | 0.737 | 0.329 | 0.025* | |||||||
| Intercept | ||||||||||
| 1|2 | −1.907 | 0.210 | −1.998 | 0.204 | −2.241 | 0.209 | ||||
| 2|3 | −1.021 | 0.183 | −1.106 | 0.175 | −1.345 | 0.181 | ||||
| 3|4 | −0.502 | 0.175 | −0.582 | 0.166 | −0.819 | 0.172 | ||||
| 4|5 | 1.987 | 0.193 | 1.919 | 0.182 | 1.677 | 0.183 | ||||
| 5|6 | 3.057 | 0.223 | 2.991 | 0.214 | 2.740 | 0.212 | ||||
| 6|7 | 4.341 | 0.287 | 4.277 | 0.280 | 4.026 | 0.277 | ||||
| AIC | 2,043.142 | 2,040.533 | 2,041.470 | |||||||
SE means standard error; AME means average marginal effects
*** p < 0.001; ** p < 0.01; * p < 0.05
Fig. 7.

Slope analysis result of polarized rating distribution and preference of the purchasing channel
The test results for all the hypotheses are shown in Table 9.
Table 9.
Summary of hypothesis verification results
| Hypothesis | Result | |
|---|---|---|
| H1-1 | An increase in rating valence has a positive effect on purchase intention | Supported |
| H1-2 | An increase in rating valence has a positive effect on the helpfulness of WOM | Unsupported |
| H2-1 | Compared to the monotonous rating distribution, the polarized rating distribution has a positive effect on purchase intention | Unsupported |
| H2-2 | Compared to the monotonous rating distribution, the polarized rating distribution has a positive effect on helpfulness of WOM | Supported |
| H3-1 | For consumers who prefer to purchase online, a polarized rating distribution positively impacts purchase intention | Supported |
| H3-2 | For consumers who prefer to purchase offline, a polarized rating distribution negatively impacts purchase intention | Supported |
Implications
The following four factors were the focus of the discussion on the characteristics of WOM that influence consumer behavior: WOM amount, text features, reviewer features, and rating valence. Therefore, this study complements the findings on rating distributions, which have been significantly lacking in the discussion. First, to extract the pure effect of the rating distribution, the EC platform, corporate brand, product brand, price, WOM text, WOM quantity, and rating valence were all set under the same conditions, and different distributions were presented. When actual EC data are used, it is difficult to control the surrounding environment and obtain reliable results. Next, an RCT was conducted under the same conditions to compare the effects of the rating valence and rating distribution. Finally, the interaction between purchasing channel preferences (online or offline), rating valence, and rating distribution was clarified. To the best of our knowledge, no study has yet shown this. As the rating distribution is difficult to quantify, it has not been fully utilized compared with other aspects.
This study had three practical implications. First, rating valence has a significant effect on purchase intention. These results are similar to other recent studies conducted (Karabas et al. 2021; Maslowska et al. 2017; Von Helversen et al. 2018; Yang et al. 2016). The current study was not only limited to a comparison with the amount of WOM (Chintagunta et al. 2010; Gopinath et al. 2014) but also showed the magnitude of the influence of rating valence when compared with the rating distribution. Therefore, EC platform operators should present rating values in a simple and easy-to-understand manner. Second, rating distribution affects the helpfulness of WOM. In other words, when rating distribution is polarized, it is necessary to pay attention to WOM. In addition, for those who prefer to buy online, the accumulation of WOM, both positive and negative, encourages purchase intentions. Equally, for those who prefer offline WOM, there is a concern that polarized WOM may increase perceived risk. Therefore, EC platform companies should consider the rating distribution as the recommended product algorithm. Based on past purchasing experience, it may be more effective to present products with a WOM distribution that is less likely to appear risky to those with little or no experience in online purchasing. Third, product manufacturers eventually promote purchase intentions by presenting negative WOM to consumers. Manufacturers may want to hide negative WOM; however, it is also important to show the actual situation.
Conclusion and future work
In addition to the development of IT, as a consequence of COVID-19, consumers' needs for EC are increasing. Since the success of an EC platform depends heavily on WOM, EC retailers leverage WOM to create a buying experience. Product evaluation of a 5-star is a typical mechanism. Existing research on user evaluation of WOM focuses on rating valence. In other words, the distribution of the evaluations is surprisingly less controversial. Although the distributions on the EC platform are presented as a matter of course, there are few examples in academic research, owing to the difficulty of quantification. Hence, this study shows the effects of rating distribution on purchase intention through WOM, helpfulness, and effective conditions. As a result of a randomized controlled trial in an online survey environment for Japanese personal computers, rating valence had a greater effect on purchase intention than rating distribution. However, the rating distribution, polarized in terms of both positive and negative, contributes to purchase intention and helpfulness. In addition, the polarized rating distribution for purchase intentions has a positive effect on consumers who prefer online purchases but a negative effect on consumers who prefer offline purchases because it gives a risky impression. Therefore, EC platform operators should consider the rating distribution as the recommended product algorithm. These results provide practical suggestions for companies developing EC platforms and product manufacturers. Continuous research on various analytical approaches is essential regarding the new viewpoint of rating distribution.
This study had some limitations. First, the results are limited to PCs. Expansion to other categories is essential for reaching generalized conclusions. Second, the results were limited to people in their 20s and 30s in Japan. Similarly, the impact on other generations should be considered. Third, the results were limited to brands of Apple and Lenovo. Low brand equity is susceptible to positive WOM, whereas high brand equity is susceptible to negative WOM (Tsao et al. 2019). Therefore, the effect of a polarized distribution may differ depending on brand equity. Fourth, the influence of the EC platform is not considered. Not only products and WOM but also EC websites were assessed for trustworthiness. Consumers attach immense importance to retailers' ethics and do not actively purchase unless the website is trusted (Cheung and To 2021). Hence, small EC platforms with low consumer awareness might yield different results. Fifth, rating distributions are limited to a monotonous rating distribution and a polarized rating distribution. Sixth, this study is the result of only a specific point in time. Therefore, researchers should pay attention to the effect derived over time through continuous research. As the number of studies on rating distribution is small, future research should analyze it from various perspectives.
Acknowledgements
There are no external funding agencies for this research.
Author contributions
All of this research.
Data availability
The data supporting this study's findings are available from the corresponding author upon reasonable request.
Declarations
Conflict of interest
There are no conflicts of interest to declare.
Ethical approval
All study participants provided informed consent, and the study design was approved by the appropriate ethics review board.
Consent for publication
This manuscript has not been published or presented elsewhere in part or in entirety and is not under consideration by another journal. I consent to publish this paper to SN Business & Economics.
References
- Aggarwal R, Gopal R, Gupta A, Singh H. Putting money where the mouths are: The relation between venture financing and electronic word-of-mouth. Inf Syst Res. 2012;23(3):976–992. doi: 10.1287/isre.1110.0402. [DOI] [Google Scholar]
- Amazon (n.d.) Amazon’s top customer reviewers, Amazon, https://www.amazon.com/review/top-reviewers (last accessed January 20, 2022)
- Babić Rosario A, Sotgiu F, De Valck K, Bijmolt TH. The effect of electronic word of mouth on sales: A meta-analytic review of platform, product, and metric factors. J Mark Res. 2016;53(3):297–318. doi: 10.1509/jmr.14.0380. [DOI] [Google Scholar]
- Baek H, Ahn J, Choi Y. Helpfulness of online consumer reviews: readers’ objectives and review cues. Int J Electron Commer. 2012;17(2):99–126. doi: 10.2753/JEC1086-4415170204. [DOI] [Google Scholar]
- Barton B. Ratings, reviews & ROI: How leading retailers use customer word of mouth in marketing and merchandising. J Interact Advert. 2006;7(1):5–50. doi: 10.1080/15252019.2006.10722125. [DOI] [Google Scholar]
- Berger J, Sorensen AT, Rasmussen SJ. Positive effects of negative publicity: when negative reviews increase sales. Mark Sci. 2010;29(5):815–827. doi: 10.1287/mksc.1090.0557. [DOI] [Google Scholar]
- Chen L, Wang F. Preference-based clustering reviews for augmenting e-commerce recommendation. Knowl-Based Syst. 2013;50:44–59. doi: 10.1016/j.knosys.2013.05.006. [DOI] [Google Scholar]
- Cheung CM, Thadani DR. The impact of electronic word-of-mouth communication: a literature analysis and integrative model. Decis Support Syst. 2012;54(1):461–470. doi: 10.1016/j.dss.2012.06.008. [DOI] [Google Scholar]
- Cheung MF, To WM. The effect of consumer perceptions of the ethics of retailers on purchase behavior and word-of-mouth: the moderating role of ethical beliefs. J Bus Ethics. 2021;171(4):771–788. doi: 10.1007/s10551-020-04431-6. [DOI] [Google Scholar]
- Chevalier JA, Mayzlin D. The effect of word of mouth on sales: online book reviews. J Mark Res. 2006;43(3):345–354. doi: 10.1509/jmkr.43.3.345. [DOI] [Google Scholar]
- Chintagunta PK, Gopinath S, Venkataraman S. The effects of online user reviews on movie box office performance: accounting for sequential rollout and aggregation across local markets. Mark Sci. 2010;29(5):944–957. doi: 10.1287/mksc.1100.0572. [DOI] [Google Scholar]
- Chu SC, Kim J. The current state of knowledge on electronic word-of-mouth in advertising research. Int J Advert. 2018;37(1):1–13. doi: 10.1080/02650487.2017.1407061. [DOI] [Google Scholar]
- Cui G, Lui HK, Guo X. The effect of online consumer reviews on new product sales. Int J Electron Commer. 2012;17(1):39–58. doi: 10.2753/JEC1086-4415170102. [DOI] [Google Scholar]
- Duan W, Gu B, Whinston AB. The dynamics of online word-of-mouth and product sales—An empirical investigation of the movie industry. J Retail. 2008;84(2):233–242. doi: 10.1016/j.jretai.2008.04.005. [DOI] [Google Scholar]
- East R, Hammond K, Lomax W. Measuring the impact of positive and negative word of mouth on brand purchase probability. Int J Res Mark. 2008;25(3):215–224. doi: 10.1016/j.ijresmar.2008.04.001. [DOI] [Google Scholar]
- Eisingerich AB, Chun HH, Liu Y, Jia H, Bell SJ. Why recommend a brand face-to-face but not on Facebook? How word-of-mouth on online social sites differs from traditional word-of-mouth. J Consum Psychol. 2015;25(1):120–128. doi: 10.1016/j.jcps.2014.05.004. [DOI] [Google Scholar]
- Filieri R. What makes online reviews helpful? A diagnosticity-adoption framework to explain informational and normative influences in e-WOM. J Bus Res. 2015;68(6):1261–1270. doi: 10.1016/j.jbusres.2014.11.006. [DOI] [Google Scholar]
- Filieri R, Mariani M. The role of cultural values in consumers’ evaluation of online review helpfulness: a big data approach. Int Mark Rev. 2021;38(6):1267–1288. doi: 10.1108/IMR-07-2020-0172. [DOI] [Google Scholar]
- Finical (2021) Online Shopping Statistics and Trends in the USA. Finical, https://finicalholdings.com/online-shopping-statistics-and-trends-in-the-usa/ (last accessed July 16, 2022)
- Flanagin AJ, Metzger MJ. Trusting expert-versus user-generated ratings online: the role of information volume, valence, and consumer characteristics. Comput Hum Behav. 2013;29(4):1626–1634. doi: 10.1016/j.chb.2013.02.001. [DOI] [Google Scholar]
- Flanagin AJ, Metzger MJ, Pure R, Markov A, Hartsell E. Mitigating risk in ecommerce transactions: perceptions of information credibility and the role of user-generated ratings in product quality and purchase intention. Electron Commer Res. 2014;14(1):1–23. doi: 10.1007/s10660-014-9139-2. [DOI] [Google Scholar]
- Furner CP, Zinko R, Zhu Z. Electronic word-of-mouth and information overload in an experiential service industry. J Serv Theory Pract. 2016;26(6):788–810. doi: 10.1108/JSTP-01-2015-0022. [DOI] [Google Scholar]
- Ghose A, Ipeirotis PG. Estimating the helpfulness and economic impact of product reviews: mining text and reviewer characteristics. IEEE Trans Knowl Data Eng. 2010;23(10):1498–1512. doi: 10.1109/TKDE.2010.188. [DOI] [Google Scholar]
- Godes D, Mayzlin D. Using online conversations to study word-of-mouth communication. Mark Sci. 2004;23(4):545–560. doi: 10.1287/mksc.1040.0071. [DOI] [Google Scholar]
- Gopinath S, Thomas JS, Krishnamurthi L. Investigating the relationship between the content of online word of mouth, advertising, and brand performance. Mark Sci. 2014;33(2):241–258. doi: 10.1287/mksc.2013.0820. [DOI] [Google Scholar]
- Hu N, Zhang J, Pavlou PA. Overcoming the J-shaped distribution of product reviews. Commun ACM. 2009;52(10):144–147. doi: 10.1145/1562764.1562800. [DOI] [Google Scholar]
- Hu N, Pavlou PA, Zhang J (2006) Can online reviews reveal a product’s true quality? Empirical findings and analytical modeling of online word-of-mouth communication. Proceedings of the 7th ACM conference on Electronic commerce 324–330. 10.1145/1134707.1134743
- IDC (2021) PC Sales Remain on Fire as Fourth Quarter Shipments Grow 26.1% Over the Previous Year, According to IDC. IDC, January 11, https://www.idc.com/getdoc.jsp?containerId=prUS47274421 (last accessed January 20, 2022)
- Ismagilova E, Dwivedi YK, Slade E. Perceived helpfulness of eWOM: emotions, fairness and rationality. J Retail Consum Serv. 2020;53:101748. doi: 10.1016/j.jretconser.2019.02.002. [DOI] [Google Scholar]
- Jacobsen S. Why did I buy this? The effect of WOM and online reviews on post purchase attribution for product outcomes. J Res Interact Mark. 2018;12(3):370–395. doi: 10.1108/JRIM-12-2017-0102. [DOI] [Google Scholar]
- Karabas I, Kareklas I, Weber TJ, Muehling DD. The impact of review valence and awareness of deceptive practices on consumers’ responses to online product ratings and reviews. J Mark Commun. 2021;27(7):685–715. doi: 10.1080/13527266.2020.1759120. [DOI] [Google Scholar]
- Karimi S, Wang F. Online review helpfulness: Impact of reviewer profile image. Decis Support Syst. 2017;96:39–48. doi: 10.1016/j.dss.2017.02.001. [DOI] [Google Scholar]
- Kato T. Verification of the compromise effect’s suitability based on product features of automobiles. Intell Decis Technol. 2021;238:127–137. doi: 10.1007/978-981-16-2765-1_10. [DOI] [Google Scholar]
- Kaushik K, Mishra R, Rana NP, Dwivedi YK. Exploring reviews and review sequences on e-commerce platform: a study of helpful reviews on Amazon. J Retail Consum Serv. 2018;45:21–32. doi: 10.1016/j.jretconser.2018.08.002. [DOI] [Google Scholar]
- Khare A, Labrecque LI, Asare AK. The assimilative and contrastive effects of word-of-mouth volume: an experimental examination of online consumer ratings. J Retail. 2011;87(1):111–126. doi: 10.1016/j.jretai.2011.01.005. [DOI] [Google Scholar]
- Kim Y, Peterson RA. A meta-analysis of online trust relationships in e-commerce. J Interact Mark. 2017;38:44–54. doi: 10.1016/j.intmar.2017.01.001. [DOI] [Google Scholar]
- Kim M, Yoo S. The 4th V? The effect of word of mouth volatility on product performance. Electron Commer Res Appl. 2020;44:101016. doi: 10.1016/j.elerap.2020.101016. [DOI] [Google Scholar]
- Kim SJ, Wang RJH, Maslowska E, Malthouse EC. “Understanding a fury in your words”: The effects of posting and viewing electronic negative word-of-mouth on purchase behaviors. Comput Hum Behav. 2016;54:511–521. doi: 10.1016/j.chb.2015.08.015. [DOI] [Google Scholar]
- King RA, Racherla P, Bush VD. What we know and don’t know about online word-of-mouth: a review and synthesis of the literature. J Interact Mark. 2014;28(3):167–183. doi: 10.1016/j.intmar.2014.02.001. [DOI] [Google Scholar]
- Lee M, Kim M, Peng W. Consumer reviews: reviewer avatar facial expression and review valence. Internet Res. 2013;23(2):116–132. doi: 10.1108/10662241311313277. [DOI] [Google Scholar]
- Lee S, Lee S, Baek H. Does the dispersion of online review ratings affect review helpfulness? Comput Hum Behav. 2021;117:106670. doi: 10.1016/j.chb.2020.106670. [DOI] [Google Scholar]
- Lin Z. An empirical investigation of user and system recommendations in e-commerce. Decis Support Syst. 2014;68:111–124. doi: 10.1016/j.dss.2014.10.003. [DOI] [Google Scholar]
- Liu Y. Word of mouth for movies: its dynamics and impact on box office revenue. J Mark. 2006;70(3):74–89. doi: 10.1509/jmkg.70.3.074. [DOI] [Google Scholar]
- Liu Y, Pang B. A unified framework for detecting author spamicity by modeling review deviation. Expert Syst Appl. 2018;112:148–155. doi: 10.1016/j.eswa.2018.06.028. [DOI] [Google Scholar]
- Lo AS, Yao SS. What makes hotel online reviews credible? An investigation of the roles of reviewer expertise, review rating consistency and review valence. Int J Contemp Hosp Manag. 2019;31(1):41–60. doi: 10.1108/IJCHM-10-2017-0671. [DOI] [Google Scholar]
- Lugtig P, Toepoel V. The use of PCs, smartphones, and tablets in a probability-based panel survey: Effects on survey measurement error. Soc Sci Comput Rev. 2016;34(1):78–94. doi: 10.1177/0894439315574248. [DOI] [Google Scholar]
- Maslowska E, Malthouse EC, Bernritter SF. Too good to be true: the role of online reviews’ features in probability to buy. Int J Advert. 2017;36(1):142–163. doi: 10.1080/02650487.2016.1195622. [DOI] [Google Scholar]
- Meuter ML, McCabe DB, Curran JM. Electronic word-of-mouth versus interpersonal word-of-mouth: are all forms of word-of-mouth equally influential? Serv Mark Q. 2013;34(3):240–256. doi: 10.1080/15332969.2013.798201. [DOI] [Google Scholar]
- Murphy R (2020) Local consumer review survey 2020. BrightLocal, December 9, https://www.brightlocal.com/research/local-consumer-review-survey/ (last accessed January 20, 2022)
- Palese B, Usai A. The relative importance of service quality dimensions in E-commerce experiences. Int J Inf Manage. 2018;40:132–140. doi: 10.1016/j.ijinfomgt.2018.02.001. [DOI] [Google Scholar]
- Pan Y, Zhang JQ. Born unequal: a study of the helpfulness of user-generated product reviews. J Retail. 2011;87(4):598–612. doi: 10.1016/j.jretai.2011.05.002. [DOI] [Google Scholar]
- Park DH, Lee J. eWOM overload and its effect on consumer behavioral intention depending on consumer involvement. Electron Commer Res Appl. 2008;7(4):386–398. doi: 10.1016/j.elerap.2007.11.004. [DOI] [Google Scholar]
- Reichheld FF, Schefter P. E-loyalty: your secret weapon on the web. Harv Bus Rev. 2000;78(4):105–113. [Google Scholar]
- Ren G, Hong T. Examining the relationship between specific negative emotions and the perceived helpfulness of online reviews. Inf Process Manage. 2019;56(4):1425–1438. doi: 10.1016/j.ipm.2018.04.003. [DOI] [Google Scholar]
- Roy G, Datta B, Basu R. Effect of eWOM valence on online retail sales. Glob Bus Rev. 2017;18(1):198–209. doi: 10.1177/0972150916666966. [DOI] [Google Scholar]
- Roy G, Datta B, Mukherjee S. Role of electronic word-of-mouth content and valence in influencing online purchase behavior. J Mark Commun. 2019;25(6):661–684. doi: 10.1080/13527266.2018.1497681. [DOI] [Google Scholar]
- Salehan M, Kim DJ. Predicting the performance of online consumer reviews: a sentiment mining approach to big data analytics. Decis Support Syst. 2016;81:30–40. doi: 10.1016/j.dss.2015.10.006. [DOI] [Google Scholar]
- Shopify (2022) Top Online Shopping Categories in the US. Shopify, https://www.shopify.com/blog/top-online-shopping-categories (last accessed September 1, 2022)
- Smith A, Anderson M (2016) Online Reviews. Pew Research Center, December 19, https://www.pewinternet.org/2016/12/19/online-reviews/ (last accessed January 20, 2022)
- Statista (2017) Online or in-store shopping preference for selected product categories by consumers worldwide as of 2017. Statista, https://www.statista.com/statistics/692871/global-online-shopping-preference-by-category/ (last accessed January 20, 2022)
- Teng CI. How avatars create identification and loyalty among online gamers: contextualization of self-affirmation theory. Internet Res. 2019;29(6):1443–1468. doi: 10.1108/INTR-05-2018-0222. [DOI] [Google Scholar]
- The American Customer Satisfaction Index (2021) Household Appliance and Electronics Study 2020–2021. The American Customer Satisfaction Index, September 21, https://www.theacsi.org/images/stories/images/reports/21sep_APPL-PC-ELECTRONICS-STUDY.pdf (last accessed January 20, 2022)
- Torgerson D, Torgerson C. Designing randomised trials in health, education and the social sciences: an introduction. New York: Palgrave Macmillan; 2008. [Google Scholar]
- Tsao HY, Chen MY, Lin HCK, Ma YC. The asymmetric effect of review valence on numerical rating: a viewpoint from a sentiment analysis of users of TripAdvisor. Online Inf Rev. 2019;43(2):283–300. doi: 10.1108/OIR-11-2017-0307. [DOI] [Google Scholar]
- Ullal MS, Spulbar C, Hawaldar IT, Popescu V, Birau R. The impact of online reviews on e-commerce sales in India: a case study. Econ Res Ekonomska Istraživanja. 2021;34(1):2408–2422. doi: 10.1080/1331677X.2020.1865179. [DOI] [Google Scholar]
- Utz S, Jankowski J. Making “Friends” in a virtual world: the role of preferential attachment, homophily, and status. Soc Sci Comput Rev. 2016;34(5):546–566. doi: 10.1177/0894439315605476. [DOI] [Google Scholar]
- Von Helversen B, Abramczuk K, Kopeć W, Nielek R. Influence of consumer reviews on online purchasing decisions in older and younger adults. Decis Support Syst. 2018;113:1–10. doi: 10.1016/j.dss.2018.05.006. [DOI] [Google Scholar]
- Wan Y, Ma B, Pan Y. Opinion evolution of online consumer reviews in the e-commerce environment. Electron Commer Res. 2018;18(2):291–311. doi: 10.1007/s10660-017-9258-7. [DOI] [Google Scholar]
- Williams M, Buttle F. Managing negative word-of-mouth: an exploratory study. J Mark Manag. 2014;30(13–14):1423–1447. doi: 10.1080/0267257X.2014.933864. [DOI] [Google Scholar]
- Yan Q, Wu S, Wang L, Wu P, Chen H, Wei G. E-WOM from e-commerce websites and social media: Which will consumers adopt? Electron Commer Res Appl. 2016;17:62–73. doi: 10.1016/j.elerap.2016.03.004. [DOI] [Google Scholar]
- Yang J, Sarathy R, Walsh SM. Do review valence and review volume impact consumers’ purchase decisions as assumed? Nankai Bus Rev Int. 2016;7(2):231–257. doi: 10.1108/NBRI-11-2015-0028. [DOI] [Google Scholar]
- Zhang Z, Ye Q, Law R, Li Y. The impact of e-word-of-mouth on the online popularity of restaurants: a comparison of consumer reviews and editor reviews. Int J Hosp Manag. 2010;29(4):694–700. doi: 10.1016/j.ijhm.2010.02.002. [DOI] [Google Scholar]
- Zhu F, Zhang X. Impact of online consumer reviews on sales: the moderating role of product and consumer characteristics. J Mark. 2010;74(2):133–148. doi: 10.1509/jm.74.2.133. [DOI] [Google Scholar]
Associated Data
This section collects any data citations, data availability statements, or supplementary materials included in this article.
Data Availability Statement
The data supporting this study's findings are available from the corresponding author upon reasonable request.