Abstract
Several studies have investigated links between the gut microbiome and colorectal cancer (CRC), but questions remain about the replicability of biomarkers across cohorts and populations. We performed a meta-analysis of five publicly available datasets and two new cohorts, and validated the findings on two additional cohorts, considering in total 969 fecal metagenomes. Unlike microbiome shifts associated with gastrointestinal syndromes, the gut microbiome in CRC showed reproducibly higher richness than controls (P < 0.01), partially due to expansions of species typically from the oral cavity. Meta-analysis of the microbiome functional potential identified gluconeogenesis and the putrefaction and fermentation pathways to be associated with CRC, whereas the stachyose and starch degradation pathways were associated with controls. Predictive microbiome signatures for CRC trained on multiple datasets showed consistently high accuracy in datasets not considered for model training and independent validation cohorts (average AUC 0.84). Pooled analysis of raw metagenomes showed that the choline trimethylamine-lyase gene was over-abundant in CRC (P = 0.001) identifying a novel relationship between microbiome choline metabolism and CRC. The combined analysis of heterogeneous CRC cohorts thus identified reproducible microbiome biomarkers and accurate disease-predictive models that can form the basis for clinical prognostic tests and hypothesis-driven mechanistic studies.
Introduction
Colorectal cancer (CRC) is the second most common non sex-specific cancer and is responsible for more deaths than any other cancer after lung cancer 1. Because of demographic trends toward an ageing population, the global incidence rate is expected to increase by nearly 80% to 2.2 million cases per year over the next two decades 2. Sporadic CRCs, as opposed to hereditary CRCs, account for approximately 70%–87% of cases 3 and genetics can only explain a small proportion of disease incidence 4. The missing strong link of CRC with genetics points to the potential role of other variables including lifestyle and environmental factors as disease co-determinants. Reported risk factors associated with CRC include age, tobacco and alcohol consumption, lack of physical activity, increased body weight, and diet 5,6. However, many non-genetic risk factors are common to several cancer types and these factors remain largely unsettled for CRC 7,8.
The human gut microbiome - defined as the microbial communities that populate our intestinal tract - is emerging as a relevant factor in human diseases 9,10. Supported by some evidence of carcinogenic mechanisms induced by bacterial organisms 11–13, the gut microbiome has also been hypothesized to play a crucial role in the development of CRC. Studies using 16S rRNA gene amplicon sequencing have led to the discovery of Fusobacterium nucleatum’s association with CRC 14, which was subsequently shown to be causal in animal models of CRC carcinogenesis and progression 15,16. Compared to 16S rRNA gene studies, a smaller number of metagenomic sequencing studies have linked other microbial species and potential functional activities of the gut microbiome to CRC 17–19. However, the reproducibility and predictive accuracy of these high-resolution microbial signatures across cohorts and study design choices remain unclear. The potential use of the gut microbiome as a diagnostic tool for CRC has been proposed 17–21, but not yet validated across multiple independent study populations.
There is thus a need to establish and validate links between the human gut microbiome and CRC carcinogenesis across populations, cohorts, and microbiome tools. Some multi-cohort works have been performed based on 16S rRNA gene studies 22, but this technique has important technical limitations 23. The recent availability of whole-metagenome shotgun datasets of CRC cohorts 17–21 enables a combined multi-population exploration of the CRC-associated microbiome with strain-level resolution 24,25 and meta-analytic predictive approaches 10,26, but the only meta-analysis study performed so far on CRC is affected by overfitting issues 27. It is thus crucial to perform large-scale cross-cohort studies to provide an unbiased and well-powered assessment of the link between CRC and the gut microbiome.
In this study, we have sequenced 140 samples from two different cohorts, performed an integrated analysis combining all current metagenomic CRC datasets available, and assessed prediction accuracies of the gut microbiome for CRC detection across populations, datasets, and conditions.
Results
A meta-analysis of metagenomic datasets to identify links between the gut microbiome and CRC
To identify reproducible relationships between the gut microbiome and CRC, we performed shotgun metagenomic sequencing 28 of the stool microbiome of 140 CRC patients and controls recruited in two cohorts, and analyzed these in the context of 624 additional samples from five publicly available and geographically diverse metagenomic studies. We validated the results on two novel datasets of 60 CRC and 65 controls 29 and 40 CRC and 40 controls (see Methods), respectively. In total, we considered 413 samples from CRC patients, 143 from subjects with adenoma and 413 control samples. Participants from all studies underwent colonoscopy to diagnose CRC, adenoma, or to confirm the absence of disease, with samples collected before diagnosis or beginning of treatment (Suppl. Table 1, Table 1). All datasets were sequenced at high depth except for the Hannigan et al. study 30 (Extended Data 1A, Methods).
Table 1.
Size and characteristics of the large-scale CRC metagenomic datasets included in this study.
| Dataset | Groups (N) | Age (mean +/− s.d.) | BMI (mean +/− s.d.) | Sex F(%)/M(%) | Country | # of reads (x 10^9) |
|---|---|---|---|---|---|---|
| ZellerG_2014 (Zeller et al. 2014) | Control (61) Adenoma (42) CRC (53) |
60.6 +/− 11.4 63 +/− 9.1 66.8 +/− 10.9 |
24.7 +/− 3.2 25.9 +/− 4.1 25.5 +/− 5.2 |
54.1/45.9 28.5/71.5 45.2/54.8 |
France | 9.4 |
| YuJ_2015 (Yu et al. 2015) | Control (54) CRC (74) |
61.8 +/− 5.7 66 +/− 10.6 |
23.5 +/− 3 24 +/− 3.2 |
38.9/61.1 35.1/64.9 |
China | 7.2 |
| FengQ_2015 (Feng et al. 2015) | Control (61)* Adenoma (47) CRC (46) |
67 +/− 6.5 66.5 +/− 7.9 67 +/− 10.9 |
27.6 +/− 3.8 28 +/− 4.7 26.5 +/− 3.5 |
41/59 51.1/48.9 39.1/60.9 |
Austria | 8.3 |
| VogtmannE_2016 (Vogtmann et al. 2016) | Control (52) CRC (52) |
61.2 +/− 11 61.8 +/− 13.6 |
25.3 +/− 4.2 24.9 +/− 4.2 |
28.8/71.2 28.8/71.2 |
USA | 6.9 |
| HanniganGD_2018 (Hannigan et al. 2018) | Control (28) Adenoma (27) CRC (27) |
NA | NA | NA | USA (54) Canada (28) |
0.5 |
| Cohort1 (This study) | Control (24) Adenoma (27) CRC (29) |
67.9 +/− 7.1 62.8 +/− 8.6 71.4 +/− 8.2 |
25.3 +/− 3.5 25.3 +/− 4.1 25.7 +/− 4.1 |
45.8/54.1 40.7/59.3 20.7/79.3 |
Italy | 8.2 |
| Cohort2 (This study) | Control (28) CRC (32) |
57.8 +/− 8.3 58.4 +/− 8.4 |
24.6 +/− 3.8 26.8 +/− 4.3 |
42.9/57.1 28.1/71.9 |
Italy | 5.1 |
| Total |
Control (308)
Adenoma (143) CRC (313) |
-- | -- | -- | -- | 45.6 |
Numbers differed from the original sample numbers (N = 61 instead of 63) reported in the article due to metadata and/or sequence processing issues. NA = Not available.
Meta-analysis shows higher species richness in CRC-associated samples
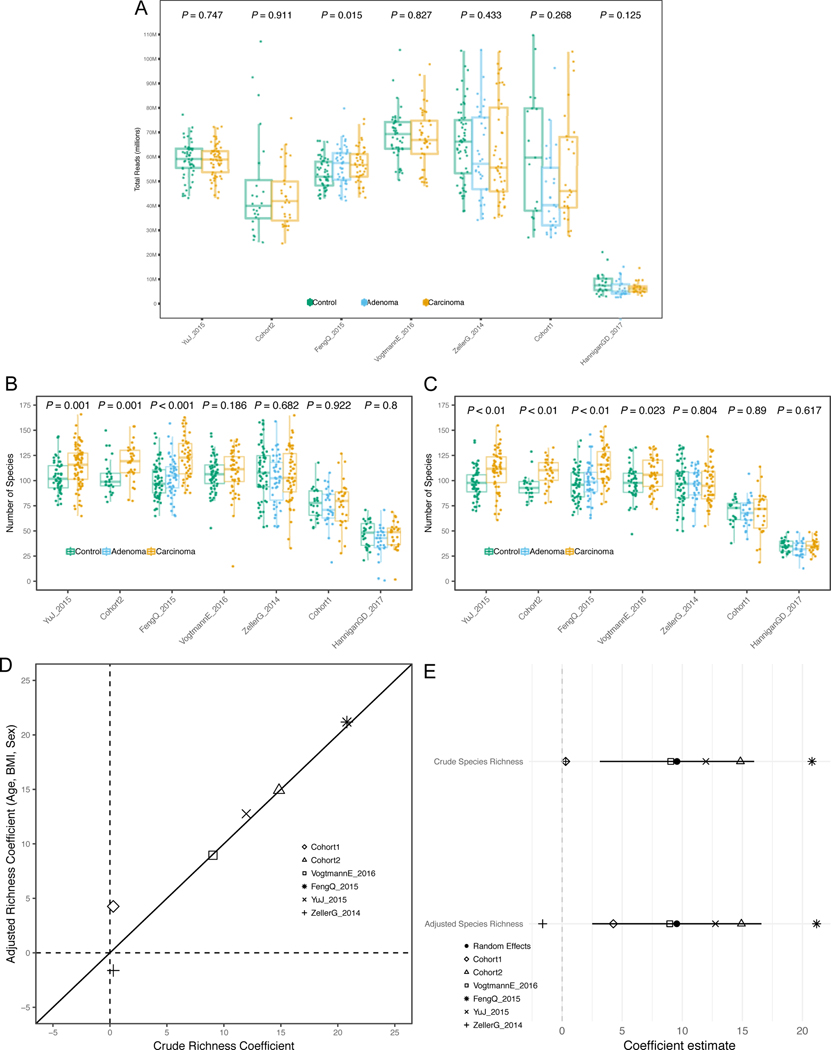
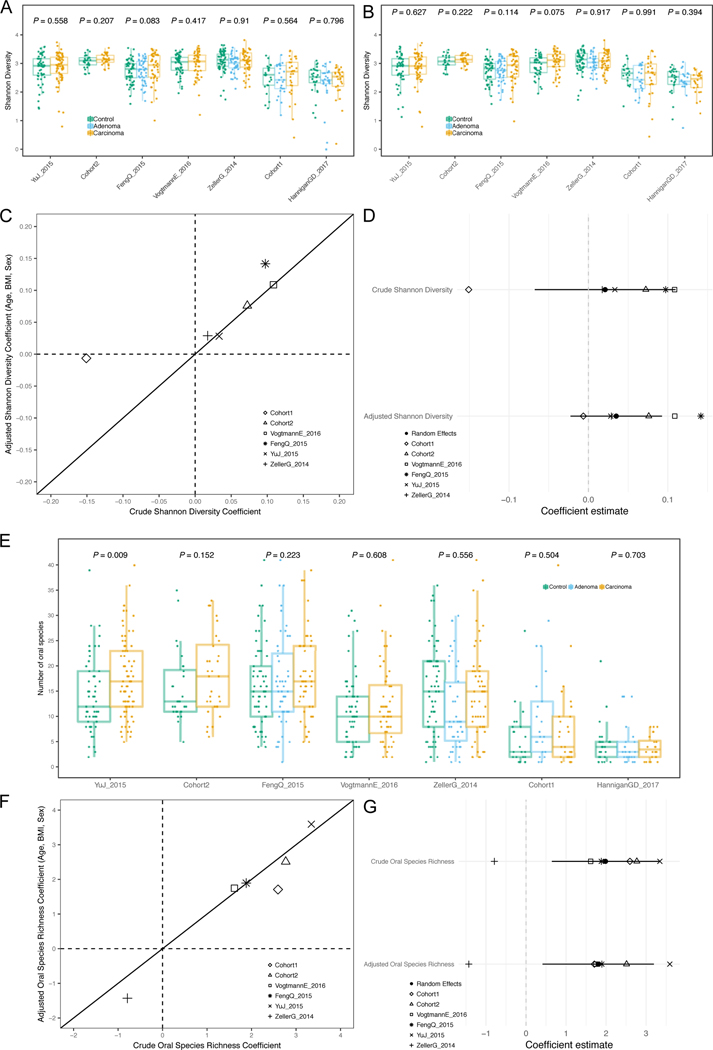
We first tested whether microbial richness and diversity differed between CRC samples and controls, given contrasting current evidence 31–33. In all but one study, the median species richness was higher in CRC samples compared to controls, and the increase was significant in four of the six deeply sequenced datasets (P < 0.05 Extended Data 1B–C). Meta-analysis of standardized mean differences by random effects model for the number of microbial species confirmed the higher number of species in CRC compared to controls (μ=0.5, 95% CI [0.16, 0.85], P = 0.004), although with significant heterogeneity across datasets (I2 = 74.8%, p = 0.0007, Q-test). This difference was not meaningfully affected when controlling for potential confounding by age, BMI, or sex(Extended Data 1D–E). Conversely, we observed no difference in diversity between carcinomas and controls (Extended Data 2A–B). We thus provide strong evidence that the CRC-associated microbiome has a quantitative species distribution which is consistent with healthy controls, but is significantly enriched in the total number of detected microbes.
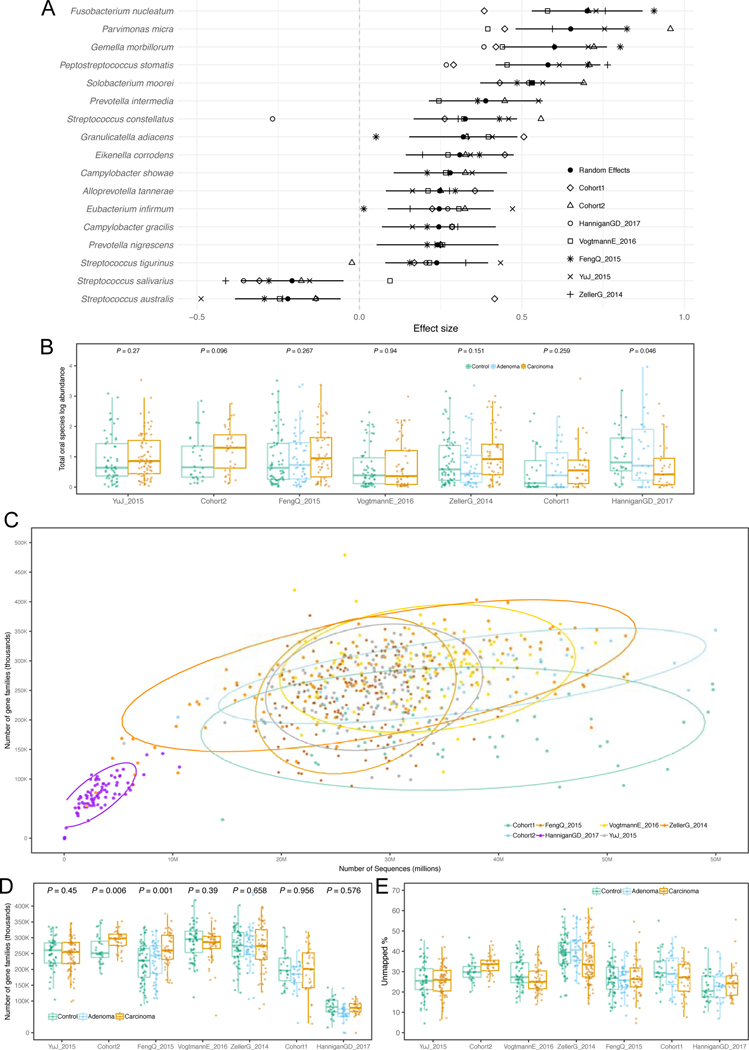
We further tested whether the CRC-associated microbiome possesses more oral cavity-associated species than controls, as previously hypothesized 22,34. Considering the 161 species we identified from multiple existing datasets 35,36 as being typical colonizers of the oral cavity (see Methods), we found increased oral species richness in CRC samples for all but one of the six deeply sequenced datasets compared to controls and the increase was significant in meta-analysis (μ = 0.16, 95% CI [−0.03, 0.35], P = 0.02, Extended Data 2G). Similarly, the total abundance of oral species in the stool microbiome was also significantly higher in CRC patients compared to controls (meta-analysis μ=0.23, 95% CI [0.07, 0.39], P = 0.003). Altogether, greater species richness and abundance may be a sign of an altered gut microbiome in CRC, and it is indicative of an influx of bacterial species originating from the oral cavity.
A panel of microbial biomarkers for CRC is reproducible across cohorts
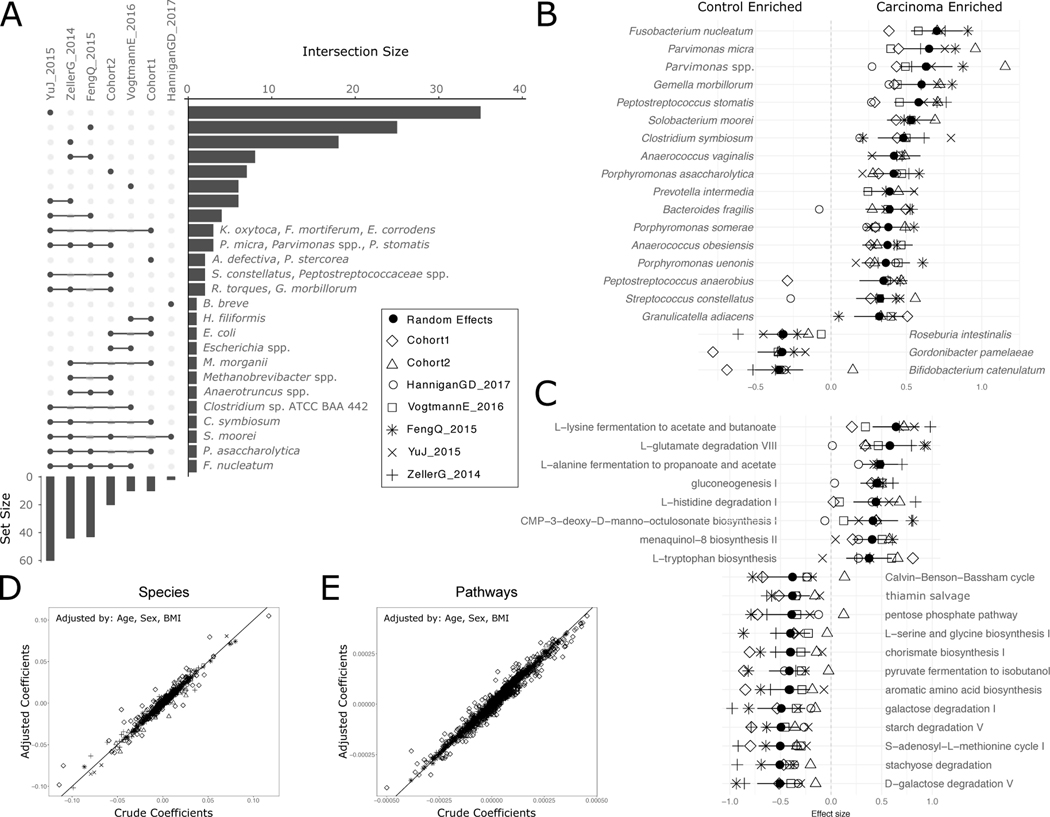
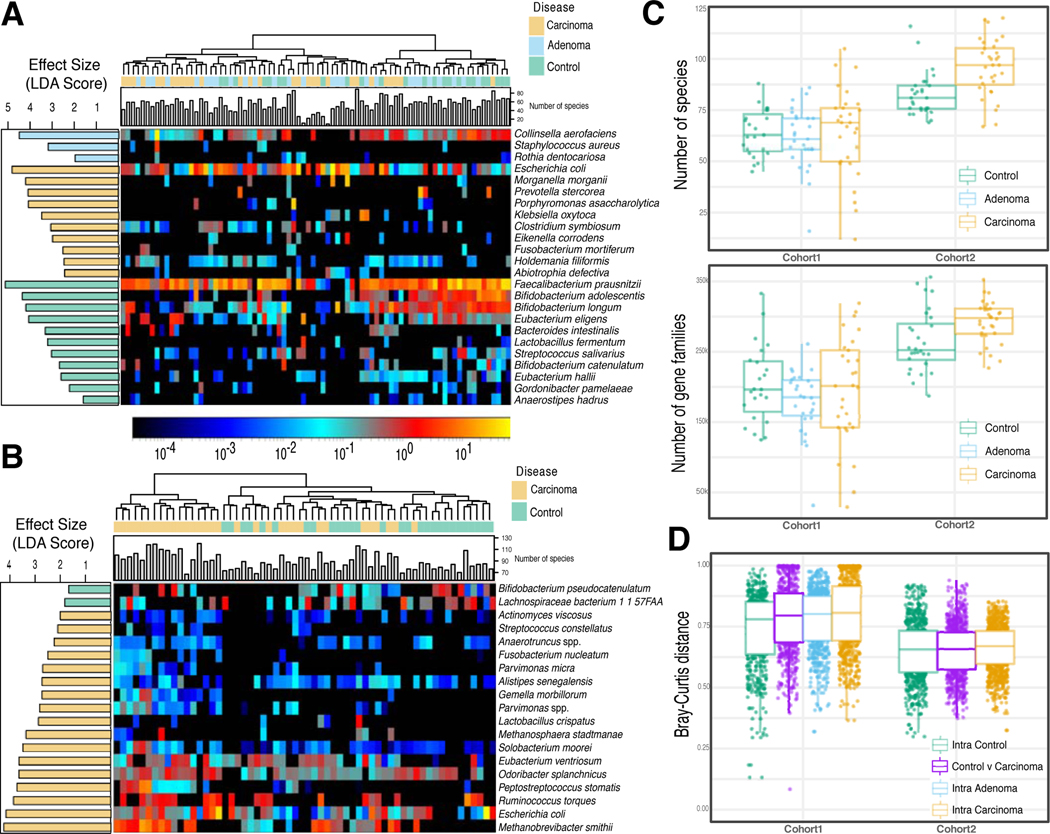
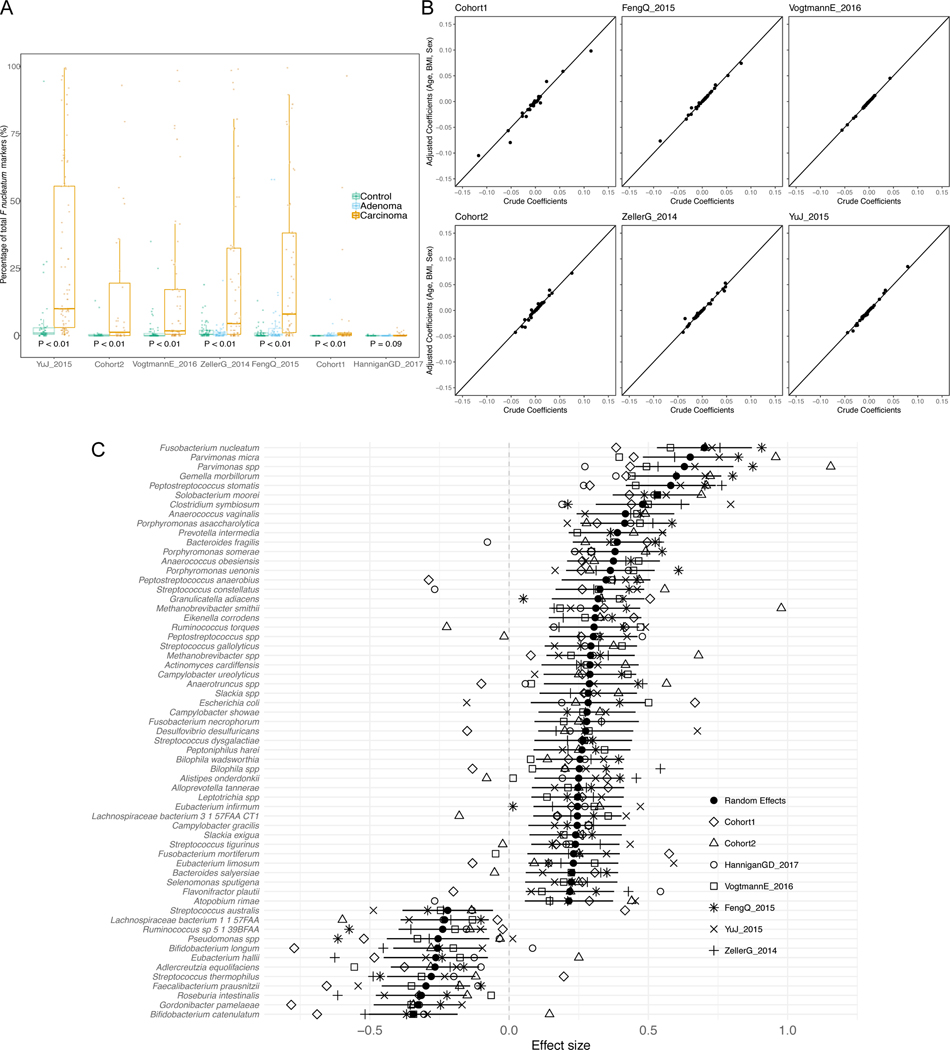
Individual biomarker discovery efforts can be sensitive to technical artefacts and to heterogeneity of factors implicated in microbial shifts in healthy populations, including biogeography, diet, and host genetics 25,37. This is confirmed by the two newly sequenced datasets that have only partially overlapping taxonomic and functional potential biomarkers (Extended Data 3). Even so, several CRC biomarker species were identified by univariate statistics 38 independently in the majority of the datasets: F. nucleatum, Solobacterium moorei, Porphyromonas asaccharolytica, Parvimonas micra, Peptostreptococcus stomatis, and Parvimonas ssp. Other species were identified in fewer datasets or were dataset-specific (Figure 1A, and Suppl. Table 2). F. nucleatum, whose connection with CRC has been extensively reported 14,17–19, had significantly increased abundance in CRC patients in all datasets with adequate sequencing depth, when considering single markers for this species (Extended Data 4A). Some of the cross-cohort CRC biomarker species have already been reported 14,22,34 and many of them are commonly found in the oral cavity (8 out of the 39 total biomarkers found in at least 2 datasets), consistent with the increased oral taxa presence in CRC samples mentioned above.
Figure 1. Reproducible taxonomic and functional microbial biomarkers across datasets when contrasting carcinoma against healthy controls (no adenoma samples considered).
(A) UpSet plot showing the number of taxonomic biomarkers identified using LEfSE on MetaPhlAn2 species profiles shared by combinations of datasets (see Suppl. Table 3 for all single significant associations). (B) Pooled effect sizes for the 20 significant features with the largest effect size calculated using a meta-analysis of standardized mean differences and a random effects model on MetaPhlAn2 species abundances and on (C) HUMANn2 pathway abundances. Bold lines represent the 95% confidence interval for the random effects model coefficient estimate. (D) Scatter plot of crude and age-, sex-, and BMI-adjusted coefficients obtained from linear models using MetaPhlAn2 species abundances. (E) Scatter plot of crude and age-, sex-, and BMI-adjusted coefficients obtained from linear models using HUMANn2 pathway abundances.
We then pooled evidence of differential abundance across datasets by random effects meta-analysis. Among the 26 differentially abundant species at FDR < 0.005, those with the highest effect size were again F. nucleatum, S. moorei, P. asaccharolytica, P. micra and P. stomatis. The meta-analysis additionally identified Clostridium symbiosum, which has been tested as a marker for early CRC detection 39 (Figure 1B). Other differentially abundant species at FDR < 0.05 have not been previously reported in CRC microbiome studies, including Streptococcus tigurinus and Streptococcus dysgalactiae, and 3 different Campylobacter species. We also confirmed Gemella morbillorum and Streptococcus gallolyticus to be relevant biomarkers, as previously suggested in smaller cohorts 18,40. In contrast, only 12 species were associated with the control population in the meta-analysis and only four were significantly enriched for the same populations in at least three datasets. Control-associated species with the highest effect sizes were Gordonibacter pamelae and Bifidobacterium catenulatum (Figure 1B, Suppl. Table 2; Extended Data 4C), which are generally considered beneficial microbes and have been used as probiotic supplements 41. Adjustment for potential confounding by host characteristics did not meaningfully affect crude estimates in the meta-analysis (Figure 1D, Extended Data 4B). The substantially higher number of species enriched in CRC than in controls (49 vs. 12), even when focusing only on species with putative oral origin (15 vs. 2, Extended Data 5A), points to the existence of a reproducible taxonomic signature of the CRC-associated microbiome.
Functional potential of the microbiome was also significantly associated with CRC samples when compared against healthy controls. We found overall increased richness of UniRef gene families 42 in CRC samples in two datasets, with percentages of unmapped reads ranging between 20% and 40% (Extended Data 5E). We found 33,840 of the 2,479,274 single gene families detected at least once to be associated with CRC and 30,475 associated with controls (FDR < 0.05, 9,154 and 7,115 differential gene families at FDR < 0.005 respectively). We further observed 136 out of 590 metagenomically reconstructed microbial functional pathways to be CRC-associated, and only 37 associated with controls (Suppl. Table 3). Among the most differentially abundant pathways (Figure 1C) that are at worst just minimally affected by potential confounding factors (Figure 1E), we found starch, stachyose, and galactose degradation to be associated with controls. These associations could indicate how potentially diet-associated changes in the functional repertoire of the microbiome can influence host conditions. The CRC-associated microbiome showed an association with gluconeogenesis and with capacity for uptake and metabolism of amino acids via putrefaction and fermentation pathways (Suppl. Table 3–4). These included those pathways responsible for the conversion of different amino acids to tumor-promoting compounds 19,43, such as polyamines (e.g. L-arginine and L-ornithine degradation to putrescine) and ammonia (L-histidine and L-arginine degradation, and L-lysine and L-alanine fermentation to acetate, butyrate and propionate). These pathways (Figure 1C) and the set of species described above (Figure 1A,B) thus constitute a collection of microbiome biomarkers that is reproducible across cohorts.
Predicting CRC from single metagenomic datasets in independent cohorts leads to reduced accuracy
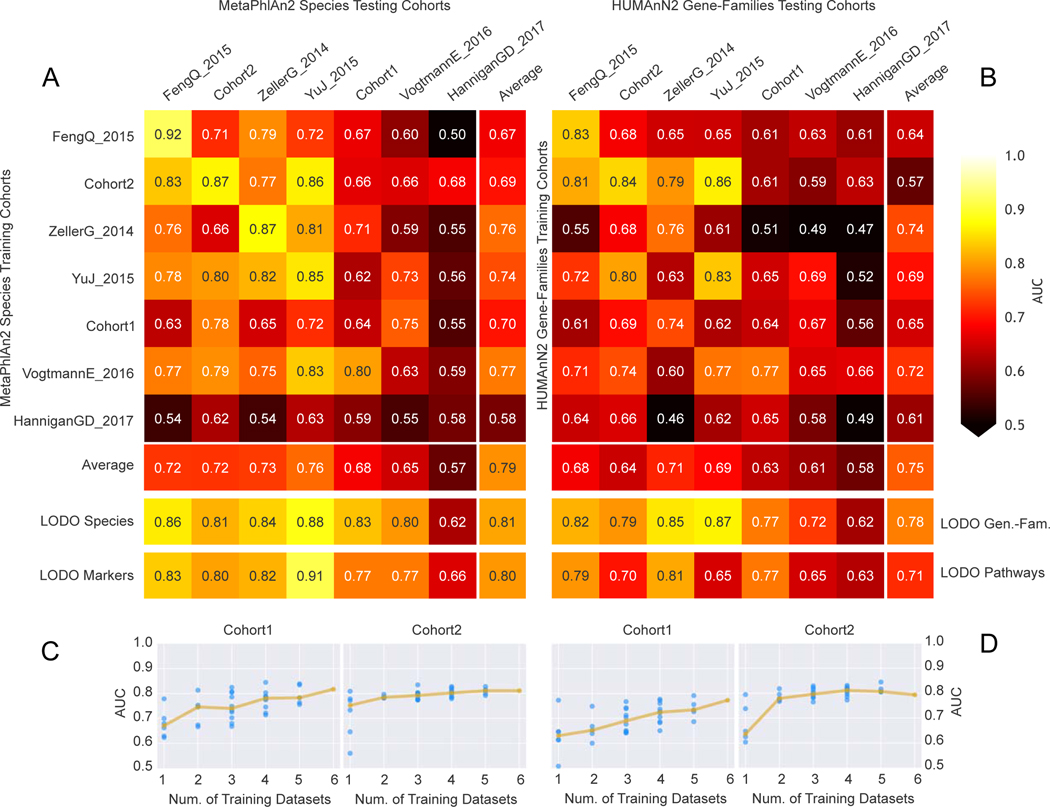
To test the hypothesis that the stool microbiome could be used as a reproducible CRC pre-screening tool, we performed intra-cohort, cross-cohort and combined-cohort prediction validation on the overall set of 621 CRC and controls samples using a Random Forest classifier (Table 1). In intra-cohort cross-validation using species-level taxonomic relative abundances, we observed performances ranging from 0.92 to 0.58 AUC score, with an average in the deeply sequenced datasets of 0.81 AUC (Figure 2A). When using the functional potential of the gut microbiome by means of pathway abundances, we observed decreased single dataset cross-validation accuracies, with the exception of our Cohort1 (maximum 0.82 AUC, average 0.71 AUC, Extended Data 6A). The profiling of the more fine-grained UniRef90 gene family abundances improved the predictions, with AUCs reaching 0.84 AUC for Cohort2 and an average of 0.77 AUC in the deeply sequenced datasets (Figure 2B). These results show that, while cross validation AUCs can be high for predicting CRC in some datasets, they are highly variable and dataset dependent.
Figure 2. Assessment of prediction performances of the gut microbiome for CRC detection within and across cohorts.
(A) Cross prediction matrix reporting prediction performances as AUC values obtained using a Random Forest (RF) model on species-level relative abundances (see Methods). Values on the diagonal refer to 20 times repeated 10-fold stratified cross validations. Off-diagonal values refer to the AUC values obtained by training the classifier on the dataset of the corresponding row and applying it on the dataset of the corresponding column. The Leave-One-Dataset-Out (LODO) row refers to the performances obtained by training the model on the species-level abundances and MetaPhlAn2 markers using all but the dataset of the corresponding column and applying it on the dataset of the corresponding column. See Extended Data 6 for the marker cross-study validation matrix. (B) Cross prediction matrix of AUC values obtained using HUMANn2 UniRef90 gene-family abundances and HUMANn2 pathway relative abundances. See Extended Data 6 for the pathway cross-study validation matrix. (C) Prediction performances for the two Italian cohorts at increasing numbers of external datasets considered for training the model. The dark yellow line interpolates the median AUC at each number of training datasets considered. See Extended Data 7 for the plots referred to the other testing datasets. (D) Prediction performances at increasing number of datasets in the training, using HUMANn2 UniProt90 gene-family abundances. See Extended Data 7 for the plots referred to the other testing datasets.
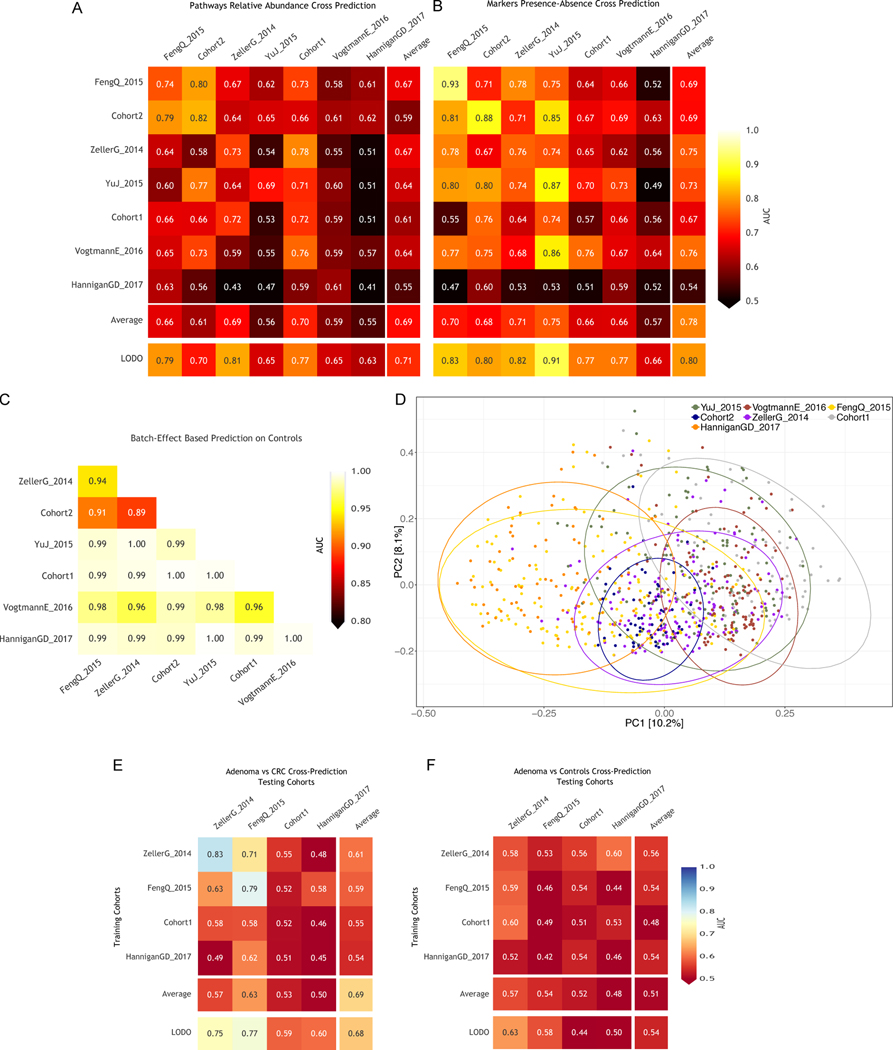
We then tested whether and how much the microbial signatures of CRC remained predictive across distinct datasets and cohorts. To this end, we trained the classifier on each single “training” dataset and applied the model on each distinct “testing” dataset. For most datasets this led to decreased AUC values when compared to single cross validation AUCs, and AUCs showed a high variability across cohorts (minimum 0.5 and maximum 0.86 cross dataset AUC). These results were consistent when using either pathway or gene family-abundances as predictors (Extended Data 6 and Figure 2B). Overall, we highlight a poor transportability of the microbiome signature from one dataset to the other and experimental choices 44 and cohort or population characteristics 25, may explain the reduced cross-study predictability when considering single datasets to train the model (Extended Data 6C–D).
Pooling of training cohorts substantially improves prediction across datasets
To overcome the limitations of training on single datasets (Suppl. Table 5), we performed a Leave-One-Dataset-Out (LODO) analysis 45 in which classifiers were trained on six datasets combined, and validated on the left-out dataset, for each dataset in turn. For taxonomic profiles, this approach improved both AUC values and inter-dataset consistency, producing AUCs ≥ 0.80 (average 0.84 s.d. 0.03) for all six deeply sequenced datasets (Figure 2A). Predictors based on clade-specific markers also produced high, albeit more variable AUC values, outperforming taxonomic profiles in some datasets (Extended Data 6B). Gene families achieved slightly reduced performances, whereas pathway abundances produced substantially less accurate predictions (Figure 2B). The technical and host population diversity embedded in these training meta-cohorts may be crucial in improving the generalizability of classifiers, as we found this LODO approach to be substantially and consistently more informative than a single-dataset cross-validation, and independent investigations found similarly high LODO performances using different metagenomic profiles and machine learning tools 29.
The model trained on taxonomic or functional features was also shown to capture the above whole-microbiome biomarkers because the direct inclusion of alpha-diversity metrics, oral-species abundance, and a measure of metagenome mappability did not provide substantial improvements (mean 0.83, s.d. 0.03 for the deeply sequenced datasets when using the taxonomic model). However, based on the performance and variability of the predictive models across datasets, we recommend using species-level microbial abundance as the main feature set for CRC status prediction in a LODO setting.
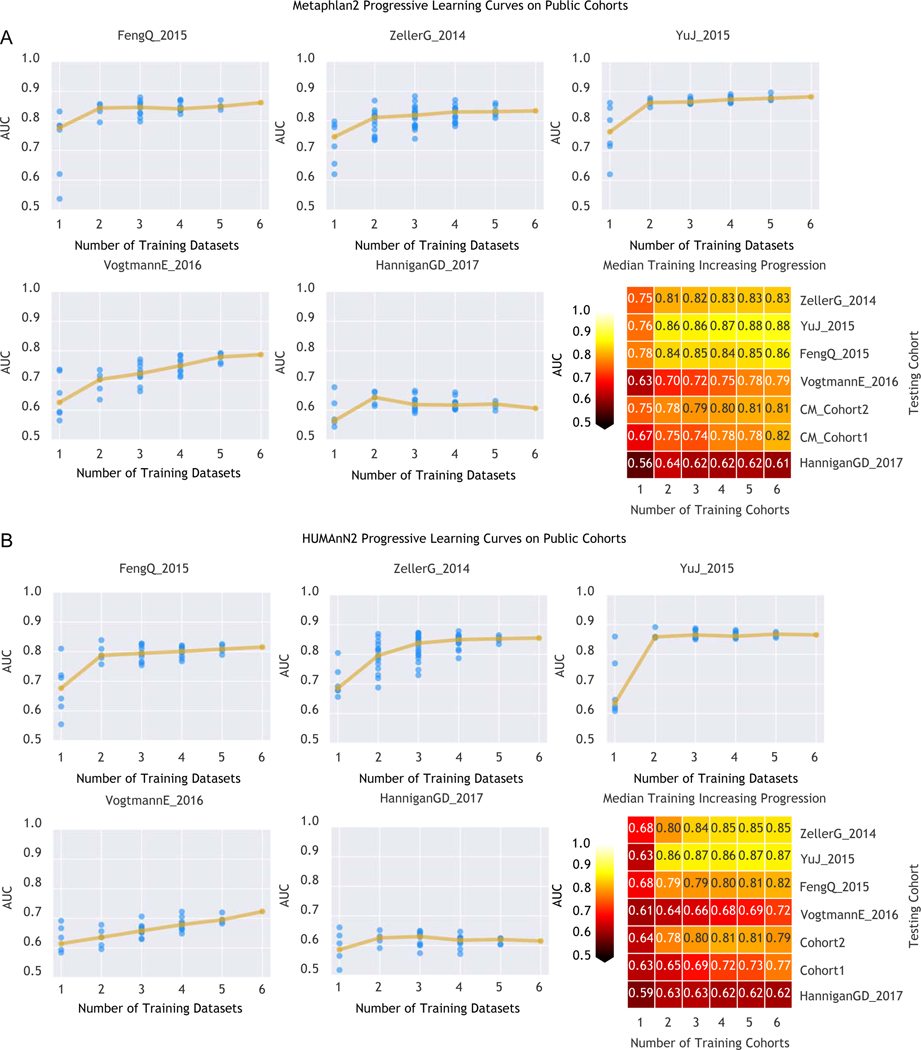
To assess the relation between population diversity in the training meta-cohort and prediction performance, we considered increasingly larger subsets of the available training cohorts. AUC values sharply increased when moving from one to two training datasets (10% to 13% median AUC improvement depending on the features considered in the model, Extended Data 7) with less marked improvements at further dataset additions (Figure 2C–D). Large and heterogeneous combined training sets thus generate improved accuracy for identifying CRC cases in independent metagenomic datasets.
Accurate predictive models using a minimal microbial signature
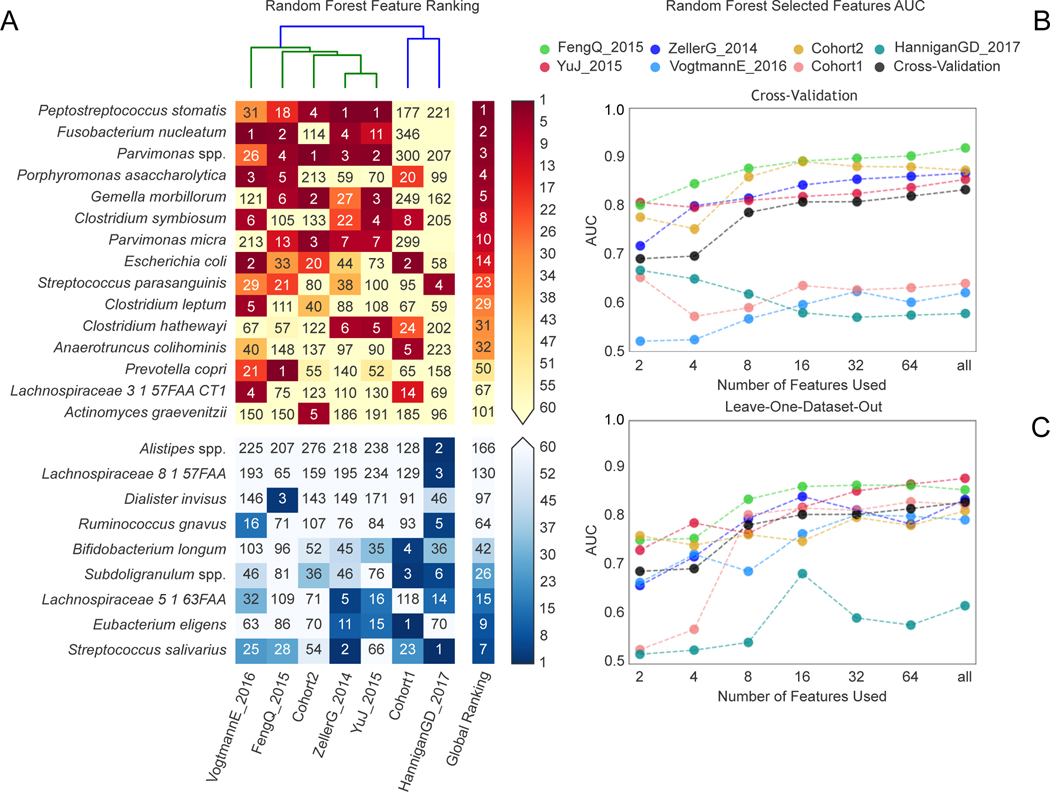
The predictive CRC-associated microbiome signatures identified above considered all observed species and gene functions and would thus be impractical for clinical application without whole microbiome profiling. We thus sought to identify a minimal set of highly predictive microbial features by exploiting the internal feature ranking of the Random Forest classifier 10. We found that P. stomatis was the species with the highest average rank. As expected, other CRC-associated species such as F. nucleatum, Parvimonas ssp., P. asaccharolytica, G. morbillorum, Clostridium symbiosum and P. micra were also crucial to prediction accuracy (Figure 3A) with the top seven ranked species for CRC detection amongst those with the largest effect sizes in the meta-analysis. Very few species were ranked high in the learning models, further highlighting that successful discrimination is achieved by CRC-specific rather than control-specific microbial features.
Figure 3. Ranking relevance of each species in the predictive models for each dataset and identification of a minimal microbial signature for CRC detection.
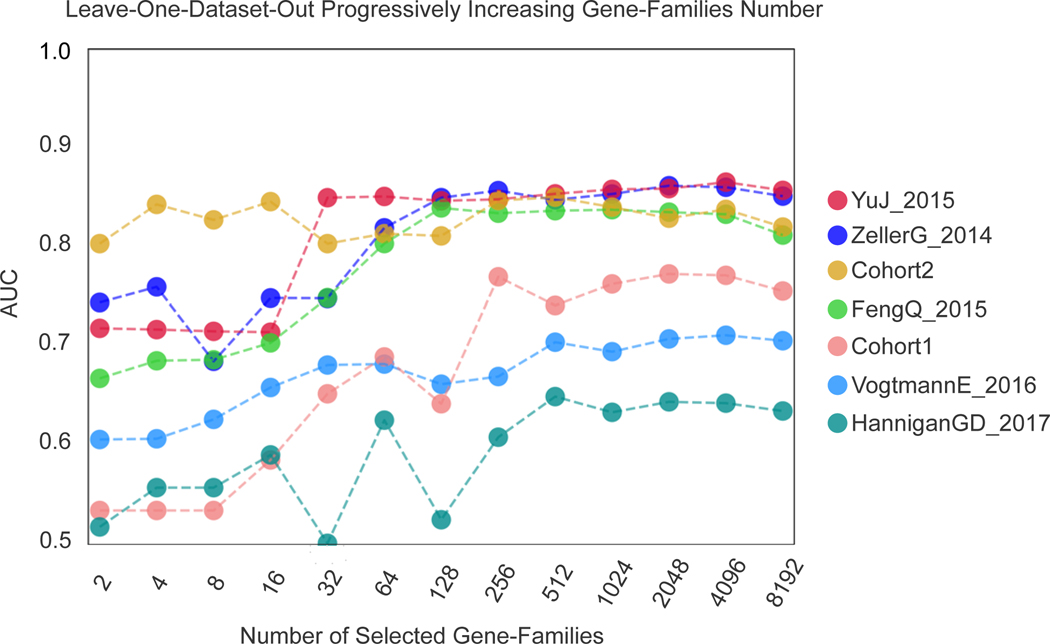
(A) The importance of each species for the cross-validation prediction performance in each dataset estimated using the internal RF scores. Only species appearing in the five top ranking features in at least one dataset are reported. Prediction performances at increasing number of microbial species obtained by re-training the RF classifier on the N top ranked features identified with a first RF model training in a cross-validation (B) and LODO-setting (C). The rankings are obtained excluding the testing dataset to avoid overfitting.
To evaluate how many microbial species or gene families are necessary to achieve prediction scores comparable to those obtained using the full set of features, we computed AUC values at increasing numbers of features. Feature ranking was performed internally to each training fold to avoid overfitting. By applying this approach to all datasets (Figure 3B–C), we found that using as few as 16 species achieved CV AUC >0.8 for the majority of the datasets, with little improvement from using all remaining species (2% improvement in the mean AUC value). We also found that using only 64 gene families achieved prediction values >0.8 for the same datasets, and that using all 8,192 gene families improved AUC only slightly (2% improvement -Extended Data 8). Therefore, these results suggest that a stool-based diagnostic test using genetic markers targeting a limited number of microbial species or genes would serve as a promising clinical tool.
Microbiome signatures for adenomas are only partially predictive
We assessed the ability to discriminate adenomas from controls or carcinomas, using 27 newly sequenced adenoma-associated samples and 116 adenoma-associated samples from available studies (Table 1). Adenomas could be distinguished from CRC patients with lower accuracy than controls (mean AUC 0.69 versus 0.79, Extended Data 6E–F) and there are only eight species that differentiate adenoma patients from carcinoma patients in the meta-analysis (FDR < 0.05). Seven of these eight biomarkers are in common with the comparison between carcinoma patients and healthy individuals, and the LODO approach did not improve discrimination of adenomas from CRC (average AUC 0.68). Moreover, we found that no dataset could accurately predict adenomas from control samples (maximum AUC 0.58, minimum 0.46), even when using a LODO approach (average AUC 0.54). In the meta-analysis, no species were significantly different when contrasting samples from patients with adenomas and healthy controls. These results reinforce previous findings 18,19 that the adenoma-associated stool microbiome closely resembles that of the healthy gut.
Increased abundance of choline TMA-lyase encoding genes in CRC
Microbiome-derived metabolites and specifically polyamines have been implicated in carcinogenesis both in animal models and in humans 43. We chose to focus on trimethylamine (TMA), an amine produced by bacteria from choline and carnitine, because it has been shown to play a role in complex diseases such as atherosclerosis and primary sclerosing cholangitis 9,46. Since dietary components have been linked with CRC risk 5,6, we hypothesized that the TMA-producing potential of the human gut microbiome could also be associated to CRC 47. To test this hypothesis, we considered the genes belonging to the main TMA-synthesis pathways to reconstruct and quantify the presence of such genes in the CRC-associated metagenomes. The main genes associated with TMA-synthesis are those encoding the choline TMA-lyase (cutC), the L-carnitine dioxygenase (yeaW) and the L-carnitine/gamma-butyrobetaine antiporter (caiT) and we identified them in 923, 5,185 and 5,709 available bacterial genomes, respectively.
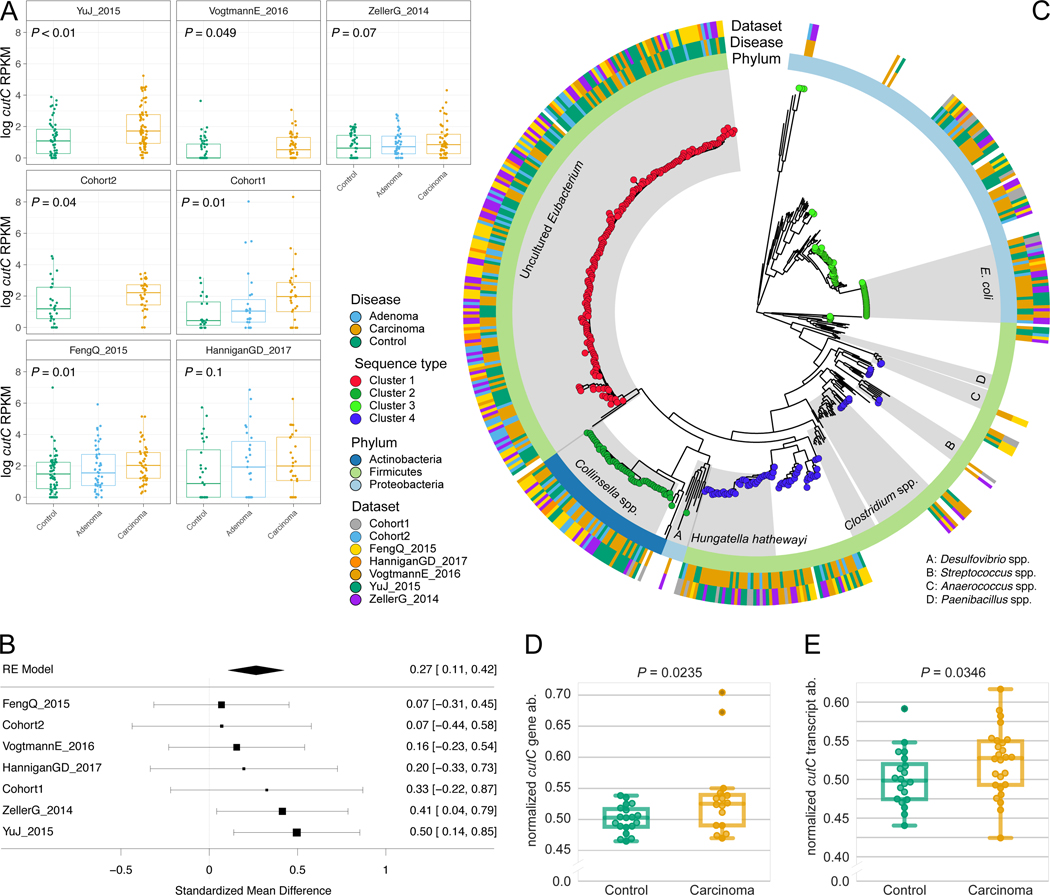
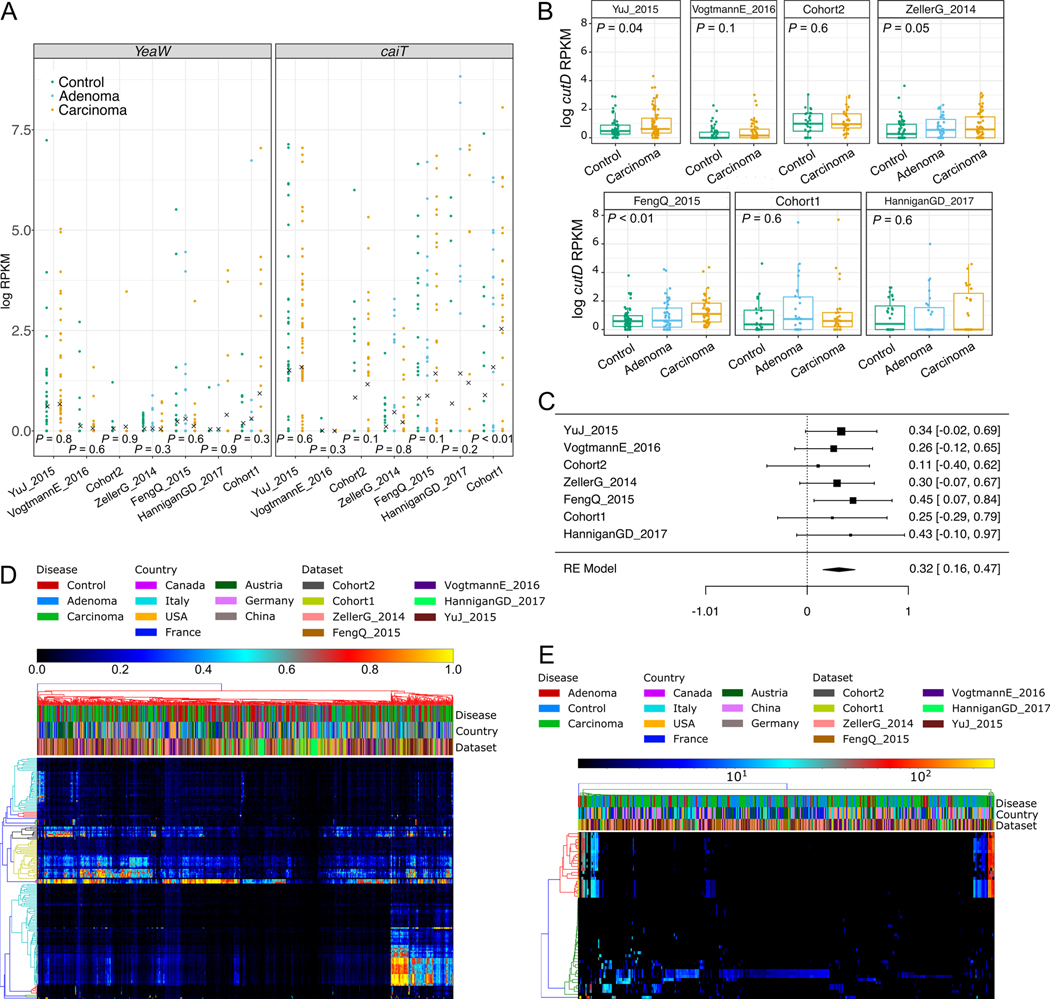
Screening the 7 CRC-associated metagenomic datasets, we found that only one of them had a significant increase of caiT in CRC samples compared to controls, whereas no significant differences were detected for yeaW (Extended Data 9A). However, we found increased abundance of cutC in CRC samples compared to controls in all seven datasets (P < 0.05 by Wilcoxon Rank Sum test on RPKM abundances for five datasets, Figure 4A). Meta-analysis indicated an overall strong association with no evidence of heterogeneity (P = 0.001, μ = 0.27, 95% CI [0.1, 0.42], I2 = 4.2%, Q-test = 0.65, Figure 4B). We also analyzed the abundance of the gene encoding the choline TMA-lyase-activating enzyme (cutD), finding a significant increase in CRC (meta analysis P = 0.001, μ = 0.32, 95% CI [0.16, 0.47], I2 = 0%, Q-test = 0.96, Extended Data 9B–C). These results indicate that TMA production might happen preferentially via choline degradation, and not via carnitine, and could substantially affect the amounts of TMA and trimethylamine oxide (TMAO) in an individual 48. Intermediate levels of cutC in adenomas (Figure 4A) is further suggestive of a TMA action along the adenoma-carcinoma axis. We validated the increased cutC gene abundance in CRC by qPCR 49 on a subset of samples from Cohort1 with enough DNA left after sequencing, and confirmed the metagenomic findings (one-tailed Wilcoxon signed rank test P = 0.024, Figure 4D). Further quantification of cutC transcript abundance from the co-extracted RNA in the same dataset also pointed to an over-expression of this gene in CRC (P = 0.035, Figure 4E).
Figure 4. Choline TMA-lyase gene cutC and its genetic variants are strong biomarkers for CRC-associated stool samples.
(A) Distribution of reads per kilobase million (RKPM) abundances obtained using ShortBRED for the choline TMA-lyase enzyme gene cutC. P-values were computed by two-tailed Wilcoxon Signed-Rank tests comparing values between controls and carcinomas for each dataset. (B) Forest plot reporting effect sizes calculated using a meta-analysis of standardized mean differences and a random effects model on cutC RPKM abundances between carcinomas and controls. (C) Phylogenetic tree of sample-specific cutC sequence variants identified four main sequence variants. Tips with no circles represent cutC sequence variants from genomes absent from the datasets. Taxonomy was assigned based on mapping against existing cutC sequences (criteria of 80% coverage, >97% identity and minimum 2,000nt alignment length). (D) qPCR validation of cutC gene abundance and (E) cutC transcript abundance (normalized by total 16S rRNA gene/transcript abundance) on a subset of DNA samples from Cohort1. qPCR validation P-values are obtained by 1-tail Wilcoxon Signed-Rank test.
We further explored the role of cutC in the gut microbiome by reconstructing sample-specific sequence variants using a reference-aided targeted assembly approach (see Methods). We found a large sequence divergence for the gene encoding this enzyme that is known to occur in single copies in the genomes 49 and we identified four main sequence variants that are associated with the taxonomic structure (Figure 4B, Extended Data 9C–D, 10A–B). Interestingly, the most prevalent (46.5%) cutC sequence type belonged (>95% identity over the full lenght of the gene) to an unknown species that was only recently assembled from metagenomics 50 and assigned to species-level genome bin (SGB) ID 3957. This candidate species comprises 56 metagenomically-assembled species 50 and is placed within the Lachnospiraceae family, but the missing genus assignment confirms that several microbes remain under-characterized in the human microbiome. This cutC variant was associated with non-CRC samples (OR 0.38, 95% CI [0.25, 0.57], P = 0.0001, Fisher Test), whereas cutC sequence types mostly belonging to Hungatella hathewayi and Clostridium asparagiforme (Firmicutes) were significantly CRC-associated (OR 2.14, 95% CI [1.29, 3.56], P = 0.004, Fisher test), as were sequence types belonging to Klebsiella oxytoca and Escherichia coli (OR 1.85, 95% CI [1.13, 3], P = 0.02, Fisher Test - Figure 4B). Altogether, these novel findings highlight that sequence variants of cutC can be strongly associated with disease, potentially because of corresponding differences in the efficacy of choline degradation and TMA production.
Additional independent validation of predictive models
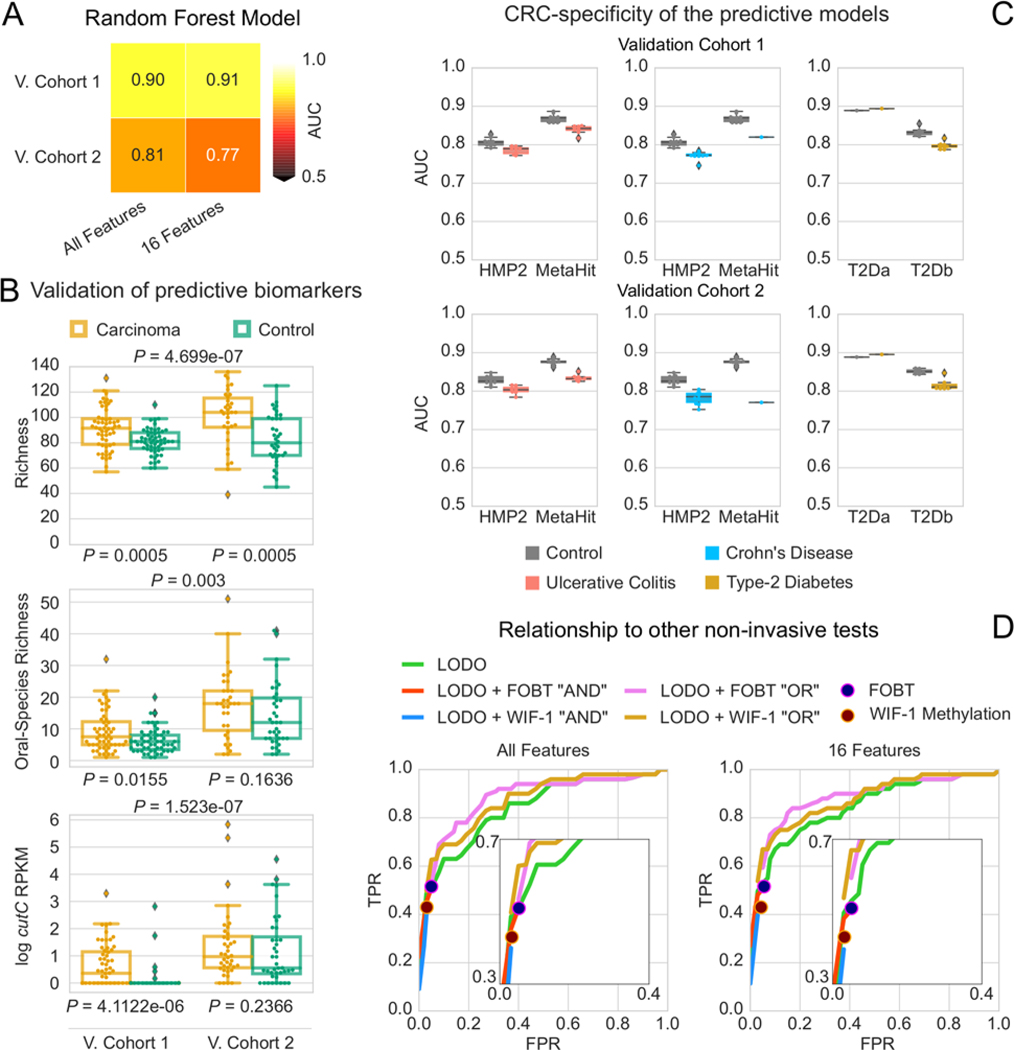
To further validate our meta-analysis results, we considered two additional independent metagenomic cohorts from Germany 29 (Validation Cohort1) and Japan (Validation Cohort2) comprising a total of 100 CRC patients and 105 controls (see Methods). The metagenomic predictive model was confirmed to be highly accurate on these new cohorts (Figure 5A) with an AUC of 0.90 and 0.81 for the German and Japanese cohorts respectively, when using the species-level taxonomic abundance model. Species newly associated to the CRC microbiome such as Streptococcus tigurinus and Streptococcus dysgalactiae were confirmed to have higher prevalence in CRC than in controls In the two validation datasets (blocked Wilcoxon test 51 P = 0.049 and P = 0.011 for S. tigurinus and S. dysgalactiae, respectively). Enrichment in the CRC-associated microbiome of these two species was confirmed also by the analysis of additional metagenomic datasets of IBD 52 and type-2 diabetes 53,54 in which the prevalence of S. tigurinus was always below 10% in both cases and controls, whereas S. dysgalactiae was never detected in these additional datasets. We also confirmed species richness to be significantly higher in CRC (P = 0.0005 for both validation datasets after rarefaction at the 10th percentile, Figure 5B) as well as richness of oral microbial species in the rarefied samples (blocked Wilcoxon test 51 P = 0.003), and the abundance of the gene encoding the choline TMA-lyase enzyme cutC in CRC (P < 1e-6).
Figure 5 -. Clinical potential and validation of the predictive biomarkers.
(A) Prediction performance of the taxonomic models trained on the 7 datasets of Table 1 and applied on the new validation cohorts confirmed the strong reproducibility of metagenomic models for CRC across cohorts when sufficiently large training cohorts are available. Feature ranking of the 16-species model are obtained the testing cohort to avoid overfitting. (B) Species richness, rarefied oral species richness, and cutC gene abundance (RPKM) are confirmed to be strong biomarkers of CRC in the validation datasets 29. P-values underlying the panels refer to one-tailed Wilcoxon Signed Rank test; P-values overlying the panels refer to the one-sided permutation-based Wilcoxon-Mann-Whitney tests, blocked for cohort. (C) Prediction performances as AUC values on the validation cohorts when adding external set of case and controls samples from metagenomic cohorts of diseases other than CRC (Crohn’s disease, ulcerative colitis, type-2 diabetes). (D) Assessment of the potential of microbiome-based prediction models in comparison and in combination with current non-invasive clinical screening tests. Models integrating our LODO machine learning approach with the FOBT or the Wif-1 Methylation tests are termed OR and AND, depending on whether only one or both need to be positive for the combined test to be positive.
CRC-specificity of microbiome predictive models
We performed additional experiments to validate the discriminative power of the above microbial signatures specifically for CRC and not for other potentially microbiome-linked disease conditions. To this end, we first considered 13 additional fecal samples sequenced from patients that underwent colonoscopy in our Cohort1 that were originally discarded because the final diagnosis pointed at diseases other than adenomas or carcinomas such as ulcerative colitis, Crohn’s disease, uncategorized colitis, and diverticular diseases. These were distinguishable from CRC samples based on the taxonomic model (0.78 cross-validation AUC, 0.80 AUC using only 16 species), and only slightly decreased the AUC of the model trained on all the other datasets when they were added to the non-disease (i.e. healthy) category (from 0.83 to 0.79 in AUC). We then expanded this analysis to diseases for which at least two distinct large metagenomic datasets are available in the public domain and this includes ulcerative colitis (UC) and Crohn’s disease (CD) 52,55 as well as non-GI diseases such as type-2 diabetes 53,54. For this purpose we added samples randomly drawn from each of the case and control conditions of these additional disease cohorts to the control class of the new validation cohort and recorded the variations in AUCs when attempting to predict CRC (see Methods). By comparing the AUCs obtained when adding non-CRC external cases and when adding the corresponding external controls, we found for both validation cohorts a small decrease in prediction accuracy for both UC (3% and 4% for Validation Cohort1 and Validation Cohort2, respectively; Figure 5C) and CD (5% and 9%, for Validation Cohort1 and Validation Cohort2, Figure 5C), pointing to a limited effect on the CRC model of samples from these two diseases. For type-2 diabetes we observed an increase in the predictive power in one dataset 53, and a decrease in the other 54 in both validation datasets, and the CRC model always remained highly predictive (AUC ≥ 0.80). Altogether, these results point at the existence of a clear microbiome signature of CRC which is distinct from other relevant diseases with a gastrointestinal component.
Relationship to currently available non-invasive clinical screening tests
To assess the potential of microbiome-based prediction models in comparison and in combination with currently used non-invasive clinical screening tests, we considered the Fecal Occult Blood Test (FOBT) and the Wif-1 Methylation test available for 110 samples of the ZellerG_2014 cohort 19. The LODO microbiome model tested on this dataset proved to be slightly superior to the FOBT at multiple combinations of specificity and sensitivity levels (Figure 5D) and on par with the Wif-1 Methylation test. Considering the LODO model predictions and the FOBT together in the same test improves the sensitivity/specificity trade-off at high specificity levels when the integration is based on having at least one predictor positive, and at relatively lower specificity levels when requiring both predictors to be positive (Figure 5D). Integrating the microbiome model with the Wif-1 Methylation test results in similar performances, and the use of the reduced microbiome model with only 16 species generally improves the results (Figure 5D). We thus provide evidence for the potential clinical value of microbiome predictive models especially when considered together with other available non-invasive clinical tests.
Discussion
In the present study, we comprehensively assessed the CRC-associated gut microbiome and its ability to distinguish newly diagnosed CRC patients from tumor-free controls. Our study was performed across multiple datasets and populations, through a combined analysis of fecal CRC metagenomes from four previously unpublished cohorts and five publicly available datasets. Whereas direct specific host-microbe interactions have been shown to cause certain malignancies in vitro and in vivo animal models 11–13,56 and genotoxic determinants such as colibactin tend to be over-represented in the analyzed datasets 29, indirect metabolite-mediated mechanisms may be more important to the development of carcinomas although causality relations need to be tested. In our analysis, we indeed found a reproducible panel of microbiome species (Figure 1), whole microbiome characteristics, and strain-level biomarkers (Figure 4) beyond the validated mechanisms of specific variants of Escherichia coli 11,56 and Bacteroides fragilis 56. We found that the gut microbiome in CRC has greater richness than controls, partially due to the presence of oral cavity-associated species rarely found in healthy guts, challenging the widespread assumption that decreased alpha-diversity is generally associated with intestinal dysbiosis 57,58.
The identification of reproducible microbial biomarkers for CRC may enable the design of non-invasive diagnostic tools. We developed machine learning models able to distinguish between carcinoma patients and controls with an average performance above 0.84 AUC when validated on datasets excluded from the training of the model (Figure 2A). Importantly, these performances are quite independent of specific methodological choices given that complementary investigations 29 using different metagenomic profilers and machine learning approaches achieved very similar results. Further increase in prediction performance can be achieved using larger datasets (n > 1,000) rather than different methodologies (Figure 2C–D, Figure 5C), and the combination of a microbiome model with other clinical tests and patient risk factors could substantially improve this diagnostic accuracy (Figure 5D). Current clinical pre-colonoscopy screening tests (e.g. FOBT, WIF-1) remain cheaper, but the microbiome-based CRC prediction models enable a very high diagnostic potential which increases with the number of microbes or microbial genes used, with single biomarkers being much inferior to multi-featured diagnostic models. However, nearly maximal accuracy was achieved with as few as 15 to 25 microbes (Figure 3B–C) or a few hundred genes (Extended Data 8), potentially enabling inexpensive clinical microbiological tests to be performed on stool. Prospective studies of these biomarkers are needed to establish whether they can identify individuals at elevated risk of CRC and provide the possibility of disease prevention.
The diversity and subject-specificity of the human gut microbiome is not yet fully uncovered, with many microbial genes having unknown function, and with strain-level diversity that is missed by many current analysis pipelines 50. Large scale shotgun metagenomics can begin to overcome these limitations, as shown here by the novel identification of a link between CRC and the microbial pathway producing trimethylamine from choline 48. The gene encoding for the key enzyme for this pathway, the CutC choline TMA-lyase, is both more overall abundant and expressed in the gut microbiomes of carcinoma patients, with specific variants of cutC characterizing controls, adenomas, and carcinomas (Figure 4). TMA-producing choline lyases have been found to be associated with atherosclerosis 9, and higher plasma trimethylamine oxide and choline levels have been reported to be correlated with CRC risk 59,60. We highlighted the importance of strain-level gene resolution in understanding any potential carcinogenic role of cutC. CRC-associated variants mostly originated from Hungatella hathewayi, Clostridium asparagiforme, Klebsiella oxytoca, and Escherichia coli, whereas no significant enrichment was detected for a cutC variant carried by a unexplored recently discovered candidate species in the Lachnospiraceae family 50. Thus, genetic variants in key microbial genes involved in choline-induced TMA production by the gut microbiome are a plausible and novel potential mechanism for colorectal carcinogenesis. Other partially diet-dependent microbiome factors can contribute to promote carcinogenesis, and we found in our parallel work that genes for secondary bile acid conversion are consistently enriched in the CRC-associated microbiomes 29. Further work is needed to establish the changes in protein structure and function associated with the genetic variants of the diet-related microbial genes found here to be enriched in the CRC microbiome.
Analysis of cancer cohorts that are heterogeneous for geography, ethnicity, and lifestyle, presents a distinct opportunity for studying the cancer-associated microbiome. By combining multiple small cohorts of potentially low generalizability, it is possible to obtain better representation of the spectrum of cancer cases and controls. With appropriate methodology, artifactual findings due to batch effects present in any individual dataset can be avoided. The use of large, diverse training sets enables creation of more accurate diagnostic models, and the availability of independent validation datasets enables more realistic estimation of that accuracy. Future shotgun metagenomic studies of the intestinal mucosa-associated microbiome, which are currently infeasible due to excessive human DNA contamination 28, will be important to further refine the list of CRC-associated gut microbes. Nevertheless, this study identifies highly reproducible microbial CRC biomarkers and points to the potential for non-invasive microbial diagnostic tests to supplement existing screening.
Methods
Italian cohorts of CRC patients, adenomas and controls
The two clinical studies performed here were approved by the relevant ethics committees (Cohort1: Ethics committee of Azienda Ospedaliera “SS. Antonio e Biagio e C. Arrigo” of Alessandria, Italy, protocol N. Colorectal_miRNA_CEC2014 and Cohort2: Ethics committee of European Institute of Oncology of Milan, Italy, protocol N. R107/14-IEO 118) and informed consent was obtained from all participants.
For Cohort1, samples were collected from patients at the Clinica S. Rita in Vercelli, Italy. Patients with hereditary CRC syndromes, with previous history of CRC, and with uncompleted or poorly cleaned colonoscopy, were excluded from the study. Patients were recruited at initial diagnosis and had not received any treatment prior to fecal sample collection. Subjects reporting the use of antibiotics during the 6 months prior to the sample collection were excluded from the study. On the basis of colonoscopy results, recruited subjects were classified into three categories: 1) healthy subjects: individuals with colonoscopy negative for tumor, adenomas and other diseases; 2) adenoma patients: individuals with colorectal adenoma/s; and 3) CRC patients: individuals with newly diagnosed CRC. A total of 93 subjects were initially recruited, and the 80 that passed quality control (see below) are divided into 29 CRC patients, 27 adenomas and 24 controls. An additional 13 subjects that presented inflammatory GI tract diseases (ulcerative and Crohn’s colitis, diverticular diseases) were recruited and fecal samples were subsequently used as a part of the final validation. Stool was collected in Stool Nucleic Acid Collection and Transport Tubes with RNA stabilising solution (Norgen Biotek Corp) and returned before performing the colonoscopy. Aliquots of the stool samples were stored at −80°C until use. DNA was extracted from aliquot of fecal samples using the Qiamp DNA stool kit (Qiagen) following manufacturer’s instructions. Total RNA from faeces was extracted using the Stool Total RNA Purification Kit (Norgen Biotek Corp) following manufacturer’s instructions.
For Cohort2, a total of 60 subjects were recruited at the European Oncology Institute in Milan, Italy and were divided into 32 CRC patients and 28 controls. Controls, matched for age (± 5 years) and season of blood withdrawn (± 2 years), were recruited among subjects who underwent recent colonoscopy and had negative or no other relevant gastrointestinal disorders. Subjects reporting the use of antibiotics in the 6 months prior to the sample collection were excluded. Fecal samples were collected from healthy subjects and patients (before surgery, or any other cancer treatment) and directly frozen at −80°C in resuspension buffer (TES buffer: 50 mM Tris-HCL, 10 mM NaCl, 10 mM EDTA, pH 7.5) and kept in liquid nitrogen until DNA extraction. DNA was extracted from fecal samples with the GNOME DNA isolation kit (MP).
Sequencing libraries were prepared using the NexteraXT DNA Library Preparation Kit (Illumina, California, USA), following the manufacturer’s guidelines. Sequencing was performed on the HiSeq2500 (Illumina, California, USA) at the internal sequencing facility of the Centre for Integrative Biology, Trento, Italy.
Public metagenomic cohorts of CRC patients, adenomas and controls.
We downloaded 5 public fecal shotgun CRC datasets covering samples from 6 different countries, totaling 313 CRC patients, 143 adenomas and 308 controls (Table 1) and now available in curatedMetagenomicData 26. We manually curated metadata tables for the public cohorts according to the curatedMetagenomicData 26 R-package grammatical rules. The metadata table includes ten fields (sampleID, subjectID, body_site, country, sequencing_platform, PMID, number_reads, number_bases, minimum_read_length, median_read_length) that are mandatory for all datasets in addition to other fields that are dataset-specific.
Description of the two validation cohorts
We consider an additional set of samples from two independent cohorts that were not available at the time we performed the meta-analysis on the other seven datasets, and we thus used them as validation cohorts. Validation Cohort1 consists of 60 CRC metagenomes collected in Germany after colonoscopy and 65 sex and age-matched healthy controls and is described in depth in the study accompanying this work 29. Shotgun metagenomic sequencing was performed by Illumina HiSeq 2000 / 2500 / 4000 (Illumina, San Diego, USA) platforms at the Genomics Core Facility, European Molecular Biology Laboratory, Heidelberg. Validation Cohort2 consists of 40 CRC samples and 40 controls from a Japanese cohort from Tokyo. DNA was extracted for Validation Cohort2 from frozen fecal samples by bead-beating using the GNOME DNA Isolation Kit (MP Biomedicals, Santa Ana, CA) and DNA quality was assessed with an Agilent 4200 TapeStation (Agilent Technologies, Santa Clara CA). Sequencing libraries were generated with a Nextera XT DNA Sample Prep Kit (Illumina, San Diego, CA) and shotgun metagenomics of fecal samples was carried out on the HiSeq2500 platform (Illumina) at a targeted depth of 5.0 Gb (150-bp paired end reads).
The samples and clinical information used from both validation cohorts in this study were obtained under conditions of informed consent and with approval of the institutional review boards of each participating institute.
Public metagenomic cohorts of non-CRC patients.
We used the curatedMetagenomicData 26 resource to retrieve taxonomical and functional potential profiles as well as metadata of three public cohorts: NielsenHB_2014 52 comprising 21 Crohn Disease (CD) patients, 127 Ulcerative Colitis (UC) patients and 248 controls; KarlssonFH_2013 53 comprising 53 Type-2 Diabetes (T2D) patients and 43 controls; QinJ_2012 54 comprising 172 T2D patients and 174 controls; and we downloaded 1339 metagenomes from the Human Microbiome Consortium phase-2 cohort 55, comprising 598 Crohn Disease patients, 375 Ulcerative Colitis patients and 365 controls.
Sequence pre-processing, taxonomic and functional profiling
Fecal metagenomic shotgun sequences obtained from the Italian cohorts were subjected to a pre-processing pipeline whereby sequences were quality filtered using trim_galore (parameters: --nextera --stringency 5 --length 75 --quality 20 --max_n 2 --trim-n) discarding all reads with quality less than 20 and shorter than 75 nucleotides. Filtered reads were then aligned to the human genome (hg19) and the PhiX genome for human and contaminant DNA removal using bowtie2 61. Thirteen samples, having less than 2Gb of host-decontaminated DNA, were excluded from the study.
We used MetaPhlAn2 62 for quantitative profiling the taxonomic composition of the microbial communities of all metagenomic samples, whereas HUMANn2 63 was used to profile pathway and gene family abundances. The profiles generated for the 6 public cohorts, along with their metadata, and the two newly sequenced cohorts are available through the curatedMetagenomicData R package 26. Oral species were defined in this work by analyzing the 463 oral samples from the Human Microbiome Project dataset 36 and the 140 saliva samples from 35. Specifically, all species with > 0.1% abundance and > 5% prevalence were deemed to be of oral origin. For F. nucleatum marker analysis, we extracted MetaPhlAn2 clade-specific markers from each sample sam file and considered a marker to be present if the coverage was greater than zero.
The Random Forest based machine learning approach
Our machine learning analyses exploited 4 types of microbiome quantitative profiles: taxonomic species-level relative abundances and marker presence or absence patterns inferred by MetaPhlAn2 62, gene-family and pathway relative abundances estimated by HUMAnN2 63.
All machine learning experiments used Random Forest 64, as this algorithm has been shown to outperform, on average, other learning tools for microbiome data 10. The code generating the analyses and the figures is available at https://bitbucket.org/CibioCM/multidataset_machinelearning/src/, and is based on MetAML 10 with the Random Forest implementation taken from Scikit-Learn version 0.19.0, 65. We used an ensemble of 1000 estimator trees and Shannon entropy to evaluate the quality of a split at each node of a tree. The two hyper-parameters for the minimum number of samples per leaf and for the number of features per tree are set as indicated elsewhere 66 to 5 and 30% respectively. For the marker presence/absence profiles we used a number of features equal to the square root of the total number of features, and this percentage was further decreased to 1% when using gene-family profiles as they have a substantially higher number of features (> 2M). The experiments ran on reduced sets of input features (Figure 4, Suppl. Fig. 8) avoided feature subsampling when less than 128 features were used (Suppl. Fig. 8).
Application and evaluation of the learning models
The inside-dataset prediction capability was measured through 10-fold cross-validation, stratified so each fold contained a balanced proportion of positive and negative cases. The procedure of forming the folds and assessing the models was repeated 20 times. The final result is therefore an average over 200 validation folds. In the cross-study validation, datasets are considered two by two: one is used for training the model, the other to validate.
The Leave-one-dataset-out (LODO) approach consists of training the model on the pooled samples from all cohorts except the one used for model testing. This mimics the scenario in which all the available samples from multiple cohorts are used to predict CRC-positive samples in a newly established cohort. As a part of the meta-analysis, we iterated along all the cohorts, performing a LODO validation on each set of samples (Figure 2).
Additional validation experiments on independent datasets and other diseases
We built a validation LODO model trained on MetaPhlAn2 taxonomic abundances from the previously described set of 7 cohorts and applied it to the independent validation cohorts. To test the performance of the model when challenged with other diseases, we selected 4 metagenomic cohorts 52–55 covering 3 non-CRC diseases (ulcerative colitis - UC, Crohn’s disease - CD, and type-2 diabetes - T2D) and we used them for further experiments. For each disease (UC, CD, T2D) in each dataset, we randomly drawn 60 samples from the control class as well as 60 samples from the cases and added them to each validation dataset in turn, labelled as controls. The random selection was repeated ten times, and the validation AUC computed on the model’s prediction accordingly. The rationale is to observe the decrease in AUC when the external cases are added to the controls of the validation cohort with respect the addition of healthy controls.
Specificity of the prediction model was also assessed by the addition of 13 IBD samples to Cohort1: we used the 13 samples either as controls for Cohort1 or added to the original controls; we performed a cross-validation and a LODO on Cohort1 (no validation cohorts in the training) using MetaPhlAn2 microbial species.
To assess the prediction ability of our Random Forest approach with respect to more traditional non-invasive tests like the FOBT and the Wif-1 Methylation test, we recorded the true positive rate (sensitivity) and the false positive rate (1 - specificity) for a subset of the ZellerG_2014 cohort according to these two tests and one-hundred positive detection thresholds in the case of Random Forest models. We then combined the Random Forest approach with the two tests in turn, first assigning the positive class when both predictors are positive (“AND” model) secondly when just one predictor is (“OR” model).
Statistical analysis
Univariate analyses on a per dataset basis was performed using LEfSe 38 to identify features that were statistically different among groups and estimate their effect size. ANCOM was also applied 67 but showed reduced power on our datasets (e.g. it identified F. nucleatum as a biomarker in only one dataset) probably due to the low relative abundance of CRC biomarkers that are thus only minimally affected by the problem of compositionality. For these reasons, we chose to use LEfSe for the univariate analysis and focused on the biomarkers with the highest effect size. To overcome the limitations of univariate statistics, we performed multivariate analysis using linear models fitted to the data using the limma R package 68 and possible confounders such as age, sex and BMI were included in the models. For the meta-analysis on taxonomic and functional profiles, we converted relative abundances to arcsine-square root transformed proportions and used the escalc function from the R metafor package that employed Cohen’s standardized mean difference statistic to calculate random effects model estimates. We quantified study heterogeneity using the I2 estimate (percentage of variation reflecting true heterogeneity) as well as Cochran’s Q test to assess statistically significant heterogeneity. P-values obtained from the random effects models were corrected for multiple hypothesis testing correction using the Benjamini-Hochberg procedure and corrected P < 0.05 were considered statistically significant. Cluster analysis was conducted by calculating distance matrices from phylogenetic trees using the APE R-package, clustering using partitioning around medoids (PAM) and computing clusters’ prediction strength using the cluster R-package. When validating differential species richness, oral-species richness, and increased abundance of the cutC gene, we also assessed significance through one-sided permutation-based Wilcoxon-Mann-Whitney tests where we blocked for cohort 51, as implemented in the ‘coin’ R- package. The lower and upper hinges of boxplots presented in the figures correspond to the 25th and 75th percentiles. The upper and lower whiskers extend from the hinges to the largest (or smallest) value no further than 1.5 * inter-quartile range (IQR) from the hinge, defined as the distance between the 25th and 75th percentiles. Data beyond the end of the whiskers are plotted individually.
Identification and quantification of the genes encoding TMA producing enzymes
In order to obtain a more comprehensive database of choline TMA-lyase enzyme sequences, we downloaded amino acid sequences that matched the keywords “cutC” and ”cutD” from UniProt90 42, mapped their IDs to EMBL CDS using UniParc and used the resulting DNA sequences to search, using BLASTn 69, all 48,902 Prokka 70 annotated genomes available in our repository 71. Matching queries were filtered to include only alignments with >80% identity and length > 1000nt for cutC and > 800nt for cutD, and an e-value < 1e-15. We used ShortBRED 72 to identify short seed sequences that were representative of the filtered queries using UniProt’s UniRef100 database and quantified them in the metagenomes, normalizing by the number of reads per kilobase million (RPKM). The pipeline was also applied to identify and quantify the L-carnitine/gamma-butyrobetaine antiporter (caiT) and the dioxygenase yeaW, responsible for producing TMA preferentially via carnitine degradation. In order to investigate differences in cutC sequence types, we clustered cutC sequences at 97% sequence identity using UCLUST 73 and aligned raw reads to the clustered cutC database using bowtie2 61. From the bam files we calculated the breadth and depth of each sequence and generated their corresponding consensus sequence using Samtools 74 and VCF utils 75. We chose the representative cutC sequence for each sample as the one with the highest breadth or the highest depth, if there were multiple cutC sequences with the same breadth. We filtered representative cutC sequences from each sample to include only those with a breadth > 80%, aligned them using MAFFT 76, built a phylogenetic tree using fastTree 77 which was refined using RAxML 78 and visualized using GraPhlAn 79.
Validation of cutC gene and transcript abundances by qPCR
Real time qPCR was used to assess differences in cutC genes and transcripts between CRC samples and controls. We used a previously described protocol 49 which employs 16S rRNA abundances as an internal sample normalization. For first strand cDNA synthesis, 400 ng of RNA templates were retrotranscribed using the High-capacity cDNA Reverse Transcription Kits with Random Primers (Thermofisher Scientific) following the manufacturer’s instructions. The cutC and 16S rRNA genes (and transcripts from cDNA) were amplified using degenerate primers and cycling conditions as described previously 49. Briefly, reactions were performed in triplicate with 10 ng of template DNA or 30 ng of cDNA on the Rotor Gene Q (QIAGEN) using HOT FIREPol EvaGreen qPCR mix (SOLIS BIODYNE) with a final primer concentration of 0.5 μM (16S) or 0.75 μM (cutC). Cycling conditions were as follows: initial denaturation of 95°C for 15 min; followed by 40 cycles of denaturing at 95°C for 45 s, annealing at 57° C (cutC) or 55°C for (16S) for 45 s and an extension step of 72°C for 45 s. Melting curves were subsequently performed for all reactions using the following program: 95° for 5 s, followed by 65°C for 60s, and a final continuous reading step of seven acquisitions per second between 65 and 97°C.
Quantification of the cutC gene by means of qPCR protocol was applied to 44 samples belonging to Cohort1 for which enough DNA was available. Samples for which either the cutC or the 16S rRNA amplification failed were removed and we retained measurements for a total of 16 CRC and 19 control samples. Relative gene fold change was calculated by applying the ΔΔCt method 80, with ΔCt calculated as difference between cutC and 16S rRNA Ct values. Significance of the cutC vs. 16S rRNA comparison was assessed through the one-tailed Wilcoxon Signed Rank test. The same procedure was applied on the quantification of cutC and 16S rRNA transcripts from cDNA, which was computed using 26 CRC and 20 control samples for which we obtained a reliable quantification of both cutC and 16S rRNA.
Data Availability
Nucleotide sequences for the two new Italian cohorts are available in the Sequence Read Archive (SRA) under the accession number SRP136711. MetaPhlAn2 and HUMANn2 profiles for the new cohorts were also added to the curatedMetagenomicData R package along with their corresponding metadata. Validation Cohort1 is available in the European Nucleotide Archive (ENA) under the study identifier PRJEB27928, Validation Cohort2 is available in the DDBJ databases under the accession number DRA006684.
Extended Data
Fig. 1. Sequencing depths and species richness across CRC datasets.
(A) Boxplots reporting the total number of reads in each dataset. P-values between the carcinoma and control groups were calculated by two-tailed Wilcoxon rank-sum tests. (B) Boxplots showing the total number of microbial species per dataset. P-values were calculated by two-tailed Wilcoxon rank-sum tests. (C) Boxplots showing the total number of microbial species per dataset calculated on metagenomes subsampled in each dataset to the number of reads of the 10th percentile. P-values were calculated by two-tailed Wilcoxon rank-sum tests. (D) Multivariate analysis of species richness using crude and age, sex and BMI-adjusted coefficients obtained from linear models. (E) Meta-analysis of crude and adjusted multivariate richness coefficients using a random effects model. Bold lines represent the 95% confidence interval for the random effects model estimate.
Fig. 2. Meta-analysis of species diversity andoral species richness in CRC datasets.
A) Boxplots reporting the Shannon species diversity in each dataset. P-values between the carcinoma and control groups were calculated by two-tailed Wilcoxon rank-sum tests. (B) Boxplots reporting the Shannon species diversity calculated on metagenomes subsampled in each dataset to the number of reads of the 10th percentile. P-values were calculated by two-tailed Wilcoxon rank-sum tests. (C) Multivariate analysis of species diversity using crude and age, sex and BMI-adjusted coefficients obtained from linear models. (D) Meta-analysis of crude and adjusted multivariate Shannon diversity coefficients using a random effects model. Bold lines represent the 95% confidence interval for the random effects model estimate. (E) Boxplots reporting the total number of oral microbial species per dataset. P-values were calculated by two-tailed Wilcoxon rank-sum tests comparing values between controls and carcinomas for each dataset. (F) Multivariate analysis of putative oral species richness using crude and age, sex and BMI-adjusted coefficients obtained from linear models. (G) Meta-analysis of crude and adjusted multivariate putative oral species richness coefficients using a random effects model. Bold lines represent the 95% confidence interval for the random effects model estimate.
Fig. 3. Two novel metagenomic cohorts identify clear but only partially overlapping microbiome signatures associated with CRC.
(A) Relative abundances (log scale) and effect sizes (estimated using the LDA score in LEfSe) for the significantly different microbial species in CRC samples compared to control samples for Cohort1 (significance assessed by the non-parametric test in LEfSe) and (B) for Cohort2. (C) Alpha diversities measured as the total number of species and the total number of UniProt90 gene families in each sample for the two cohorts. (D) Beta-diversities estimated with the Bray-Curtis dissimilarity metric for intra- and inter-condition comparisons in the two cohorts.
Fig. 4. Analysis of F. nucleatum markers, and taxonomic meta-analysis of CRC datasets.
(A) Percentages of F. nucleatum clade-specific markers (200 in total) in each per dataset. P-values were obtained by two-tailed Wilcoxon rank-sum tests comparing values between controls and carcinomas for each dataset. (B) Meta-analysis of CRC datasets using species-level MetaPhlAn2 profiles. Bold lines represent the 95% confidence interval for the random effects model estimate. (C) Multivariate analysis of meta-analysis species-level abundance biomarkers. Crude and age, sex and BMI adjusted coefficients for species associated with disease status in the meta-analysis of standardized mean differences.
Fig. 5. Analysis of putative oral species’ abundances in CRC datasets and gene families richness across CRC datasets.
(A) Effect sizes of the abundances of significant putative oral species identified using a meta-analysis of standardized mean differences and a random effects model. Bold lines represent the 95% confidence interval for the random effects model estimate. (B) Total abundance of putative oral species in each gut metagenomic dataset. P-values were obtained by two-tailed Wilcoxon rank-sum tests comparing values between controls and carcinomas for each dataset. (C) The total number of reads in each sample of each dataset correlates with the total number of gene families identified using HUMANn2. Ellipses represent the 95% confidence level assuming a multivariate t-distribution. (D) Distribution of the total number of gene families identified in the samples of each dataset. P-values were obtained by two-tailed Wilcoxon rank-sum tests comparing values between controls and carcinomas for each dataset. (E) Distribution of the percentages of unmapped reads across datasets for UniProt90 gene families.
Fig. 6. Cross-validation, cross-cohort, and LODO predictions using pathway abundances, species abundances, and species-specific markers.
(A) Prediction matrix reporting prediction performances as AUC values obtained using a Random Forest (RF) model on pathway relative abundances. Values on the diagonal refer to 20 times repeated 10-fold stratified cross validations. Off-diagonal values refer to the AUC values obtained by training the classifier on the dataset of the corresponding row and applying it on the dataset of the corresponding column. The Leave-One-Dataset-Out (LODO) row refers to the performances obtained by training the model on pathway abundances using all but the dataset of the corresponding column and applying it on the dataset of the corresponding column. (B) Prediction matrix as in (A) but using MetaPhlAn2 marker presence and absence information.
(C) Prediction of samples-to-cohort assignments using species-level relative abundances. Only control samples from each dataset are considered. (D) Principal coordinate analysis of Bray-Curtis distances computed on MetaPhlAn2 species-level abundances across datasets. Ellipses represent the 95% confidence level assuming a multivariate t-distribution.
(E) Cross prediction matrix for the performances of RF models in predicting adenomas versus CRC conditions. (F) Cross prediction matrix as described in (E) but on the distinction of adenomas versus controls.
Fig. 7. Prediction performances at increasing numbers of external datasets considered in the training model.
(A) Prediction performances computed based on MetaPhlAn2 species abundances. The dark yellow line interpolates the median AUC at each number of training datasets considered. (B) Prediction performances computed based on HUMANn2 gene-family abundances.
Fig. 8. Identification of a minimal number of microbial gene-families for CRC-detection.
Prediction performances in the LODO-settings at increasing number of gene-families. Each ranking is obtained excluding the testing dataset to avoid overfitting.
Fig. 9. Metagenomic analysis of genes involved in the TMA-synthesis pathway.
(A) ShortBRED analysis of yeaW and caiT gene abundances. Points represent the log of reads per kilobase per million mapped reads (RPKM) for each sample and crosses represent mean values per group/dataset. (B) ShortBRED analysis of cutD gene abundances. Boxplots reports the RKPM abundances obtained using ShortBRED for the gene of the activating TMA-lyase enzyme cutD. P-values were calculated by two-tailed Wilcoxon rank-sum tests comparing values between controls and carcinomas for each dataset. (C) Forest plot showing effect sizes calculated using a meta-analysis of standardized mean differences and a random effects model on cutD RPKM abundances between carcinomas and controls. (D) Breadth of coverage of cutC gene sequence clusters across CRC datasets. (E) Depth of coverage of cutC gene sequence clusters across CRC datasets..
Fig. 10. Cluster analysis of samples’ representative cutC sequence variants.
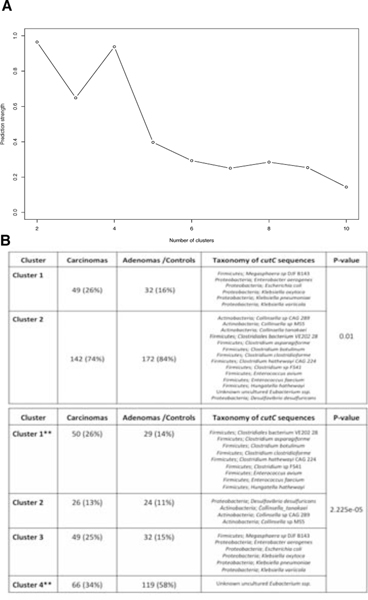
(A) Prediction strengths at differing number of clusters showing optimum numbers at 2 and 4 clusters. (B) Tables showing the number of samples for carcinomas, adenomas and controls with breadth of coverage >80% at two different cluster thresholds. P-values were calculated using a Fisher T-test and taxonomy was assigned by BLASTn and the cutC sequence database (criteria of 80% coverage, >97% identity and minimum 2000nt alignment length).
Supplementary Material
Acknowledgements
We thank the members of the Segata, Naccarati, and Waldron groups for insightful discussions, all the volunteers enrolled in the study, the NGS facility at University of Trento for performing the metagenomic sequencing, and the HPC facility at University of Trento for supporting the computational experiments. This work was primarily supported by Lega Italiana per La Lotta contro i Tumori to N.S., F.C. and A.N and by Fundação de Amparo à Pesquisa do Estado de São Paulo (FAPESP - 16/23527-2) to A.M.T. This work was also partially supported by the Conselho Nacional de Pesquisa e Desenvolvimento (CNPq, Brazil) to J.C.S. and E.D.-N., FAPESP (14/26897-0), Associação Beneficente Alzira Denise Hertzog Silva (ABADHS, Brazil) and PRONON/SIPAR to E.D.-N., by Coordenação de Aperfeiçoamento de Pessoal de Nível Superior - Brazil (CAPES) - Finance Code 001 to J.C.S., by the Italian Institute for Genomic Medicine (IIGM) and Compagnia di San Paolo Torino to A.N, A.F., B.P. and S.T., by Fondazione Umberto Veronesi “Post-doctoral fellowship Year 2014, 2015, 2016, 2017 and 2018” to B.P. and S.T., by the Grant Agency of the Czech Republic (17-16857S) to A.N., by Fondazione Umberto Veronesi (FUV-14-SG-GANDINI) to S.G., by the European Union H2020 Marie-Curie grant (707345) to E.P., by the European Research Council (ERC-STG project MetaPG) to N.S., by MIUR “Futuro in Ricerca” RBFR13EWWI_001 to N.S., by the People Programme (Marie Curie Actions) of the European Union FP7 and H2020 to N.S., and by the National Cancer Institute (U24CA180996) and National Institute of Allergy and Infectious Diseases (1R21AI121784-01) of the National Institutes of Health to L.W. B.P. is recipient of a Fulbright Research Scholarships (year 2018). We acknowledge funding from EMBL, DKFZ, the Huntsman Cancer Foundation, the Intramural Research Program of the National Cancer Institute, ETH Zürich, and the following external sources: the European Research Council (CancerBiome ERC-2010-AdG_20100317 to P.B., Microbios ERC-AdG-669830 tp P.B.), the Novo Nordisk Foundation (grant NNF10CC1016515 to M.A.), the Danish Diabetes Academy supported by the Novo Nordisk Foundation and TARGET research initiative (Danish Strategic Research Council [0603-00484B] to M.A.), the Matthias-Lackas Foundation (to C.M.U.), the National Cancer Institute (grants R01 CA189184, R01 CA207371, U01 CA206110, P30 CA042014 ll to C.M.U.), the BMBF (the de.NBI network #031A537B to P.B. and the ERA-NET TRANSCAN project 01KT1503 to C.M.U.), and the Helmut Horten Foundation (to S.Sunagawa). For the Validation Cohort2, funding was provided by grants from the National Cancer Center Research and Development Fund (25-A-4,28-A-4, and 29-A-6), Practical Research Project for Rare/Intractable Diseases from the Japan Agency for Medical Research and Development (AMED) (JP18ek0109187), JST (Japan Science and Technology Agency)-PRESTO (JPMJPR1507), JSPS (Japan Society for the Promotion of Science) KAKENHI (16J10135, 142558 and 221S0002), Joint Research Project of the Institute of Medical Science, the University of Tokyo, and the Takeda Science Foundation and Suzuken Memorial Foundation.
Competing Interests
P. Bork, G. Zeller, A.Y. Voigt, and S. Sunagawa are named inventors on a patent (EP2955232A1: Method for diagnosing colorectal cancer based on analyzing the gut microbiome). All the other authors declare to have no competing interests as defined by Nature Research, or other interests that might be perceived to influence the results and/or discussion reported in this paper.
References
- 1.Ferlay J. et al. Cancer incidence and mortality worldwide: sources, methods and major patterns in GLOBOCAN 2012. Int. J. Cancer 136, E359–86 (2015). [DOI] [PubMed] [Google Scholar]
- 2.Siegel R, Desantis C. & Jemal A. Colorectal cancer statistics, 2014. CA Cancer J. Clin 64, 104–117 (2014). [DOI] [PubMed] [Google Scholar]
- 3.Frank C, Sundquist J, Yu H, Hemminki A. & Hemminki K. Concordant and discordant familial cancer: Familial risks, proportions and population impact. Int. J. Cancer 140, 1510–1516 (2017). [DOI] [PubMed] [Google Scholar]
- 4.Foulkes WD Inherited susceptibility to common cancers. N. Engl. J. Med 359, 2143–2153 (2008). [DOI] [PubMed] [Google Scholar]
- 5.Johnson CM et al. Meta-analyses of colorectal cancer risk factors. Cancer Causes Control 24, 1207–1222 (2013). [DOI] [PMC free article] [PubMed] [Google Scholar]
- 6.Huxley RR et al. The impact of dietary and lifestyle risk factors on risk of colorectal cancer: a quantitative overview of the epidemiological evidence. Int. J. Cancer 125, 171–180 (2009). [DOI] [PubMed] [Google Scholar]
- 7.Schmidt TSB, Raes J. & Bork P. The Human Gut Microbiome: From Association to Modulation. Cell 172, 1198–1215 (2018). [DOI] [PubMed] [Google Scholar]
- 8.Thomas RM & Jobin C. The Microbiome and Cancer: Is the ‘Oncobiome’ Mirage Real? Trends Cancer Res. 1, 24–35 (2015). [DOI] [PMC free article] [PubMed] [Google Scholar]
- 9.Jie Z. et al. The gut microbiome in atherosclerotic cardiovascular disease. Nat. Commun 8, 845 (2017). [DOI] [PMC free article] [PubMed] [Google Scholar]
- 10.Pasolli E, Truong DT, Malik F, Waldron L. & Segata N. Machine Learning Meta-analysis of Large Metagenomic Datasets: Tools and Biological Insights. PLoS Comput. Biol 12, e1004977 (2016). [DOI] [PMC free article] [PubMed] [Google Scholar]
- 11.Cougnoux A. et al. Bacterial genotoxin colibactin promotes colon tumour growth by inducing a senescence-associated secretory phenotype. Gut 63, 1932–1942 (2014). [DOI] [PubMed] [Google Scholar]
- 12.Wu S. et al. A human colonic commensal promotes colon tumorigenesis via activation of T helper type 17 T cell responses. Nat. Med 15, 1016–1022 (2009). [DOI] [PMC free article] [PubMed] [Google Scholar]
- 13.Chung L. et al. Bacteroides fragilis Toxin Coordinates a Pro-carcinogenic Inflammatory Cascade via Targeting of Colonic Epithelial Cells. Cell Host Microbe 23, 203–214.e5 (2018). [DOI] [PMC free article] [PubMed] [Google Scholar]
- 14.Kostic AD et al. Genomic analysis identifies association of Fusobacterium with colorectal carcinoma. Genome Res. 22, 292–298 (2012). [DOI] [PMC free article] [PubMed] [Google Scholar]
- 15.Kostic AD et al. Fusobacterium nucleatum potentiates intestinal tumorigenesis and modulates the tumor-immune microenvironment. Cell Host Microbe 14, 207–215 (2013). [DOI] [PMC free article] [PubMed] [Google Scholar]
- 16.Rubinstein MR et al. Fusobacterium nucleatum promotes colorectal carcinogenesis by modulating E-cadherin/β-catenin signaling via its FadA adhesin. Cell Host Microbe 14, 195–206 (2013). [DOI] [PMC free article] [PubMed] [Google Scholar]
- 17.Yu J. et al. Metagenomic analysis of faecal microbiome as a tool towards targeted non-invasive biomarkers for colorectal cancer. Gut 66, 70–78 (2017). [DOI] [PubMed] [Google Scholar]
- 18.Feng Q. et al. Gut microbiome development along the colorectal adenoma–carcinoma sequence. Nat. Commun 6, 6528 (2015). [DOI] [PubMed] [Google Scholar]
- 19.Zeller G. et al. Potential of fecal microbiota for early-stage detection of colorectal cancer. Mol. Syst. Biol 10, 766 (2014). [DOI] [PMC free article] [PubMed] [Google Scholar]
- 20.Baxter NT, Ruffin MT, Rogers MAM & Schloss PD Microbiota-based model improves the sensitivity of fecal immunochemical test for detecting colonic lesions. Genome Med. 8, 37 (2016). [DOI] [PMC free article] [PubMed] [Google Scholar]
- 21.Zackular JP, Rogers MAM, Ruffin MT 4th & Schloss PD The human gut microbiome as a screening tool for colorectal cancer. Cancer Prev. Res 7, 1112–1121 (2014). [DOI] [PMC free article] [PubMed] [Google Scholar]
- 22.Drewes JL et al. High-resolution bacterial 16S rRNA gene profile meta-analysis and biofilm status reveal common colorectal cancer consortia. NPJ Biofilms Microbiomes 3, 34 (2017). [DOI] [PMC free article] [PubMed] [Google Scholar]
- 23.Pollock J, Glendinning L, Wisedchanwet T. & Watson M. The Madness of Microbiome: Attempting To Find Consensus ‘Best Practice’ for 16S Microbiome Studies. Appl. Environ. Microbiol 84, (2018). [DOI] [PMC free article] [PubMed] [Google Scholar]
- 24.Segata N. On the Road to Strain-Resolved Comparative Metagenomics. mSystems 3, (2018). [DOI] [PMC free article] [PubMed] [Google Scholar]
- 25.Truong DT, Tett A, Pasolli E, Huttenhower C. & Segata N. Microbial strain-level population structure and genetic diversity from metagenomes. Genome Res. 27, 626–638 (2017). [DOI] [PMC free article] [PubMed] [Google Scholar]
- 26.Pasolli E. et al. Accessible, curated metagenomic data through ExperimentHub. Nat. Methods 14, 1023 (2017). [DOI] [PMC free article] [PubMed] [Google Scholar]
- 27.Dai Z. et al. Multi-cohort analysis of colorectal cancer metagenome identified altered bacteria across populations and universal bacterial markers. Microbiome 6, 70 (2018). [DOI] [PMC free article] [PubMed] [Google Scholar]
- 28.Quince C, Walker AW, Simpson JT, Loman NJ & Segata N. Shotgun metagenomics, from sampling to analysis. Nat. Biotechnol 35, 833–844 (2017). [DOI] [PubMed] [Google Scholar]
- 29.Wirbel J. et al. Meta-analysis of fecal metagenomes reveals global microbial signatures that are specific for colorectal cancer. Under Submission (2018). [DOI] [PMC free article] [PubMed]
- 30.Hannigan GD, Duhaime MB, Ruffin MT 4th, Koumpouras CC & Schloss PD Diagnostic Potential and Interactive Dynamics of the Colorectal Cancer Virome. MBio 9, (2018). [DOI] [PMC free article] [PubMed] [Google Scholar]
- 31.Thomas AM et al. Tissue-Associated Bacterial Alterations in Rectal Carcinoma Patients Revealed by 16S rRNA Community Profiling. Front. Cell. Infect. Microbiol 6, 179 (2016). [DOI] [PMC free article] [PubMed] [Google Scholar]
- 32.Gao Z, Guo B, Gao R, Zhu Q. & Qin H. Microbiota disbiosis is associated with colorectal cancer. Front. Microbiol 6, 20 (2015). [DOI] [PMC free article] [PubMed] [Google Scholar]
- 33.Ahn J. et al. Human gut microbiome and risk for colorectal cancer. J. Natl. Cancer Inst 105, 1907–1911 (2013). [DOI] [PMC free article] [PubMed] [Google Scholar]
- 34.Flemer B. et al. The oral microbiota in colorectal cancer is distinctive and predictive. Gut (2017). doi: 10.1136/gutjnl-2017-314814 [DOI] [PMC free article] [PubMed]
- 35.Brito IL et al. Mobile genes in the human microbiome are structured from global to individual scales. Nature 535, 435–439 (2016). [DOI] [PMC free article] [PubMed] [Google Scholar]
- 36.Human Microbiome Project Consortium. Structure, function and diversity of the healthy human microbiome. Nature 486, 207–214 (2012). [DOI] [PMC free article] [PubMed] [Google Scholar]
- 37.Bonder MJ et al. The effect of host genetics on the gut microbiome. Nat. Genet 48, 1407 (2016). [DOI] [PubMed] [Google Scholar]
- 38.Segata N. et al. Metagenomic biomarker discovery and explanation. Genome Biol. 12, R60 (2011). [DOI] [PMC free article] [PubMed] [Google Scholar]
- 39.Xie Y-H et al. Fecal Clostridium symbiosum for Noninvasive Detection of Early and Advanced Colorectal Cancer: Test and Validation Studies. EBioMedicine 25, 32–40 (2017). [DOI] [PMC free article] [PubMed] [Google Scholar]
- 40.Boleij A, van Gelder MMHJ, Swinkels DW & Tjalsma H. Clinical Importance of Streptococcus gallolyticus infection among colorectal cancer patients: systematic review and meta-analysis. Clin. Infect. Dis 53, 870–878 (2011). [DOI] [PubMed] [Google Scholar]
- 41.Fijan S. Microorganisms with claimed probiotic properties: an overview of recent literature. Int. J. Environ. Res. Public Health 11, 4745–4767 (2014). [DOI] [PMC free article] [PubMed] [Google Scholar]
- 42.Apweiler R. et al. UniProt: the Universal Protein knowledgebase. Nucleic Acids Res. 32, D115–9 (2004). [DOI] [PMC free article] [PubMed] [Google Scholar]
- 43.Gerner EW & Meyskens FL Jr. Polyamines and cancer: old molecules, new understanding. Nat. Rev. Cancer 4, 781–792 (2004). [DOI] [PubMed] [Google Scholar]
- 44.Costea PI et al. Towards standards for human fecal sample processing in metagenomic studies. Nat. Biotechnol 35, 1069–1076 (2017). [DOI] [PubMed] [Google Scholar]
- 45.Riester M. et al. Risk prediction for late-stage ovarian cancer by meta-analysis of 1525 patient samples. J. Natl. Cancer Inst 106, (2014). [DOI] [PMC free article] [PubMed] [Google Scholar]
- 46.Kummen M. et al. Elevated trimethylamine-N-oxide (TMAO) is associated with poor prognosis in primary sclerosing cholangitis patients with normal liver function. United European Gastroenterol J 5, 532–541 (2017). [DOI] [PMC free article] [PubMed] [Google Scholar]
- 47.Oellgaard J, Winther SA, Hansen TS, Rossing P. & von Scholten BJ Trimethylamine N-oxide (TMAO) as a New Potential Therapeutic Target for Insulin Resistance and Cancer. Curr. Pharm. Des 23, 3699–3712 (2017). [DOI] [PubMed] [Google Scholar]
- 48.Kalnins G. et al. Structure and Function of CutC Choline Lyase from Human Microbiota Bacterium Klebsiella pneumoniae. J. Biol. Chem 290, 21732–21740 (2015). [DOI] [PMC free article] [PubMed] [Google Scholar]
- 49.Rath S, Heidrich B, Pieper DH & Vital M. Uncovering the trimethylamine-producing bacteria of the human gut microbiota. Microbiome 5, 54 (2017). [DOI] [PMC free article] [PubMed] [Google Scholar]
- 50.Pasolli E. et al. Extensive unexplored human microbiome diversity revealed by over 150,000 genomes from metagenomes spanning age, geography, and lifestyle. Cell 176, 1–14 (2019). [DOI] [PMC free article] [PubMed] [Google Scholar]
- 51.Hothorn T, Hornik K, van de Wiel MA & Zeileis A. A Lego System for Conditional Inference. Am. Stat 60, 257–263 (2006). [Google Scholar]
- 52.Nielsen HB et al. Identification and assembly of genomes and genetic elements in complex metagenomic samples without using reference genomes. Nat. Biotechnol 32, 822–828 (2014). [DOI] [PubMed] [Google Scholar]
- 53.Karlsson FH et al. Gut metagenome in European women with normal, impaired and diabetic glucose control. Nature 498, 99–103 (2013). [DOI] [PubMed] [Google Scholar]
- 54.Qin J. et al. A metagenome-wide association study of gut microbiota in type 2 diabetes. Nature 490, 55–60 (2012). [DOI] [PubMed] [Google Scholar]
- 55.Integrative HMP (iHMP) Research Network Consortium. The Integrative Human Microbiome Project: dynamic analysis of microbiome-host omics profiles during periods of human health and disease. Cell Host Microbe 16, 276–289 (2014). [DOI] [PMC free article] [PubMed] [Google Scholar]
- 56.Dejea CM et al. Patients with familial adenomatous polyposis harbor colonic biofilms containing tumorigenic bacteria. Science 359, 592–597 (2018). [DOI] [PMC free article] [PubMed] [Google Scholar]
- 57.Manichanh C. et al. Reduced diversity of faecal microbiota in Crohn’s disease revealed by a metagenomic approach. Gut 55, 205–211 (2006). [DOI] [PMC free article] [PubMed] [Google Scholar]
- 58.Le Chatelier E. et al. Richness of human gut microbiome correlates with metabolic markers. Nature 500, 541–546 (2013). [DOI] [PubMed] [Google Scholar]
- 59.Bae S. et al. Plasma choline metabolites and colorectal cancer risk in the Women’s Health Initiative Observational Study. Cancer Res. 74, 7442–7452 (2014). [DOI] [PMC free article] [PubMed] [Google Scholar]
- 60.Xu R, Wang Q. & Li L. A genome-wide systems analysis reveals strong link between colorectal cancer and trimethylamine N-oxide (TMAO), a gut microbial metabolite of dietary meat and fat. BMC Genomics 16 Suppl 7, S4 (2015). [DOI] [PMC free article] [PubMed] [Google Scholar]
Methods-only References
- 61.Langmead B. & Salzberg SL Fast gapped-read alignment with Bowtie 2. Nat. Methods 9, 357 (2012). [DOI] [PMC free article] [PubMed] [Google Scholar]
- 62.Truong DT et al. MetaPhlAn2 for enhanced metagenomic taxonomic profiling. Nat. Methods 12, 902–903 (2015). [DOI] [PubMed] [Google Scholar]
- 63.Abubucker S. et al. Metabolic reconstruction for metagenomic data and its application to the human microbiome. PLoS Comput. Biol 8, e1002358 (2012). [DOI] [PMC free article] [PubMed] [Google Scholar]
- 64.Breiman L. Random Forests. Mach. Learn 45, 5–32 (2001). [Google Scholar]
- 65.Pedregosa F. et al. Scikit-learn: Machine Learning in Python. J. Mach. Learn. Res 12, 2825–2830 (2011). [Google Scholar]
- 66.Hastie T, Tibshirani R. & Friedman J. The Elements of Statistical Learning. 1, (Springer-Verlag; New York, 2009). [Google Scholar]
- 67.Mandal S. et al. Analysis of composition of microbiomes: a novel method for studying microbial composition. Microb. Ecol. Health Dis 26, 27663 (2015). [DOI] [PMC free article] [PubMed] [Google Scholar]
- 68.Ritchie ME et al. limma powers differential expression analyses for RNA-sequencing and microarray studies. Nucleic Acids Res. 43, e47 (2015). [DOI] [PMC free article] [PubMed] [Google Scholar]
- 69.Altschul SF, Gish W, Miller W, Myers EW & Lipman DJ Basic local alignment search tool. J. Mol. Biol 215, 403–410 (1990). [DOI] [PubMed] [Google Scholar]
- 70.Seemann T. Prokka: rapid prokaryotic genome annotation. Bioinformatics 30, 2068–2069 (2014). [DOI] [PubMed] [Google Scholar]
- 71.Segata N, Börnigen D, Morgan XC & Huttenhower C. PhyloPhlAn is a new method for improved phylogenetic and taxonomic placement of microbes. Nat. Commun 4, 2304 (2013). [DOI] [PMC free article] [PubMed] [Google Scholar]
- 72.Kaminski J. et al. High-Specificity Targeted Functional Profiling in Microbial Communities with ShortBRED. PLoS Comput. Biol 11, e1004557 (2015). [DOI] [PMC free article] [PubMed] [Google Scholar]
- 73.Edgar RC Search and clustering orders of magnitude faster than BLAST. Bioinformatics 26, 2460–2461 (2010). [DOI] [PubMed] [Google Scholar]
- 74.Li H. et al. The Sequence Alignment/Map format and SAMtools. Bioinformatics 25, 2078–2079 (2009). [DOI] [PMC free article] [PubMed] [Google Scholar]
- 75.Danecek P. et al. The variant call format and VCFtools. Bioinformatics 27, 2156–2158 (2011). [DOI] [PMC free article] [PubMed] [Google Scholar]
- 76.Katoh K. & Standley DM MAFFT multiple sequence alignment software version 7: improvements in performance and usability. Mol. Biol. Evol 30, 772–780 (2013). [DOI] [PMC free article] [PubMed] [Google Scholar]
- 77.Price MN, Dehal PS & Arkin AP FastTree 2--approximately maximum-likelihood trees for large alignments. PLoS One 5, e9490 (2010). [DOI] [PMC free article] [PubMed] [Google Scholar]
- 78.Stamatakis A. RAxML version 8: a tool for phylogenetic analysis and post-analysis of large phylogenies. Bioinformatics 30, 1312–1313 (2014). [DOI] [PMC free article] [PubMed] [Google Scholar]
- 79.Asnicar F, Weingart G, Tickle TL, Huttenhower C. & Segata N. Compact graphical representation of phylogenetic data and metadata with GraPhlAn. PeerJ 3, e1029 (2015). [DOI] [PMC free article] [PubMed] [Google Scholar]
- 80.Livak KJ & Schmittgen TD Analysis of relative gene expression data using real-time quantitative PCR and the 2(-Delta Delta C(T)) Method. Methods 25, 402–408 (2001). [DOI] [PubMed] [Google Scholar]
Associated Data
This section collects any data citations, data availability statements, or supplementary materials included in this article.
Supplementary Materials
Data Availability Statement
Nucleotide sequences for the two new Italian cohorts are available in the Sequence Read Archive (SRA) under the accession number SRP136711. MetaPhlAn2 and HUMANn2 profiles for the new cohorts were also added to the curatedMetagenomicData R package along with their corresponding metadata. Validation Cohort1 is available in the European Nucleotide Archive (ENA) under the study identifier PRJEB27928, Validation Cohort2 is available in the DDBJ databases under the accession number DRA006684.


