Abstract
Relaxation-induced dipolar modulation enhancement (RIDME) time trace shapes reveal linear scaling with the proton concentration in homogeneous glassy samples. We describe here an approximate diffusion equation-based analysis of such data, which uses only two fit parameters and allows for global data fitting with good accuracy. By construction, the approach should be transferable to other pulse EPR experiments with longitudinal mixing block(s) present. The two fit parameters appear to be sensitive to the type of the glassy matrix and can be thus used for sample characterisation. The estimates suggest that the presented technique should be sensitive to protons at distances up to 3 nm from the electron spin at a 90% matrix deuteration level. We propose that a structural method might be developed based on such an intermolecular hyperfine (ih-)RIDME technique, which would be useful, for instance, in structural biology or dynamic nuclear polarisation experiments.
Relaxation-induced dipolar modulation enhancement (RIDME) time traces follow linear scaling law with proton concentration in homogeneous glassy water–glycerol samples and can be described quantitatively by a newly derived diffusion equation.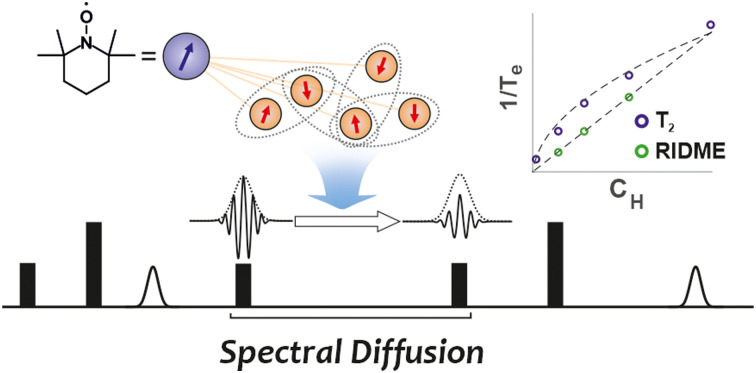
1. Introduction
Relaxation-Induced Dipolar Modulation Enhancement (RIDME) experiment is known as one of the tools in the pulse dipolar spectroscopy (PDS).1,2 RIDME is particularly useful for spin centres with broad EPR spectra and longitudinal relaxation times from few microseconds to few tens of microseconds.3–10 Still, the composition of the RIDME signal is by far less accurately described than the one of the most conventional PDS technique – Double Electron–Electron Resonance (DEER).11,12 For frozen water/glycerol solutions, it is known that in contrast to the shape of the DEER trace the shape of the RIDME trace is not only sensitive to electron–electron dipolar interactions, but also contains a decaying contribution due to the electron–nuclear (hyperfine) interactions between the unpaired electron spin and the bulk nuclei, mostly protons.13 We will refer to this contribution as the hyperfine part of the intermolecular RIDME decay, or simply intermolecular hyperfine (ih-)RIDME decay.
The main reason for the appearance of the ih-RIDME decay is the proton spin diffusion, which leads to continuous quasi-stochastic variations of the electron–nuclear hyperfine couplings, i.e. a process that one can call electron (hyperfine) spectral diffusion.4,14,15 We would like to stress the difference between the electron spectral diffusion and the proton spin diffusion.16,17 The former process describes how the overall hyperfine coupling of an electron spin with the nuclear bath fluctuates. The latter is a part of nuclear spin dynamics manifesting itself as numerous quasi-stochastic exchanges of spin projections of neighbouring nuclei. Both nuclear spin diffusion and electron spectral diffusion, in core, rely on pseudo-secular terms in the nuclear Hamiltonian.
By its nature, proton spin diffusion is a deterministic process, and it appears quasi-stochastic only due to the very large number of interacting nuclear spins. However, this feature of the proton spin diffusion (and thus also of the electron hyperfine spectral diffusion) reveals only under refocusing conditions, whereas during the RIDME mixing block the deterministic nature is hidden and the outcome is not distinguishable from the one of a true stochastic process. It is therefore attractive to attempt describing the related electron spectral diffusion in the form of a diffusion equation. Such a description appears especially interesting because electron–proton hyperfine interactions are often numerous and weak, so that proton spin diffusion indeed should lead to a slow stochastic drift of the overall hyperfine frequency of the electron spin, with numerous small (quasi-)random changes on the time scale of signal decay. Another important feature of the electron's hyperfine interactions with remote protons is that due to a large number of weak hyperfine interactions summed for one electron spin and due to the averaging over an ensemble of electron spins the overall electron hyperfine frequency distribution can be assumed to be approximately Gaussian.
Here, we present an analytical description of the ih-RIDME decay, based on a formally continuous longitudinal spectral diffusion (LSD) equation, in some respects conceptually repeating the long known approach of Portis,14 however operating over the electron hyperfine configurations distribution (multi-proton states) instead of the single proton NMR spectrum (single-proton states). The analytical results are then converted to numeric simulations and compared to a set of RIDME data for nitroxide radicals in frozen water/glycerol solutions with different 2H/1H ratios. It appears that the proposed diffusion-like description is very accurate within a broad range of mixing times and proton concentrations. Furthermore, we demonstrate that naturally appearing diffusion coefficient D and spectral width σ parameters are characteristic for the type of the glass and for the given bulk proton concentration. Accuracy, clear parametrisation and a nice scaling law allow us proposing that one can attempt constructing a structural method based on the presented theoretical description. Thus, in the final part of the manuscript we discuss briefly some particular ideas for the applications of our methodology to DNP and structural biology problems.
2. Theory
2.1. Introductory remarks and definitions
Although exhaustive description of nuclear bath evolution may demand a formalism explicitly operating with different nuclear configurations, we exploit here a formalism that only takes electron–nuclear dipolar energy into consideration. The idea behind such an approach is that different nuclear bath states with the same dipolar energy (with respect to the electron spin) on average demonstrate the same evolution behaviour.
We start with a model spin Hamiltonian
 |
1 |
assuming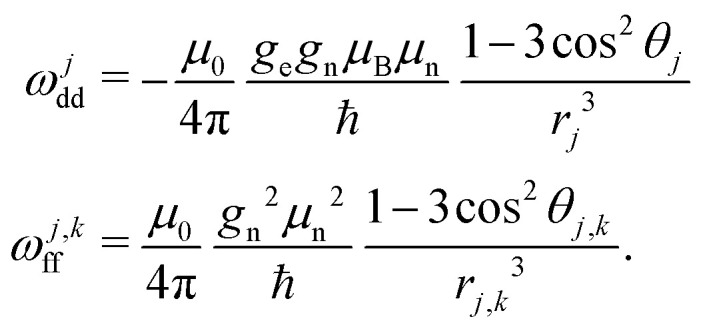 In the above equations, ωEZ is the electron Zeeman frequency, ge and gn are the electron and nuclear g value, respectively, μB and μn are the Bohr and the nuclear magneton, respectively, rj is the distance from the electron to the nucleus with index j, and θj is the corresponding dipolar angle, ωj,kff is the proton–proton coupling for the proton spins with indices j and k (subscript ff stands for “flip-flops”). This spin Hamiltonian can be extended by adding the intramolecular hyperfine interaction term. We shall see in the following that both the EZ term and the intramolecular hyperfine term are not important for our derivations and can be dropped.
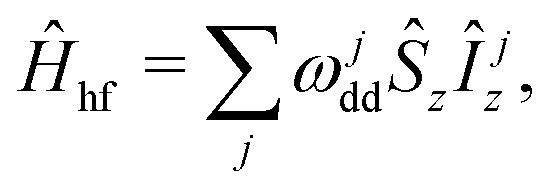
The second term in this spin Hamiltonian is the secular part of electron–nuclear dipole–dipole (DD) interaction and the third term the pseudo-secular part of nuclear DD interaction which drives the evolution of the nuclear spins bath (‘nuclear spin flip-flops’). Note that we excluded here the pseudo-secular contributions ŜzÎx,y. In the case of transverse electron spin evolution, these terms drive electron–nuclear transitions and the dephasing of resulting ESEEM oscillations contributes to some extent to transverse spin echo decay.18 In the LSD case, the relevant terms decay at the beginning of the mixing block, and can be neglected for the typical mixing times used. The pure longitudinal electron magnetisation is not affected by these terms due to commutation of Ŝz and ŜzÎx,y operators. Thus, during the evolution time of the RIDME mixing block, the key chaotisation factor in the ‘electron–nuclear dipolar bath’ is the proton spin diffusion.
In the analysis of the hyperfine frequency distributions, the nuclear flip-flop term can be eliminated. This term is, however, important for describing the spin dynamics of this system. The analysis will be further conducted in the coordinate frame rotating with Larmor frequency of electron spin, which allows us to set the first term in the spin Hamiltonian to zero:
 |
2 |
 |
3 |
Eqn (2) describes the ‘static’ spin Hamiltonian, appropriate for calculating the hyperfine frequency offset distribution for the electron spin, while the eqn (3) describes the rotating-frame spin Hamiltonian for the spectral diffusion dynamics calculations. The first term now gives off-resonant frequency due to coupling with the nuclear bath. The reason for RIDME background decay is then poor correlation of this offset before and after mixing block, due to the quasi-stochastic evolution upon proton flip-flops.
Considering the dynamics of such a spin system, first of all, we note that proton flip-flops cannot lead to a change of the electron spin g− and intramolecular hyperfine tensor parameters and their respective orientations in static magnetic field. Therefore, we can describe the time evolution of all excited electron spins as a sum of evolution traces for subensembles of electron spins characterised by nearly identical g− and intramolecular hyperfine tensor parameters and orientations. At spin concentrations relevant for pulse EPR spectroscopy such subensembles will still contain statistically large numbers of spins. In the following, for simplicity, we consider only one such subensemble of electron spin centres, so that intrinsic electron resonance frequency is fixed, and its variations are only due to the intermolecular electron–proton interactions, provided that we have neglected contributions from all other nuclei with much weaker magnetic moments.
In the frozen glassy state, each individual electron spin has certain spatial arrangement of nuclear spins around it, and here we assume that during the spectral diffusion process these positions stay unchanged or can be characterised by their mean values averaged over very fast vibrations and/or librations. Each proton can be characterised by the projection of its nuclear spin on the direction of static magnetic field 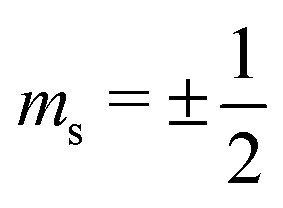 . Thus, for the given spatial distribution of M protons with coordinate vectors
 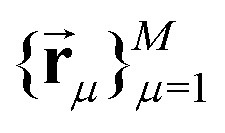 we will have K = 2M different nuclear spin configurations {al}Kl=1.
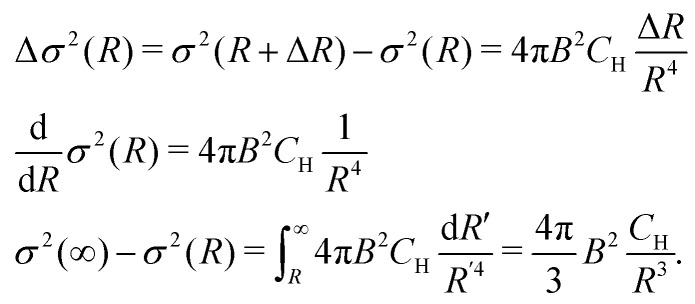
Practically, we do not need to include all protons in the sample to the number M, due to the following considerations. The volume of a thin spherical layer of radius R and fixed thickness ΔR increases with R as R2. The dipolar electron–proton interaction scales with the electron–proton distance Rd as Rd−3. The number of protons in a given volume scales linearly with the volume. Assume we know the value of σ2 in case of all protons closer than some distance R were taken into account. How will this value change when we extend this distance? All protons within a small distance interval ΔR contribute to the electron–nuclear interaction with random signs and produce a hyperfine interaction energy distribution with the variance per one proton
 |
4 |
where the constant B = 5.55 × 10⁻²³ Hz m3 = 0.0555 MHz nm3. The contribution to σ2 from N protons within this thin layer is exactly N times bigger. Since  we find
 |
5 |
This function decreases quite fast with increasing radius, and, as a result, the key region for the electron spectral diffusion would be restricted to the nearest few nanometers around the electron spin.
To better estimate the characteristic size of this volume, we need to take into account that in the case of static longitudinal orientation of the electron magnetic moment the so called blocked volume would appear. This comes into play because the static electron magnetic moment creates a gradient of the local magnetic field in its vicinity. This magnetic field gradient leads to different resonance frequencies for the two dipolar coupled proton spins. As a result, in the close vicinity of a static electron spin the proton–proton flip-flops get less efficient, and do not substantially contribute to the electron spin's spectral diffusion. We will give some considerations on how to estimate this blocking radius Rb in a separate section, but roughly this should be two-three times smaller than the electron–proton distance where the change of the hyperfine interaction on the length of two hydrogen van der Waals radii equals to the proton–proton dipolar coupling (equality radius Req). Assuming the ratio of electron and proton magnetic moment to be 660 and hydrogen van der Waals radius to be 120 pm, we get a rough estimate of the equality radius of 1.2 nm.
According to the above σ2 ∝ 1/R3 law and the given estimate of the blocking radius 0.3Req ≲ Rb ≲ 0.5Req one would expect that protons at the distances 2–3 times longer than this blocking radius or even a bit further away from the position of the electron spin might still substantially contribute to the shape of the electron spectral diffusion trace. The distances of few nanometers around paramagnetic centre are of high interest both for DNP techniques and for site-directed spin labeling (SDSL) and structural EPR studies of biomolecules. Note also that this distance range appears to exceed the typical sensitivity range for hyperfine spectroscopy and ENDOR. Thus, developing a quantitative description of the spectral diffusion in RIDME experiment might produce a valuable tool with broad range of applications.
So, we can assume that our proton configuration al needs to take into account M proton spins at electron–proton distances above some blocking radius Rb but below some cutoff radius Rc. The Rc value is then defined, based on the required accuracy of description: for instance, accuracy of 0.1% for the σ2 of the local field distribution at the electron spin site can be achieved with Rc = 10Rb. For the analytical calculations we can assume that Rc and M are very large, leading to an accurate calculation of the electron–nuclear frequency offset. For a given proton configuration al, the frequency offset for the electron spin can be computed as
 |
6 |
where mls,j is the nuclear spin quantum number ms for the spin with index j in the configuration with index l. As all the corresponding energy differences ħω are well below thermal energy, we can to a very good approximation state that in thermal equilibrium all the configurations al will be equally populated (for probability P(al) we can state that P(ap) = P(aq), for any p and q). Since with increasing number of proton spins the total number of configurations K is getting very large very quickly, we can also consider a quasi-continuous spectrum of frequencies ωl, and define a density of states function p(ω), with the normalisation
 |
7 |
We can also define the normalised probability density function for this distribution of proton spin configurations: 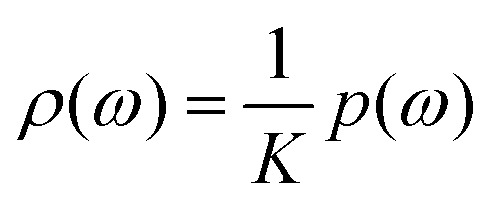 . We assume that to a good approximation p(ω) is a Gaussian function and that its width is much less than the limits of the above integration. The latter is automatically valid for large Rc values, so that Rc ≫ Rb.
In the spectral diffusion experiment we assume at zero time an ensemble of N nearly identical electron spins with delta-like distribution of frequency offsets due to the surrounding protons. This delta peak must be situated somewhere between ωmin and ωmax. This ensemble of electron spins can be described by a time-dependent probability density function p̃(ω,t). In the initial derivation we neglect longitudinal electron relaxation, and therefore the total number of electron spins in the ensemble is constant at all times, so that
 |
8 |
at any time t. Our purpose is to compute the time evolution of the magnetisation of this ensemble of electron spins under the assumption that for large enough N this reaches the statistical limit corresponding to averaging over different spatial distributions of protons around electron spin and over different proton spin configurations. Thus, we can set a condition that at infinite time the function p̃(ω,t) approaches ρ(ω).
During the longitudinal spectral diffusion process, however, part of this ensemble of electron spins will get lost due to stochastic moves through the hyperfine spectrum, so that not all the electron spins contribute to the overall magnetisation at non-zero evolution times. To include the phase evolution of a spin ensemble into the calculations, it is actually much more convenient to operate on the magnetisation distribution
(ω,t), which can be at zero time defined as  normally, with all zero-time phases ϕ(ω,0) equal to zero. Magnetisation spectrum
(ω,t) works simply as prism which decomposes bulk/macroscopic/observable magnetisation
 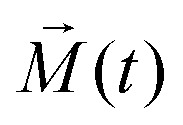 into contributions from different sub-ensembles characterised by specific electron–nuclear coupling frequency ω and a corresponding accumulated phase ϕ(ω,t). Note, that the overall magnetisation, which is computed according to the following relation
 |
9 |
can decay down to zero during the ensemble's transverse evolution.
The main idea of our computational approach is that the proton flip-flops dynamics is dominated by the flip-flops in the nearest neighbour proton pairs, which are characterised by the strongest proton–proton couplings, and that each single proton flip-flop changes the all-proton hyperfine frequency of the electron only very slightly. Therefore, we assume that the (ω,t) distribution evolves through a diffusion-like process, with spectral jump probability quickly decreasing with the frequency step δω. This is very close to the approach of Portis, with the difference that in our case we consider a “multi-proton” EPR spectrum, while in the Portis' approach a “single proton” NMR or a “single electron” EPR spectrum was considered.14 Accordingly, in the work of Portis, spectral diffusion was taking place over the proton or electron spectrum of some arbitrary shape, while in our case, due to statistically large number of participating proton spins, we can to a good approximation assume a Gaussian spectral shape.
2.2. Derivation
In the first step of our derivation, we substitute the detailed balance for different all-protons configurations, by its form averaged over all configurations within a narrow frequency range from ω to ω + dω. This can be written as
 |
10 |
Herein p̄(ωi → ωj) and p̄(ωj → ωi) are the mean probabilities per unit time that nuclear bath changes its coupling energy with electron, accordingly, from ωi to ωj or from ωj to ωi. Since we assume the high-temperature case, all configurations al are equally populated in the equilibrium, and therefore the density of states (density of all-protons configurations) is given by the equilibrium distribution p(ω) = Kρ(ω). The detailed balance principle in this case looks as follows:
| p(ωj → ωi)p(ωj) = p(ωi → ωj)p(ωi). | 11 |
It is convenient to introduce a transition parameter Λij such that
| p(ωi → ωj) = Λ(ωi,ωj)ρ(ωj) | 12 |
| p(ωj → ωi) = Λ(ωi,ωj)ρ(ωi) | 13 |
This will automatically preserve the detailed balance (11). If state density is zero at some particular frequency ωi then we expect correspondingly a zero probability to make a transition to this frequency, so no formal contradictions appear. It can be also shown that Λ(ωj,ωi) formally equals to Λ(ωi,ωj). This is why we can say that Λ connects the pair of the states.
After substitution (10)–(13):
 |
14 |
Next, following assumptions were made to get the final form:
• Upon any reasonable relaxation mechanism only a small isolated group of nuclear spins is involved in each elementary step. It means that the transition constants Λij decrease rapidly with |ωi − ωj| and only a small number of terms in the sum above are non-zero;
• Λ(ωi,ωj) is effectively a function of only frequency difference |ωi − ωj|, which heavily simplified the following theory;
• Both μ(ωi) and ρ(ωi) are twice differentiable with respect to the electron–nuclear interaction frequency ωi;
• Both μ(ωj) and ρ(ωj) can be expanded up to the term of the second order of Taylor series.
With these assumptions we get After substitution to (14)
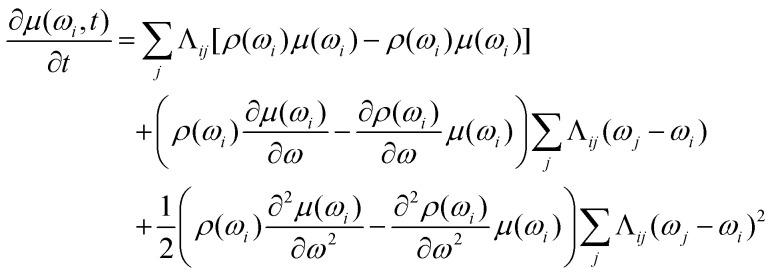 |
15 |
The first term on the right-hand side is exactly zero. Under our assumptions Λij is an even function of frequency difference (ωj − ωi), and, therefore, the second term is also zero. The summation in the third term can be rewritten using only Δω = ωj − ωi: and consequently will not depend on the ωi. The resulting differential equation can be written in the simple form
 |
16 |
The function Λij in the sum for D is non-zero only for frequency differences (ωi − ωj) of the order of the maximum proton–proton dipole–dipole coupling or smaller, and the sum can be substituted by an integral:
In fact, one would expect that the parameter D is at least weakly dependent on the frequency offset from the centre of the hyperfine spectrum. Far at the shoulders of this distribution, to get the given frequency offset, one needs to set the majority of the nearest protons to the same nuclear spin state ms. In such a configuration, proton flip-flops can only take place for remote proton pairs, and thus the mean spectral diffusion rate would be lower than in the centre of the hyperfine frequency distribution.
Our assumption, which may thus appear rough at first sight, can be justified by observing that at long enough evolution times the distribution of the electron spin ensemble over the possible hyperfine frequency offsets becomes broad. Hence, the main changes take place in the central part of the hyperfine frequency range, and the approximation of constant D may work sufficiently well. In the following we will see that, indeed, experimental RIDME traces demonstrate some deviations from this approximate description at short evolution times, but approach this description at intermediate evolution times, which are also the most informative ones for the analysis of the spectral diffusion properties of the sample.
Note, finally, that one cannot completely exclude the possibility that at some experimental conditions the approximation of constant D would still be feasible, but it will be required to keep more non-zero terms in the above Taylor decomposition for μ and ρ. Higher order Taylor terms in this case would lead to higher order partial derivatives on ω in the resulting equation, that would substitute the eqn (16).
2.3. Properties of the equation, general solution and its numeric implementation
The eqn (16) has some key properties, which make it consistent with our general view on such spin systems. Most importantly, the overall magnetisation (9) is conserved during the LSD process, while the energy is dissipated, and an analytic expression for the dissipation time τE is available (see ESI,† Section 1). The simple cases of ρ(ω) = const and μ(ω,t0) = ρ(ω) result in a classical form of a homogeneous diffusion process, and in a stationary time independent solution μ(ω,t) = ρ(ω) (see ESI,† Section S1).
There was no convenient general analytical solution found for the eqn (16). Thus, for numerical computations a form as a series was chosen
 |
17 |
where 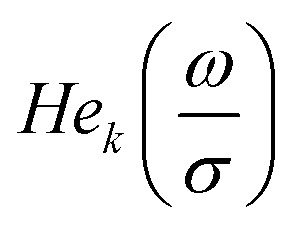 are probabilist's Hermitian polynomials.19 The vector of time-dependent coefficients can be computed as
 |
18 |
with the time-independent matrix
 |
19 |
As a straightforward application of the derived formalism, we compute the correlation function of the dipolar interaction frequency over observation time T, Cω(T). It turns out that this function is simply proportional to a matrix element
 |
20 |
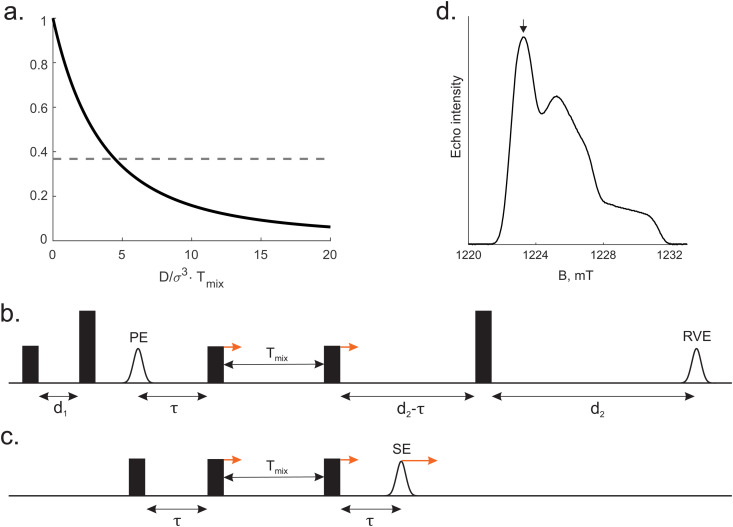
Note that the basis set is enumerated starting from 0. The detailed derivation of (18) and (19) as well as proof of (20) is provided in the ESI.† The normalised correlation function versus dimensionless combination of parameters 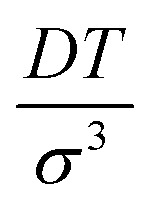 is depicted in Fig. 1a.
Fig. 1. (a) Normalised frequency correlation function vs. dimensionless parameter DTmix/σ3 (solid line), 1/e (dashed line). (b) Pulse sequence of the conventional 5 pulse RIDME experiment. Short and long pulses stand for flip angle of π/2 and π respectively. PE is the primary echo, RVE is the refocused virtual echo. (c) 3 pulse version of the RIDME experiment. All pulses have flip angles of π/2. SE is the stimulated echo. (d) Typical Q-band ED EPR spectrum of TEMPO in water/glycerol matrix. The arrow points to the chosen spectrum position for RIDME measurements.
The pulse sequence of 5-pulse RIDME experiment and the simpler 3-pulse RIDME pulse sequence de facto used in the calculations are given in Fig. 1b and c accordingly (see computational details in ESI†). After the signal summation within the phase cycling protocol (see ESI,† Section S4), one can find that the ih-RIDME contribution is
 |
21 |
where μτ(ω,Tmix) is short for the result of μ(ω,0) = ρ(ω)eiωτ relaxation during time Tmix. Here, ℜ is the real part operator, and R(τ,Tmix) is the RIDME echo signal that only accounts for the LSD (without considering proton spectral diffusion during the transverse evolution), for the mixing block of duration Tmix at a time τ after the primary echo. Thus, RIDME echo intensity is proportional to the real part of relaxed magnetisation spectrum's Fourier transform.
Finally, we can substitute the representation of μτ(ω,Tmix) as a series (17)
 |
22 |
As it is shown in ESI† (see ESI,† eqn (S7))
 |
23 |
We emphasise that in eqn (22) and (23)σ and τ enter together as a combined parameter στ. This gives a theoretical reason for the congruence of RIDME-traces discussed below. For systems with different σ parameters the time scale can be adjusted such that στ becomes the same and traces with the same Tmix overlap. This strictly holds true if the ratio D/σ3 remains the same.
3. Experimental
3.1. Chemicals
D2O (Sigma Aldrich, 99.8 atom% D), 2,2,6,6-tetramethylpiperidine-1-oxyl (TEMPO) (Sigma Aldrich, 99%), H8-glycerol (C3H5(OH)3, Carl Roth, >99.7%), D8-glycerol (C3D5(OD)3, Sigma Aldrich, >98 atom% D) were used without further purification.
3.2. Sample preparation
The stock solution of TEMPO in D2O (C(TEMPO) = 1 mM) was mixed with pre-calculated volume of H2O or/and D2O. Further, prepared solutions were additionally mixed with protonated or deuterated glycerol in approximately 1 : 1 volumetric ratio (see the detailed samples composition in the ESI†) to ensure glass formation upon freezing. Concentration of TEMPO in final solutions was aimed at 50 μM. 30 μL of each solution were transferred to a 3 mm quartz tube followed by shock freezing in liquid nitrogen. Composition of each solution under investigation is summarised in Table 1. Pipetting of chemicals was controlled by weight using analytical balances which allowed for accurate proton concentration calculations.
List of the samples used in this study, their proton–deuteron composition, transverse (T2), and longitudinal (T1) relaxation times at 50 K. H/D in samples 3 and 4 means both H2O and D2O were used for sample preparation to tune the final proton concentration. Proton fraction is calculated as 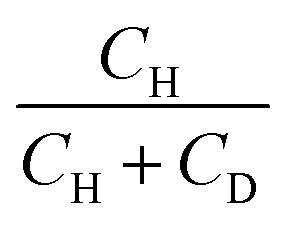 .
.
| Sample | Water | Glycerol | C H, M | Proton fraction, % | T 2, μs | T 1, ms |
|---|---|---|---|---|---|---|
| 1 | H | H | 104 | 94.4 | 4.2 | 790 |
| 2 | H | D | 56.4 | 51.1 | 6.4 | 810 |
| 3 | H/D | D | 30.2 | 27.3 | 9.0 | 680 |
| 4 | H/D | D | 15.0 | 13.6 | 15.2 | 690 |
| 5 | D | D | <2 | <2 | 49 | 980 |
| 6 | D | H | 47.9 | 43.4 | 7.4 | 830 |
3.3. EPR measurements
All pulsed EPR measurements were performed with a Q-band Bruker ElexSys spectrometer (MW frequency 34–35 GHz), with a home-built resonator for oversized 3 mm tubes.20 Measurements were conducted either at the temperature of 50 K, or, if indicated, as a temperature series. The temperature stabilisation was established with an Oxford Instruments He-flow cryostat. If not stated otherwise, π/2- and π-pulses with the lengths of tπ/2 = 12 ns and tπ = 24 ns, respectively, were used. The following pulse sequences were used for the RIDME and for the auxiliary experiments:
ED EPR was measured as Hahn echo intensity vs. magnetic field: (π/2)–τ–(π)–τ–det, with τ = 400 ns;
T 2-relaxation: (π/2)–τ–(π)–τ–det (τ is incremented) with starting delay of 400 ns;
T 1-relaxation: (π)–T–(π/2)–τ–(π)–τ–det (T is incremented) with τ = 400 ns, and initial T value of 1 μs;
RIDME measurements: the pulse sequence is shown in the Fig. 1b, time delays were d1 = 0.4 μs, d2 = 4.2 μs. Values of mixing time were chosen as a geometric sequence Tmix = 15 × 2n μs (n = 0,…,5). All relaxation and RIDME traces were recorded at the maximum of ED EPR spectrum (Fig. 1d). In the RIDME measurements, the deuterium ESEEM-averaging protocol21 with 8 steps of 16 ns was used.
3.4. Relaxation data summary
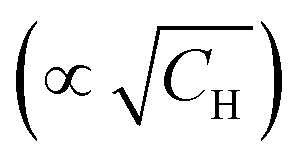
The relaxation data for the studied samples are summarised in Table 1. One can notice that T1 does not significantly change with the change of deuteration degree, while T2 traces reveal strong dependence on H/D-composition of the solvent. As expected, a higher concentration of protons resulted in a faster transverse relaxation. An interesting observation, regarding transverse relaxation, was that the dependence of the 1/T2 times on the proton concentration is quite accurately linear in the T2vs.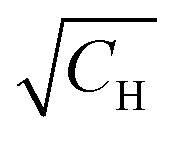 coordinates (see ESI,† Fig. S3). This finding is not in consistency with known theoretical model of Brown.22 Although its analysis lies beyond the scope of this work, it is to note that the shape of RIDME traces is more sensitive to proton concentration (∝CH) compared with T2-relaxation
  .
.
3.5. Numeric simulation of the ih-RIDME traces
As proposed in the Section 2, numerical computation of the ih-RIDME contribution, R(τ;Tmix), was carried out via a finite basis set of Hermitian functions (17). This implies computing a vector c⃑τ(0) of the magnetisation spectrum initial coefficients in the introduced basis set for every given value of τ(23). Next, evolution of the magnetisation spectrum during mixing time Tmix, c⃑τ(Tmix) results from direct computation of the matrix exponent (see eqn (18) and (19)). After that the resulting vector can be transformed into the value of interest via summation (22). All numerical operations were carried out in Matlab (https://www.mathworks.com). Scripts are available on request.
4. Results and discussion
4.1. Primary data analysis
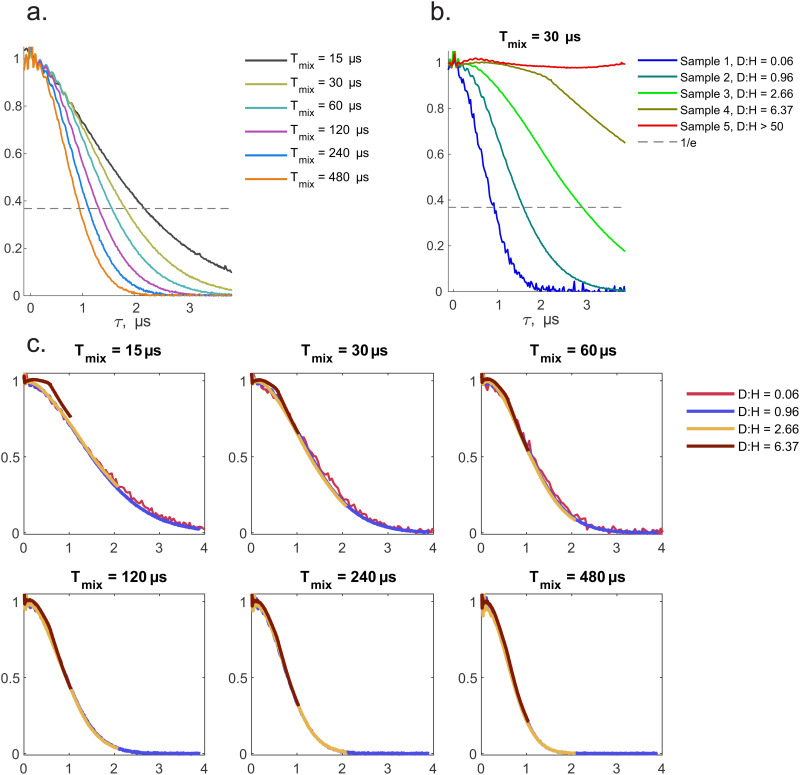
Fig. 2 shows normalised experimental RIDME traces superimposed for different Tmix (a) and different proton concentrations (b). In accordance with our general understanding of the proton spin diffusion, the RIDME decay curves get steeper when proton concentration increases or when the mixing time increases. Both trends are explained by a higher number of nuclear flip-flops with increasing proton concentration or mixing time. Note that the sample with maximal deuteration degree does not show noticeable decay for the given duration of the mixing block. We refrain from discussing the possible origin of the weak oscillations. This fact illustrates that the contribution of deuteron–deuteron interaction to the spectral diffusion is negligible in all cases within the scope of this work. More accurate consideration will be presented later in this section.
Fig. 2. (a) Series of superimposed experimental RIDME traces measured on the sample 2 (D:H = 0.96). d1 = 0.4 μs, d2 = 4.2 μs. Mixing time is varied. (b) Overview of RIDME traces of 5 samples (D2O + H2O + D8-glycerol) with the fixed mixing time of 30 μs. Other delays are same as in (a). (c) Overlap of the experimental RIDME traces of sample 1 (red), 2 (blue), 3 (dark-yellow) and 4 (brown) where time axis are stretched. The time axis of the sample 2 is unchanged. Time axes of other traces were multiplied by a factor ‘proton fraction (sample N)/proton fraction (sample 2)’.
It was found that the shape of RIDME trace V(τ) depends on all delays of the pulse sequence (d1, d2, and Tmix, see also ESI,† Fig. S4), similar to the behaviour of the RIDME background contribution due to spontaneous electron spin flips, although with different time scale.13
In a next step, the relation between proton concentration and time axis stretching was investigated (Fig. 2c). We found a simple relation: for the same Tmix the RIDME background decay of TEMPO in the water–glycerol mixture with bulk proton concentration CH overlaps with the one with concentration 2·CH when the time axis of the former trace is stretched by the same factor of 2. This observation can be formalized by a simple expression (with a, an arbitrary positive real number):
| V(τ;Tmix,a·CH) = V(a·τ;Tmix,CH) | 24 |
In Fig. 2c, the time axis is adopted from sample 2 (proton fraction 51.1%). Time axes of samples 3 and 4 were multiplied by a constant factor ‘proton fraction (sample N)/proton fraction (sample 2)’. The same superposition can be achieved by multiplying the time axis of each sample by the proton fraction or concentration of this sample. It can be noticed that experimental traces do not perfectly match at short mixing times (15 and 30 μs).
Furthermore, we found that, to a quite reasonable precision, the RIDME trace V(τ) can be presented as a product:
| V(τ;d1,d2,Tmix) ≈ R(τ;Tmix)·F(τ;d1,d2). | 25 |
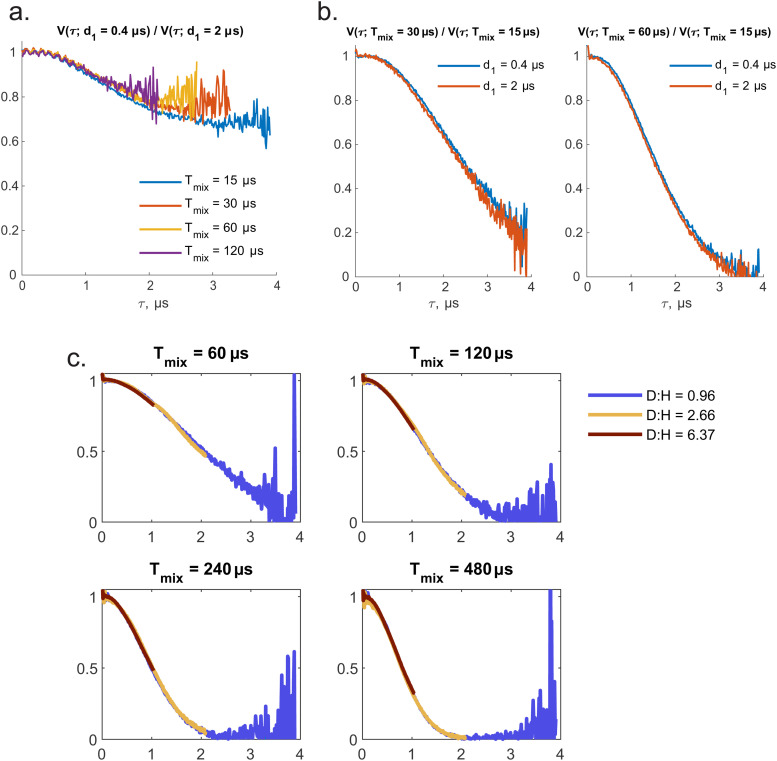
With R(τ;Tmix) describing the LSD contribution and F(τ;d1,d2) describing the transverse evolution related decay. To demonstrate this, we consider point-wise divided RIDME traces for one particular sample but with different pulse delays. In particular, the approximation (25) predicts that for two traces with the same Tmix but different d1 or d2 the result of point-wise division doesn't depend on the specific Tmix value. This is illustrated in Fig. 3a. At the same time, this approximation implies that the value of d1 is irrelevant for the ratio of two traces with different Tmix delays. The validity of this relation is shown in Fig. 3b. One can see that the former approximation is slightly less accurate than the latter one. Therefore, here, to improve the accuracy in the fitting of the final series of RIDME traces, we used the data sets with identical transverse evolution delay time sets [d1,d2]. In the following we would like to focus on the LSD contribution to the ih-RIDME decay. Therefore, we will extract R(τ,Tmix)-contributions by trace division: as an intermediate step in the analysis routine the series of RIDME measurements with different Tmix is divided by the trace with lowest Tmix which is referred to as a reference trace (or accordingly reference Tmix). The series of such divided traces for different mixing times and proton concentrations is shown in the Fig. 3c, also demonstrating nearly perfect scalability of the characteristic decay shape with the proton concentration, in accordance with eqn (24).
Fig. 3. (a) Series of divided RIDME decays V(τ;d1 = 0.4 μs)/V(τ;d1 = 2 μs) for various mixing times. Original traces were measured fully (d2 = 4.2 μs) but the results of the division are cut because of noise explosion. (b) Overlap of divided RIDME decays corresponding to d1 = 2 (blue curve) and 0.4 μs (orange curve). (c) For each sample the series of experimental RIDME traces was divided by those with Tmix = 30 μs. After that the time stretching procedure based on proton concentration was repeated (see previous figure). Simply, it is a demonstration of scalability of R(τ;Tmix)/R(τ,Tmix = 30 μs).
Such a simple relation, in fact, provides the basis for very valuable conclusions. First of all, as it was discussed in Section 2, if we assume that the diffusion eqn (16) holds true, then the simultaneous scalability of Tmix-series of RIDME traces can be only achieved if D/σ3 remains constant regardless of mixing time or proton concentration. Thus, this combination of parameters can serve as an invariant characteristic of proton–proton interactions in a particular solid matrix. The second important consideration leads to a specific relation between the width of the hyperfine frequency distribution, σ(CH), and the corresponding proton concentration CH. In the theoretical part we showed that kinetics of RIDME decay is a function of product σ(CH)τ. The stretching symmetry discussed above (24) can be reformulated as
| σ(a·CH)τ = σ(CH)·(a·τ). | 26 |
From (26) it follows immediately that σ ∝ CH. At first glance, it contradicts the eqn (5) where 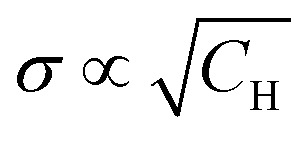 is explicitly stated. The apparent contradiction can be resolved by assuming that the lower limit of the integration, Rb, also depends on concentration. This limit specifies the minimum distance of protons from the electron spins from which on they contribute substantially to the observable spectral diffusion and, thus, to the value of σ. To demonstrate why this boarder must depend on bulk concentration CH we first consider only one pair of vicinal protons. The non-secular term in the model Hamiltonian (1) can only induce transitions between |αβ〉 ↔ |βα〉 states of the nuclear pair. The corresponding 2-by-2 sub-block of the Hamiltonian has the shape
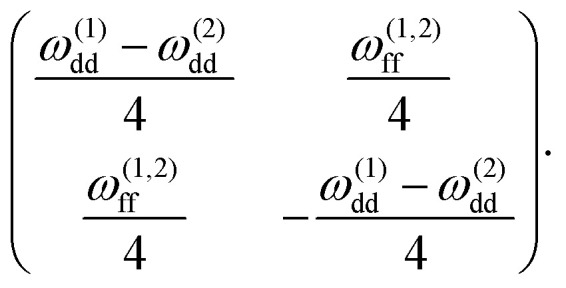 |
27 |
For a high rate flip-flops the off-diagonal element must be comparable or greater than the difference of diagonal elements. This condition leads us to an approximate expression
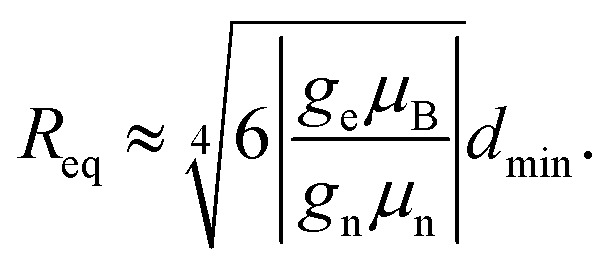 |
28 |
Here, dmin is the mean next-neighbour interspin distance in nuclear ensemble. Estimation for the intramolecular proton pair of the H2O molecule (dmin = 1.5 Å, μe/μH ≈ 660) results in critical distance to electron, where the equality of these two terms is achieved Req of about 1 nm. The intermolecular proton–proton distance in water is 267 pm, assuming OH bond and angle 96 pm and 104.48 degrees, and OH distance in a hydrogen bond of 197 pm. Therefore, for the intermolecular proton–proton couplings the estimate for the equivalence radius Req and blocking radius Rb would be 267/150 ≈ 1.78 times larger than for the case of intramolecular proton–proton coupling. Thus, in this case the minimal value of the Req would be Req ≈ 1.78 nm. Note also the rough estimate Req ≈ 1.2 nm for protons at a van der Waals contact distance, discussed above in the theoretical section. The blocking radius Rb should then be substantially smaller than the corresponding Req value.
However, the transfer of proton polarisation between different water molecules relies on the intermolecular proton–proton couplings, which would be indeed concentration dependent. The mean strength of the next-neighbour intermolecular proton–proton couplings in a glassy frozen solution depends on the concentration of protonated solvent molecules. The minimal proton–proton distance would be of the order of the double van der Waals radius (2RW) for hydrogen atom, and above that distance the proton–proton distances can be described by the radial single-proton probability density function pH(r). We can assume this function to describe a homogeneous spatial distribution of protons, except for the excluded volume due to the van der Waals repulsion. According to Poisson probability distribution, the probability to find next neighbour proton within an infinitely small distance range dr at a distance r would be
 |
29 |
The probability distribution pH(r) scales vertically, according to the bulk proton concentration, while we can to a very good approximation assume that the probability ratios for different distances stay unchanged, i.e. the overall shape of pH(r) is not concentration dependent. For a fully protonated sample, the probability density for the next neighbour pnext(r) has a sharp peak just after the 2RW distance.23 At lower bulk proton concentrations, due to the downscaling of the p(r), this peak broadens and its mean value shifts towards longer distances. For a uniform spatial distribution of protons, the mean proton–proton distance scales up as an inverted cubic root of the proton concentration. The radius at which proton flip-flops get blocked by the electron–proton interaction is related by some factor to the Req, the distance of an equivalence between proton–proton and proton–electron interaction energy. Since the dipolar interaction both for proton–proton and electron–proton pairs depends on an inverted cube of the spin–spin distance, we can conclude that the inverted cube of the blocking radius for the intermolecular proton flip-flops would scale up linearly with the proton concentration:
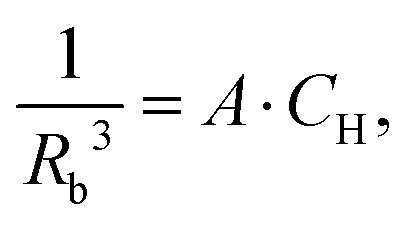 |
30 |
where A is a constant that depends on the magnetic properties of electron and proton spins. Note that at ambient conditions we can assume that the intramolecular proton–proton distances are nearly concentration independent, and, thus, for the intramolecular proton flip-flops no concentration dependence of the corresponding blocking radius is expected. For the intermolecular flip-flops, according to the eqn (5) and (30) we can write σ2(CH) ∝ CH2, which means that σ(CH) ∝CH, and that the eqn (26) holds true. In this case, the width of the proton hyperfine spectra at all concentrations depends on a single parameter, which can be chosen to be σmax – the width of the proton hyperfine spectrum in the fully protonated sample or a better defined σ/CH – a normalised spectrum width.
Some estimate similar to (28) would also be valid in the deuteron–deuteron situation. However, this would need to include the nuclear quadrupole interaction. The latter would also result in broad NMR spectrum of deuterons and thus in a yet smaller numbers of nuclear pairs with efficient flip-flops. Overall, as compared to proton case, for deuterium nuclei one would expect smaller σ values, larger Rb and very slow LSD dynamics (lower D/σ3 value). This is in agreement with the experimental data (red curve in Fig. 2b). The last combination, namely, proton–deuteron flip-flops, is not relevant as in the hetero-nuclear case pseudo-secular flip-flop term cannot efficiently mix nuclear levels.
We can conclude now that parameter Rb has the direct relation to the well-known diffusion barrier.24,25 This parameter separates a nuclear bath into two regions based on the vicinity to the unpaired electron. For pairs of distant protons (with distances to the unpaired electron >Rb) the typical values of the non-secular flip-flop matrix elements are similar to or dominate over the hyperfine frequency change upon such a flip-flop. Oppositely, for the nearby protons, with distances to the unpaired electron <Rb, the hyperfine frequency difference between the two flip-flop states are too large in comparison to the flip-flop couplings.
Finally, after combining Δ = D/σ3 = const and σ ∝ CH one can find that D ∝ CH3. The parameter Δ should depend on the average number of the intermolecular proton–proton contacts per one molecule. It would be very interesting to study in future if this parameter varies significantly between different matrices, and if so, the parameter Δ might become an important value to discriminate between different substances in EPR experiments.
To summarize this subsection, experimental RIDME traces demonstrate nearly exact time scaling with proton concentration, as well as quite accurate factorization of the transverse part and the longitudinal part of the RIDME signal (Fig. 2 and 3). These are thus the experimental constraints that need to be included in any theoretical description of such signals. For the presented theoretical treatment, these properties are reproduced, if we assume a concentration dependence of the blocking radius which can be rationalized as a concentration dependence of the average intermolecular proton–proton distance. There are two direct consequences for the data fitting procedure. First, we can separately fit a phenomenological function (e.g. Gaussian) to the transverse part of the RIDME signal. Second, such a Gaussian fit would then be a master curve for all data sets at all mixing times and, after concentration scaling, for all concentrations. The LSD part of the RIDME signal can then be fitted separately from the transversal evolution part, and, again, it is enough to fit data for one concentration, as they would automatically match measurements for other proton concentrations.
4.2. Data fitting
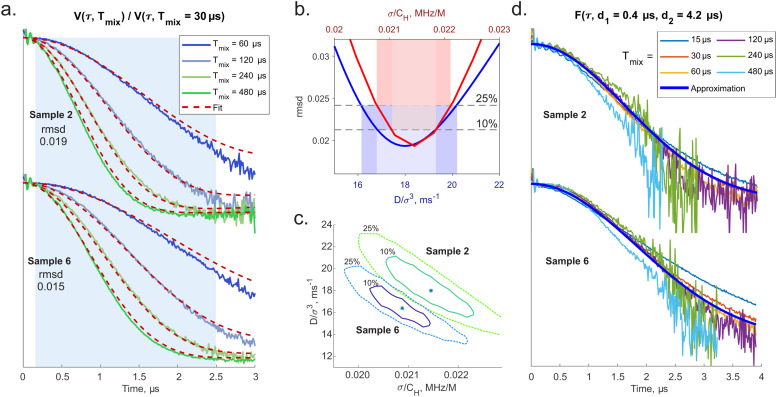
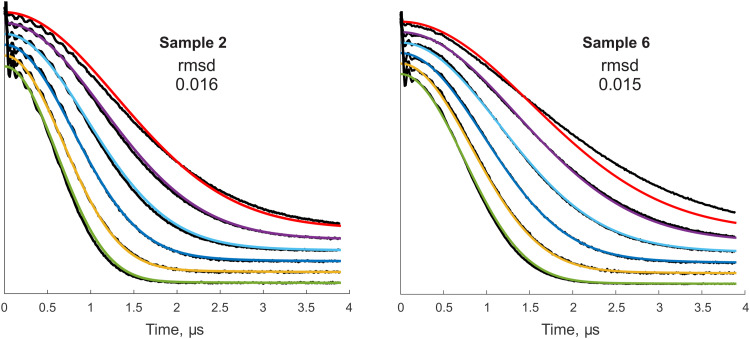
Global fitting of the series of RIDME traces for the sample 2 (H-water + d-glycerol, D:H ≈ 1), as for this sample the largest part of the decay curve was within the detected trace length, and sample 6 (d-water + H-glycerol, D:H ≈ 1.5) has been conducted on the basis of the presented theory. Note again that the fit for the sample 2 simultaneously works for the samples 3 and 4. The samples 2 and 6 were also chosen for the fit because their bulk proton concentrations are close (see Table 1), but, on the other hand, they differ in the microscopic proton bath structure. Sample 2 contains only O–H bonds in the water–glycerol network. In contrast, the sample 6 is enriched with C–H bonds which do not participate in building the hydrogen bonds network. Before data fitting for each sample, the LSD contributions were extracted from the experimental traces by point-wise dividing them by a reference trace with Tmix = 30 μs. At very short mixing times, comparable with the relaxation time T2, artefacts become notable,26 and also the overall agreement between our theoretical description and the experimental data is only very approximate (Fig. 4a). However, as we anticipated, at longer mixing times the approximation of the overall mean spectral diffusion rate appears to work better, and the agreement between the fitted data and the experimental traces starts to be very good (Fig. 4a). We can roughly estimate that this transition happens around the mixing time Tmix = 120 μs, or DTmix/σ3 ≈ 2 (see fitted parameters below). In the ESI,† Fig. S5 one can see that also taking a reference trace with too short mixing time (Tmix = 15 μs in the ESI,† example) makes the overall agreement between the RIDME data and the fit worse. Importantly, here, we essentially fit the whole series of data for different mixing times and proton concentrations (see the quality of concentration scaling in the Fig. 3) by just two fit parameters: Δ and σ/CH. Taken this simplicity of the parametrisation, the overall agreement between the fit and the experimental data is quite good. As discussed earlier, we hope that physical parameters extracted from the experiment will be useful in fundamental study of spin ensembles or in quantitative characterisation of nuclear spin reservoirs in the applied research. From this perspective, it is essential to carry out analysis of fitting uncertainty. Such an uncertainty may originate from the experimental data quality (noise) and from the model imperfections. The signal-to-noise levels in the presented divided traces are sufficient except of the very ends of the traces, where the signal decays almost to zero. To exclude this area, and also to exclude the echo crossing artefact near zero time, we have restricted the time range for the rmsd calculation to 0.1–2.5 μs. As it can be seen in Fig. 4a, within this range most of the traces decay nearly to zero, except for the trace with Tmix = 60 μs.
Fig. 4. Overview of fitting results: (a) series of RIDME traces measured for samples 2 and 6 (see Table 1) divided by those with Tmix = 30 μs. Best fits (dashed red curves). Highlighted in light blue is region of time domain which was included in calculation of rmsd. (b) One-dimensional scans of rmsd surface along fitting parameters: D/σ3 (blue curve) and σ/CH (red curve) corresponding to the sample 2. Coloured areas show the apparent uncertainties with respect to 10%- and 25% of the minimal rmsd. (c) Maps of two-parametric rmsd scans: minimal rmsd (stars), 10%-increase (solid lines) and 25%-increase (dashed lines) of rmsd. (d) Extracted transverse factors F(τ) for samples 2 and 6.
Note that the rmsd variations along a single fit parameter Δ or σ/CH give a somewhat misleading picture for the accuracy, since the main uncertainty originates from the correlation between these two fit parameters (see Fig. 4b). Instead, the full rmsd surface analysis was performed for both samples 2 and 6 (Fig. 4c). We have selected levels of exceeding the minimal rmsd of 10% and 25% as references for admitted parameter variations, because the main contribution to the deviations comes from the Tmix = 60 μs data, which are still in the short Tmix regime, while for all other data sets the quality of the fit is substantially better. By looking at the Fig. 4c, one finds that positions of best fit rmsd (blue stars) for the two samples are substantially separated: we have found that the corresponding ellipse-shaped sections of rmsd surface on the levels of 1.1 min rmsd and 1.25 min rmsd nearly do not overlap. All 4 ellipses demonstrate 2 principal directions deflected from parameter axes. The major axes show the mentioned correlation between Δ and σ/CH parameters that may introduce instability of fitting routine. Note that although the length of the major axis may seem large, indicating substantial parameter uncertainties, the major axes for the two samples under consideration are almost parallel. This suggests that RIDME background analysis might be capable of discriminating between different types of solid matrices, thus providing useful information on the sample structure. Another observation is that the correlation between D/σ3 and σ/CH is reversed. This is due to the partial compensation of e.g. too slow normalised spectral diffusion rate Δ by a somewhat broader hyperfine spectrum width σ. We propose that this correlation can be further reduced if RIDME traces with even longer DTmix/σ3 values can be measured with good signal-to-noise ratios and included into the fitting procedure (Table 2).
Summary of the experimental RIDME data fitting for samples 2 and 6. Uncertainties of the parameters are given and 10%-increase of rmsd while the other parameter was fixed. See a detailed discussion in the text.
| Sample | Water | Glycerol | D/σ3, ms−1 | σ/CH, MHz/M |
|---|---|---|---|---|
| 2 | H | D | 18.0 ± 1.2 | 0.0215 ± 0.0004 |
| 6 | D | H | 16.4 ± 0.8 | 0.0209 ± 0.0003 |
Next, we have aimed at extracting F(τ;d1,d2) as defined in expression (25). From the fit results' quality for the divided traces R(τ,Tmix)/R(τ,Trefmix) we can assume that computation of R(τ,Tmix) alone does not introduce systematic errors cancelling out after division. Thus, for each Tmix the ratio V(τ;Tmix)/R(τ,Tmix) ≈ F(τ) was computed as shown in Fig. 4b. Although the divided traces do not overlap perfectly as it is implied by (25), the deviations are small, and there is no obvious trend in their behaviour. A Gaussian decay approximation results in F(τ;d1 = 0.4 μs, d2 = 4.2 μs) ≈ exp(−0.19·τ2) for the sample 2 and exp(−0.15·τ2) for the sample 6. Because the scaling symmetry was determined for the experimental RIDME decay traces, which include the factor F(τ), the shape of F(τ) must be also stretched for other samples according to the proton concentration. As a final step, V(τ;Tmix) traces were reproduced as a product of predicted R(τ,Tmix) and unique fitted Gaussian function F(τ) (see Fig. 5). The fact that these full RIDME trace fits are very close to the experimental data implies that visual scatter or mis-match in experimentally obtained F(τ) at different mixing time can indeed have random nature. Note also that, interestingly, the scaling of the F(τ) function is linear with proton concentration, while nearly accurate scaling of the inverted transverse relaxation time T2 with the square root of proton concentration was determined (see ESI,† Fig. S3).
Fig. 5. Reconstruction of the experimental RIDME traces as product of the computed longitudinal component and the earlier extracted transverse component. Reconstructions are shown for the sample 2 (left) and 6 (right). Black lines are the experimental traces. From top to bottom the mixing time is 15, 30, 60, 120, 240 and 480 μs accordingly. For rmsd calculation time points from 0.1 to 2.5 μs were included.
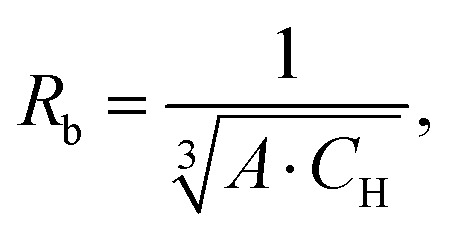
To summarise this discussion, we suggest a set of 2 parameters invariant with respect to the proton concentration CH for quantification of nuclear-driven electron spectral diffusion in solids: D/σ3 and σ/CH. The latter value is useful for blocking radius estimation via combining eqn (5) and (30):
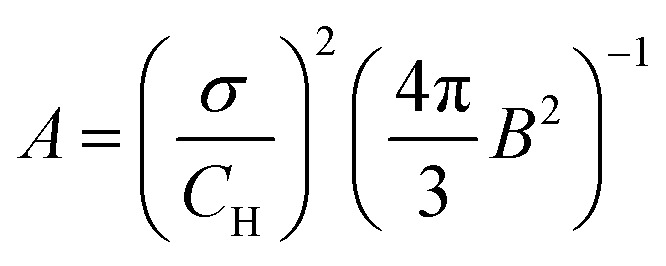 |
31 |
 |
32 |
where the constant B is defined in (4). In these calculations, it is more convenient to use proton concentration in number per cubic nanometer. By extrapolating results from sample 2 to a fully protonated water solution (CH = 111 M = 67 nm−3) we get Rb = 5.4 ± 0.1 Å. A sphere with such a radius covers completely all the intrinsic protons of the TEMPO radical.27 Thus, the LSD described here is indeed an intermolecular process. This value of Rb is indeed substantially smaller than the estimates above for Req, because the actual blocking condition is achieved beyond the point of equality between the electron hyperfine and proton–proton interaction. Also, due to the approximations used in our derivations, there is a possibility that all model parameters are determined with some bias. Therefore, it would be useful in future to compare the fitted parameters of this model to some reference data. Currently, we note that our value of Rb determined from the fit of the RIDME data agrees well with other examples found in literature for proton spins28–31 and even for 19F spins with very close nuclear magnetic moment.32 If we for now take the determined blocking radius as non-biased, we can conclude that since Rb is concentration dependent, it can be possibly increased slightly above 1 nm by ten-fold reduction of the proton concentration. Such a reduction of proton concentration might make this technique sensitive to the protons at distances slightly above 3 nm. Also, in case of the complete absence of protons closer than certain distance R0 from the electron spin, this distance can serve as an alternative to the blocking radius. In such special cases the sensitivity range for the RIDME technique might reach even substantially beyond 3 nm, with the accurate upper limit to be determined in experiment.
The structure of the signals in the hyperfine spectroscopy methods ESEEM and ENDOR is often dominated by the nearest nuclei at distances of few angstroms and therefore the analysis of remote proton couplings is often hindered. However, it is known that for single weak couplings the hyperfine techniques can reach out up to 1.5 nm (Fig. 6).33 Comparing this distance to the above estimates, we conclude that on average the anticipated upper distance range accessible by the ih-RIDME technique should significantly exceed the one for the hyperfine spectroscopy methods.
Fig. 6. Schematic representation of distance ranges relevant for ESEEM/ENDOR and ih-RIDME techniques. Note that the range for ih-RIDME depends of bulk proton concentration, CH.
Next, we would like to discuss some ideas for possible applications of this method. Note a particular feature of the data fitting procedure that here not a single decay curve but a series of such curves for different mixing times is analysed. This adds quite some stability to the fitting procedure and leaves an opportunity to include in the fit e.g. a distribution of σ values. Thus, an interesting proposal would be to use the ih-RIDME methodology to study the local proton concentration distributions in heterogeneous systems. Such a technique would be for instance useful in structural biology or in research on dynamic nuclear polarisation, especially because it can exploit the nitroxide based spin centres, which are the most common spin labels and spin probes in such studies.34–40 Also in homogeneous proton distributions more than one type of protons can be present. As we have demonstrated in this work, different proton types can be distinguished by the ih-RIDME technique, and their intrinsic properties as well as their effects on the nearby electron spins can thus be studied.
Finally, we should compare the reported here approach to our previously published theory on describing intermolecular RIDME decay through a statistics of random spin flips.13 The spin flips statistics approach was quite efficient to correlate the RIDME decay features with the electron spin relaxation times, and with the pulse sequence time delays. However, making that approach quantitative is a quite difficult task even in the cases when the spin flip probabilities can be measured. First, the measurements of T1 time distributions have some ambiguity, for instance with respect to the ill-posed determination of T1 distribution from relaxation data. Also relaxation data can be somewhat dependent on the measurement technique.41 Second, the averaging of the decay parameters in the previous theory would be a non-linear operation with not so easy to determine error bars. While in principle the intermolecular hyperfine contributions in RIDME can also be regarded as stochastic flips, however, taking into account the listed difficulties, we were deliberately looking for another way of describing the ih-RIDME signals, which would be more convenient for a quantitative data analysis. The presented here theoretical approach based on a diffusion equation appears to have certain advantages in this respect. The approach does not rely on auxiliary measurements and their ill-posed fits. The number of the fit parameters is small, and therefore their determination is rather unambiguous, so that these parameters can be used in the interpretation of the sample properties. The fit parameters are also well interpretable with a physical meaning of the local distribution of electron–nuclear couplings and of the average rate for a diffusion over the width of the electron–nuclear couplings distribution. Overall, we hope that the presented diffusion equation approach can promptly find useful applications.
5. Conclusions
In this work we discovered a nearly exact scaling of ih-RIDME traces with proton concentration in homogeneous glassy samples. The derived diffusion equation based description of ih-RIDME decays allows for a good accuracy of global fitting of the series of RIDME traces, with only two fit parameters D/σ3 and σ/CH. These parameter combinations appear to be different for different matrices, and can be thus used for sample characterisation. The applicability of the developed diffusion equation approach to other longitudinal mixing blocks in pulse EPR sequences is anticipated. The overall accuracy of the presented ih-RIDME data description allows us to suggest that this method might be further developed as a structural characterisation tool to investigate the near vicinity of spin labels and spin probes. Such a technique would be for instance useful in structural biology or in research on dynamic nuclear polarisation.
Author contributions
M. Y. designed the research and provided supervision to S. K., S. K. performed EPR measurements, derived the key equations and performed the numeric data fitting, S. K. and M. Y. analysed RIDME data scaling, assumptions and accuracy of the model and accessible distance range, G. J. secured funding, S. K., M. Y. and G. J. analysed and discussed the results and wrote the manuscript.
Conflicts of interest
There are no conflicts to declare.
Supplementary Material
Acknowledgments
This work was supported by the Swiss National Science Foundation (grant 200020_188467).
Electronic supplementary information (ESI) available. See DOI: https://doi.org/10.1039/d2cp03039j
References
- Kulik L. Dzuba S. Grigoryev I. Tsvetkov Y. Electron dipole–dipole interaction in ESEEM of nitroxide biradicals. Chem. Phys. Lett. 2001;343:315–324. doi: 10.1016/S0009-2614(01)00721-7. [DOI] [Google Scholar]
- Milikisyants S. Scarpelli F. Finiguerra M. G. Ubbink M. Huber M. A pulsed EPR method to determine distances between paramagnetic centers with strong spectral anisotropy and radicals: the dead-time free RIDME sequence. J. Magn. Reson. 2009;201:48–56. doi: 10.1016/j.jmr.2009.08.008. [DOI] [PubMed] [Google Scholar]
- Razzaghi S. Qi M. Nalepa A. I. Godt A. Jeschke G. Savitsky A. Yulikov M. RIDME Spectroscopy with Gd(iii) Centers. J. Phys. Chem. Lett. 2014;5:3970–3975. doi: 10.1021/jz502129t. [DOI] [PubMed] [Google Scholar]
- Astashkin A. V., Mapping the structure of metalloproteins with RIDME, in Electron Paramagnetic Resonance Investigations of Biological Systems by Using Spin Labels, Spin Probes, and Intrinsic Metal Ions, Part A, of Methods in Enzymology, ed. P. Z. Qin and K. Warncke, Academic Press, 2015, vol. 563, pp. 251–284 [DOI] [PubMed] [Google Scholar]
- Abdullin D. Duthie F. Meyer A. Müller E. S. Hagelueken G. Schiemann O. Comparison of PELDOR and RIDME for distance measurements between nitroxides and low-spin Fe(iii) ions. J. Phys. Chem. B. 2015;119:13539–13542. doi: 10.1021/acs.jpcb.5b02118. [DOI] [PubMed] [Google Scholar]
- Azarkh M. Bieber A. Qi M. Fischer J. W. Yulikov M. Godt A. Drescher M. Gd(iii)–Gd(iii) relaxation-induced dipolar modulation enhancement for in-cell electron paramagnetic resonance distance determination. J. Phys. Chem. Lett. 2019;10:1477–1481. doi: 10.1021/acs.jpclett.9b00340. [DOI] [PMC free article] [PubMed] [Google Scholar]
- Yang Y. Yang F. Gong Y. J. Bahrenberg T. Feintuch A. Su X. C. Goldfarb D. High sensitivity in-cell EPR distance measurements on proteins using an optimized Gd(iii) spin label. J. Phys. Chem. Lett. 2018;9:6119–6123. doi: 10.1021/acs.jpclett.8b02663. [DOI] [PubMed] [Google Scholar]
- Akhmetzyanov D. Ching H. Y. Denysenkov V. Demay-Drouhard P. Bertrand H. C. Tabares L. C. Policar C. Prisner T. F. Un S. RIDME spectroscopy on high-spin Mn2+ centers. Phys. Chem. Chem. Phys. 2016;18:30857–30866. doi: 10.1039/C6CP05239H. [DOI] [PubMed] [Google Scholar]
- Ackermann K. Wort J. L. Bode B. E. Nanomolar pulse dipolar EPR spectroscopy in proteins: CuII–CuII and nitroxide–nitroxide cases. J. Phys. Chem. B. 2021;125:5358–5364. doi: 10.1021/acs.jpcb.1c03666. [DOI] [PMC free article] [PubMed] [Google Scholar]
- Keller K. Ritsch I. Hintz H. Hülsmann M. Qi M. Breitgoff F. D. Klose D. Polyhach Y. Yulikov M. Godt A. Jeschke G. Accessing distributions of exchange and dipolar couplings in stiff molecular rulers with Cu(ii) centres. Phys. Chem. Chem. Phys. 2020;22:21707–21730. doi: 10.1039/D0CP03105D. [DOI] [PubMed] [Google Scholar]
- Milov A. Maryasov A. Tsvetkov Y. Applied magnetic resonance pulsed electron double resonance (PELDOR) and its applications in free-radicals research. Appl. Magn. Reson. 1998;15:107–143. doi: 10.1007/BF03161886. [DOI] [Google Scholar]
- Pannier M. Veit S. Godt A. Jeschke G. Spiess H. Dead-time free measurement of dipole–dipole interactions between electron spins. J. Magn. Reson. 2011;213:316–325. doi: 10.1016/j.jmr.2011.08.035. [DOI] [PubMed] [Google Scholar]
- Keller K. Qi M. Gmeiner C. Ritsch I. Godt A. Jeschke G. Savitsky A. Yulikov M. Intermolecular background decay in RIDME experiments. Phys. Chem. Chem. Phys. 2019;21:8228–8245. doi: 10.1039/C8CP07815G. [DOI] [PubMed] [Google Scholar]
- Portis A. M. Spectral diffusion in magnetic resonance. Phys. Rev. 1956;104:584–588. doi: 10.1103/PhysRev.104.584. [DOI] [Google Scholar]
- Klauder J. R. Anderson P. W. Spectral diffusion decay in spin resonance experiments. Phys. Rev. 1962;125:912–932. doi: 10.1103/PhysRev.125.912. [DOI] [Google Scholar]
- Khutsishvili G. R. Diffusion Spin. Phys.-Usp. 1966;8:743–769. doi: 10.1070/PU1966v008n05ABEH003035. [DOI] [Google Scholar]
- Suter D. Ernst R. R. Spin diffusion in resolved solid-state NMR spectra. Phys. Rev. B: Condens. Matter Mater. Phys. 1985;32:5608–5627. doi: 10.1103/PhysRevB.32.5608. [DOI] [PubMed] [Google Scholar]
- Canarie E. R. Jahn S. M. Stoll S. Quantitative structure-based prediction of electron spin decoherence in organic radicals. J. Phys. Chem. Lett. 2020;11:3396–3400. doi: 10.1021/acs.jpclett.0c00768. [DOI] [PMC free article] [PubMed] [Google Scholar]
- Abramowitz M. and Stegun I. A., Handbook of Mathematical Functions with Formulas, Graphs, and Mathematical Tables, Dover, New York, ninth dover printing, tenth gpo printing edition, 1964 [Google Scholar]
- Tschaggelar R. Kasumaj B. Santangelo M. G. Forrer J. Leger P. Dube H. Diederich F. Harmer J. Schuhmann R. García-Rubio I. Jeschke G. Cryogenic 35 GHz pulse ENDOR probehead accommodating large sample sizes: Performance and applications. J. Magn. Reson. 2009;200:81–87. doi: 10.1016/j.jmr.2009.06.007. [DOI] [PubMed] [Google Scholar]
- Keller K. Doll A. Qi M. Godt A. Jeschke G. Yulikov M. Averaging of nuclear modulation artefacts in RIDME experiments. J. Magn. Reson. 2016;272:108–113. doi: 10.1016/j.jmr.2016.09.016. [DOI] [PubMed] [Google Scholar]
- Brown I., Electron spin echo studies of relaxation processes in molecular solids, Time domain electron spin resonance, 1979, pp. 226–229 [Google Scholar]
- Chandler D., Introduction to Modern Statistical Mechanics, Oxford University Press, 1987 [Google Scholar]
- Khutsishvili G. R. Spin diffusion and magnetic relaxation of nuclei. J. Exp. Theor. Phys. 1962;15:1311–1318. [Google Scholar]
- Berliner L. J., Eaton S. S. and Eaton G. R., Distance measurements in biological systems by EPR, Springer Science & Business Media, 2006, vol. 19 [Google Scholar]
- Abdullin D. Suchatzki M. Schiemann O. Six-pulse RIDME sequence to avoid background artifacts. Appl. Magn. Reson. 2022;53:539–554. doi: 10.1007/s00723-021-01326-1. [DOI] [Google Scholar]
- Yonekuta Y. Oyaizu K. Nishide H. Structural implication of oxoammonium cations for reversible organic one-electron redox reaction to nitroxide radicals. Chem. Lett. 2007;36:866–867. doi: 10.1246/cl.2007.866. [DOI] [Google Scholar]
- Graham M. J. Krzyaniak M. D. Wasielewski M. R. Freedman D. E. Probing nuclear spin effects on electronic spin coherence via EPR measurements of vanadium(iv) complexes. Inorg. Chem. 2017;56:8106–8113. doi: 10.1021/acs.inorgchem.7b00794. [DOI] [PubMed] [Google Scholar]
- Zecevic A. Eaton G. R. Eaton S. S. Lindgren M. Dephasing of electron spin echoes for nitroxyl radicals in glassy solvents by non-methyl and methyl protons. Mol. Phys. 1998;95:1255–1263. doi: 10.1080/00268979809483256. [DOI] [Google Scholar]
- Ramakrishna J. Robinson F. N. H. A transient effect in dynamic nuclear polarization. Proc. Phys. Soc. 1966;87:945–951. doi: 10.1088/0370-1328/87/4/311. [DOI] [Google Scholar]
- Tan K. O. Mardini M. Yang C. Ardenkjær-Larsen J. H. Griffin R. G. Three-spin solid effect and the spin diffusion barrier in amorphous solids. Sci. Adv. 2019;5:eaax2743. doi: 10.1126/sciadv.aax2743. [DOI] [PMC free article] [PubMed] [Google Scholar]
- Hurrell J. Davies E. Nuclear induced electron-spin-echo decay in solids. Solid State Commun. 1971;9:461–463. doi: 10.1016/0038-1098(71)90322-X. [DOI] [Google Scholar]
- Meyer A. Dechert S. Dey S. Höbartner C. Bennati M. Measurement of Angstrom to Nanometer Molecular Distances with 19F Nuclear Spins by EPR/ENDOR Spectroscopy. Angew. Chem., Int. Ed. 2020;59:373–379. doi: 10.1002/anie.201908584. [DOI] [PMC free article] [PubMed] [Google Scholar]
- Oh K. J. Altenbach C. Collier R. J. Hubbell W. L. Site-directed spin labeling of proteins. Methods Mol. Biol. 2000;145:147–169. doi: 10.1385/1-59259-052-7:147. [DOI] [PubMed] [Google Scholar]
- Klare J. P. Site-directed spin labeling EPR spectroscopy in protein research. Biol. Chem. 2013;394:1281–1300. doi: 10.1515/hsz-2013-0155. [DOI] [PubMed] [Google Scholar]
- Jeschke G. DEER distance measurements on proteins. Annu. Rev. Phys. Chem. 2012;63:419–446. doi: 10.1146/annurev-physchem-032511-143716. [DOI] [PubMed] [Google Scholar]
- Song C. Hu K.-N. Joo C.-G. Swager T. M. Griffin R. G. TOTAPOL: a biradical polarizing agent for dynamic nuclear polarization experiments in aqueous media. J. Am. Chem. Soc. 2006;128:11385–11390. doi: 10.1021/ja061284b. [DOI] [PubMed] [Google Scholar]
- Matsuki Y. Maly T. Ouari O. Karoui H. Le Moigne F. Rizzato E. Lyubenova S. Herzfeld J. Prisner T. Tordo P. Griffin R. G. Dynamic nuclear polarization with a rigid biradical. Angew. Chem., Int. Ed. 2009;48:4996–5000. doi: 10.1002/anie.200805940. [DOI] [PMC free article] [PubMed] [Google Scholar]
- Zagdoun A. Casano G. Ouari O. Lapadula G. Rossini A. J. Lelli M. Baffert M. Gajan D. Veyre L. Maas W. E. Rosay M. Weber R. T. Thieuleux C. Coperet C. Lesage A. Tordo P. Emsley L. A slowly relaxing rigid biradical for efficient dynamic nuclear polarization surface-enhanced NMR spectroscopy: Expeditious characterization of functional group manipulation in hybrid materials. J. Am. Chem. Soc. 2012;134:2284–2291. doi: 10.1021/ja210177v. [DOI] [PubMed] [Google Scholar]
- Zagdoun A. Casano G. Ouari O. Schwarzwälder M. Rossini A. J. Aussenac F. Yulikov M. Jeschke G. Copéret C. Lesage A. Tordo P. Emsley L. Large molecular weight nitroxide biradicals providing efficient dynamic nuclear polarization at temperatures up to 200 K. J. Am. Chem. Soc. 2013;135:12790–12797. doi: 10.1021/ja405813t. [DOI] [PubMed] [Google Scholar]
- Eaton S. S. and Eaton G. R., Relaxation Mechanisms, in EPR Spectroscopy: Fundamentals and Methods, ed. S. Stoll and D. Goldfarb, John Wiley & Sons, Ltd, 2018, ch. 9, pp. 175–192 [Google Scholar]
Associated Data
This section collects any data citations, data availability statements, or supplementary materials included in this article.


