Abstract
This study aims to develop an experimentally validated computational fluid dynamics (CFD) model to estimate hemodynamic characteristics in cerebral aneurysms (CAs) using non-Newtonian blood analogues. Blood viscosities varying with shear rates were measured under four temperatures first, which serves as the reference for the generation of blood analogues. Using the blood analogue, particle image velocimetry (PIV) measurements were conducted to quantify flow characteristics in a CA model. Then, using the identical blood properties in the experiment, CFD simulations were executed to quantify the flow patterns, which were used to compare with the PIV counterpart. Additionally, hemodynamic characteristics in the simplified Newtonian and non-Newtonian models were quantified and compared using the experimentally validated CFD model. Results showed the proposed non-Newtonian viscosity model can predict blood shear-thinning properties accurately under varying temperatures and shear rates. Another developed viscosity model based on the blood analogue can well represent blood rheological properties. The comparisons in flow characteristics show good agreements between PIV and CFD, demonstrating the developed CFD model is qualified to investigate hemodynamic factors within CAs. Furthermore, results show the differences of absolute values were insignificant between Newtonian and non-Newtonian fluids in the distributions of wall shear stress (WSS) and oscillatory shear index (OSI) on arterial walls. However, not only does the simplified Newtonian model underestimate WSS and OSI in most regions of the aneurysmal sac, but it also makes mistakes in identifying the high OSI regions on the sac surface, which may mislead the hemodynamic assessment on the pathophysiology of CAs.
I. INTRODUCTION
Accurate identification of blood flow regimes is a critical step in characterizing the hemodynamic patterns in cerebral aneurysms (CAs), which has been widely recognized with prevalent hypotheses that hemodynamic factors, for example, wall shear stress (WSS), gradient oscillatory number/oscillatory shear index (OSI), and vortices (i.e., size, location, and numbers), have a close relationship with the pathobiology (i.e., initiation, growth, and rupture) of CAs.1 Thus, to help clinicians offer effective treatments more responsibly for intracranial aneurysms and improve patients' experience, it is necessary to employ accurate blood rheological information to evaluate hemodynamic factors in CAs. Human blood is a complex fluid, which contains vital substances for cell tissues and organs of the body.2 Specifically, it consists of a suspension of cellular elements in an aqueous matrix and plasma, of which 98% are erythrocytes, and the remainders are leukocytes, platelets, proteins, and other solutes.3 Blood is identified as a non-Newtonian fluid presenting viscoelastic characteristics and shear-thinning rheological properties.4,5 The blood viscosity in the human body changes with hemodynamics conditions due to several factors (i.e., hematocrit, plasma viscosity, the ability of red blood cells (RBCs) to deform under flows, and RBC aggregation–disaggregation properties),5–7 and it ranges from to varying with the corresponding shear rate from ∼400 to ∼0.01 .8
Multiple previous research efforts were summarized by review publications in investigating hemodynamic factors on the pathophysiology of the cerebral aneurysms, including varying risks associated with aneurysm sac size and locations, aneurysmal morphologies, pre- and post-treatment states, and arterial blood flow conditions using experimental and numerical approaches.1,9–18 These studies can be mainly categorized into two types according to blood viscosity properties, that is, simplified Newtonian and realistic non-Newtonian. With the advantages of high image resolutions and in a time-resolved and phase-averaged manner, many studies employed particle image velocimetry (PIV) approaches and magnetic resonance velocimetry (MRV) to quantify the blood flow field in the cerebral arteries and intracranial aneurysms using in vitro models.19–28 Some of the research adopted the flow field information that was quantified in an experimental manner to validate computational fluid dynamics (CFD) method, which can overcome the insufficient ability of in vitro/in vivo studies to capture the blood flow patterns near arterial wall due to unavoidable interpolation discrepancies and relatively low operational flexibilities.19,29–42 However, all above-mentioned in vitro experiments and/or in vitro validated CFD studies simplified the blood as a Newtonian fluid, and assumed the blood viscosity as a constant value, which varies in different research groups with the viscosity in the range of − . Therefore, the differences in hemodynamic characteristics in CAs between simplified Newtonian fluids and realistic non-Newtonian bloods still need to be identified using experimentally validated numerical models.
Several representative in vitro studies were employed to investigate the non-Newtonian flow behaviors of blood in vessels but not in CAs.43–50 For instance, Gijsen et al.43 studied the influence of the non-Newtonian properties of blood on the flow in a carotid bifurcation model under steady flow, and observed apparent differences in velocity distributions in the arteries between Newtonian reference and non-Newtonian blood analog. Hong et al.47 investigated the flow patterns of non-Newtonian blood-mimicking fluids in an in vitro stenosed microchannels under the pulsatile flow condition, discovering that the velocity profile of the non-Newtonian fluid was blunter than that of the Newtonian fluid, while streamlines were skewed more to the wall of the channel under simplified Newtonian fluid. Cheng et al.49 compared flow behaviors between a non-Newtonian blood analog [e.g., 0.04% xanthan gum (XG)] and a control Newtonian fluid (e.g., 45% glycerol) in a simplified model of the Fontan circulation in vitro and found that assuming blood to be a Newtonian fluid introduces considerable errors into simulations of the Fontan circulation. More recently, Samaee et al.50 investigated the hemodynamic patterns of Newtonian and non-Newtonian blood flows in a deformable carotid bifurcation model in vitro, and revealed noticeable differences of hemodynamic information in two types of flow regimes in silico. Furthermore, using the blood rheological models (e.g., Carreau model, Carreau–Yasuda model, generalized power-law model, power-law model, Powel–Eyring model, cross-model, Walburn–Schneck model, Herschel–Bulkley model, Casson model, KL Model, and Quemada model),51 a large number of CFD investigations were contributed to identify the different hemodynamic characteristics between simplified Newtonian and realistic non-Newtonian bloods or its analogues in spite of the lack of experimental validations, which have been summarized by two recent review publications.51,52 Some representative studies are shown in Table I,50,53–62 with specific modeling methods and viscosity range.
TABLE I.
Several representative numerical studies using non-Newtonian blood viscosity models.
| Contributor(s) | Simulation regimes | Non-Newtonian viscosity model | Viscosity range [ |
|---|---|---|---|
| Valencia et al.53 | Incompressible laminar flow | Herschel–Bulkley model | |
| Rayz et al.54 | Incompressible laminar flow | Herschel–Bulkley model | |
| Bernsdorf and Wang55 | Lattice Boltzmann method with single relaxation time Bhatnagar–Gross–Krook (BGK) collision operator | Carreau–Yasuda model | |
| Xiang et al.56 | Not declared the method/model to solve incompressible Navier–Stokes equations | Casson and Herschel–Bulkley model | |
| Sugiyama et al.57 | Incompressible laminar flow | Herschel–Bulkley model | |
| Suzuki et al.58 | Incompressible laminar flow | Modified Casson model | |
| Lauric et al.60 | Incompressible laminar flow | Carreau model | [3, 26] |
| Ba et al.59 | Incompressible laminar flow | Carreau–Yasuda model | |
| Saqr61 | Not declared the method/model to solve incompressible Navier–Stokes equations | Power-law model and quasi-mechanistic model | |
| Tripathi et al.62 | Incompressible laminar flow | Carreau model | |
| Samaee et al.50 | Not declared the method/model to solve incompressible Navier–Stokes equations | Carreau model |
However, to the best of our knowledge, there are no existing CFD investigations based on benchmarked in vivo and/or in vitro (i.e., PIV) verification and validation in patient-specific CAs under pulsatile blood flow conditions, influencing the acceptance of such simulations results in the clinical community, as the employed modeling assumptions can vary with corresponded solution strategies in different research groups. There is one study,63 which adopted 1D laser Doppler anemometer (LDA) and CFD approaches to investigate non-Newtonian blood flow behaviors in a CA model, however without detailed information about adopted blood analogues and lack of explanations on significant differences in viscosities between blood and its analogue as well as velocity profiles between LDA and CFD. Nevertheless, the evidence showed that physiologic pulsatile blood flow is turbulent even under a relatively small mean Reynolds number (i.e., ∼300)64 due to its sensitivity to initial conditions, global hydrodynamic instability, and kinetic energy cascade in non-Kolmogorov type.65 Similar transitional and turbulent regimes were detected in CAs by other research groups in vitro and in silico.24,66,67
To address the above-mentioned concerns, the objective of this study is to develop an experimentally validated CFD model with realistic non-Newtonian blood analogues using PIV techniques. Specifically, blood viscosities varying with shear rates were measured under four designated temperatures (T), which were not only adopted to investigate blood viscosity properties by varying shear rates and temperatures but also used as the references for the generation of synthetic non-Newtonian blood analogues [i.e., the solution of xanthan gums (XG) and fluorescent polyethylene particles (FPP)]. Then, synthetic blood analogues were used to conduct PIV measurements to quantify the flow field characteristics in an in vitro internal cerebral artery sidewall aneurysm (ICASA) model. Second, using the same viscosity properties and flow boundary conditions in PIV tests, CFD simulations were executed to obtain the flow patterns in the ICASA model. The comparison of results between CFD and PIV was evaluated to validate the numerical model. In addition, the hemodynamic characteristics under the conditions of simplified Newtonian and realistic non-Newtonian bloods were quantified and compared using the experimentally validated CFD model. The present work provides a pathway for other researchers to build a validated numerical CA model based on PIV measurements using non-Newtonian blood analogues. In addition, the developed in vitro validated CFD model can be employed to investigate the hemodynamic factors on the pathophysiology of CAs using statistical analysis techniques with a large number of patient-specific aneurysmal cases.
II. EXPERIMENTAL SETUPS
A. Materials
1. Aneurysm replica
An ICASA model was reconstructed using three-dimensional rotational angiography (3DRA) images of a patient's cerebral arteries (35-yr-old, female) by Artis Zee systems (Siemens Medical Solutions USA, Inc., PA), via the collaboration with Miami Valley Hospital of Premier Health© in Dayton (OH). In the reconstructed model, the blood enters the internal carotid artery (ICA) and flows out from the bifurcated distal arteries, that is, middle carotid artery (MCA) and anterior carotid artery (ACA), which has been employed in our previous computational investigations.68–72 The physical ICASA model (see Fig. 1) for PIV measurements was printed with WaterShed XC 11122 materials by a prototype machine in Proto Labs, Inc. (MN). In the physical model, a clear coat was applied on interior surfaces, and the exterior surfaces were finished with grit blasting. The tolerance in the X/Y direction is ±0.05 mm and in the Z direction is ±0.125 mm, where X/Y are in-plane coordinates and Z is the out-plane coordinate associated with the printing process. It should be mentioned that the size of the physical model was scaled up by a factor of 3 to allow for high-quality PIV measurements.
FIG. 1.
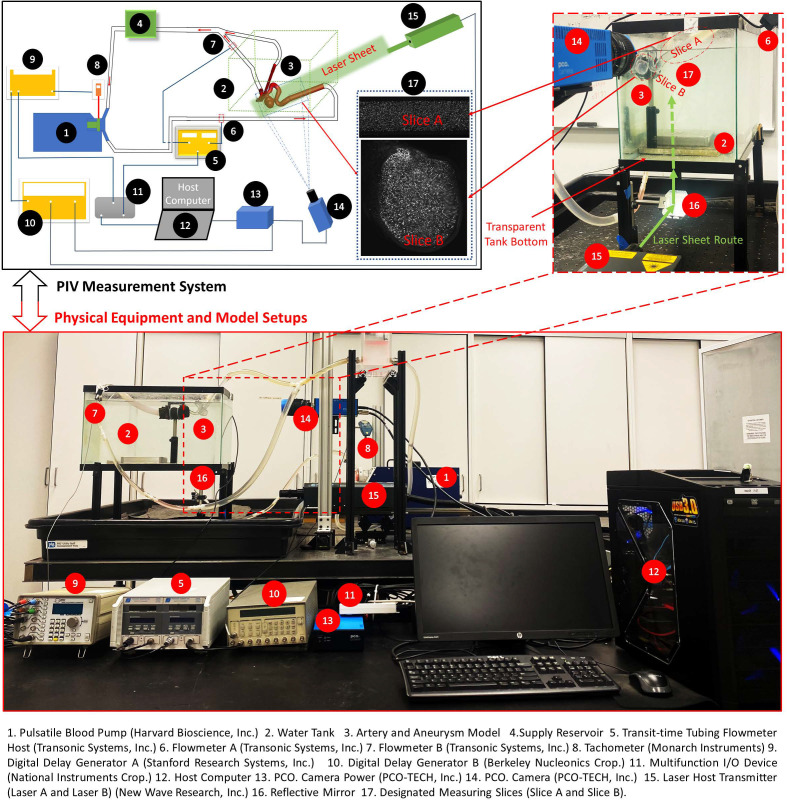
Setups of PIV measurement system.
2. Non-Newtonian blood sample and analogues
Porcine blood samples were collected from a local slaughterhouse in Cincinnati, OH, about 1 h before the viscosity measurements. The viscosities varying with shear rates were measured using an IKA ROTAVISC lo-vi viscometer (IKA Works, Inc.) under four designated temperatures (T) (i.e., 295, 300, 305, and 310 ) first, which were employed to investigate the temperature influences on blood viscosities. The viscosity profiles at 310 were compared to profiles of human bloods measured by previous investigations,4,5,8,58,73 to ensure the collected blood samples qualified as the references for the generation of synthetic blood analogues. Two synthetic blood analogues, that is, consisting of xanthan gum (XG), and fluorescent polymer particles (FPP) (10–45 μm) in de-ionized water with different designated ratios, were generated to mimic realistic human bloods with shear-thinning features. Specifically, one synthetic analogue solution with 225 ppm XG solely was generated to mimic the non-Newtonian blood viscosity profiles under the body temperature in healthy humans (i.e., 310 ), which can be used as a replicate of real blood as well as a reference for other research groups. Another synthetic analogue with 185 ppm XG and 446 ppm FPP can be employed in PIV tests at the room temperature of 298 , which was adopted in the PIV experiments of this study. Furthermore, the agreements in viscosity profiles between blood analogue (e.g., 185 ppm XG and 446 ppm FPP) at 298 and blood sample at 310 were compared to ensure that the rheological properties of the created blood analogue can match the real blood well under PIV testing temperature (e.g., 298 ). More details about generated blood analogues were discussed in Sec. IV A.
B. In vitro cerebral circulation
Previous studies showed the mean volumetric blood flow rate in the internal carotid artery (ICA) is about 395 ± 158 ml/min, with assumed 95% confidence level.74 In accordance with flow conditions in realistic brain arteries (i.e., identical Reynolds number), an identical Reynolds number was set in the PIV tests with ∼3 times of flow rates in vivo (i.e., ∼1201.52 ml/min in vitro), under same shear-thinning viscosity properties. As shown in Fig. 1, a cerebral phantom circulation network was established using a Harvard Apparatus pulsatile blood pump (Harvard Bioscience, Inc., MA), a laboratory-made reservoir, and the physical ICASA model. All compliant components were assembled by plastic tubing. The heart rate was set as beats per minute. With the multifunction I/O device and user-defined LabVIEW code (National Instruments Corp., TX), the transient pulsatile flow rates at the ICA (i.e., flow inlet) and one of the outlets (i.e., MCA) were measured simultaneously by the real-time flowmeter system (TS410 tubing flow module, Transonic Systems, Inc., NY) with corresponding assembled flowmeter sensors, for example, ME 10 PXN and ME 6 PXN, respectively. The uncertainty of the flow rate measurement is estimated as 3% of the reading value.
C. PIV technique
A digital PIV system (see Fig. 1) was adopted to accomplish the detailed pulsatile flow field measurements with seeded FPPs in the ICASA model. The test rig has the capability to make “phase-locked” PIV measurements, which is important to capture the temporal feature of the pulsatile intravascular flow. Specifically, a laser tachometer (Monarch Instruments, NH) was adopted to detect the position of the pulsatile pump piston, which is directly related to the timing of a cardiac cycle. The pulse signal generated in the tachometer was used to trigger the entire PIV system. By adding a time delay into the pulse signal through the digital delay generator A, the flow features were “frozen” at the designated instant for each cycle by taking two images (i.e., image A and image B) between a designated short time delay. Thus, a phase-averaged flow measurement can be obtained at the designated time instant within a cardiac cycle to quantify the temporal flow patterns. It is worth mentioning that the emitted laser sheet was shaped to a thickness of 2 mm to mitigate error associated with out-of-plane movement. In addition, a water bath was used to enhance the transparent visibility of the model and provide the temperature stability (i.e., ∼298 K) for the blood analogue simultaneously in the physical model.
D. Experimental measurements
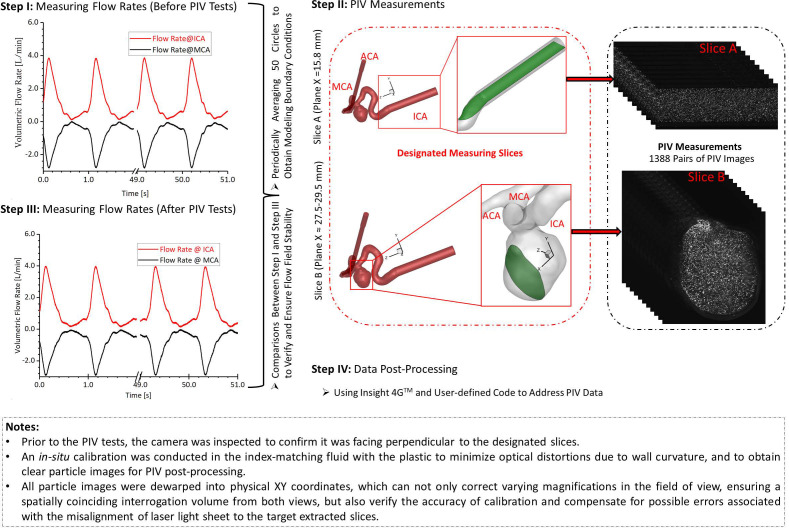
The transient pulsatile flow rates were measured and compared directly before and after the PIV tests to verify and ensure the stability of the flow system. Two representative in-plane slices, that is, slice A and slice B (see Figs. 1 and 2), were designated for the PIV measurements, that is, one sliced plane located upstream of the aneurysm sac in the ICA, and another one across the aneurysm sac and close to the center. For phase-locked PIV measurements in the ICA (see Fig. 2), adjusting the time delay to trigger the PIV system as mentioned above, three designated time instants (e.g., t = 0.0606, 0.1652, and 0.2605 s) were selected to represent the critical flow features at windward side of the waveform, the peak, and the leeward side of the cardiac waveform. The flowrates at the selected time instants are extremely sensitive since a minor change of time can lead to a significant difference in flow rates as well as the flow patterns in the sac model. A total of 1388 pairs of images (i.e., image A and image B) were recorded to calculate velocity vectors and blood flow rate for each time instant, respectively. In addition, the same number of images was collected for measuring the flow patterns in the aneurysm sac (see Fig. 2) at three preferred time instants (i.e., t = 0.0780, 0.1085, and 0.1540 s), separately. The direct correlator scheme in Insight 4GTM code (TSI Inc., MN) was employed for the post-processing of PIV images. Velocity vectors were calculated within multiple window-screenings from 32 × 32 pixel with a 50% overlap to 16 × 16 pixel with a 50% overlap adaptively. The final spatial resolution is ∼5 vector/mm. Subsequently, velocity vectors were phase-averaged over the collected 1388 cycles to produce velocity vector distributions for each acquired phase of the cardiac cycle using an in-house C++ code. The uncertainty in the velocity measurements is estimated to be less than 2% of the magnitude. To quantify fluctuations at each phase, the normalized velocity magnitude at each point was calculated from which the phase-averaged velocity and relative errors were calculated (see Sec. IV B).
FIG. 2.
Procedures of PIV measurements in the ICASA model.
E. Similarity measurements of the magnitude of velocities (MV) using the Pearson correlation
The differences in flow patterns between PIV measurements and CFD simulations were compared using the Pearson correlation coefficient.75,76 Specifically, for similarity analysis between experimental data and numerical simulations in velocity profiles, = 200 equally spaced monitoring points were selected at the particular lines in the slice A (i.e., plane x = 15.80 mm) across the ICA (see Fig. 2) for the correlation coefficient calculation. The correlation coefficient can be calculated by,75,76 that is,
| (1) |
where and are the MV at monitoring point of line in CFD and PIV, respectively. and represent the mean velocities of and of line in CFD and PIV, separately. It is worth mentioning that high similarity is indicated if R is close to 1.0.
III. NUMERICAL METHODS
A. Geometry and mesh
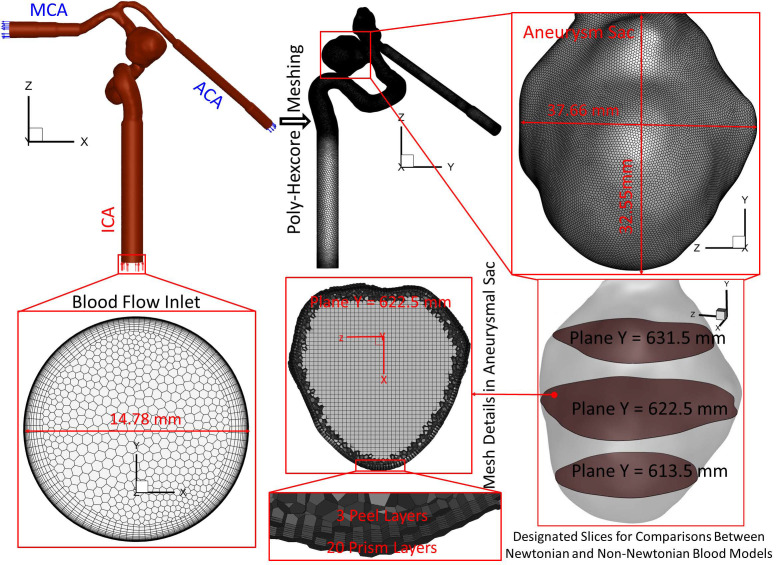
Figure 3 manifests the detailed dimensions and meshes of the ICASA model. The mesh sensitivity has been analyzed in our previous publications,70–72 and the final mesh has 3 012 970 cell elements with 20 prism layers, 3 peel layers, and a size growth rate of 1.05. To capture the blood flow features close to arterial walls, 20 near-wall prism layers in the final mesh were generated and refined to guarantee the thickness of the first prism layer satisfying y+ < 1 using the flat plate boundary layer theory, where y+ is the dimensionless wall distance.77–79
FIG. 3.
Schematic of the computational domain with hybrid mesh details in the ICASA model.
B. Governing equations
The mathematical states of physical principles in the unsteady and periodic pulsatile incompressible blood flow regime involve the continuity and momentum equations in the conservation form, that is,
| (2) |
| (3) |
where is the blood velocity vector, is the pressure, is gravity vector, and denotes blood density. In this study, (i.e., ∼940 kg/m3) is adopted for CFD simulations, in accordance with the density of the synthetic blood analogue in PIV measurements. is blood viscosity determined by a non-Newtonian power-law viscosity model, which was proposed based on the measurements in the blood analogue. The measured data present the relationship between the viscosity and shear rate under the room temperature (i.e., 298 ) matching the temperature of PIV experiments. Specifically, the model is expressed by, that is,
| (4) |
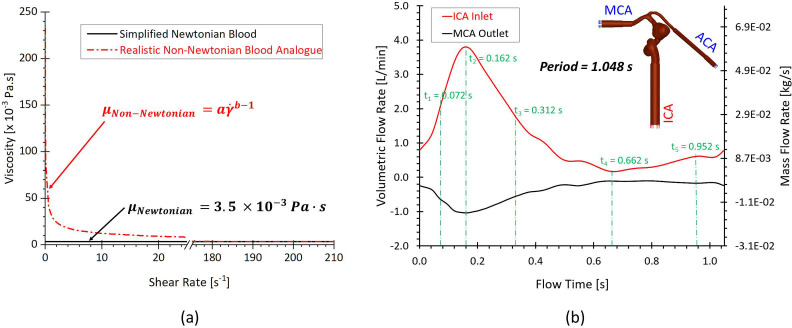
In Eqs. 4(a)–4(c), is the consistency index, and is the power-law index. Specifically, and are determined by the tests of non-Newtonian blood analogues with 3.231 and 0.572 [see Fig. 4(a)], respectively. More detailed determination process for the non-Newtonian blood viscosity model was discussed in Sec. IV A. To quantitatively study the different performance of hemodynamic characteristics between the realistic non-Newtonian blood analogue and simplified Newtonian blood, μ = 3.5 was employed in the Newtonian blood modeling. In addition, and are minimum and maximum shear rates, respectively. In the non-Newtonian blood flow modeling, and are registered as and (Ref. 8) in accordance with the previous measurement.8 The corresponding and can be determined by Eq. 4(b). The shear rate in the flow is computed by, for example,
| (5) |
FIG. 4.
CFD simulation setups: (a) adopted simplified Newtonian and realistic non-Newtonian blood viscosity models. (b) Blood pulsatile-wave boundary conditions in the ICA and MAC.
Within the transient pulsatile blood flow, the flow regime in the cerebral artery system is laminar-to-turbulence. Therefore, the shear stress transport (SST) turbulence model78 was adapted for this study, predicting “laminar-to-turbulent” transition onset. In addition, to capture hemodynamic features more accurately in the near-wall regions with possible low Reynolds numbers, the low Reynolds correction was employed in this study. It is a combination of SST additionally coupled with the correlation coefficient and turbulent Reynolds number .80 The equations for turbulent viscosity, correlation coefficient, and turbulent Reynolds number are,80 for example,
| (6) |
| (7) |
| (8) |
In Eqs. (6)–(8), is the turbulent viscosity, is the turbulence kinetic energy, is the specific dissipation rate, is the correlation coefficient, and is the turbulent Reynolds number.
C. Boundary and initial conditions
To validate simulation results with PIV measurements and quantify the differences in hemodynamic characteristics between simplified Newtonian and realistic non-Newtonian bloods simulations, one transient pulsatile flow waveform [see red colored curve in Fig. 4(b)] for ICA inlet was employed in this study. As shown in Fig. 2, the waveform is based on the pulsatile blood flow rate within 50 cardiac cycles measured in the experimental study using a Harvard apparatus pulsatile blood pump and the real-time flowmeter system. Similarly, another flow rate waveform [i.e., black colored curve in Fig. 4(b)] obtained from experimental measurements was adopted as the MCA boundary condition. Pressure outlet was assumed as the ACA outlet flow condition with the assumed gauge pressure of zero. Additionally, the arterial walls are set as stationary, non-slip, and no-penetration. The backflow direction at the MCA and ACA was determined based on the known flow direction in the cell layer adjacent to the flow outlets.
D. Numerical settings
CFD modeling tasks were executed using Ansys Fluent 2022 R1 (Ansys Inc., Canonsburg, PA) on a local HP Z840 workstation (Intel® Xeon® Processor E5–2687W v4 with dual processors, 24 cores, 48 threads, and 128 GB RAM). With the computational time step-size , it required ∼72 and ∼54 h to finish the simulation for three physical pulsatile periods under the realistic non-Newtonian blood regime and simplified Newtonian blood regime, respectively. It is worth mentioning that three pulsatile cycles were simulated to ensure the stability of numerical modeling. The simulation results based on the third pulsatile period (i.e., period = 1.048 s) were employed to compare with PIV measurements and the differences in hemodynamic characteristics between non-Newtonian and Newtonian modeling. The semi-implicit method for pressure linked equations (SIMPLE) algorithm was employed for the pressure–velocity coupling, and the least-squares cell-based scheme was applied to calculate the cell gradient. The second-order scheme was used for pressure discretization. In addition, the second-order upwind scheme was employed for the discretization of momentum, turbulent kinetic energy, and specific dissipation rate. Convergence is defined for continuity, momentum, and supplementary equations when residuals are lower than .
IV. RESULTS AND DISCUSSION
A. Non-Newtonian blood analogues
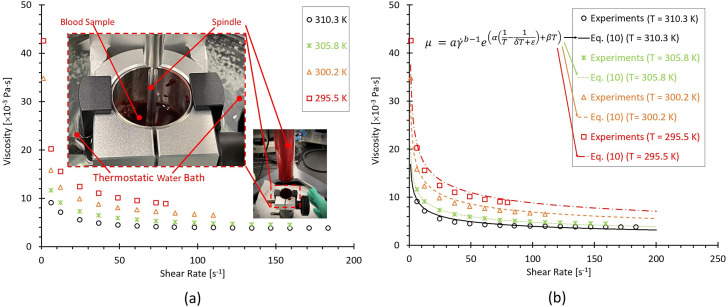
To study the temperature influences on blood viscosities and provide the references of synthetic non-Newtonian blood analogues, the porcine whole blood samples were analyzed in this study. It has been found that porcine bloods share many common characteristics with human blood, that is, RBCs,81–83 and similar shear-thinning properties.84,85 However, some other research groups claimed that some differences between human and porcine bloods were still observed in shear-thinning properties, especially for the conditions under lower shear rates.85 The discrepancies among various research groups may be due to the lack of statistical analysis with enough individual samples, and more comprehensive investigations are still needed to address above-mentioned ambiguous conclusions. Figure 5(a) manifests that the porcine blood viscosities present the shear-thinning properties that viscosity decreases as the shear rate increases under all four designated temperatures (e.g., 295, 300, 305, and 310 ). Also, it can be noticed that the blood viscosity presents non-isothermal features, showing that as the ambient temperature grows, the viscosity decreases gradually under the same shear rate. Thus, the temperature dependence on the viscosity can be combined along with the shear rate dependence. In this study, the whole blood viscosity model was assumed as consisting of two variables [i.e., shear rate-dependent term and temperature index ] and is expressed as, for example,
| (9) |
FIG. 5.
Blood viscosity profiles varying with shear rates and four designated temperatures (i.e., 295.5, 300.2, 305.8, and 310.3 ): (a) experimental measured blood viscosity profiles. (b) Comparisons between the experimental data and the proposed non-Newtonian blood viscosity model [i.e., Eq. (10)].
In Eq. (9), is a temperature index based on the Arrhenius law.86–89 Integrating the viscosity data obtained from the experimental measurements shown in Fig. 5(a), the blood viscosity depends on shear rate and temperature can be expressed by, that is,
| (10) |
The detailed derivation process for Eq. (10) can be found in the supplementary material. In Eq. (10), is the consistency index, which is Pa sb, is the power-law index registered as 0.315, and is blood temperature in . In addition, , , , and are temperature index constants assigned with 4945.4 K, −0.083 , 1.53, and −162.22 , respectively.
It can be observed that the proposed Eq. (10) can match the experimental measurements well under all investigated four temperatures [see Fig. 5(b)]. More specifically, the correlation coefficients R between Eq. (10) and experiments are 0.99, 0.99, 1.00, and 0.98 at = 310. 3, 305.8, 300.2, and 295.5 , respectively, indicating that Eq. (10) has good performance on capturing blood rheological shear-thinning features under the ambient temperature of 295–310 . However, limitations are still existing in Eq. (10) that need to be further corrected due to: (1) the experimental values were obtained from porcine bloods rather than human bloods although their non-Newtonian properties are similar; and (2) the blood properties are always individual-specific; thus, a more accurate correlation based on Eq. (10) needs to be optimized using statistical analysis with enough human blood samples.
To mimic the human blood with non-Newtonian properties, two synthetic blood analogues (e.g., 225 ppm XG with a density of 930 , and 185 ppm XG and 446 ppm FPP with a density of 940 ) were prepared [see Fig. 6(a)]. The detailed generation processing of blood analogues has been specified in Sec. II A 2. In Figs. 6(a) and 6(b), it can be observed that 225 ppm XG solution without FPPs presents the similar shear-thinning properties of human blood and pig blood under the testing temperature ∼310 , which is the normal body temperature. Another synthetic analogue at = 298 shows similar rheological properties of human bloods at = 310 [see Figs. 6(a) and 6(b)], indicating that the analogue can be employed to study flow characteristics in artery and aneurysm models in vitro under the room temperature (i.e., 298 ). Using the measured viscosity data of blood analogues, one non-Newtonian power-law viscosity model [i.e., Eq. (11)] was proposed to represent the relationships between viscosity ( ) and shear rate ( ) for the generated blood analogue (i.e., 185 ppm XG and 446 ppm FPP at = 298 ). Specifically, Eq. (11) can be expressed by, for example,
| (11) |
FIG. 6.
Viscosity profiles based on the generated blood analogue at T ≈ 298 varying with shear rates: (a) comparisons of experimental measurements and proposed non-Newtonian viscosity power-law model [i.e., Eq. (11)]. (b) Comparisons in viscosity profiles among the proposed non-Newtonian power-law viscosity models [i.e., Eq. (11)] at T ≈ 298 , developed non-Newtonian blood viscosity model at T ≈ 310 [Eq. (10)], pig blood at T ≈ 310 , generated blood analogues (i.e., 225 ppm XG at T ≈ 310 and 185 ppm XG + 446 FPP at T ≈ 298 ), and previous publications in human blood viscosity measurements at T ≈ 310 .4,5,8,58,73
The correlation coefficient R is larger than 0.99 for the proposed model when compared to the experimental measurements. Furthermore, Fig. 6(b) shows good agreements between the proposed non-Newtonian power-law viscosity model (based on viscosity profiles of the generated blood analogue) and human blood from previous publications,4,5,8,58,73 with from 0.01 to 250 s−1. In this work, the in vitro PIV measurements were conducted under the indoor temperature of 297.6 (before PIV tests)−298.1 (after PIV tests). It can be seen in Figs. 6(a) and 6(b) that there is no significant difference between = 297.6 and = 298.1 in the viscosity–shear rate relationships. Thus, the averaged values under two temperatures are applied to derive the blood non-Newtonian power-law viscosity model [e.g., Eq. (11)], which was also adopted to investigate the hemodynamic characteristics in the ICASA model in silico and quantify its differences in rheological behaviors from the simplified Newtonian blood model.
B. In vitro-based CFD model validation
1. CFD model validation
To develop an experimental validated CFD model, comparisons of blood flow characteristics in the ICASA model [i.e., non-dimensionalized magnitude of velocity (i.e., ), normalized , volumetric flow rate , distributions of velocity vectors and streamlines] were evaluated between PIV tests and CFD modeling at designated time instants within a cardiac cycle. Precisely, two selected planes (e.g., slice A and slice B) in the ICASA model (see Fig. 1, and step II in Fig. 2) were extracted to visualize the comparisons between PIV and CFD, respectively. One plane at x = 15.8 mm (i.e., slice A) crossing the ICA center at three representative time instants (e.g., = 0.0606, 0.1652, and 0.2605 s) was adopted to investigate the flow distributions in the ICA, which aims to inspect incoming velocity profiles and volumetric flow rates approaching the aneurysmal sac. At another three instants (i.e., = 0.078, 0.1085, and 0.154 s), the slice B (i.e., plane x = 27.5–29.5 mm) is extracted across the aneurysm sac near the center to evaluate the flow characteristics in CFD and PIV. Meanwhile, using the flow rate waveforms measured by the flowmeter system (see step I in Fig. 2), a periodically pulsatile flow rate waveform with a period 1.048 s was employed as the boundary and initial conditions for CFD modeling, which was generated by averaging 50 cardiac cycles periodically [see steps I and III in Figs. 2 and 4(b)]. More specifically, the compared variables (i.e., and ) employed into the CFD model validation are defined as, for example,
| (12a) |
| (12b) |
| (12c) |
| (12d) |
where is the non-dimensionalized magnitude of velocity at point of extracted line in the slice A, is the magnitude of velocity at point of extracted line in the slice A, and is the maximum at slice A in PIV measurements at the corresponding time instant. is the total number of designated lines, and = 200 equally spaced points were located at the line in slice A. In addition, is volumetric flow rate, and is the differential area with corresponding local velocities (i.e., ).
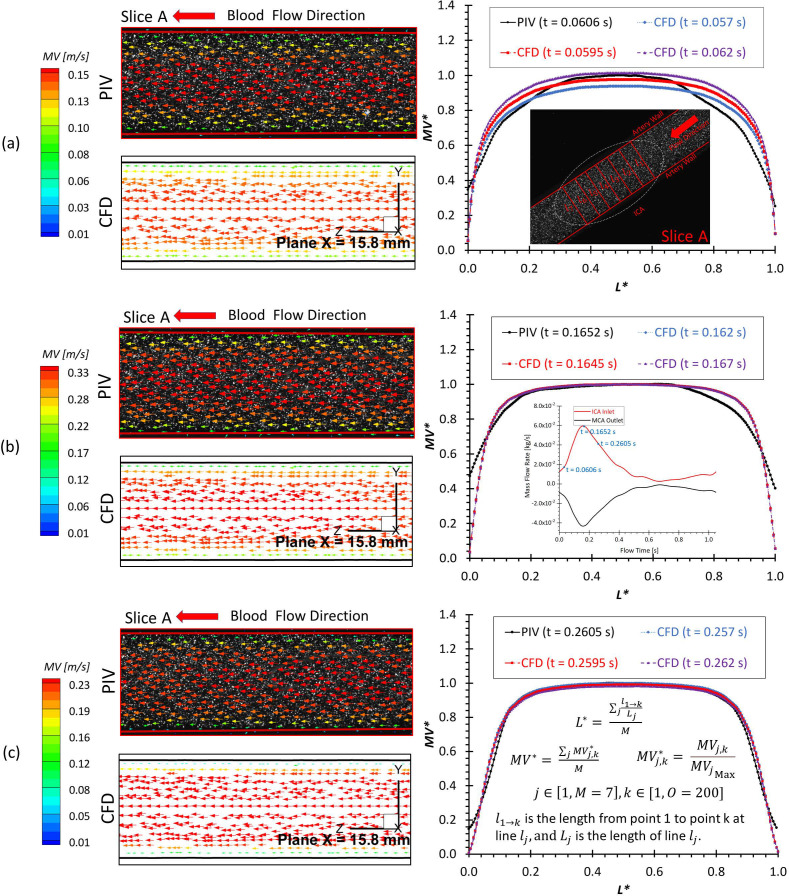
Figures 7(a)–7(c) present the comparisons between PIV and CFD in visualized velocity vectors on slice A and averaged at designated lines (i.e., ) at three representative time instants (e.g., = 0.0606, 0.1652, and 0.2605 s), in which the good agreements indicate that blood flow patterns in ICA match well between PIV measurements and CFD simulations qualitatively and quantitatively, especially in the locations where L* ranges from ∼0.05 to ∼0.95. The correlation coefficients of comparable flow patterns between PIV and CFD were calculated using Pearson correlation [e.g., Eq. (1)] and shown in Table II, which ranges from 0.945 to 0.993 varying with investigated time instants. It indicates the good agreements between experimental and numerical results more directly. Moreover, the good matching can be found from the comparisons of flow rate measurements using the flowmeter system, PIV, and CFD (see Table III), presenting that the smallest relative error is less than 1% at various investigated time instants.
FIG. 7.
Comparisons in flow characteristics at the extracted slice A (plane x = 15.8 mm) between PIV measurements and CFD simulations at different time instants: (a) t = 0.0606 s. (b) t = 0.1652 s. (c) t = 0.2605 s.
TABLE II.
Correlation coefficient R of blood flow patterns at corresponded time instant t between PIV and CFD in the ICASA model.
| PIV | CFD | R | PIV | CFD | R | PIV | CFD | R |
|---|---|---|---|---|---|---|---|---|
| t (s) | t (s) | t (s) | ||||||
| 0.0606 | 0.0570 | 0.955 | 0.1652 | 0.1620 | 0.951 | 0.2605 | 0.2570 | 0.991 |
| 0.0595 | 0.945 | 0.1645 | 0.953 | 0.2595 | 0.993 | |||
| 0.0620 | 0.951 | 0.1670 | 0.952 | 0.2620 | 0.992 | |||
TABLE III.
Relative errors in flow rates V at corresponded time instant t among PIV, flowmeter, and CFD in the ICASA model.
| PIV | Flowmeter | CFD | Relative errors (%) | |||||
|---|---|---|---|---|---|---|---|---|
| t (s) | V (L/min) | t (s) | V (L/min) | t (s) | V (L/min) | Flowmeter vs PIV | Flowmeter vs CFD | CFD vs PIV |
| 0.0606 | 1.6169 | 0.0570 | 1.6210 | 0.0570 | 1.6210 | 0.25 | 0 | 0.25 |
| 0.0595 | 1.6839 | 0.0595 | 1.6839 | 3.98 | 0 | 3.98 | ||
| 0.0620 | 1.7736 | 0.0620 | 1.7736 | 8.83 | 0 | 8.83 | ||
| 0.1652 | 3.8189 | 0.1620 | 3.7997 | 0.1620 | 3.7997 | 0.51 | 0 | 0.51 |
| 0.1645 | 3.7949 | 0.1645 | 3.7949 | 0.63 | 0 | 0.63 | ||
| 0.1670 | 3.7861 | 0.1670 | 3.7861 | 0.87 | 0 | 0.87 | ||
| 0.2605 | 2.6685 | 0.2570 | 2.6927 | 0.2570 | 2.6927 | 0.91 | 0 | 0.91 |
| 0.2595 | 2.6665 | 0.2595 | 2.6665 | 0.08 | 0 | 0.08 | ||
| 0.2620 | 2.6289 | 0.2620 | 2.6289 | 1.51 | 0 | 1.51 | ||
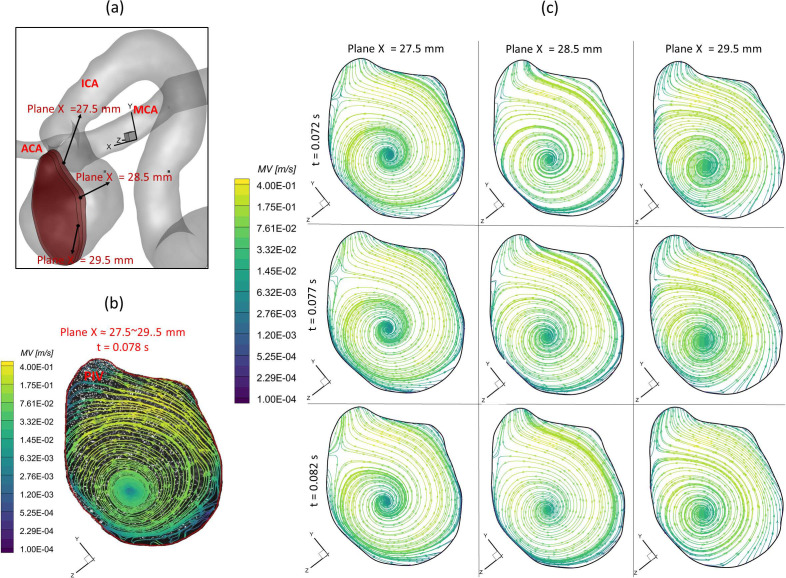
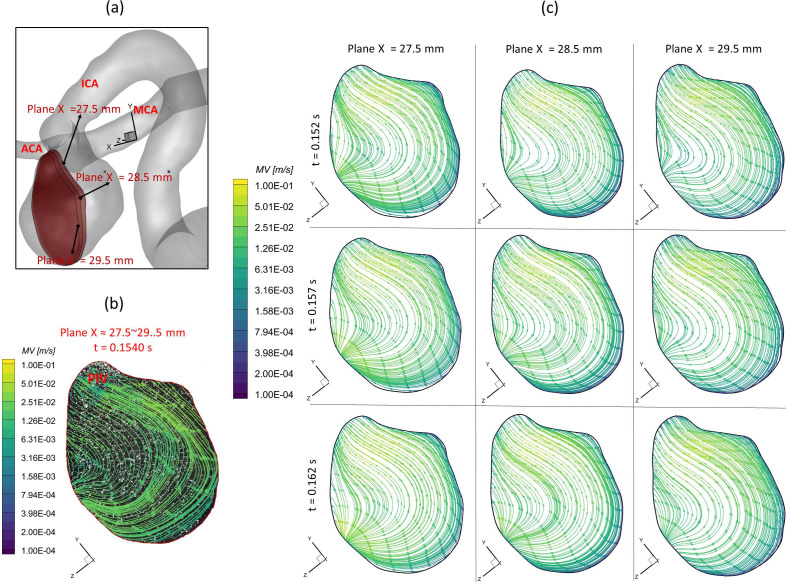
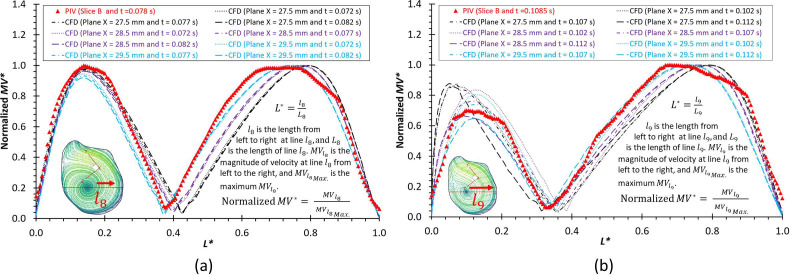
To further consolidate the CFD model validation in this study, the velocity profiles, flow streamline distributions, and flow vortex locations in the aneurysmal sac have been compared between PIV and CFD in the extracted slice B, that is, plane x = 27.5–29.5 mm (see step II in Fig. 2), which is due to the laser thickness of 2 mm, at the three designated time instants (i.e., = 0.078, 0.1085, and 0.154 s) during a cardiac cycle. It is worth mentioning that the influences by the laser thickness (i.e., 2 mm) on the designated slice position and duration-based nature of the PIV system (e.g., the time delay between image A and image B) need to be evaluated to eliminate the errors. Specifically, to find more accurate data in CFD simulation, which can be comparable with the corresponding PIV data, CFD modeling results were extracted from three cut-planes at three instants, which are close to the counterparts in PIV. For instance [see Fig. 8(a)], to compare PIV data in the slice B (i.e., plane x = 27.5–29.5 mm) at t = 0.078 s, CFD results for three cut-planes (i.e., plane x = 27.5 mm, plane x = 28.5 mm, and plane x = 29.5 mm) were extracted at all three instants (e.g., = 0.072, = 0.077, and = 0.082 s). The flow streamlines shown in Figs. 8–10 manifest that CFD modeling results have good performance on predicting the blood flow patterns as well as vortex locations at = 0.078 s and = 0.1540 s (see Figs. 8 and 9). More quantitative comparisons with decent matching can be found in the normalized on the extracted profiles (e.g., at = 0.078 s and at = 0.1085 s) presented in Figs. 11(a) and 11(b), respectively.
FIG. 8.
Comparisons of flow streamlines and magnitudes of velocity at the extracted slice B (plane x ≈ 27.5–29.5 mm) between PIV measurements and CFD simulations at the time instant t = 0.078 s: (a) schematic planes for the comparisons between PIV and CFD. (b) Distributions of flow streamlines and magnitudes of velocity in PIV. (c) Distributions of flow streamlines and magnitudes of velocity in CFD.
FIG. 9.
Comparisons of flow streamlines and magnitudes of velocity in the extracted slice B (plane x ≈ 27.5–29.5 mm) between PIV measurements and CFD simulations at the time instant t = 0.1085 s: (a) schematic planes for the comparisons between PIV and CFD. (b) Distributions of flow streamlines and magnitudes of velocity in PIV. (c) Distributions of flow streamlines and magnitudes of velocity in CFD.
FIG. 10.
Comparisons of flow streamlines and magnitudes of velocity in the extracted slice B (plane x ≈ 27.5–29.5 mm) between PIV measurements and CFD simulations at the time instant t = 0.1540 s: (a) schematic planes for the comparisons between PIV and CFD. (b) Distributions of flow streamlines and magnitudes of velocity in PIV. (c) Distributions of flow streamlines and magnitudes of velocity in CFD.
FIG. 11.
Comparisons of normalized velocity profiles between PIV measurements and CFD simulations at the selected lines (across the vortex center) and time instants: (a) and t = 0.078 s. (b) and t = 0.1085 s.
Figure 12 presents the 3D streamlines in the aneurysmal sac at five representative time instants (i.e., t1 = 0.072 s, t2 = 0.162 s, t3 = 0.312 s, t4 = 0.662 s, and t5 = 0.952 s). It can be found in both PIV and CFD investigations (see Figs. 8–10) that the vortex forms at the lower central position at the early stage (e.g., t1 = 0.072 s), then travels to the left near to the wall along with more bloods flowing into the dome (e.g., t = 0.1085 s), and it has the trend to demolish due to the 3D flow convection near the wall (e.g., t2 = 0.162 s). After causing the strongest impingement effects against the wall on the left upper corner region at the systole peak (i.e., t2 = 0.162 s) shown in Fig. 12, the blood flow stream tends to generate secondary vortices near the bottom at t3 = 0.312 s. Until the blood stream slowly rushes into the aneurysmal sac at the end of the pulsatile period (t4 = 0.662 s and t5 = 0.952 s in Fig. 12), new vortices begin to form inside of the sac. Additionally, it is interesting to discover that although the flow rate 0.031 39 kg/s at t3 = 0.312 s is close to the flow rate 0.032 64 kg/s at t1 = 0.072 s, the blood flow domain in the sac is more disordered and turbulent as shown in the flow streamlines (see Fig. 12). These phenomena indicate the blood flow at the leeward side of the systole peak (i.e., t3) can influence the blood transport behaviors more than the windward side of the systole peak (i.e., t1) in the aneurysmal sac by inducing more turbulent eddies.
FIG. 12.
Distributions of visualized 3D flow streamlines in the ICASA model at representative time instants (i.e., t1 = 0.072 s, t2 = 0.162 s, t3 = 0.312 s, t4 = 0.662 s, and t5 = 0.952 s) using CFD simulations with the proposed non-Newtonian blood power-law viscosity model [i.e., Eq. (11)].
2. Error analysis
Nevertheless, it still can be observed minor differences in flow patterns between PIV tests and CFD results, mainly in near-wall regions of the ICASA model, which were mentioned as well in previous studies using PIV.19,30 Specifically, there are several factors causing the discrepancies between PIV and CFD, that is,
-
(1)
The final physical ICASA model constructed from the standard triangle language (STL) data may have slight geometric differences with the original STL data that have the potential to influence the fllow results significantly, which has been introduced in Sec. II A 1 that printing tolerance in the X/Y direction (in printing plane) with ±0.05 mm and in the Z direction (out-of-plane) is ±0.125 mm can contribute morphological differences between the employed in silico model and in vitro model.
-
(2)
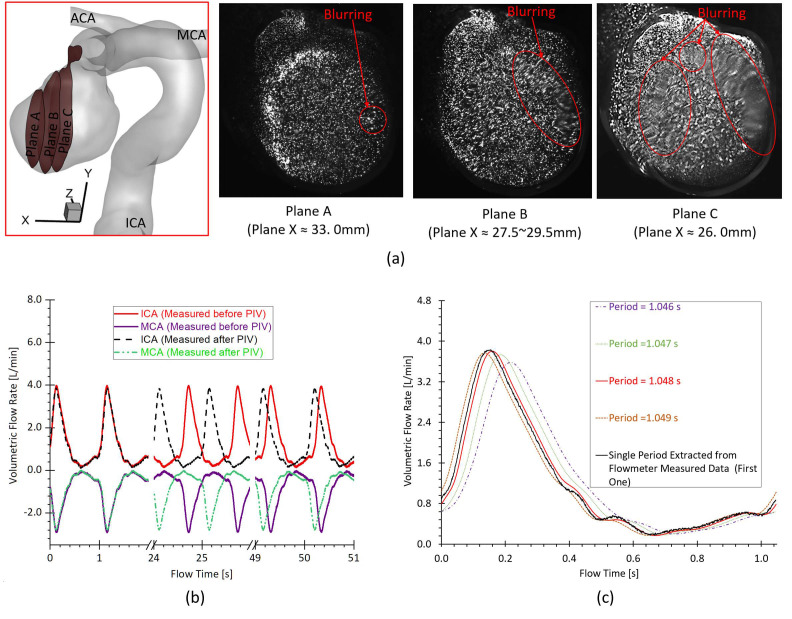
Despite fluorescent particles being used, the light reflection from the internal wall of the physical model and light refraction in the experimental fluid can illuminate particles off the desired plane especially near the wall, which can increase the image noises then further affect identifying the in-plane FPPs trajectory. Moreover, the complicated curvatures on the aneurysmal sac walls can influence the lights into the camera and then generate blurring spots on PIV images [see Fig. 13(a)]. It is worth mentioning that plane B was selected as the main investigated slice (i.e., slice B) by balancing the size of sliced region and the image clarity.
-
(3)
The cycle-to-cycle fluctuations [see Fig. 13(b)] in the periodically pulsatile flow (e.g., volumetric flow rate and period) can affect the accuracy of “phase-averaged” results in the PIV experiments, and then contribute to the differences to some extent when comparing to CFD modeling.
-
(4)
A heart rate simulated by the pulsatile blood pump with a confidence interval of 58 ± 0.5 beats per minute can cause some differences [see Fig. 13(b)] between PIV and CFD when deciding the pulsatile period for the initial and boundary conditions of CFD simulations, although the most approximate period, that is, 1.048 s, was adopted through averaging 50 periods [see Fig. 13(c)].
-
(5)
Other unavoidable errors induced by the factors such as the minor errors in the angle (e.g., ) between the laser sheet and the camera axis, the thickness of the laser sheet (e.g., ), could affect the location of the extracted slice in the ICASA model, then further contribute to the differences between PIV and CFD. These influences are more apparent in comparisons of normalized at and in the slice B across the aneurysmal sac in the middle [see Figs. 11(a) and 11(b)].
-
(6)
The elastic behaviors of particles in the artificial blood analogue were not simulated in the current CFD investigations, which may contribute slight differences in the flow patterns comparisons between CFD and PIV.
-
(7)
Additionally, the time gap (e.g., delay time) of the two laser sheets in the PIV system may influence the accuracy of designated time instant to some extent, since the corresponding instant in CFD is a specific value, while the counterpart in PIV is a duration between laser A and laser B (see Fig. 1).
FIG. 13.
Factors contributing to the differences between PIV measurements and CFD simulations: (a) the blurring spots in PIV images at investigated slices (i.e., plane A, plane B, and plane C). (b) The cycle-to-cycle fluctuations in the periodically pulsatile flow conditions. (c) Comparisons among the decided averaged pulsatile periods (i.e., period = 1.046, 1.047, 1.048, and 1.049 s) and a single period extracted from the flowmeter measured data.
With tremendous efforts put into both CFD simulations and experiments, it has to be stated that reaching a perfect agreement of the flow patterns in such a complicated 3D aneurysmal model is almost impossible in the present study. Therefore, with the decent agreements in comparisons between PIV and CFD, it was concluded that the current CFD model was validated by the experimental measurements using the realistic non-Newtonian blood analogue, and it will be further applied to investigate the hemodynamic factors on the pathophysiology of CAs with statistical analysis. Also, this PIV study provides a benchmarked model and guidance for other researchers to investigate the hemodynamic effects on human CAs using the non-Newtonian blood analogue with shear-thinning properties. However, the imaging limitations and drawbacks, especially in the near-wall regions, still need to be addressed in the future investigations.
C. Newtonian vs non-Newtonian blood viscosity models
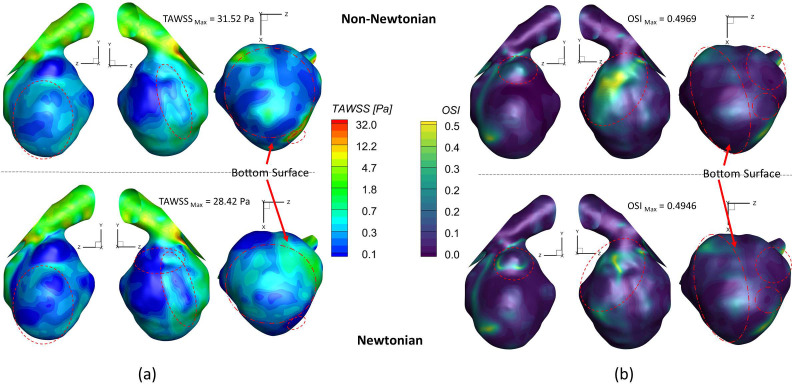
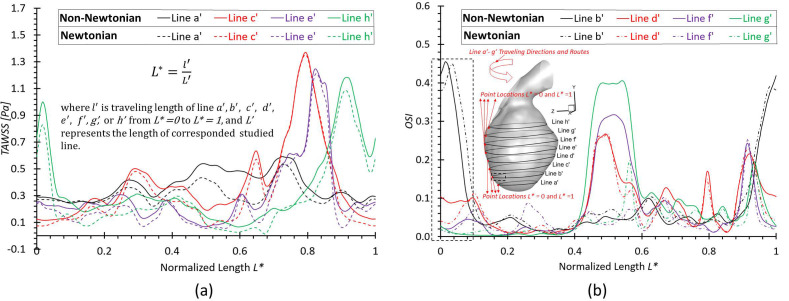
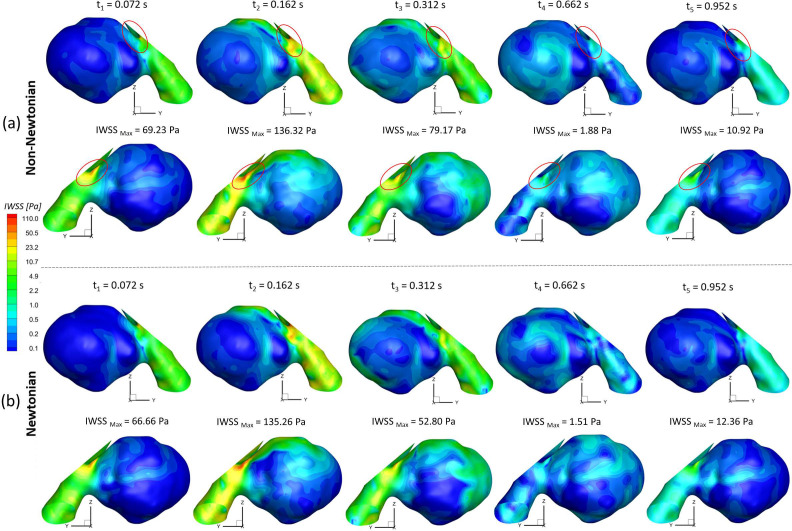
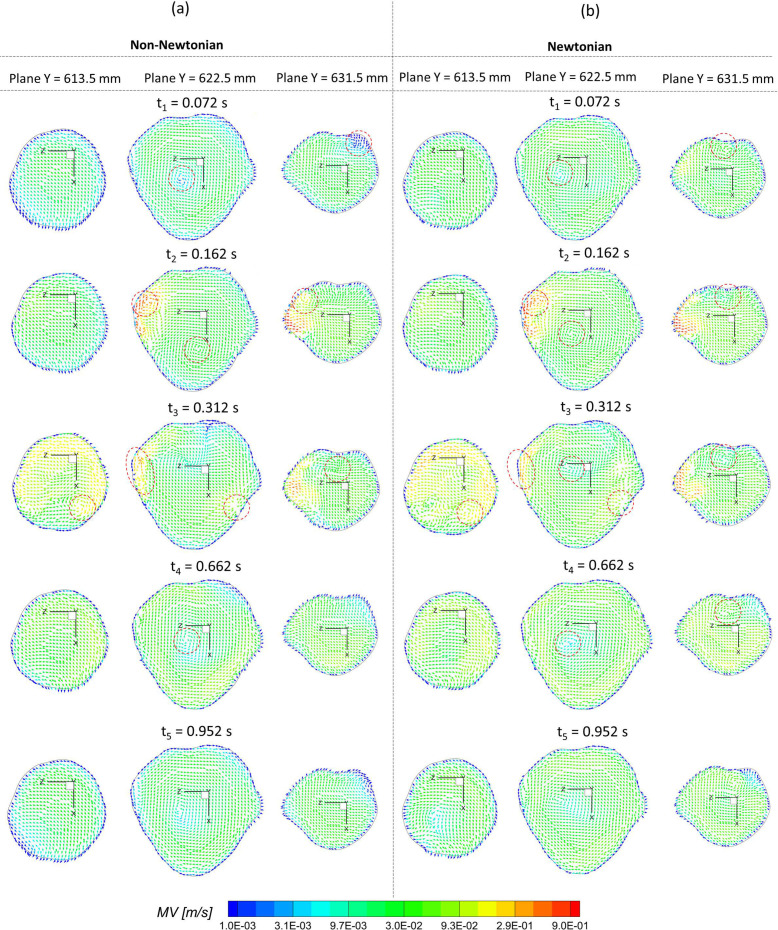
To investigate the effect of non-Newtonian viscosity, the CFD simulations were compared using simplified Newtonian blood and realistic non-Newtonian blood analogue with shear-thinning properties [see Fig. 4(a)] in the ICASA model. It is worth mentioning that the equations to calculate the comparable hemodynamic parameters, for example, time-averaged wall shear stress (TAWSS), instantaneous wall shear stress (IWSS), and oscillatory shear index (OSI), can be found in the supplementary material. Figure 14(a) manifests noticeable differences between Newtonian fluid ( ) and non-Newtonian fluid [i.e., Eqs. 4(a)–4(c)] in calculations of TAWSS in the extracted aneurysmal sac region from the ICASA model. Overall, it shows a wider range of TAWSS (i.e., 0–31.52 Pa) for the non-Newtonian model than the counterparts (i.e., 0–28.42 Pa) for the Newtonian model, which is contrary to a previous numerical study,90 in which a narrower range of TAWSS was observed for the non-Newtonian model, although the absolute discrepancies in the two models are not substantial. The similar discrepancy was also found in the OSI distributions on the aneurysmal sac wall [see Fig. 14(b)], with an OSI range of 0–0.4969 for the non-Newtonian model and a similar OSI range of 0–0.4946 for the simplified Newtonian blood. Indeed, it can be observed that most surface regions around the sac register a higher TAWSS and OSI in the non-Newtonian model, which are highlighted with circled red dash lines shown in Figs. 14(a) and 14(b). Nevertheless, the Newtonian model dominates most region on the bottom surface of the aneurysmal dome with higher TAWSS and OSI [see highlighted with circled dash–dot-lines in Figs. 14(a) and 14(b)], which agrees with the previous findings in this local region.89 More quantitatively, eight circled lines (i.e., line a' to line h') were extracted from the aneurysmal sac in the Y direction with an equal space of 3.0 mm, which were visualized in terms of TAWSS and OSI [see Figs. 15(a) and 15(b)]. Figure 15 shows that the hemodynamic characteristics (i.e., TAWSS and OSI) in Newtonian and non-Newtonian models present similar trends but vary with specific values. The aneurysmal walls for non-Newtonian model undertake higher TAWSS and OSI on most selected profiles, in accordance with the above findings. It is interesting to observe the highest OSI ∼0.46 appearing at = 0.015 in line b' for the non-Newtonian model, while the highest value moves forward to = 0.038 for the Newtonian model, which is highlighted with black dash-lined rectangular in Fig. 15(b). To further clarify the differences between Newtonian and non-Newtonian blood viscosity models in CFD simulations during the transient pulsatile flow period (period = 1.048 s), the hemodynamic features, that is, IWSS on the aneurysmal dome, and velocity vector distributions were analyzed at five representative instants [i.e., t1 = 0.072 s, t2 = 0.162 s, t3 = 0.312 s, t4 = 0.662 s, and t5 = 0.952 s as shown in Fig. 4(b)]. Specifically, both non-Newtonian and Newtonian flow models produce highest IWSS at the systole peak (i.e., t2 = 0.162 s), with a value of 136.32 and 135.26 , respectively (see Fig. 16). Also, IWSS distribution has the similar trend as TAWSS that the non-Newtonian model registers more areas with higher WSS than the Newtonian model at all studied time instants (see Fig. 16). The discrepancies on the performance between non-Newtonian and Newtonian models can be further noticed by the vortex locations and flow directions (highlighted with read dash lines) shown in extracted planes (e.g., plane y = 613.5 mm, plane y = 622.5 mm, and plane y = 631.5 mm) at all investigated time instants (see Fig. 17). It is found that the simplified Newtonian model not only underestimates TAWSS and OSI in most regions of the aneurysmal sac but also may make mistakes to identify high OSI regions in CAs. Therefore, an experimentally validated CFD model with a realistic non-Newtonian viscosity model (i.e., rheological shear-thinning features) is highly recommended to study hemodynamic characteristics in the initiation, growth, and rupture of aneurysmal sacs, based on the findings in the different performances on the hemodynamic predictions between simplified Newtonian and realistic non-Newtonian blood viscosity models.
FIG. 14.
Comparisons of hemodynamic characteristics in the extracted aneurysmal sac between simplified Newtonian and realistic non-Newtonian blood viscosity models: (a) time-averaged wall shear stress (TAWSS) distributions. (b) Oscillatory shear index (OSI) distributions.
FIG. 15.
Comparisons of hemodynamic characteristics in designated lines between simplified Newtonian and realistic non-Newtonian blood viscosity models: (a) distributions of time-averaged wall shear stress (TAWSS) at selected lines a', c', e', and h'. (b) Distributions of oscillatory shear index at selected lines b', d', f', and g'.
FIG. 16.
Comparisons of hemodynamic characteristics in the extracted aneurysmal sac between simplified Newtonian and realistic non-Newtonian blood viscosity models at representative time instants (i.e., t1 = 0.072 s, t2 = 0.162 s, t3 = 0.312 s, t4 = 0.662 s, and t5 = 0.952 s): (a) realistic non-Newtonian blood. (b) Simplified Newtonian blood.
FIG. 17.
Comparisons of velocity profiles (vectors and magnitude of velocity) in the extracted slices (i.e., plane Y = 613. 5 mm, plane Y = 622.5 mm, and plane Y = 631.5 mm) in the aneurysmal sac between simplified Newtonian and realistic non-Newtonian blood viscosity models at representative time instants (i.e., t1 = 0.072 s, t2 = 0.162 s, t3 = 0.312 s, t4 = 0.662 s, and t5 = 0.952 s): (a) realistic non-Newtonian blood. (b) Simplified Newtonian blood.
V. CONCLUSIONS
In this study, a numerical ICASA model based on realistic non-Newtonian blood analogues was developed and experimentally validated by the parallel PIV measurements. Specifically, the viscosities of the porcine whole blood samples under selected temperatures were measured by varying shear rates, which was to investigate the temperature influences on the blood viscosity profiles, and were adopted as the references for the generation of non-Newtonian blood analogues. Subsequently, the PIV measurements were carried out to investigate the flow characteristics in a physical ICASA model using a synthetic non-Newtonian blood analogue. The experimental data were compared with the CFD simulation results to validate the numerical model. In addition, the differences of hemodynamic characteristics in the aneurysmal sac between simplified Newtonian and realistic non-Newtonian blood power-law viscosity models were evaluated. Main conclusions are summarized as follows:
-
•
Blood viscosity presents non-isothermal features and shear-thinning properties. Considering the factors of shear rate and temperature, a non-Newtonian blood viscosity model [i.e., Eq. (10)] is proposed based on the measurement results of porcine whole blood samples, which shows good agreements with the experimental data in the tested temperature range of ∼295 − ∼310 K.
-
•
The synthetic non-Newtonian blood analogues can capture the shear-thinning properties well, and a non-Newtonian power-law viscosity model [i.e., Eq. (11)] was developed for the realistic non-Newtonian blood analogue under the room temperature of 298 K, which shows the identical shear-thinning features in the human blood at a normal body temperature (i.e., 310 K).
-
•
Decent agreements were reached between PIV tests and CFD investigations in blood flow rates, non-dimensionalized/normalized velocity profiles, and distributions of streamlines and vortex, indicating the numerical model was validated and can be employed to evaluate hemodynamic factors on the pathobiology of CAs.
-
•
Comparing the results of CFD simulations between realistic non-Newtonian and simplified Newtonian blood viscosity models, it has been found the simplified Newtonian fluid may not only underestimate TAWSS and OSI in most regions of the aneurysmal sac but also make mistakes in identifying the high OSI regions on the sac surface, which can mislead/misidentify the hemodynamic influences on the aneurysmal sac walls.
In conclusion, the synthetic non-Newtonian blood analogue and PIV measurements on the flow inside the aneurysm model provide a benchmarked pathway to validate the numerical modeling for the study of hemodynamics in CAs, when the non-Newtonian blood shear-thinning property is concerned. The possible factors accounting for the discrepancy between CFD modeling and PIV measurements were thoroughly analyzed. The developed CFD model for non-Newtonian fluids can be further employed to investigate hemodynamic factors on the pathophysiology of CAs statistically.
VI. LIMITATIONS OF THIS STUDY
As discussed in Sec. IV A, the proposed blood viscosity model [Eq. (10)] was generated based on the measurements from porcine whole blood samples rather than human bloods, which may influence the accuracy in viscosity predictions for human beings, especially under small shear rates.85 The correlations may be still needed to optimize Eq. (10) based on the statistical investigations with a large number of human blood samples. Correlated Eq. (10) could be specified by the categories such as ages (i.e., children and adults), gender (i.e., male and female), and health conditions. Also, how Eq. (10) can be used in the scientific research and practical applications still need more explorations since the normal blood temperature is often in a range of 309.5–310.7 , although some limited efforts have been made such as the low-temperature plasmas in biomedical applications.91,92 Also, although the previous efforts93 compared the viscous and elastic components between the porcine blood and XG fluids under different hematocrit levels, and found that they have similar viscoelastic properties, the CFD investigations in this study only simulated the shear-thinning viscosity behaviors without elastic properties. The elasticity of RBCs in microscale was not well simulated by the fluorescent particles in both blood analogue models in the experiment and CFD modeling. Only the macroscale shear-thinning properties that determine the hemodynamic characteristics were focused on in the present study. In addition, the current study did not simulate the arterial wall deformations coupled with the hemodynamic patterns explicitly. Indeed, the arterial tissues consist of heterogeneous layers [e.g., intima (inner layer), media (middle layer), adventitia (outer layer)] schematically with significant differences in physical properties,94,95 and our following research is going to employ the experimental validated numerical model in this work to conduct statistical analysis of the hemodynamic factors on the pathophysiology of the cerebral aneurysms using a two-way fluid–structure interaction (FSI) manner, that is, the deformation effects between the cerebral artery wall and blood.
SUPPLEMENTARY MATERIAL
See the supplementary online material for the complete derivation process of the non-Newtonian blood viscosity model dependent on shear rates and temperatures, and the detailed hemodynamic parameter definitions for comparisons between Newtonian and non-Newtonian models.
ACKNOWLEDGMENTS
This study was sponsored by National Heart, Lung, and Blood Institute with the Award No. R44HL132664 and the Premier Health and Boonshoft School of Medicine Endowment Funding at Wright State University. The use of ANSYS software (Canonsburg, PA) as part of the ANSYS-WSU academic partnership agreement is gratefully acknowledged (Ms. C. Taylor and Mr. V. Ganore).
AUTHOR DECLARATIONS
Conflict of Interest
The authors have no conflicts to disclose.
Author Contributions
Hang Yi: Data curation (equal); Formal analysis (equal); Investigation (equal); Methodology (equal); Validation (equal); Visualization (equal); Writing – original draft (lead). Zifeng Yang: Conceptualization (lead); Data curation (equal); Formal analysis (equal); Funding acquisition (equal); Investigation (equal); Methodology (equal); Project administration (lead); Resources (lead); Software (equal); Supervision (equal); Validation (equal); Visualization (equal); Writing – review & editing (equal). Mark Johnson: Data curation (supporting); Investigation (equal); Validation (equal); Writing – review & editing (equal). Luke Bramlage: Data curation (equal); Writing – review & editing (equal). Bryan Ludwig: Conceptualization (equal); Funding acquisition (equal); Resources (equal); Supervision (equal); Writing – review & editing (equal).
DATA AVAILABILITY
The data that support the findings of this study are available from the corresponding author upon reasonable request.
References
- 1. Sforza D. M., Putman C. M., and Cebral J. R., “ Hemodynamics of cerebral aneurysms,” Annu. Rev. Fluid Mech. 41(1), 91–107 (2009). 10.1146/annurev.fluid.40.111406.102126 [DOI] [PMC free article] [PubMed] [Google Scholar]
- 2. Ostadfar A., in Biofluid Mechanics, edited by Ostadfar A. ( Academic Press, 2016), pp. 243–271. [Google Scholar]
- 3. Sousa P. C., Pinho F. T., Oliveira M. S. N., and Alves M. A., “ Extensional flow of blood analog solutions in microfluidic devices,” Biomicrofluidics 5(1), 014108 (2011). 10.1063/1.3567888 [DOI] [PMC free article] [PubMed] [Google Scholar]
- 4. Merrill E. W., Cokelet G. C., Britten A., and Wells R. E., “ Non-Newtonian rheology of human blood—Effect of fibrinogen deduced by ‘Subtraction,’” Circ. Res. 13(1), 48–55 (1963). 10.1161/01.RES.13.1.48 [DOI] [PubMed] [Google Scholar]
- 5. Nader E., Skinner S., Romana M., Fort R., Lemonne N., Guillot N., Gauthier A., Antoine-Jonville S., Renoux C., Hardy-Dessources M.-D., Stauffer E., Joly P., Bertrand Y., and Connes P., “ Blood rheology: Key parameters, impact on blood flow, role in sickle cell disease and effects of exercise,” Front. Physiol. 10, 1329 (2019). 10.3389/fphys.2019.01329 [DOI] [PMC free article] [PubMed] [Google Scholar]
- 6. Cokelet G. R. and Meiselman H. J., Biomedical and Health Research ( Commission of the European Communities then IOS Press, 2007), Vol. 69, p. 45. [Google Scholar]
- 7. Baskurt O. K. and Meiselman H. J., paper presented at the Seminars in thrombosis and hemostasis (2003).
- 8. Skalak R., Keller S. R., and Secomb T. W., “ ASME centennial historical perspective paper: Mechanics of blood flow,” J. Biomech. Eng. 103(2), 102–115 (1981). 10.1115/1.3138253 [DOI] [PubMed] [Google Scholar]
- 9. Jeong W. and Rhee K., “ Hemodynamics of cerebral aneurysms: Computational analyses of aneurysm progress and treatment,” Comput. Math. Methods Med. 2012, 782801. 10.1155/2012/782801 [DOI] [PMC free article] [PubMed] [Google Scholar]
- 10. Sheikh M. A. A., Shuib A. S., and Mohyi M. H. H., “ A review of hemodynamic parameters in cerebral aneurysm,” Interdiscip. Neurosurg. 22, 100716 (2020). 10.1016/j.inat.2020.100716 [DOI] [Google Scholar]
- 11. Yu W., Huang Y., Zhang X., Luo H., Chen W., Jiang Y., and Cheng Y., “ Effectiveness comparisons of drug therapies for postoperative aneurysmal subarachnoid hemorrhage patients: Network meta-analysis and systematic review,” BMC Neurol. 21(1), 294 (2021). 10.1186/s12883-021-02303-8 [DOI] [PMC free article] [PubMed] [Google Scholar]
- 12. Nieuwkamp D. J., Setz L. E., Algra A., Linn F. H. H., de Rooij N. K., and Rinkel G. J. E., “ Changes in case fatality of aneurysmal subarachnoid haemorrhage over time, according to age, sex, and region: A meta-analysis,” Lancet Neurol. 8(7), 635–642 (2009). 10.1016/S1474-4422(09)70126-7 [DOI] [PubMed] [Google Scholar]
- 13. Nixon A. M., Gunel M., and Sumpio B. E., “ The critical role of hemodynamics in the development of cerebral vascular disease,” J. Neurosurg. 112(6), 1240–1253 (2010). 10.3171/2009.10.JNS09759 [DOI] [PubMed] [Google Scholar]
- 14. Aoki T. and Nishimura M., “ The development and the use of experimental animal models to study the underlying mechanisms of CA formation,” J. Biomed. Biotechnol. 2011, 535921. 10.1155/2011/535921 [DOI] [PMC free article] [PubMed] [Google Scholar]
- 15. Fennell V. S., Kalani M. Y. S., Atwal G., Martirosyan N. L., and Spetzler R. F., “ Biology of saccular cerebral aneurysms: A review of current understanding and future directions,” Front. Surg. 3, 43 (2016). 10.3389/fsurg.2016.00043 [DOI] [PMC free article] [PubMed] [Google Scholar]
- 16. Wu T. and Zhu Q., “ Advancement in the haemodynamic study of intracranial aneurysms by computational fluid dynamics,” Brain Hemorrhages 2(2), 71–75 (2021). 10.1016/j.hest.2020.12.002 [DOI] [Google Scholar]
- 17. Chung B. and Cebral J. R., “ CFD for evaluation and treatment planning of aneurysms: Review of proposed clinical uses and their challenges,” Ann. Biomed. Eng. 43(1), 122–138 (2015). 10.1007/s10439-014-1093-6 [DOI] [PubMed] [Google Scholar]
- 18. Zhang Y., Jing L., Zhang Y., Liu J., and Yang X., “ Low wall shear stress is associated with the rupture of intracranial aneurysm with known rupture point: Case report and literature review,” BMC Neurol. 16(1), 231 (2016). 10.1186/s12883-016-0759-0 [DOI] [PMC free article] [PubMed] [Google Scholar]
- 19. Hosseini S. A., Berg P., Huang F., Roloff C., Janiga G., and Thévenin D., “ Central moments multiple relaxation time LBM for hemodynamic simulations in intracranial aneurysms: An in-vitro validation study using PIV and PC-MRI,” Comput. Biol. Med. 131, 104251 (2021). 10.1016/j.compbiomed.2021.104251 [DOI] [PubMed] [Google Scholar]
- 20. Bouillot P., Brina O., Ouared R., Lovblad K.-O., Farhat M., and Pereira V. M., “ Particle imaging velocimetry evaluation of intracranial stents in sidewall aneurysm: Hemodynamic transition related to the stent design,” PLoS One 9(12), e113762 (2014). 10.1371/journal.pone.0113762 [DOI] [PMC free article] [PubMed] [Google Scholar]
- 21. Kosugi T., Nishino K., Isoda H., and Takeda S., in Proceedings of the JSME Annual Meeting (The Japan Society of Mechanical Engineers, 2004), Vol. 6, pp. 203–204. [Google Scholar]
- 22. Nishino K., Kawaguchi D., Sato H., Isoda H., and Kosugi T., “ In vitro PIV measurement and CFD analysis of flow patterns in cerebral aneurysm,” J. Visualization Soc. Jpn. 24(Suppl. 1), 149–152 (2004). 10.3154/jvs.24.Supplement1_149 [DOI] [Google Scholar]
- 23. Brindise M., Dickerhoff B., Saloner D., Rayz V., and Vlachos P., “ Volumetric PIV in patient-specific cerebral aneurysm,” in 69th Annual Meeting of the APS Division of Fluid Dynamics (American Physical Society, 2016), Vol. 61, No. 20, available at https://meetings.aps.org/Meeting/DFD16/Session/D15.1.
- 24. Yagi T., Sato A., Shinke M., Takahashi S., Tobe Y., Takao H., Murayama Y., and Umezu M., “ Experimental insights into flow impingement in cerebral aneurysm by stereoscopic particle image velocimetry: Transition from a laminar regime,” J. R. Soc. Interface 10(82), 20121031 (2013). 10.1098/rsif.2012.1031 [DOI] [PMC free article] [PubMed] [Google Scholar]
- 25. Yagi T., Yang W., and Umezu M., “ Effect of bileaflet valve orientation on the 3D flow dynamics in the sinus of Valsalva,” J. Biomech. Sci. Eng. 6(2), 64–78 (2011). 10.1299/jbse.6.64 [DOI] [Google Scholar]
- 26. Medero R., Ruedinger K., Rutkowski D., Johnson K., and Roldán-Alzate A., “ In vitro assessment of flow variability in an intracranial aneurysm model using 4D flow MRI and tomographic PIV,” Ann. Biomed. Eng. 48(10), 2484–2493 (2020). 10.1007/s10439-020-02543-8 [DOI] [PMC free article] [PubMed] [Google Scholar]
- 27. Ho W. H., Tshimanga I. J., Ngoepe M. N., Jermy M. C., and Geoghegan P. H., “ Evaluation of a desktop 3D printed rigid refractive-indexed-matched flow phantom for PIV measurements on cerebral aneurysms,” Cardiovasc. Eng. Technol. 11(1), 14–23 (2020). 10.1007/s13239-019-00444-z [DOI] [PMC free article] [PubMed] [Google Scholar]
- 28. Cancelliere N. M., Najafi M., Brina O., Bouillot P., Vargas M. I., Lovblad K.-O., Krings T., Pereira V. M., and Steinman D. A., “ 4D-CT angiography versus 3D-rotational angiography as the imaging modality for computational fluid dynamics of cerebral aneurysms,” J. NeuroInterventional Surg. 12(6), 626–630 (2020). 10.1136/neurintsurg-2019-015389 [DOI] [PubMed] [Google Scholar]
- 29. Ford M. D., Nikolov H. N., Milner J. S., Lownie S. P., DeMont E. M., Kalata W., Loth F., Holdsworth D. W., and Steinman D. A., “ PIV-measured versus CFD-predicted flow dynamics in anatomically realistic cerebral aneurysm models,” J. Biomech. Eng. 130(2), 021015 (2008). 10.1115/1.2900724 [DOI] [PubMed] [Google Scholar]
- 30. Raschi M., Mut F., Byrne G., Putman C. M., Tateshima S., Viñuela F., Tanoue T., Tanishita K., and Cebral J. R., “ CFD and PIV analysis of hemodynamics in a growing intracranial aneurysm,” Int. J. Numer. Methods Biomed. Eng. 28(2), 214–228 (2012). 10.1002/cnm.1459 [DOI] [PMC free article] [PubMed] [Google Scholar]
- 31. Sun Q., Groth A., and Aach T., “ Comprehensive validation of computational fluid dynamics simulations of in-vivo blood flow in patient-specific cerebral aneurysms,” Med. Phys. 39(2), 742–754 (2012). 10.1118/1.3675402 [DOI] [PubMed] [Google Scholar]
- 32. Brindise M. C., Rothenberger S., Dickerhoff B., Schnell S., Markl M., Saloner D., Rayz V. L., and Vlachos P. P., “ Multi-modality cerebral aneurysm haemodynamic analysis: In vivo 4D flow MRI, in vitro volumetric particle velocimetry and in silico computational fluid dynamics,” J. R. Soc. Interface 16(158), 20190465 (2019). 10.1098/rsif.2019.0465 [DOI] [PMC free article] [PubMed] [Google Scholar]
- 33. Roloff C., Stucht D., Beuing O., and Berg P., “ Comparison of intracranial aneurysm flow quantification techniques: Standard PIV vs stereoscopic PIV vs tomographic PIV vs phase-contrast MRI vs CFD,” J. NeuroInterventional Surg. 11(3), 275–282 (2019). 10.1136/neurintsurg-2018-013921 [DOI] [PubMed] [Google Scholar]
- 34. Li Y., Verrelli D. I., Yang W., Qian Y., and Chong W., “ A pilot validation of CFD model results against PIV observations of haemodynamics in intracranial aneurysms treated with flow-diverting stents,” J. Biomech. 100, 109590 (2020). 10.1016/j.jbiomech.2019.109590 [DOI] [PubMed] [Google Scholar]
- 35. Wüstenhagen C., John K., Langner S., Brede M., Grundmann S., and Bruschewski M., “ CFD validation using in-vitro MRI velocity data—Methods for data matching and CFD error quantification,” Comput. Biol. Med. 131, 104230 (2021). 10.1016/j.compbiomed.2021.104230 [DOI] [PubMed] [Google Scholar]
- 36. Liou T. M. and Liou S. N., “ A review on in vitro studies of hemodynamic characteristics in terminal and lateral aneurysm models,” Proc. Natl. Sci. Counc. Repub. China B 23(4), 133–148 (1999). [PubMed] [Google Scholar]
- 37. Epshtein M. and Korin N., “ Computational and experimental investigation of particulate matter deposition in cerebral side aneurysms,” J. R. Soc. Interface 17(169), 20200510 (2020). 10.1098/rsif.2020.0510 [DOI] [PMC free article] [PubMed] [Google Scholar]
- 38. Paliwal N., Damiano R. J., Varble N. A., Tutino V. M., Dou Z., Siddiqui A. H., and Meng H., “ Methodology for computational fluid dynamic validation for medical use: Application to intracranial aneurysm,” J. Biomech. Eng. 139(12), 121004 (2017). 10.1115/1.4037792 [DOI] [PMC free article] [PubMed] [Google Scholar]
- 39. Perera R., Isoda H., Ishiguro K., Mizuno T., Takehara Y., Terada M., Tanoi C., Naito T., Sakahara H., Hiramatsu H., Namba H., Izumi T., Wakabayashi T., Kosugi T., Onishi Y., Alley M., Komori Y., Ikeda M., and Naganawa S., “ Magnetic resonance in medical sciences,” Jpn. Soc. Magn. Reson. Med. Sci. 19(4), 333 (2020). 10.2463/mrms.mp.2019-0107 [DOI] [PMC free article] [PubMed] [Google Scholar]
- 40. Xu L., Sugawara M., Tanaka G., Ohta M., Liu H., and Yamaguchi R., “ Effect of elasticity on wall shear stress inside cerebral aneurysm at anterior cerebral artery,” Technol. Health Care 24, 349–357 (2016). 10.3233/THC-161135 [DOI] [PubMed] [Google Scholar]
- 41. Nowicki K. W., Hosaka K., He Y., McFetridge P. S., Scott E. W., and Hoh B. L., “ Novel high-throughput in vitro model for identifying hemodynamic-induced inflammatory mediators of cerebral aneurysm formation,” Hypertension 64(6), 1306–1313 (2014). 10.1161/HYPERTENSIONAHA.114.03775 [DOI] [PMC free article] [PubMed] [Google Scholar]
- 42. Hoi Y., Woodward S. H., Kim M., Taulbee D. B., and Meng H., “ Validation of CFD simulations of cerebral aneurysms with implication of geometric variations,” J. Biomech. Eng. 128(6), 844–851 (2006). 10.1115/1.2354209 [DOI] [PMC free article] [PubMed] [Google Scholar]
- 43. Gijsen F. J. H., van de Vosse F. N., and Janssen J. D., “ The influence of the non-Newtonian properties of blood on the flow in large arteries: Steady flow in a carotid bifurcation model,” J. Biomech. 32(6), 601–608 (1999). 10.1016/S0021-9290(99)00015-9 [DOI] [PubMed] [Google Scholar]
- 44. Wei Z., Singh-Gryzbon S., Trusty P. M., Huddleston C., Zhang Y., Fogel M. A., Veneziani A., and Yoganathan A. P., “ Non-Newtonian effects on patient-specific modeling of fontan hemodynamics,” Ann. Biomed. Eng. 48(8), 2204–2217 (2020). 10.1007/s10439-020-02527-8 [DOI] [PMC free article] [PubMed] [Google Scholar]
- 45. Wei H., Cheng A. L., and Pahlevan N. M., “ On the significance of blood flow shear-rate-dependency in modeling of fontan hemodynamics,” Eur. J. Mech. -B/Fluids 84, 1–14 (2020). 10.1016/j.euromechflu.2020.05.011 [DOI] [Google Scholar]
- 46. Ashraf F. and Park C. W., “ Fluid–structure interaction analysis of non-Newtonian Herschel–Bulkley fluid viscosity model for pulsating flow of blood in ω-shaped stenosed arteries,” Korea-Aust. Rheol. J. 34(1), 51–67 (2022). 10.1007/s13367-022-00025-y [DOI] [Google Scholar]
- 47. Hong H., Song J. M., and Yeom E., “ Variations in pulsatile flow around stenosed microchannel depending on viscosity,” PLoS One 14(1), e0210993 (2019). 10.1371/journal.pone.0210993 [DOI] [PMC free article] [PubMed] [Google Scholar]
- 48. Cheng A. L., Wee C. P., Pahlevan N. M., and Wood J. C., “ A 4D flow MRI evaluation of the impact of shear-dependent fluid viscosity on in vitro Fontan circulation flow,” Am. J. Physiol. Heart Circ. Physiol. 317(6), H1243–H1253 (2019). 10.1152/ajpheart.00296.2019 [DOI] [PMC free article] [PubMed] [Google Scholar]
- 49. Cheng A. L., Pahlevan N. M., Rinderknecht D. G., Wood J. C., and Gharib M., “ Experimental investigation of the effect of non-Newtonian behavior of blood flow in the Fontan circulation,” Eur. J. Mech. -B/Fluids 68, 184–192 (2018). 10.1016/j.euromechflu.2017.12.009 [DOI] [PMC free article] [PubMed] [Google Scholar]
- 50. Samaee M., Nooraeen A., Tafazzoli-Shadpour M., and Taghizadeh H., “ A comparison of Newtonian and non-Newtonian pulsatile blood rheology in carotid bifurcation through fluid–solid interaction hemodynamic assessment based on experimental data,” Phys. Fluids 34(7), 071902 (2022). 10.1063/5.0094656 [DOI] [Google Scholar]
- 51. Kannojiya V., Das A. K., and Das P. K., “ Simulation of blood as fluid: A review from rheological aspects,” IEEE Rev. Biomed. Eng. 14, 327–341 (2021). 10.1109/RBME.2020.3011182 [DOI] [PubMed] [Google Scholar]
- 52. Mahrous S. A., Che Sidik N. A., and Saqr K. M., “ Newtonian and non-Newtonian CFD models of intracranial aneurysm: A review,” CFD Lett. 12(1), 62–86 (2021), available at https://akademiabaru.com/submit/index.php/cfdl/article/view/3131. [Google Scholar]
- 53. Valencia A., Zárate A., Gálvez M., and Badilla L., “ Non-Newtonian blood flow dynamics in a right internal carotid artery with a saccular aneurysm,” Int. J. Numer. Methods Fluids 50, 751 (2006). 10.1002/fld.1078 [DOI] [Google Scholar]
- 54. Rayz V. L., Boussel L., Lawton M. T., Acevedo-Bolton G., Ge L., Young W. L., Higashida R. T., and Saloner D., “ Numerical modeling of the flow in intracranial aneurysms: Prediction of regions prone to thrombus formation,” Ann. Biomed. Eng. 36(11), 1793 (2008). 10.1007/s10439-008-9561-5 [DOI] [PMC free article] [PubMed] [Google Scholar]
- 55. Bernsdorf J. and Wang D., “ Non-Newtonian blood flow simulation in cerebral aneurysms,” Comput. Math. Appl. 58(5), 1024–1029 (2009). 10.1016/j.camwa.2009.02.019 [DOI] [Google Scholar]
- 56. Xiang J., Tremmel M., Kolega J., Levy E. I., Natarajan S. K., and Meng H., “ Newtonian viscosity model could overestimate wall shear stress in intracranial aneurysm domes and underestimate rupture risk,” J. NeuroInterventional Surg. 4(5), 351–357 (2012). 10.1136/neurintsurg-2011-010089 [DOI] [PubMed] [Google Scholar]
- 57. Sugiyama S.-I., Endo H., Niizuma K., Endo T., Funamoto K., Ohta M., and Tominaga T., “ Computational hemodynamic analysis for the diagnosis of atherosclerotic changes in intracranial aneurysms: A proof-of-concept study using 3 cases harboring atherosclerotic and nonatherosclerotic aneurysms simultaneously,” Comput. Math. Methods Med. 2016, 2386031. 10.1155/2016/2386031 [DOI] [PMC free article] [PubMed] [Google Scholar]
- 58. Suzuki T., Takao H., Suzuki T., Suzuki T., Masuda S., Dahmani C., Watanabe M., Mamori H., Ishibashi T., Yamamoto H., Yamamoto M., and Murayama Y., “ Variability of hemodynamic parameters using the common viscosity assumption in a computational fluid dynamics analysis of intracranial aneurysms,” Technol. Health Care 25, 37–47 (2017). 10.3233/THC-161245 [DOI] [PubMed] [Google Scholar]
- 59. Ba D., Zhu Z., Yue X., Xu P., Yan P., and Xiao D., “ Computational fluid dynamics analysis of carotid–ophthalmic aneurysms with concomitant ophthalmic artery infundibulum in a patient-specific model,” World Neurosurg. 125, e1023–e1033 (2019). 10.1016/j.wneu.2019.02.002 [DOI] [PubMed] [Google Scholar]
- 60. Lauric A., Hippelheuser J. E., and Malek A. M., “ Induction of aneurysmogenic high positive wall shear stress gradient by wide angle at cerebral bifurcations, independent of flow rate,” J. Neurosurg. 131(2), 442–452 (2019). 10.3171/2018.3.JNS173128 [DOI] [PubMed] [Google Scholar]
- 61. Saqr K. M., “ Computational fluid dynamics simulations of cerebral aneurysm using Newtonian, power-law and quasi-mechanistic blood viscosity models,” Proc. Inst. Mech. Eng., Part H 234(7), 711–719 (2020). 10.1177/0954411920917531 [DOI] [PubMed] [Google Scholar]
- 62. Tripathi J., Vasu B., Bég O. A., Gorla R. S. R., and Kameswaran P. K., “ Computational simulation of rheological blood flow containing hybrid nanoparticles in an inclined catheterized artery with stenotic, aneurysmal and slip effects,” Comput. Biol. Med. 139, 105009 (2021). 10.1016/j.compbiomed.2021.105009 [DOI] [PubMed] [Google Scholar]
- 63. Frolov S. V., Sindeev S. V., Liepsch D., and Balasso A., “ Experimental and CFD flow studies in an intracranial aneurysm model with Newtonian and non-Newtonian fluids,” Technol. Health Care 24, 317–333 (2016). 10.3233/THC-161132 [DOI] [PubMed] [Google Scholar]
- 64. Tupin S., Saqr K. M., Rashad S., Niizuma K., Ohta M., and Tominaga T., arXiv:2001.08234 (2020).
- 65. Saqr K. M., Tupin S., Rashad S., Endo T., Niizuma K., Tominaga T., and Ohta M., “ Physiologic blood flow is turbulent,” Sci. Rep. 10(1), 15492 (2020). 10.1038/s41598-020-72309-8 [DOI] [PMC free article] [PubMed] [Google Scholar]
- 66. Valen-Sendstad K., Mardal K.-A., Mortensen M., Reif B. A. P., and Langtangen H. P., “ Direct numerical simulation of transitional flow in a patient-specific intracranial aneurysm,” J. Biomech. 44(16), 2826–2832 (2011). 10.1016/j.jbiomech.2011.08.015 [DOI] [PubMed] [Google Scholar]
- 67. Jain K., Jiang J., Strother C., and Mardal K. A., “ Transitional hemodynamics in intracranial aneurysms—Comparative velocity investigations with high resolution lattice Boltzmann simulations, normal resolution ANSYS simulations, and MR imaging,” Med. Phys. 43(11), 6186–6198 (2016). 10.1118/1.4964793 [DOI] [PubMed] [Google Scholar]
- 68. Yu H., Huang G. P., Yang Z., and Ludwig B. R., “ Numerical studies of hemodynamic alterations in pre- and post-stenting cerebral aneurysms using a multiscale modeling,” Int. J. Numer. Methods Biomed. Eng. 35(11), e3256 (2019). 10.1002/cnm.3256 [DOI] [PubMed] [Google Scholar]
- 69. Yang Z., Yu H., Huang P., and Schwieterman R., “Computational fluid dynamics simulation of intracranial aneurysms–comparing size and shape,” J. Coast. Life Med. 3(3), 245–252 (2015). 10.12980/JCLM.3.201514JCLM-2015-0004 [DOI] [Google Scholar]
- 70.“The study of internal carotid artery sidewall aneurysms using an experimentally validated computational fluid dynamics model,” in 47th Dayton-Cincinnati Aerospace Sciences Symposium (DCASS) (AIAA Dayton-Cincinnati Section, 2022), available at https://www.aiaa-daycin.org/DCASS/list_abs.php.
- 71. Yi H., Yang Z., Johnson M., Bramlage L., and Ludwig B., “ Experimental and numerical investigations on hemodynamic characteristics in an internal cerebral artery sidewall aneurysm model using non-Newtonian blood analogue fluids,” in 2022 Spring Meeting of the APS Eastern Great Lakes Section Meeting (American Physical Society, 2022), Vol. 67, No. 4, available at https://meetings.aps.org/Meeting/EGLSS22/Session/E02.5.
- 72. Yi H., Johnson M., Bramlage L. C., Ludwig B., and Yang Z., “ Effects of pulsatile flow rate and shunt ratio in bifurcated distal arteries on hemodynamic characteristics involved in two patient-specific internal carotid artery sidewall aneurysms: A numerical study,” Bioengineering 9(7), 326 (2022). 10.3390/bioengineering9070326 [DOI] [PMC free article] [PubMed] [Google Scholar]
- 73. Chien S., Usami S., Taylor H. M., Lundberg J. L., and Gregersen M. I., “ Effects of hematocrit and plasma proteins on human blood rheology at low shear rates,” J. Appl. Physiol. 21(1), 81–87 (1966). 10.1152/jappl.1966.21.1.81 [DOI] [PubMed] [Google Scholar]
- 74. Ackroyd N., Gill R., Griffiths K., Kossoff G., and Appleberg M., “ Quantitative common carotid artery blood flow: Prediction of internal carotid artery stenosis,” J. Vasc. Surg. 3(6), 846–853 (1986). 10.1016/0741-5214(86)90148-5 [DOI] [PubMed] [Google Scholar]
- 75. Daibo M., paper presented at the 2017 Eleventh International Conference on Sensing Technology (ICST) (2017).
- 76. Hu P., Cai C., Yi H., Zhao J., Feng Y., and Wang Q., “ Aiding airway obstruction diagnosis with computational fluid dynamics and convolutional neural network: A new perspective and numerical case study,” J. Fluids Eng. 144(8), 081206 (2022). 10.1115/1.4053651 [DOI] [Google Scholar]
- 77. Menter F. R., Langtry R., and Völker S., “ Transition modelling for general purpose CFD codes,” Flow Turbul. Combust. 77(1), 277–303 (2006). 10.1007/s10494-006-9047-1 [DOI] [Google Scholar]
- 78. Menter F. R., “ Two-equation eddy-viscosity turbulence models for engineering applications,” AIAA J. 32(8), 1598–1605 (1994). 10.2514/3.12149 [DOI] [Google Scholar]
- 79. Gomez-Miguel R., in Recent Advances in Multidisciplinary Applied Physics, edited by Méndez-Vilas A. ( Elsevier Science, Ltd., Oxford, 2005), pp. 223–227. [Google Scholar]
- 80. Wilcox D. C., “ Simulation of transition with a two-equation turbulence model,” AIAA J. 32(2), 247–255 (1994). 10.2514/3.59994 [DOI] [Google Scholar]
- 81. Pond W. G. and Houpt K. A., The Biology of the Pig, 1st ed. (Cornell University Press, 1978), 352 pp., ISBN: 9780801411373.
- 82. Jandl J. H., Blood: Textbook of Hematology ( Little, Brown Medical Division, 1987). [Google Scholar]
- 83. Sondeen J. L., de Guzman R., Amy Polykratis I., Prince M. D., Hernandez O., Cap A. P., and Dubick M. A., “ Comparison between human and porcine thromboelastograph parameters in response to ex-vivo changes to platelets, plasma, and red blood cells,” Blood Coagulation Fibrinolysis 24(8), 818–829 (2013). 10.1097/MBC.0b013e3283646600 [DOI] [PubMed] [Google Scholar]
- 84. Laurent A., Durussel J. J., Dufaux J., Penhouët L., Bailly A. L., Bonneau M., and Merland J. J., “ Effects of contrast media on blood rheology: Comparison in humans, pigs, and sheep,” Cardiovasc. Intervention Radiol. 22(1), 62–66 (1999). 10.1007/s002709900330 [DOI] [PubMed] [Google Scholar]
- 85. Ecker P., Sparer A., Lukitsch B., Elenkov M., Seltenhammer M., Crevenna R., Gföhler M., Harasek M., and Windberger U., “ Animal blood in translational research: How to adjust animal blood viscosity to the human standard,” Physiol. Rep. 9(10), e14880 (2021). 10.14814/phy2.14880 [DOI] [PMC free article] [PubMed] [Google Scholar]
- 86. Gutmann F. and Simmons L. M., “ The temperature dependence of the viscosity of liquids,” J. Appl. Phys. 23(9), 977–978 (1952). 10.1063/1.1702361 [DOI] [Google Scholar]
- 87. Tajima Y. A. and Crozier D. G., “ Chemorheology of an amine-cured epoxy resin,” Polym. Eng. Sci. 26(6), 427–431 (1986). 10.1002/pen.760260609 [DOI] [Google Scholar]
- 88. Roller M. B., “ Rheology of curing thermosets: A review,” Polym. Eng. Sci. 26(6), 432–440 (1986). 10.1002/pen.760260610 [DOI] [Google Scholar]
- 89. Tanner R. I., Engineering Rheology ( Oxford University Press, Oxford, 2000). [Google Scholar]
- 90. el Gibaly A., El-Bassiouny O., Shehata O., Hassan T., and Saqr K., “ Effects of non-Newtonian viscosity on the hemodynamics of cerebral aneurysms,” Appl. Mech. Mater. 819, 366–370 (2014). 10.4028/www.scientific.net/AMM.819.366 [DOI] [Google Scholar]
- 91. Bernhardt T., Semmler M. L., Schäfer M., Bekeschus S., Emmert S., and Boeckmann L., “ Plasma medicine: Applications of cold atmospheric pressure plasma in dermatology,” Oxid. Med. Cell. Longevity 2019, 3873928. 10.1155/2019/3873928 [DOI] [PMC free article] [PubMed] [Google Scholar]
- 92. Duarte S. and Panariello B. H. D., “ Comprehensive biomedical applications of low temperature plasmas,” Arch. Biochem. Biophys. 693, 108560 (2020). 10.1016/j.abb.2020.108560 [DOI] [PMC free article] [PubMed] [Google Scholar]
- 93. Brookshier K. A. and Tarbell J. M., “ Evaluation of a transparent blood analog fluid: Aqueous xanthan gum/glycerin,” Biorheology 30, 107–116 (1993). 10.3233/BIR-1993-30202 [DOI] [PubMed] [Google Scholar]
- 94. Holzapfel G. A., Gasser T. C., and Ogden R. W., “ A new constitutive framework for arterial wall mechanics and a comparative study of material models,” J. Elast. Phys. Sci. Solids 61(1), 1–48 (2000). 10.1023/A:1010835316564 [DOI] [Google Scholar]
- 95. Failer L., Minakowski P., and Richter T., “ On the impact of fluid structure interaction in blood flow simulations,” Vietnam J. Math. 49(1), 169–187 (2021). 10.1007/s10013-020-00456-6 [DOI] [Google Scholar]
Associated Data
This section collects any data citations, data availability statements, or supplementary materials included in this article.
Supplementary Materials
See the supplementary online material for the complete derivation process of the non-Newtonian blood viscosity model dependent on shear rates and temperatures, and the detailed hemodynamic parameter definitions for comparisons between Newtonian and non-Newtonian models.
Data Availability Statement
The data that support the findings of this study are available from the corresponding author upon reasonable request.


