

1. Introduction
The 1990 Clean Air Act Amendments (CAAA) launched a new era in environmental protection. New provisions created the innovative Acid Rain Program to curtail acid-rain-causing emissions from the electric power sector through an allowance trading program. The U.S. Environmental Protection Agency’s (EPA) success implementing this new type of program led to its expanded use to achieve additional reductions in support of the “Good Neighbor” requirements. A core element of the Good Neighbor provisions stipulate how the EPA and states must address interstate transport of air pollution that affects downwind states’ ability to attain and maintain National Ambient Air Quality Standards (NAAQS), particularly ozone and fine particulate matter (PM2.5). Since the passage of the 1990 CAAA, the allowance trading programs that have evolved to address interstate transport, coupled with the Acid Rain Program, have significantly affected air quality management, reduced power sector emissions, and improved human health and the environment in the United States.
In the 30 years since passage of the CAAA, air pollution has decreased dramatically. Annual sulfur dioxide (SO2) emissions from power plants decreased by 94 percent from 1990 to 2019 and annual emissions of nitrogen oxides (NOX) from power plants fell 86 percent (US EPA, 2020a). In 2019, reported annual SO2 and NOX emissions from power plants were below 1 million tons for the first time in modern history (US EPA 2020a; US EPA, 1994). National average SO2 annual mean ambient concentrations declined 91 percent between 1990 and 2018, and regional ambient particulate sulfate concentrations decreased 47 to 81 percent from the 1989–1991 period to the 2016–2018 period (US EPA, 2019). All areas of the eastern U.S. have shown significant improvement in wet sulfur deposition with an overall 66 percent reduction from 2000–2002 to 2016–2018. Additionally, between these same time intervals, there was an overall regional reduction of 19 percent in the highest (99th percentile) ozone concentrations levels in the eastern U.S. (US EPA, 2018).
Implementation of power plant regulations under the acid rain and interstate transport provisions of the CAAA provides insights into the efficacy of legislative versus regulatory policy and holds valuable lessons for future policy endeavors of either variety. Here we examine two of the major air quality problems the CAAA were meant to tackle – acid rain and interstate transport of air pollution affecting the ability of states to attain and maintain the NAAQS. We then examine the implementation of two separate provisions included in the CAAA to address these problems, Title IV and relevant provisions in Section 110 of Title I, and the way in which their intertwined implementation led to the evolution of air quality policy and contributed to significant changes in the power sector. Finally, we turn to results of the power sector control programs developed under these provisions and lessons learned for the future.
2. History
2.1. Large-Scale Regional Pollution Problems
2.1.1. Acid Rain
Acid deposition or “acid rain” occurs when emissions of SO2 and NOX in the atmosphere react with water, oxygen, and oxidants to form mild solutions of sulfuric acid or nitric acid. These compounds fall to the Earth in either wet form (e.g., rain, snow, fog) or dry form (e.g., particles, gases). In the U.S., the issue of acidic deposition emerged in the early 1970s (Likens et al., 1972). While scientific knowledge of ecosystem acidification dates to the mid-18th century, and significant research had been undertaken in the first half of the 20th century (Gorham, 1998), relatively little was known about the magnitude and distribution of acidic deposition, nor about its effects on terrestrial and aquatic ecosystems. However, many researchers believed that acidic deposition and its air pollutant precursors posed a potential threat to forests, aquatic organisms, crops, structures and cultural artifacts, and even human health.
Following a decade of ground-breaking research, funded at $570 million, the National Acid Precipitation Assessment Program (NAPAP) documented a causal link between emissions of SO2 and NOX, increases in the atmospheric concentration of these pollutants, and “acid rain” (NAPAP, 1991). In the years since the 1991 NAPAP report, a growing body of literature has gone on to link wet and dry acidic deposition, and the emissions that produce them, to surface water acidification, declining aquatic ecosystem health, depletion of forest soil nutrients and the declining health of some tree species, damage to architectural structures and cultural resources, adverse effects on human health, and increased regional haze and reduced visibility (Driscoll et al., 2001; NAPAP, 2011).
The CAAA Title IV authorized creation of the Acid Deposition Control Program, commonly known as the Acid Rain Program (ARP), to reduce the adverse effects of acidic deposition through phased reductions of annual emissions of its precursors, SO2 and NOX. In a novel development, Title IV specifically focused on ecosystem protection as opposed to effects on human health. At the time, there was no accepted protocol for valuing ecosystem improvements. As a result, EPA’s Regulatory Impact Analysis (RIA) for the Final Acid Rain Implementation Regulations notably found no quantifiable benefits of implementing the ARP, stating instead that the “regulations examined in the RIA are not expected to provide environmental benefits” (ICF Resources Incorporated, 1992). In practice, the results turned out quite differently and emission reductions to protect ecosystems yielded large human health co-benefits. Studies have shown the human health and environmental benefits of lower SO2 and NOX emissions has far outweighed both the substantial acid rain reduction and the overall relatively low cost to achieve the reductions. (Chestnut and Mills, 2005; NAPAP, 2011; Schmalensee and Stavins, 2017).
2.1.2. Interstate Transport of Air Pollution
Interstate air pollution transport refers to pollution from upwind emission sources in one state affecting the air quality in a downwind state. Emissions of SO2 and NOX from upwind sources can undergo chemical reactions in the atmosphere to form PM2.5 pollution. Similarly, NOX emissions can react in the atmosphere to create ground-level ozone pollution. These pollutants can travel great distances (i.e., hundreds of miles), affecting air quality and public health regionally.
The transport of these pollutants across state borders can make it difficult for NAAQS nonattainment areas in downwind states to meet health-based air quality standards for PM2.5 and ozone. Congress recognized the regional nature of pollution and included several different provisions in the CAA and the 1990 Amendments, including creation of the Ozone Transport Commission (OTC) to facilitate regional coordination across 12 Northeast states and the District of Columbia, the ability for downwind states to petition EPA to control upwind emissions, and requirements that every state evaluate whether its emissions affect another state each time EPA updates a NAAQS.
The CAAA’s Title I Section 110(a)(2)(D)(i)(I) “Good Neighbor” provision requires states to prohibit emissions that contribute significantly to nonattainment in, or interfere with maintenance by, any other state with respect to any NAAQS. However, the provision does not define what it means to “contribute significantly”, so EPA and states have had to provide that meaning. For every revision of the ozone NAAQS, regulatory authorities (states or EPA) must identify areas that are expected to have ongoing nonattainment. Next, authorities conduct air quality analyses to determine whether other states are contributing to ongoing nonattainment. If other states are part of the problem, the next step is to perform an evaluation weighing potential emission reductions, associated costs, air quality benefits, and other relevant factors to determine if additional emission reductions from contributing areas should be required. Contingent upon the outcome of this analysis, rules are crafted to require additional reductions. The mechanism of choice to achieve these reductions has been an allowance trading program under a constrained emissions budget. Both the EPA and states have implemented such programs under the Good Neighbor provision to regulate power plant emissions of SO2, NOX, and the resulting PM2.5 and ozone, that contribute significantly to nonattainment and interfere with maintenance of the PM2.5 and ozone NAAQS. The success of the Acid Rain Program in achieving large reductions at relatively low costs had an important influence on the initial application of allowance trading to achieve reductions under the Good Neighbor provision.
2.2. Large-Scale Regional Policy Solution
In passing the CAAA, Congress chose to use a novel environmental management approach known as cap-and-trade, or “allowance trading” to address the acid rain problem. Through subsequent regulations, EPA expanded the use of this tool to address the persistent problem of interstate transport of air pollution affecting states’ ability to attain and maintain the PM2.5 and ozone NAAQS. Allowance trading is a departure from more traditional “command-and-control” regulatory approaches in which the government requires individual plants to install specific control technologies to reduce pollution, regardless of varying costs of controls among the plants. Because allowance trading sets an overall emission limit across a group of plants, but provides firms with the flexibility to determine how and where to reduce pollution, emissions can be reduced more cost effectively and with less administrative burden than through a more traditional regulatory regime. This approach enables regulations to set more ambitious emission reduction goals than would otherwise be possible with command-and-control regulations, while imposing the same or lower costs to society. The goal of these programs is to achieve broad regional reductions, complementing state and local efforts to address local air quality concerns. A timeline of allowance trading programs can be seen in Figure 1.
Figure 1:

A timeline of relevant allowance trading programs covered in this paper.
Allowance trading programs have two key components: a limit (or cap) on total pollution from a group of sources, and tradable allowances equal to the cap, authorizing allowance holders to emit a specific quantity (e.g., one ton) of a pollutant. The limit ensures that the environmental goal is met and sustained, regardless of growth in the number of pollution sources or increases in power generation. The limit applies across all sources collectively, and no source has a limit on its individual emissions. Tradable allowances, with the ability to bank unused allowances for compliance in a future year, provide flexibility for individual sources to determine their own compliance path. Because allowances can be bought and sold in an allowance market, these programs are often referred to as “market-based.” Sources must completely and accurately measure and report all emissions and then hold sufficient allowances to cover emissions at the end of the compliance period. These allowances are then removed from the market and are not available for use by other sources in that period or future periods. Should a source fail to hold sufficient allowances, automatic monetary and- possible allowance penalties apply. This provides a strong and direct incentive favoring compliance and ensures that any excess emissions are automatically offset by future reductions.
2.3. Evolution of Power Sector Emission Reduction Programs
2.3.1. Acid Rain Program
Title IV of the CAAA, which marked the culmination of years of research and policy negotiations, very clearly laid out the framework for the SO2 allowance trading program, down to the criteria for allowance allocation and penalties for noncompliance. NOX reductions under the ARP were based on a more traditional rate-based regulatory requirement. The ARP was implemented in two phases: Phase I began in 1995 (1996 for NOX) and Phase II began in 2000. The first phase included the largest, highest emitting coal-fired units, primarily in the Eastern U.S., while the second phase expanded coverage to smaller coal-fired units, as well as oil and gas units in the 48 contiguous states.
Under the ARP, in accordance with the statute, EPA interacted with sources directly. This marked a significant departure from the traditional cooperative federalism approach where state agencies typically interact with emitting facilities more often than EPA does. Affected sources reported directly to EPA, and compliance determination involved a simple comparison of emissions with allowance holdings, also tracked by EPA. This relatively novel direct interaction between EPA and regulated sources significantly contributed to the program’s success, in part due to the relationships forged between stakeholder and regulator through extended engagement during the creation of implementing regulations for the ARP. EPA also relied heavily on the Acid Rain Advisory Committee (ARAC), created under the Federal Advisory Committee Act (FACA) and consisting of a large and diverse group of affected stakeholders including large and small power generators, state environmental agencies and utility commissions, environmental groups, coal and gas interests, and academia. ARAC began meeting soon after the legislation was enacted and worked collaboratively to help interpret the provisions in the Act and draft the implementing regulations. This committee was instrumental in EPA’s implementation efforts, informing regulations with their unique insights and expertise through active development and consideration of regulatory options and identification of potential problems. ARAC also helped familiarize other stakeholders to this novel approach to regulation and advocated for its success (Claussen, 2001; McLean, 1997; US EPA, 1992).
Because the ultimate goal of the ARP was ecosystem protection, the primary focus of the program was to reduce deposition of sulfur and nitrogen species, rather than to reduce atmospheric concentrations of pollutants. While the protection of public health is the main driver of most CAAA provisions, it ultimately became an unanticipated co-benefit of the ARP. The broad regional reductions pursued – and achieved – under Title IV dramatically lowered atmospheric concentrations of pollutants.
2.3.2. OTC NOX Budget Program
The early success of the ARP prompted widespread interest in allowance trading approaches. By the early 1990s, the latest science indicated that addressing persistent high ambient ozone levels might require NOX emission reductions (National Research Council, 1991), and allowance trading emerged as a promising mechanism to address this air quality problem. Northeastern states, as part of the CAAA-established Ozone Transport Commission, worked with EPA to develop and implement a multi-state allowance trading program to reduce regional transport of ozone season NOX emissions that contribute to ozone nonattainment in other states. The OTC NOX Budget Program began in 1999. By 2002, in conjunction with previous requirements, the program reduced ozone season emissions approximately 60 percent below 1990 baseline levels, well under target levels. Deep reductions occurred in all states across the region and daily peak emissions declined (US EPA, 2003). This promising application of allowance trading to a new environmental challenge further heightened interest in this relatively new policy tool and stimulated international interest in the approach and how it might apply to air quality and climate change challenges abroad.
2.3.3. SIP Call NOX Budget Trading Program
Also during this time, EPA established the Ozone Transport Assessment Group (OTAG), a coalition of 37 states, industry, and environmental groups, to assess and recommend strategies to reduce the transport of ozone in the Northeast. The “NOX SIP Call” incorporated OTAG recommendations, including the use of allowance trading to achieve regional NOX emission reductions from power plants (Availability of Documents for the Rulemaking for Certain States in the Ozone Transport Assessment Group Region, 1998). The NOX SIP Call required states in the eastern U.S. to submit state implementation plans (SIPs) detailing how they would curtail emissions that were impeding the ability of other states in the region to attain, or maintain attainment with, the ozone NAAQS. The NOX SIP Call affected 21 jurisdictions (20 states plus the District of Columbia), and set state-level ozone-season (May 1 – September 30) NOX emission budgets to achieve the needed reductions. EPA created a model regional allowance trading program that states could choose to adopt to meet the emissions targets and that EPA would administer. All affected states chose to adopt the model allowance trading rule and participate in the NOX Budget Trading Program (NBTP), which operated during the 2003–2008 ozone seasons.
The NBTP differed from the ARP in multiple ways, including the narrowed regional focus and expanded applicability beyond the electric power sector to certain large industrial boilers and combustion turbines. Air quality improvements were the main goal, while ecosystem benefits were secondary. The role of states and EPA regional offices (as distinct from EPA headquarters) increased due to the focus on NAAQS attainment and implementing CAAA Title I provisions, which designate states as the primary actors. States had a prominent role in program creation and implementation, including discretion over how allowances were distributed among sources. Finally, the NBTP was created via regulation, based on EPA’s interpretation of language found in CAAA Title I provisions. This absence of an extensive statutory basis for the NBTP led to litigation over EPA’s interpretation of the CAAA, resulting in program revisions that included delayed implementation and modified geography, but also supported EPA’s consideration of cost when determining needed reductions, which set an important precedent for future regulatory action.
2.3.4. Clean Air Interstate Rule
The administration of George W. Bush sought to address continued difficulties with ozone and PM2.5 NAAQS attainment through multi-pollutant legislation. The Bush administration’s proposed Clear Skies Act would have created allowance trading programs for NOX, SO2, and mercury. Other legislative proposals under consideration at the time also would have included a CO2 trading program (Parker and Blodgett, 2006). As a backstop for the Clear Skies legislative effort, which ultimately failed to win passage, the administration opted for a regulatory approach through the Clean Air Interstate Rule (CAIR), designed to be implemented through three separate allowance trading programs. The rule focused on reducing pollution that contributed to the formation of fine particulate matter year-round, and ozone in the summer months, to help states achieve the 1997 ozone and PM2.5 NAAQS. State emission budgets, derived from an overarching regional emission reduction goal, were required under three separate programs: an ozone-season NOX program to address ozone, and annual NOX and annual SO2 programs for fine particulate matter.
To simplify implementation and compliance, EPA integrated programs by requiring that existing ARP SO2 allowances be used for compliance with the CAIR SO2 requirement. To achieve the new, tighter emission caps, CAIR required the use of two ARP allowances for each ton of SO2 emitted under the CAIR SO2 program, effectively nesting a more stringent SO2 requirement inside the existing ARP requirement. The rule was issued in 2005 and the CAIR NOX ozone season and NOX annual programs began in 2009, replacing the NBTP, while the CAIR SO2 program began in 2010. As with the NBTP, litigation ensued and CAIR was remanded to EPA in 2008 with directions to replace it as rapidly as possible. Among other findings, the court reasoned that EPA could not require allowances created under Title IV to be used for compliance in a program under Title I (North Carolina v. EPA, 2008).
2.3.5. Cross-State Air Pollution Rule
In 2011, EPA replaced CAIR with the Cross-State Air Pollution Rule (CSAPR), continuing to rely on allowance trading programs to address the interstate transport of emissions from power plants while addressing the concerns in the CAIR court decision. After several years of litigation, CSAPR was implemented in two phases, with Phase I beginning in 2015 and Phase II in 2017. In CSAPR, EPA made a concerted effort to methodically and systematically outline a framework for determining emission reduction obligations under the Good Neighbor provision based on the approach used for both the NBTP and CAIR.
CSAPR’s trading programs include design features that responded to the Court’s ruling on CAIR, reflecting new constraints on EPA’s interpretation of the Good Neighbor provision. For example, state emission budgets under CSAPR were designed to reflect emission reductions linked to specific downwind receptors for which an upwind state significantly contributed to nonattainment and interference with maintenance of the NAAQS. As with CAIR, CSAPR included multiple allowance trading programs to address both seasonal ozone and annual PM2.5 concerns. In contrast to CAIR, however, CSAPR included additional sub-regional trading “groups” for the SO2 trading program. The trading groups reflect the differing stringency of SO2 reductions required to address significant contribution of pollution and the challenge of complying with the NAAQS for each state, and were included to ensure that state-level emission budgets were directly tied to downwind nonattainment receptors. In CSAPR Phase II, Group 1 states were required to make further reductions because there were continuing downwind air quality concerns, while CSAPR Group 2 SO2 state budgets remained at the same level.
Another new design feature -- an explicit response to the North Carolina decision noted above – was the assurance provisions, developed to help ensure the emission reductions required to eliminate significant contribution would occur within each state. The assurance provisions include a “variability limit” meant to account for the inherent variability in power sector operations and consequent variability in annual emissions, while still ensuring adequate reductions. If a state’s emissions exceed the state budget plus variability limits, EPA determines responsible sources and requires them to surrender additional allowances. These features added significant implementation complexity, but also demonstrated the flexibility inherent in allowance trading to adapt to meet changing needs.
2.3.6. Cross-State Air Pollution Rule Update
In 2016, EPA updated the CSAPR ozone season trading program by creating a new NOX ozone season trading group to help states attain the more stringent ozone NAAQS promulgated in 2008. One important feature of the CSAPR Update was to limit the use of the large bank of unused CSAPR ozone season program allowances that had accrued from reductions beyond levels required by the program. As total emissions fall below the program cap, a high volume of unused allowances can accrue, affecting the ability of a future program to achieve further emission reductions if the allowances retain their full value for compliance with the new program. The CSAPR Update included a one-time conversion ratio, whereby sources were issued one CSAPR Update allowance for every 3.278 banked CSAPR ozone season allowances. These new design elements further illustrate adaptability of allowance trading as an environmental policy mechanism evolving over time.
In the CSAPR Update rule, EPA reasoned that the required reductions were not necessarily all that would be needed to fully address the Good Neighbor obligations for the 2008 ozone NAAQS. In December 2018, EPA issued the CSAPR Close-Out rule, wherein additional analysis concluded that no further reductions were needed and that compliance with the CSAPR Update satisfied the Good Neighbor obligations. Both rules were challenged in court and decisions issued in 2019 took issue with EPA’s explanation of how attainment deadlines and evaluation of required reductions were considered in the two actions. The first decision (Wisconsin v. EPA, 2019) remanded the CSAPR Update to EPA for revision, and the second decision (New York v. EPA, 2019) vacated the CSAPR Close-Out rule. How EPA addresses the latest court rulings will likely open a new chapter in the evolution of regulatory programs to address power sector emissions.
3. Results of EPA’s Power Sector Emission Reduction Programs
3.1. Emission Reductions
Over the last twenty-five years, significant emission reductions have been achieved through allowance trading programs. In 1990, when the CAAA was signed, annual power sector emissions were 15.73 million tons of SO2 and 6.42 million tons of NOX. In the initial year of ARP in 1995, as a result of early compliance, emissions were 11.83 million tons of SO2 and 5.84 million tons of NOX. By 2005, before the implementation of CAIR, power sector emissions were down to 10.22 million tons of SO2, 3.63 million tons of annual NOX and 1.27 million tons of ozone season NOX. In 2019, after implementation of CAIR and CSAPR requirements, power sector emissions decreased to 969 thousand tons of SO2 (14.8 million tons and 94 percent below 1990 levels), annual NOX emissions were 877 thousand tons (down 5.5 million tons, or 86 percent, from 1990 levels), and ozone season NOX emissions were 390 thousand tons (2.3 million tons, or 85 percent, lower than 1990 levels). Emission trends are shown in Figures 2, 3, and 4 (US EPA, 2020a).
Figure 2.

Electricity generation and sulfur dioxide (SO2) emissions by covered sources from 1990-2019.
Figure 3.

Electricity generation and annual nitrogen oxide (NOX) emissions by covered sources from 1990-2019.
Figure 4.

Electricity generation and ozone season nitrogen oxides (NOX) emissions by covered sources from 1997-2019. 1990 emission levels are estimated as five twelfths of 1990 annual NOX emissions, as temporal distribution is not available.
3.2. Control Technology
The ARP and subsequent programs contributed to development of effective pollution controls, providing covered sources with a variety of control options to reduce SO2 and NOX emissions by creating competition among different technologies, leading to improvements and innovations in those technologies and, as a result, lower costs (Taylor, 2012; Ellerman, 2000). For control of SO2 emissions, sources could switch to lower sulfur coal or natural gas, apply flue gas desulfurization (FGD) technology, or shift generation from higher emitting units to lower emitting units at a plant or across their fleet. To reduce NOX emissions, sources could install advanced post-combustion controls that included selective catalytic reduction (SCR) or selective non-catalytic reduction (SNCR) technologies, or combustion controls such as low NOX burners and overfired air.
Controls on coal-fired power plants increased greatly from 2000 to 2019, as seen in Figures 5 and 6. FGDs, or advanced SO2 controls, were installed on 24% of operating coal capacity in 2000 and 82% in 2019. It is important to note that, starting in 2015, the Mercury and Air Toxics Standards (MATS), a regulatory program that did not involve allowance trading, also contributed to the installation of advanced SO2 controls. SCRs and SNCRs, advanced NOX controls, were installed on 4% of operating coal capacity in 2000 and 68% in 2019. Increases in installation of control technologies are evident across the nation in these two maps based on EPA data (US EPA, 2020a; US EPA, 2020b).
Figure 5:
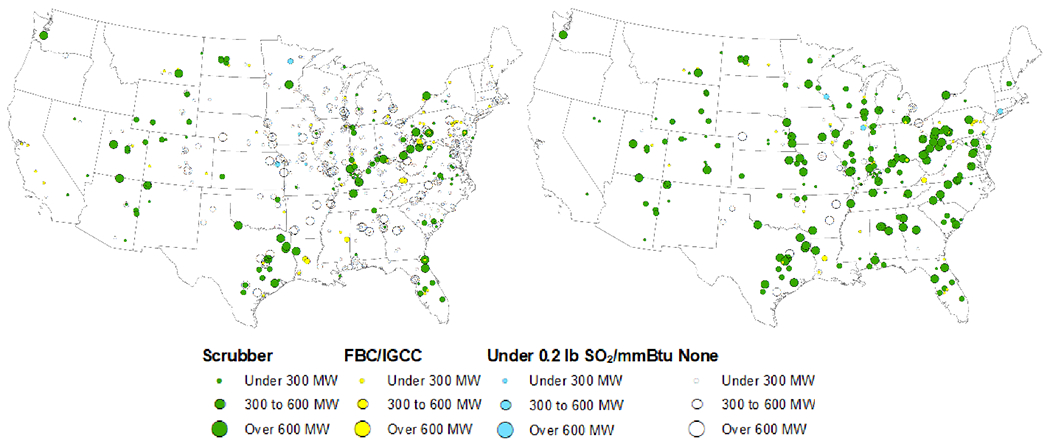
Map showing power plants using SO2 controls in 2000 (left) versus 2019 (right). Types of controls include flue-gas desulfurization or scrubbers, fluidized bed combustion (FBC), integrated gasification combined cycle (IGCC)
Figure 6:

Map showing power plants using NOX controls in 2000 (left) versus 2019 (right). Types of controls include selective catalytic reduction (SCR), selective non-catalytic reduction (SNCR), fluidized bed combustion (FBC), integrated gasification combined cycle (IGCC), and low-NOX burners (LNB).
3.3. Emission Monitoring
Market-based programs require accurate and comprehensive emission monitoring. For these programs, almost 4,000 fossil fuel-fired affected sources at power plants monitor, quality assure, and report SO2, NOX, and CO2 to EPA under 40 CFR Part 75. The largest emitters are required by regulation to have continuous stack emission monitors that are calibrated daily with NIST-traceable gases, and quality assured quarterly across the range of measurements. Once or twice a year, the frequency is determined by the results of the test, each monitor must be compared to a stack test using an EPA reference method.
At the end of each calendar quarter, each source must report detailed hourly emission and operations data. The reports must be complete and account for every hour of operation. The reporting regulation includes procedures for substituting data when monitors fail quality assurance tests or are unavailable. The monitoring regulations include certain flexibilities, such as less-costly measurement approaches for low emitters, built-in incentives for greater accuracy and completeness, and a petition process to accommodate unexpected situations. Each quarter, EPA performs extensive checks on the submitted data and periodically conducts on-site facility audits of the monitoring systems (Schakenbach et al, 2006).
The SO2 and NOX monitoring data are used for compliance. While CO2 data are not used for compliance with these allowance trading programs, the CAAA authorizes collection of CO2 emission data and they are also used in determining heat input and NOX emission rates. Collecting this comprehensive data set has been an invaluable feature of allowance trading programs. Most emissions are measured by continuous emission monitoring systems (CEMS). All data are posted and publicly available at the Air Markets Program Data (AMPD) website (US EPA, 2020a). In 2019, 99 percent of SO2 emissions, 98 percent of annual NOX emissions, and 97 percent of ozone season NOX emissions were monitored using CEMS technology, shown in Table 1.
Table 1.
Types of units monitoring with and without continuous emission monitoring systems (CEMS), by tons of pollutants emitted
| Monitoring Methodology | SO2 Emissions (tons) | NOX Mass (tons) | Ozone Season NOX Emissions (tons) |
|---|---|---|---|
| Coal with CEMS | 582,173 | 425,271 | 187,876 |
| Gas with CEMS | 229 | 47,727 | 62,597 |
| Gas without CEMS | 2,714 | 7,378 | 6,213 |
| Oil with CEMS | 465 | 1,046 | 708 |
| Oil without CEMS | 401 | 998 | 349 |
| Other with CEMS | 20,901 | 4,993 | 1,787 |
| Other without CEMS | 43 | 0 | 0 |
3.4. Environmental Effects
Accompanying papers in this special issue provide detailed analysis of environmental change over time in response to implementation of the ARP and subsequent allowance trading programs to address interstate transport of emissions. As such, we will note only high-level results. Three-year average concentrations for nitrate, sulfate, and ozone reflect rural air monitoring efforts. Rural is defined as 20 kilometers from major point sources, 50 kilometers from cities with a population greater than 50,000, and 2 kilometers from major highways. The aim of three-year averaging is to reduce effects of variability that occur between monitoring years.
Three-year average concentrations of ambient particulate sulfate in the eastern U.S. (east of 100 degrees west longitude) have decreased 47 to 81 percent in observed regions from the 1989-1991 period to the 2016-2018 period. Three-year average concentrations of ambient annual total nitrate in the eastern U.S. declined an average of 56 percent. Ambient SO2 concentrations measured at rural and urban sites across the contiguous U.S. decreased 93 percent between 1980 and 2018. From 2000-2002 and 2016-2018, three-year average concentrations for ozone declined 27 percent in states covered by CSAPR. Similar trends have been observed for total deposition of sulfur and nitrogen. Total sulfur deposition in the eastern U.S. decreased an average of 76 percent from the 2000-2002 period to the 2016-2018 period. Total nitrogen deposition has decreased an average of 29 percent for the same region and time period. Trends in surface water metrics, including sulfate anions, acid neutralizing capacity, and sum of base cations, show improvements in aquatic ecosystem health in most monitored lakes and streams in New England, the Adirondacks, and the Catskills mountains (USEPA, 2019).
4. Discussion
The power sector emission reduction programs described here arose under very different circumstances : the ARP was mandated under a precisely written statute to address a pressing ecological problem; on the other hand, the succession of NBTP/CAIR/CSAPR programs, which extended the allowance trading model to address pressing human health problems, were mandated by regulations stemming from a single broadly written requirement of the statute, and therefore subject to delays and changes resulting from legal challenges to EPA’s interpretation of the statute. The different circumstances governing this evolution have nonetheless produced programs that are similar in core design features, using allowance trading programs to require power sector emission reductions in a transparent, cost-effective manner. As such, together they provide useful lessons learned to inform the development of future air quality policy and emission reduction programs.
4.1. Legislation is More Certain than Regulation
One of the most important lessons from implementation of allowance trading programs under both Title IV and Title I is the value of a specific legislative mandate. Because the ARP SO2 control program had an explicit mandate in Title IV, and the legislative language is precise and comprehensive, implementation has been virtually free from litigation, with the notable exception of relatively minor challenges to certain implementing regulations. Additionally, the Title IV provisions created an added incentive for facilities not to litigate: should the program be delayed, they would risk being subject to source-by-source emissions limits generally similar to their allowance allocations, and lose the flexibility to comply using allowances purchased from other sources. This was significant because the flexibility inherent in an allowance trading program under a budget allowed Congress to pursue more significant reductions than otherwise thought feasible under a more traditional approach. In contrast to Title IV, as described earlier, each succeeding regulatory effort to design a regional allowance trading program grounded in the Good Neighbor provisions of CAAA Title I has been beset by litigation challenging administrative interpretation of statutory language. In each case, this litigation has led to significant delay, uncertainty for the affected sources, changes to the regulation and implementation, and constraints on subsequent programs. Of course, establishing a legislative mandate is not an easy task, as evident through the series of thwarted efforts to legislate federal allowance trading programs for power plant emission reductions in the late 1990s and early 2000s.
4.2. Stakeholders Belong at the Table
From the beginning of the ARP, EPA relied heavily on input from stakeholders – in the form of the ARAC – and this helped set the tone for the compliance partnerships that have continued over the last 25 years. This input extends beyond notice and comment rulemaking requirements, which provide an inherent and formal consideration of multiple perspectives, and has evolved over time as programs have grown and changed. Initial stakeholder interactions were focused on policy and regulatory development, but over time they have moved into compliance- and data analysis-oriented partnerships.
Following the early years of the ARP, the policy partnership approach continued in EPA’s collaboration with OTC state model rule development, followed by a robust stakeholder process from proposal through implementation for the NOX SIP Call’s NBTP that included multiple in-person meetings to discuss details of the program design to inform EPA’s proposal. Subsequently, EPA was able to build on input gathered in the public meetings on the Clear Skies and other multipollutant legislative proposals to develop CAIR.
When it came to the design of CSAPR programs, which were strongly influenced by court decisions, legal deadlines, and the formal regulatory notice and comment process, the stakeholder input that had so effectively informed early programs was more limited. However, stakeholders influenced – and continue to influence – design and implementation of these programs. EPA now focuses on helping to ensure that the emission reductions are achieved by making sure the regulated community has the resources it needs to successfully comply.
Outside of new program development, EPA interacts daily with many stakeholders through different actions—technical experts assist affected sources with questions about requirements; compliance reporting tools provide automatic quality assurance checks; and extensive web-based resources help sources understand and comply with requirements. Additionally, EPA partners with states in developing SIPs to meet their air quality goals and obligations. The daily interactions on the implementation side of the programs have helped shape programs over time (McAllister, 2007; Napolitano, 2007).
Despite these implementation partnership successes, interactions on the policy side have grown more difficult as control options become more expensive and the nature of emission sources and air quality effects have evolved over time. In a time of court orders with tight deadlines for the formal rule development process, EPA has faced increasing difficulty finding policy solutions that receive the widespread stakeholder support and consensus that early programs enjoyed, making broad stakeholder input all the more important.
4.3. Allowance Trading Programs Provide Accountability and Results
The allowance trading framework has proven flexible and resilient, despite the many external challenges from evolving circumstances and protracted litigation. Power plants have achieved dramatic cuts in the emissions that cause acid rain and harm public health with no evidence that hotspots, or areas of increased emissions, materialized, as some early observers feared (Swift, 2004; Ringquist, 2011). Most coal-fired electricity generation now comes from facilities with state-of-the-art emission controls. There is significant evidence that implementation of allowance trading programs prompted greater innovation and deployment of clean technologies that reduce emissions and control costs (Schmalensee and Stavins, 2017; Popp 2003; Bellas and Lange 2011; Swift, 2001).
The design of the programs lays the groundwork for success: comprehensive emission monitoring and timely reporting provides accountability and transparency; compliance determination is simple and directly ties to program goals; and penalties for non-compliance are automatic and non-negotiable. Observers have noted that the critical features of an allowance trading program are accurate and comprehensive measurement of emissions, and certain consequences for noncompliance (Swift, 2004; Siikamäki et al., 2012). Automatic penalties include financial penalties for ARP and, for subsequent programs, additional allowance surrender requirements that were intended to restore environmental gains and penalize non-compliance. As a result, each of the programs described in this paper has consistently seen near-complete compliance with very little need for enforcement actions. This is a noteworthy feat in the world of environmental regulations, and earned the Acid Rain Program distinction as “one of the most effective and efficient pollution reduction programs in EPA’s history” (Giles, 2020).
The reported data are posted on EPA’s website at the end of each calendar quarter reporting period, leading to program integrity and confidence (See https://ampd.epa.gov/ampd/). EPA has developed tools to allow data users to more easily access and understand the data (See https://www.epa.gov/airmarkets/data-resources). With continued progress in data analytic tools, EPA has evolved into an important resource for detailed data on the operations and associated emissions of the power sector.
Allowance trading is an effective tool for broad reductions and works in tandem with other CAAA requirements. For example, existing allowance trading programs have continued to deliver emissions reductions as additional programs undertaken under other CAAA provisions, such as MATS, delivered co-benefits by working to control toxic air pollutants. Recent research has found that potential regulatory efforts to control emissions, such as CO2, from the same power sector sources would deliver additional co-benefits in terms of criteria air pollution reductions when implemented alongside existing programs (Driscoll et al, 2015). In the case of the ARP and programs implemented under the Good Neighbor provision, regulatory efforts were intended to achieve broad regional emission reductions, but with somewhat different goals. As discussed, the ARP had the goal of reducing emissions to decrease the harmful ecological effects of atmospheric deposition. Good Neighbor programs were created to support attainment and maintenance of NAAQS by reducing regional emissions that significantly contribute to downwind air quality problems across state lines, rather than to achieve full attainment of the NAAQS outright. The allowance trading programs have effectively reduced regional emissions in ways states would have found difficult, if not impossible, to implement, and the resulting widespread improvement in overall air quality is evident across the region. Then, if needed, state and local governments, and EPA, can impose additional requirements to address remaining local air quality concerns.
4.4. Assessment and Communication are Foundational
Routine collection, tracking and communication of program data and environmental results are essential to program implementation and instilling public confidence. Under the right conditions, such data can inform future program development and lead to important changes. For example, the bank adjustment in the CSAPR Update was a direct result of tracking allowance activity and the size of the allowance bank and assessing the potential impact on program implementation and environmental results. The response was to build in a regulatory provision to reduce the bank to ensure achievement of the environmental goal.
In the case of the ARP, Congress built in an assessment mechanism by requiring NAPAP reports every four years – and the last report to Congress concluded that further reductions were necessary to achieve the Title IV ecosystem protection goals (NAPAP, 2011). However, Congress did not include the means to act on the assessment results. Because the emission goals were set by statute, assessment of air quality, atmospheric deposition, and ecological response could not yield further emission reduction requirements without Congressional action, and further mandated reductions failed to materialize in the face of the many obstacles inherent in amending a major statute. Ultimately, as this history of power sector programs shows, further emission reductions were achieved, but in response to public health drivers – the NAAQS – instead of assessments finding the Title IV cap levels were insufficient to meet the ecosystem protection goal of the ARP. As such, the ARP experience argues for including a means for implementing a dynamically adjusting cap in response to periodic assessments that have been used in other allowance trading programs like Regional Greenhouse Gas Initiative (RGGI), European Union Emissions Trading System (EU ETS), and California’s AB32 program (Narassimhan, 2018). While EPA has not employed dynamic caps to date, they could be considered for future programs.
4.5. Adaptability is Critical
Emission reduction programs should be designed to remain effective even under evolving circumstances. Experience with existing programs demonstrates two important realities: on the one hand, allowance trading programs have demonstrated sufficient flexibility to evolve in the face of new constraints and changing circumstances; on the other hand, in some cases, programs cannot adapt quickly enough to remain driving forces for emission reductions.
As evident in the progression from the ARP through CSAPR Update, allowance trading as an environmental policy mechanism has evolved over time. NOX emissions are now a primary focus as ambient ozone concentrations and attainment with the ozone NAAQS pose a persistent air quality concern. As allowance trading programs focused on NAAQS attainment under Title I have come to the forefront, the review and approval of SIPs has become a critical element of implementation. As such, the number of stakeholders has increased, along with the complexity of program design and implementation. With each new program and the seemingly inevitable litigation that follows, the elegant simplicity of the ARP recedes further into the past. For example, the court decision that remanded CAIR (North Carolina v. EPA, 2008) upended an approach in which a program could establish overall regional emission limits, instead requiring that each state emission budget must address specifically the downwind air quality effects to which an upwind state is linked. As a result, the CSAPR program included assurance provisions to help ensure that appropriate amounts of emission reductions occurred in each upwind state.
Subsequent allowance trading programs have also been designed with cognizance of the changing nature of the power sector. For example, one of the design features contributing to the environmental success of allowance trading programs was the possibility of banking allowances for future compliance. Consequently, emission reductions and environmental progress occurred earlier than otherwise would have been the case as firms prepared for future compliance requirements. Current economics favor natural gas and renewable energy over coal, resulting in much lower emissions. These unanticipated significant additional reductions created increasingly large allowance banks and led directly to the bank conversion in the CSAPR Update to ensure a surplus of allowances would not undermine program goals. And, while litigation on the CSAPR Update ensued, the subsequent decision remanding the CSAPR Update (Wisconsin v. EPA, 2019) did not find fault with that provision.
5. Conclusion
From ARP to CSAPR, allowance trading programs have evolved over time to address changing industry and environmental challenges. The core principles of accountability, transparency, and results have characterized each program iteration. These programs have been successful because of their results-oriented, adaptable nature and their collaborative implementation style, where EPA, states, and stakeholders are allies in achieving program goals. Setting the environmental and human health mandates and allowing industry to decide how to achieve the emission reductions has proven effective. Among the features contributing to success are the transparency afforded by continuous emissions monitoring and publicly accessible data; compliance directly correlated to emissions reduction requirements; and automatic penalties for failing to meet emissions obligations. The result has been near-complete compliance, with the additional benefit of emission and operation data at an unprecedented level of accuracy, detail and public access.
The proven long-term success of allowance trading as a flexible, effective tool for achieving substantial emission reductions over large geographic areas during the last 30 years has played a significant role in across-the-board improvements in air quality across the country. However, despite the resilience of power sector programs over time, this review of thirty years of emission reduction programs illustrates some important challenges. For example, to the extent possible within the constraints of CAAA statutory language, future programs could include features such as an auto-correct dynamic budget adjustment or formal periodic review as an added feature to ensure continued program efficacy. Other programs include such features and periodically revisit program parameters.
Moreover, the future of allowance trading remains to be seen in an era where air quality continues to improve, areas with persistent air quality problems shrink, and the power sector moves in an ever-cleaner direction. Scientists and policy makers continue working to understand the role of emission sources both large and small close to ozone nonattainment areas, and addressing the contribution of cars and trucks and other non-road mobile sources may prove important to future air quality challenges. In addition, recent research on the intersection of air quality and a changing climate posits a “climate penalty,” meaning that greater emissions reductions could be required to achieve ozone NAAQS attainment due to variations in factors such as temperature, precipitation, and biogenic emissions resulting from a changing climate (Peel et al, 2013; Shen et al, 2019). Such changes could pose future air quality management challenges.
Still, the compliance results and regulatory flexibility that the allowance trading approach has provided in its first 30 years bode well for its future relevance. Though policymakers cannot always pursue the optimal path, they should endeavor to keep rules and obligations as simple as possible to promote compliance and keep costs low. Markets tend to function better when the rules are simple and easily understood by all participants. Under programs like the Regional Greenhouse Gas Initiative and California’s AB32 program, states continue to rely on adaptation of the original ARP allowance trading model to reduce CO2 emissions. It is likely that the environmental results ensured through clear objectives, strong monitoring, and predictable penalties delivered by allowance trading programs will be part of the solution to remaining and future challenges.
Highlights.
The 1990 Clean Air Act Amendments launched a new era in environmental protection.
The Acid Rain Program’s allowance trading program revolutionized air quality policy.
This success spurred additional programs to address interstate transport of power plant emissions.
Air pollution and environmental effects have decreased dramatically since 1990.
Thirty years of implementation experience offers key environmental policy insights.
Acknowledgements
This paper was greatly improved through reviews by Reid Harvey, David Lifland, and Jeremy Schreifels. We also appreciate the assistance of Michael Cohen and Kevin Hollerbach in providing figures for the paper.
Funding
This research did not receive any specific grant from funding agencies in the public, commercial, or not-for-profit sectors.
Footnotes
Disclaimer
The views expressed in this article are those of the authors and do not necessarily represent the views or policies of the U.S. Environmental Protection Agency.
Contributor Information
Melanie D. LaCount, U.S. Environmental Protection Agency
Richard A. Haeuber, U.S. Environmental Protection Agency
Taylor R. Macy, U.S. Environmental Protection Agency
Beth A. Murray, U.S. Environmental Protection Agency
References
- Appendix B of Availability of Documents for the Rulemaking for Certain States in the Ozone Transport Assessment Group Region. 40 CFR §§ 51,52, 76, and 96. (1998).
- Bellas AS, Lange I (2011). Evidence of innovation and diffusion under tradable permit programs. International Review of Environmental and Resource Economics 5(1), 1–22. 10.1561/101.00000036 [DOI] [Google Scholar]
- Chestnut LG, Mills DM (2005). A fresh look at the benefits and costs of the US acid rain program. Journal of Environmental Management 77 (3), 252–266. 10.1016/j.jenvman.2005.05.014 [DOI] [PubMed] [Google Scholar]
- Claussen E (2001). Making Collaboration a Matter of Course: A New Approach to Environmental Policy Making. Environmental Practice 3(4), 202–2015. [Google Scholar]
- Driscoll CT, Lawrence GB, Bulger AJ, Butler TJ, Cronan CS, Eager C, Lambert KF, Likens GE, Stoddard JL, Weathers KC (2001). Acidic deposition in the northeastern US: sources and inputs, ecosystem effects, and management strategies. BioScience 51, 180–198. 10.1641/0006-3568(2001)051[0180:ADITNU]2.0.CO;2 [DOI] [Google Scholar]
- Driscoll CT, Lambert KF, Burtraw D, Buonocore JJ, Reid SB Fakhraei H (2015). US power plant carbon standards and clean air and health co-benefits. Nature Climate Change. 5, 535–540. 10.1038/nclimate2598 [DOI] [Google Scholar]
- Ellerman AD, Joskow PL, Schmalensee R, Montero JP, Bailey EM (2000). Markets for Clean Air: The U.S. Acid Rain Program. New York, NY: Cambridge University Press. [Google Scholar]
- Giles C (2020, January 27). Next Generation Compliance: Environmental Regulation for the Modern Era. Part I: Rules with Compliance Built In. Harvard Law School Environmental & Energy Law Program. http://eelp.law.harvard.edu/wp-content/uploads/Cynthia-Giles-Part-1-FINAL.pdf [Google Scholar]
- Gorham E (1998). Acid deposition and its ecological effects: a brief history of research. Environmental Science & Policy 1(3), 153–166. 10.1016/S1462-9011(98)00025-2 [DOI] [Google Scholar]
- ICF Resources Incorporated. (1992). Regulatory Impact Analysis of the Proposed Acid Rain Implementation Regulations. Environmental Protection Agency. [Google Scholar]
- Likens GE, Bormann FH, Johnson NM (1972). Acid Rain. Environment: Science and Policy for Sustainable Development 14 (2), 33–40. 10.1080/00139157.1972.9933001 [DOI] [Google Scholar]
- McAllister LK (2007). Beyond Playing “Banker”: The Role of the Regulatory Agency in Emissions Trading. Administrative Law Review 59 (2), 269–313. [Google Scholar]
- McLean BJ (1997). Evolution of marketable permits: the US experience with sulfur dioxide allowance trading. International Journal of Environment and Pollution 8(1/2), 19–36. [Google Scholar]
- Napolitano S, Schreifels J, Stevens G, Witt M, LaCount M, Forte R, Smith K (2007). The U.S. Acid Rain Program: Key Insights from the Design, Operation, and Assessment of a Cap-and-Trade Program. The Electricity Journal 20 (7), 47–58. 10.1016/j.tej.2007.07.001 [DOI] [Google Scholar]
- Narassimhan E, Gallagher K, Koester S, Rivera Alejo J (2018). Carbon pricing in practice: a review of existing emissions trading systems. Climate Policy 18 (8), 967–991. 10.1080/14693062.2018.1467827 [DOI] [Google Scholar]
- National Acid Precipitation Assessment Program (NAPAP). (1991). NAPAP Report to Congress: An Integrated Assessment. US National Acid Precipitation Assessment Program. [Google Scholar]
- National Acid Precipitation Assessment Program (NAPAP). (2011). NAPAP Report to Congress 2011: An Integrated Assessment. US National Acid Precipitation Assessment Program. [Google Scholar]
- National Research Council (1991). Rethinking the Ozone Problem in Urban and Regional Air Pollution. Washington, DC: The National Academies Press. 10.17226/1889. [DOI] [Google Scholar]
- New York v. EPA, No. 17-1273. (2019).
- North Carolina v. EPA, 531 F.3d 896. (2008).
- Parker L, Blodgett J May 8, 2006. Air Quality: Multi-Pollutant Legislation in the 109th Congress. (Washington DC: Congressional Research Service, Report #RL32755) [Google Scholar]
- Peel JL, Haeuber R, Garcia V, Russell GA, Neas L . (2013). Impact of nitrogen and climate change interactions on ambient air pollution and human health. Biogeochemistry 114, 121–134. 10.1007/s10533-012-9782-4 [DOI] [Google Scholar]
- Popp D (2003). Pollution Control Innovations and the Clean Air Act of 1990. Journal of Policy Analysis and Management 22(4), 641–660. 10.1002/pam.10159 [DOI] [Google Scholar]
- Ringquist E (2011). Trading Equity for Efficiency in Environmental Protection? Environmental Justice Effects from the SO2 Allowance Trading Programs. Social Science Quarterly 92 (2), 297–323. 10.1111/j.1540-6237.2011.00769.x [DOI] [Google Scholar]
- Schakenbach J, Vollaro R, Forte R (2006). Fundamentals of successful monitoring, reporting, and verification under a cap-and-trade program. Journal of the Air & Waste Management Association 56, 1576–1583. 10.1080/10473289.2006.10464565 [DOI] [PubMed] [Google Scholar]
- Schmalensee R, Stavins RN (2017). Lessons learned from three decades of experience with cap and trade. Review of Environmental Economics and Policy 11 (1), 59–79. 10.1093/reep/rew017 [DOI] [Google Scholar]
- Shen H, Chen Y, Armistead AG, Hu Y, Henneman LRF, Shih J, Burtraw D, Shao S, Qin M, Lawal AS, Pavur GK, Driscoll CT (2019). Relaxing energy policies on top of climate change will significantly undermine states’ efforts to attain U.S. ozone standards. One Earth 1(2), 229–239. doi: 10.1016/j.oneear.2019.09.006. [DOI] [Google Scholar]
- Siikamäki J, Burtraw D, Maher J, Munnings C (2012, November 28). The U.S. Environmental Protection Agency’s Acid Rain Program. Resources for the Future: Backgrounder. https://media.rff.org/documents/Issue_Brief_EPAs_Acid_Rain_Program.pdf [Google Scholar]
- Swift B (2001). How Environmental Laws Work: An Analysis of the Utility Sector’s Response to Regulations of Nitrogen Oxides and Sulfur Dioxide Under the Clean Air Act. Tulane Environmental Law Journal 14(2), 309–409. [Google Scholar]
- Swift B (2004). Emissions Trading and Hot Spots: A Review of the Major Programs. Environment Reporter 35(19):1–16. [Google Scholar]
- Taylor MR (2012). Innovation under cap-and-trade programs. Proceedings of the National Academy of Sciences of the United States of America 109 (13), 4804–4809. 10.1073/pnas.1113462109 [DOI] [PMC free article] [PubMed] [Google Scholar]
- United States Environmental Protection Agency, Office of Air and Radiation. (1992). Report of the Office of Air and Radiation to Administrator William K. Reilly. “Implementing the 1990 Clean Air Act: The First Two Years.” (EPA Document Number 400-R-92-013)
- United States Environmental Protection Agency. (1994). National Air Pollutant Emission Trends, 1900-1993. (EPA Document EPA-454/R-94-027).
- United States Environmental Protection Agency. (2003). Ozone Transport Commission NOX Budget Program 1999-2002 Progress Report. Retrieved from https://www.epa.gov/sites/production/files/2015-08/documents/otcreport.pdf
- United State Environmental Protection Agency. (2019). 2018 Power Sector Programs Progress Report. Retrieved from https://www3.epa.gov/airmarkets/progress/reports/index.html
- [dataset] United States Environmental Protection Agency. (2020a). CAMD Power Sector Emissions Data. https://ampd.epa.gov/ampd/
- [dataset] United States Environmental Protection Agency. (2020b). National Electric Energy Data System. v6. https://www.epa.gov/airmarkets/national-electric-energy-data-system-needs-v6
- Wisconsin v. EPA, No. 16-1406. (2019).