Abstract
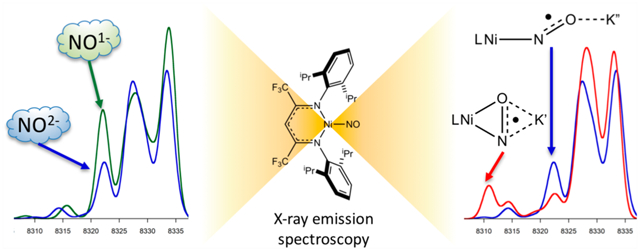
A series of β-diketiminate Ni–NO complexes with a range of NO binding modes and oxidation states were studied by X-ray emission spectroscopy (XES). The results demonstrate that XES can directly probe and distinguish end-on vs side-on NO coordination modes as well as one-electron NO reduction. Density functional theory (DFT) calculations show that the transition from the NO 2s2s σ* orbital has higher intensity for end-on NO coordination than for side-on NO coordination, whereas the 2s2s σ orbital has lower intensity. XES calculations in which the Ni–N–O bond angle was fixed over the range from 80° to 176° suggest that differences in NO coordination angles of ~10° could be experimentally distinguished. Calculations of Cu nitrite reductase (NiR) demonstrate the utility of XES for characterizing NO intermediates in metalloenzymes. This work shows the capability of XES to distinguish NO coordination modes and oxidation states at Ni and highlights applications in quantifying small molecule activation in enzymes.
Graphical Abstract
INTRODUCTION
Metalloenzymes play key roles in biological signaling of nitric oxide (NO) and reduction of NOx species, with metal nitrosyls (M–NO) oftentimes invoked as key intermediates. M–NO species are known or proposed as intermediates in the enzymatic reduction of NO2−,1 reduction of NO,2–4 and conversion of hydroxylamine to N2O,5 although full mechanisms are generally unknown for these systems.4,6 An understanding of the mechanisms of enzymatic NO or NOx reduction would greatly impact the development of catalysts for NO and NOx reduction or activation.
A particular challenge in metal–NO complexes is the ability for both the metal and the ligand to participate in redox events and the difficulty in distinguishing these, especially for first row transition metals.7 NO is regularly found as NO1+, NO, NO1−, and NO2−, but commonly its interactions with metal centers are highly covalent and difficult to discern. Therefore, the Enemark–Feltham notation is generally used to account for the total valence electrons in a system by using the sum of metal d electrons and NO π* electrons.8 However, a more detailed understanding of the metal and NO oxidation states would add clarity to ligand activation and enzyme mechanisms in NO redox chemistry.
Infrared spectroscopy (IR) is generally used to characterize the presence of a metal nitrosyl, and the IR stretch is sensitive to NO activation/NO bond length and the metal–N–O bond angle.9–11 The contributions from activation and bond angle, however, are difficult to deconvolute and not well-quantified.9,12 A further complication is the limited ability to correlate calculated electronic structures and M–N–O bond angles with IR data.13 As such, electronic structure characterization of M–NO species generally involves significant spectroscopic and computational efforts. Determination of the M–N–O bond angle is especially important in enzymes such as the reduced forms of nitrite reductase (NiR) that exhibit side-on NO bonding. Crystallography allowed for a side-on nitrosyl to be observed for copper; however, X-ray structures are often difficult to obtain for enzymes.1
X-ray absorption spectroscopy (XAS) is often used to characterize enzyme metal centers and intermediates when crystal structures are not obtainable. Bond distances from the metal center can be determined to reasonable levels of accuracy (0.02 Å) with XAS.14 A significant limitation for NO chemistry is that XAS cannot distinguish differences in coordination number of ±1, similar light atoms (such as C, N, and O), and protonation states. This implies that variations in M–N–O angles including end-on, bent, and side-on coordination modes of NO could not be distinguished or quantified by XAS alone.
X-ray emission spectroscopy (XES) overcomes some of the limitations of XAS15,16 and is perhaps best known for being able to distinguish C and N from O, as demonstrated in Cr compounds,17 Mn complexes,18 a cluster of iron centers, and the enzyme nitrogenase.19,20 These significant findings highlighted the value of XES to bioinorganic chemistry in the understanding of enzyme active sites. More recent enzyme studies included two-color valence-to-core (VtC) XES probing both Mn and Fe centers of intermediates in ribonucleotide reductase,21,22 peptidylglycine monooxygenase,23 and galactose oxidase.24
Valence-to-core (VtC) XES probes occupied valence orbitals by detecting relaxation of electrons from ligand-centered 2p and 2s orbitals to the metal-centered 1s orbital (Figure 1A).25 Gradual improvements in instrumentation and detectors have allowed the very low intensity VtC to be observed with sufficient resolution to become a useful spectral tool for chemists. However, there is still much development needed by using model complexes to fully understand effects of varying coordination environments on spectral features and render the technique more versatile. Recent work highlighted the ability for VtC XES to distinguish (a) one vs two N2 or NO molecules coordinated at Fe (Figure 1B2),26,27 (b) N2 reduction (Figure 1B3),28 (c) bis μ-oxo vs μ-oxo vs μ-hydroxo,29 (d) O2 activation (Figure 1B3),30 and nickel hydrides.31 In combining these results, it can be generally understood that portions of the VtC Kβ2,5 region increase in intensity upon additional ligand coordination (Figure 1B2).26,27 Additionally, some Kβ2,5 features shift to lower energy, and the energy separation between the 2s σ and σ* decreases with increased bond activation (Figure 1B3).28,30 The VtC Kβ″ is more difficult to experimentally detect, but decreases in energy is observed with increased electronegativity of the ligand (such as C to N to O, Figure 1B1).
Figure 1.
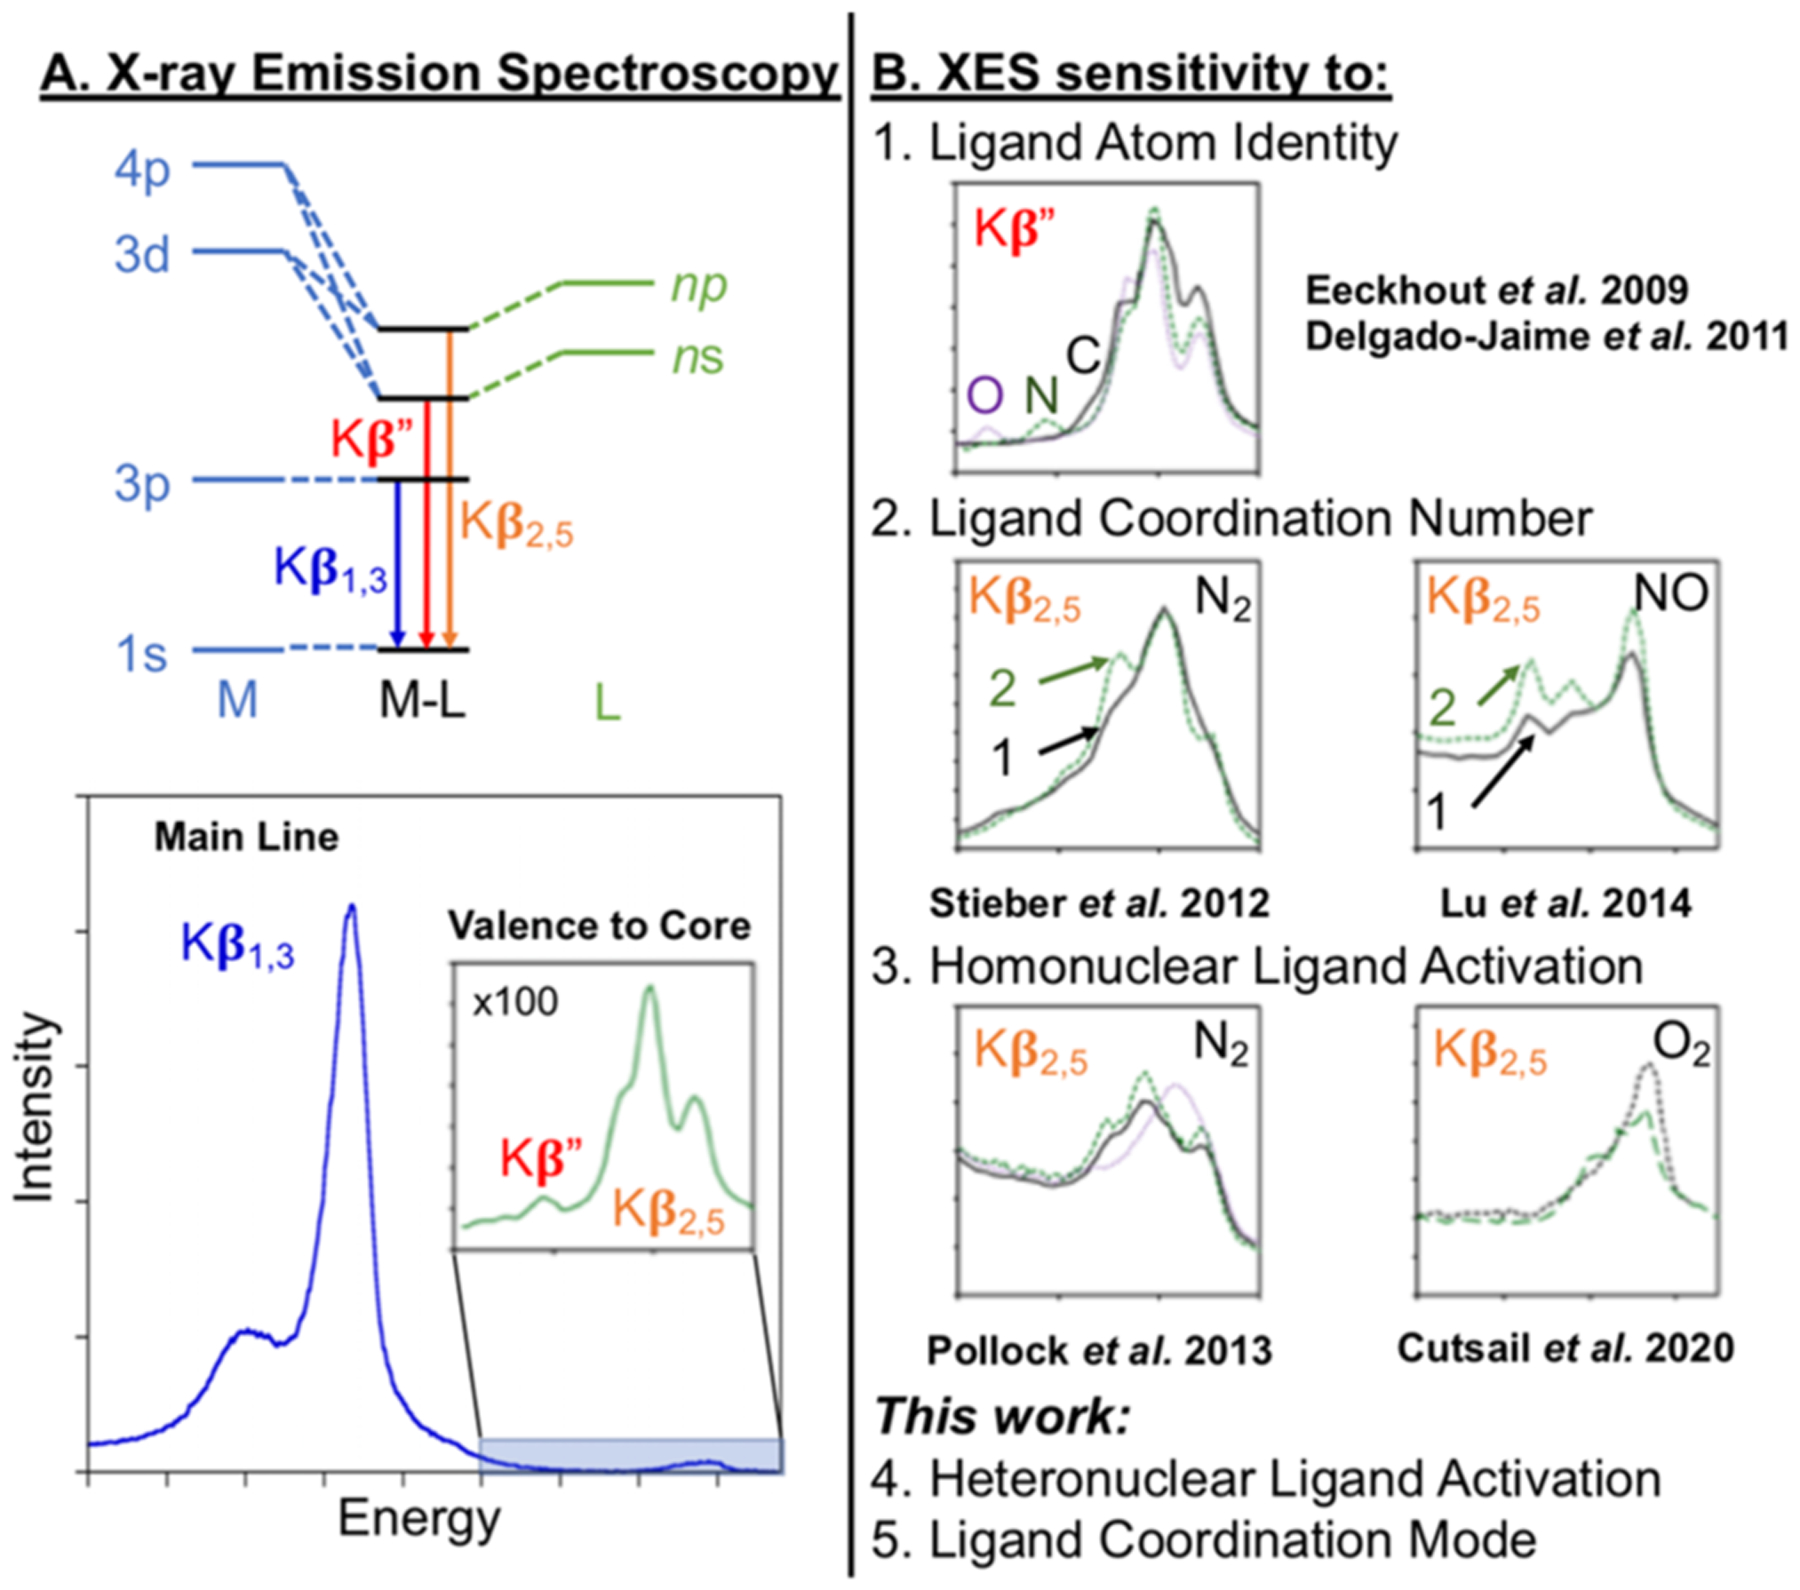
Schematic of (A) X-ray emission spectroscopy (XES) and (B) significant applications for determining ligand atom identity, coordination number, and ligand activation at metal centers.
XES characterization of four-coordinate Fe–NO complexes with SPh and OPh ancillary ligands determined that one vs two NO ligands bound could be distinguished by XES.27,32 Computationally, they reported that XES should be able to distinguish NO oxidation states based on differences in energies of the σ2s* and σ2p orbitals. However, the complexes in the study were sufficiently similar that differences in NO oxidation states could not be fully experimentally distinguished. In the current work, two new areas for experimentally applying XES are reported, including heteronuclear ligand activation and ligand coordination mode (Figure 1).
RESULTS AND DISCUSSION
XES Spectra of Nickel Nitrosyl Complexes.
Three previously reported β-diketiminate nickel(II) nitrosyl complexes were studied with end-on vs side-on coordination geometries and NO oxidation states best described as NO1− vs NO2−.33 The complexes [iPr2NNF6]NiNO (end-on Ni–(NO1−)), [iPr2NNF6]Ni(μ-η1:η1-NO)K[2.2.2-cryptand] (end-on Ni–(NO2−)), and [iPr2NNF6]Ni(μ-η2:η2-NO)K(18-crown-6)(THF) (side-on Ni–(NO2−)) were synthesized as previously described (Scheme 1).33 These nickel(II) complexes were extensively characterized by X-ray crystallography, Ni K-edge XAS, and DFT analysis, making them ideal for probing capabilities of XES to distinguish NO oxidation states and coordination modes. It should be noted that end-on Ni–(NO2−) was crystallographically characterized and modeled as a disordered NO with 77% end-on and 23% side-on NO2−.
Scheme 1.
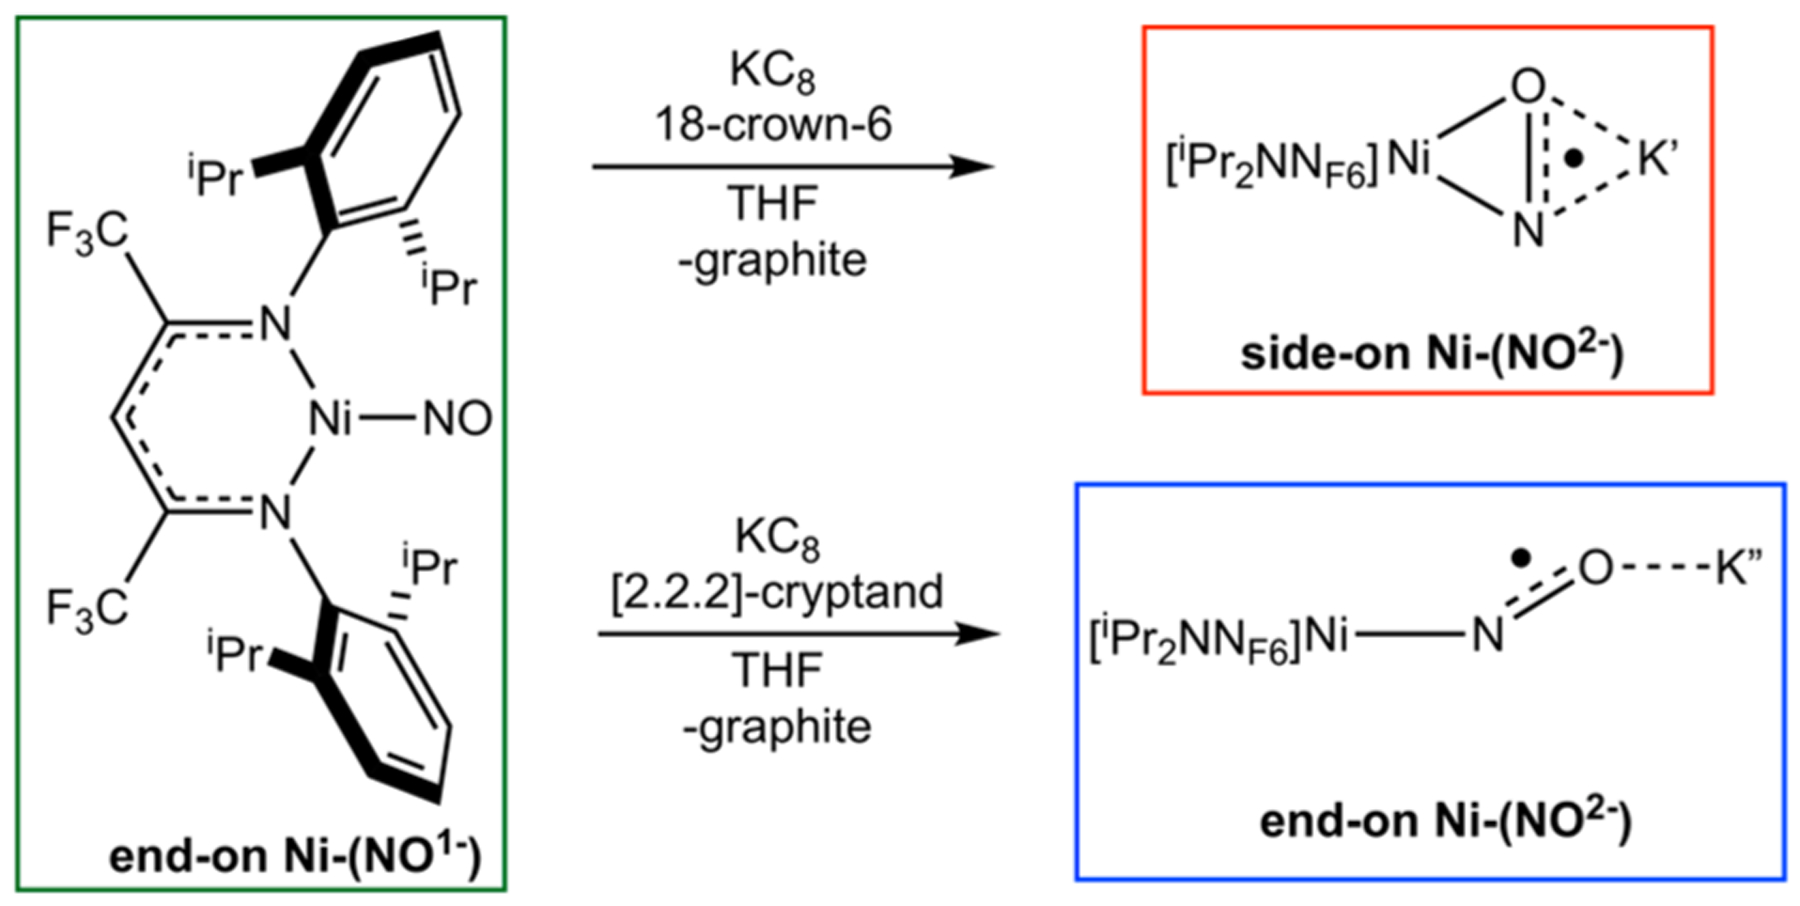
Reduction of End-On Ni–(NO1−) to Form End-On and Side-On Ni–(NO2−)
The Kβ mainline XES spectra for the three complexes overlay (Figure S1), providing additional experimental support for these complexes having the same oxidation and spin states at nickel. Although spin states and covalency can also affect the Kβ mainline,34 this suggests a similar electronic environment at the nickel center in each complex. The VtC for the three complexes are distinct (Figure 2a), with differences in both the Kβ″ (~8300–8320 eV) and Kβ2,5 (~8320–8336 eV) regions.
Figure 2.
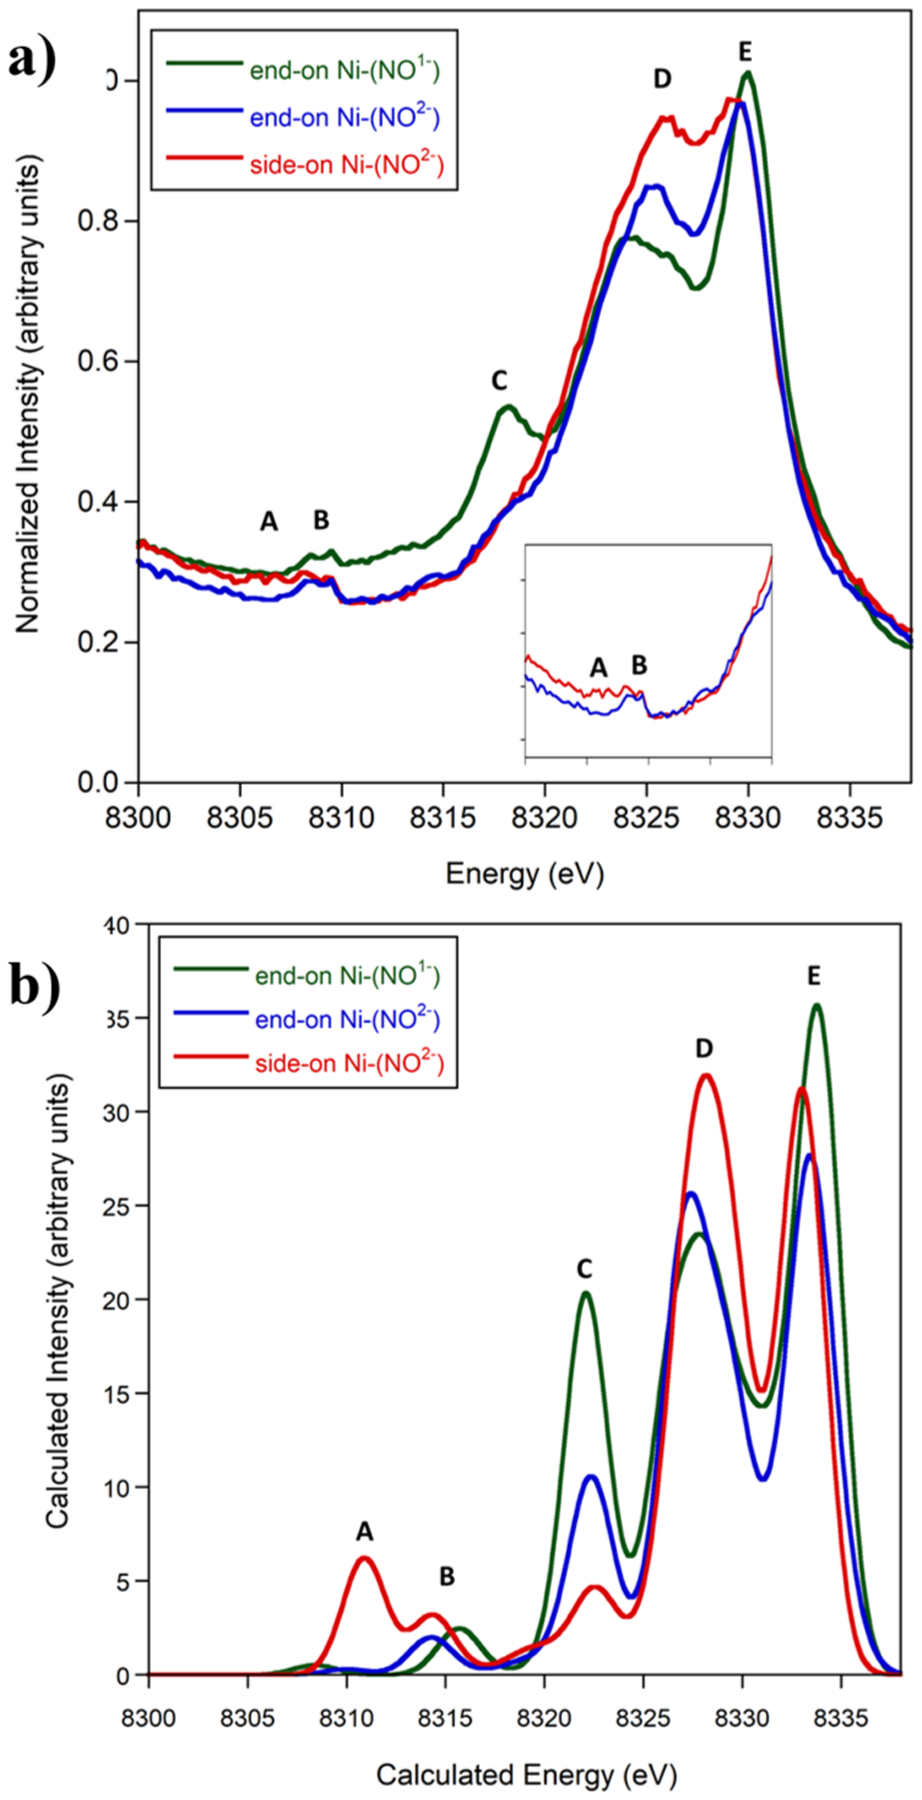
VtC XES (a) of end-on Ni–(NO1−) (green), end-on Ni–(NO2−) (blue), and side-on Ni–(NO2−) (red) and calculated VtC XES (b). Inset shows end-on vs side-on Ni–(NO2−) from 8300 to 8320 eV. A shift of 217.0 eV and a broadening of 2.5 eV were applied to the computed data.
The VtC XES spectrum of end-on Ni–(NO1−) has a distinct shoulder at 8318.2 eV (Figure 2a, peak C), which has lower intensity for end-on Ni–(NO2−) and no intensity for side-on Ni–(NO2−). The Kβ2,5 feature around 8326 eV (Figure 2a, peak D) has the highest intensity for side-on Ni–(NO2−), and decreases in intensity for end-on Ni–(NO2−) followed by end-on Ni–(NO1−), with a corresponding shift to lower energy. This suggests that the features at 8318.2 and 8326 eV are sensitive to both the NO oxidation state and coordination mode. The feature around 8309 eV (Figure 2a, peak B) was observed for all complexes with nacnac ligands. In the Kβ″ region, the side-on Ni–(NO2−) has a feature present around 8306 eV (Figure 2a, peak A), which is notably absent in the spectra of the two end-on complexes. This supports the ability for XES to distinguish end-on vs side-on coordination modes for NO2−.
DFT Calculations: Simulating XES Spectra.
DFT calculations were conducted by using the ORCA program35 to offer insight into XES spectral features in the VtC. A simple one-electron, ground-state model has been well-established to offer good agreement with experimental VtC XES spectra for Cr,36 Mn,29,37 Fe,19,20,26,28,38,39 Co,40 and Cu.30,23 The calculated VtC XES spectra using BP86 with the CP(PPP) basis set41 on Ni and TZVP42 on all other atoms on geometry-optimized structures for the three complexes (Figure 2) are distinct and in good agreement with experimental data with regard to both energies and intensities. The same general trends of a decrease in intensity for the feature at 8322 eV (Figure 2b, peak C) and an increase in intensity for the feature around 8311 eV (Figure 2b, peak A) were observed from end-on Ni–(NO1−) to end-on Ni–(NO2−) to side-on Ni–(NO2−).
Spectral contributions were analyzed through visualization of molecular orbitals, since the transitions were calculated from valence orbitals to 1s orbitals in a ground-state model. Previous studies reported that higher σ overlap of ligand orbitals with metal orbitals result in more intense spectral features.25 The calculated VtC XES for end-on Ni–(NO1−), end-on Ni–(NO2−), and side-on Ni–(NO2−) spectra along with orbital contributions highlight the lowest energy feature as resulting from NO-based orbitals for all three complexes (Figure 3). For all three complexes, the feature at (a) 8308–8311 eV is the 2s(N)–2s(O) σ bonding combination, (b) 8314–8316 eV is the nacnac ligand σ and b1 σ*, and (c) 8322 eV is the 2s(N)–2s(O) σ* orbital. The higher energy features >8323 eV correlate to orbitals that are combinations of 2p σ, π, and π* interactions of the NO and nacnac ligands, with the feature around 8335 having significant NO π* contributions.
Figure 3.
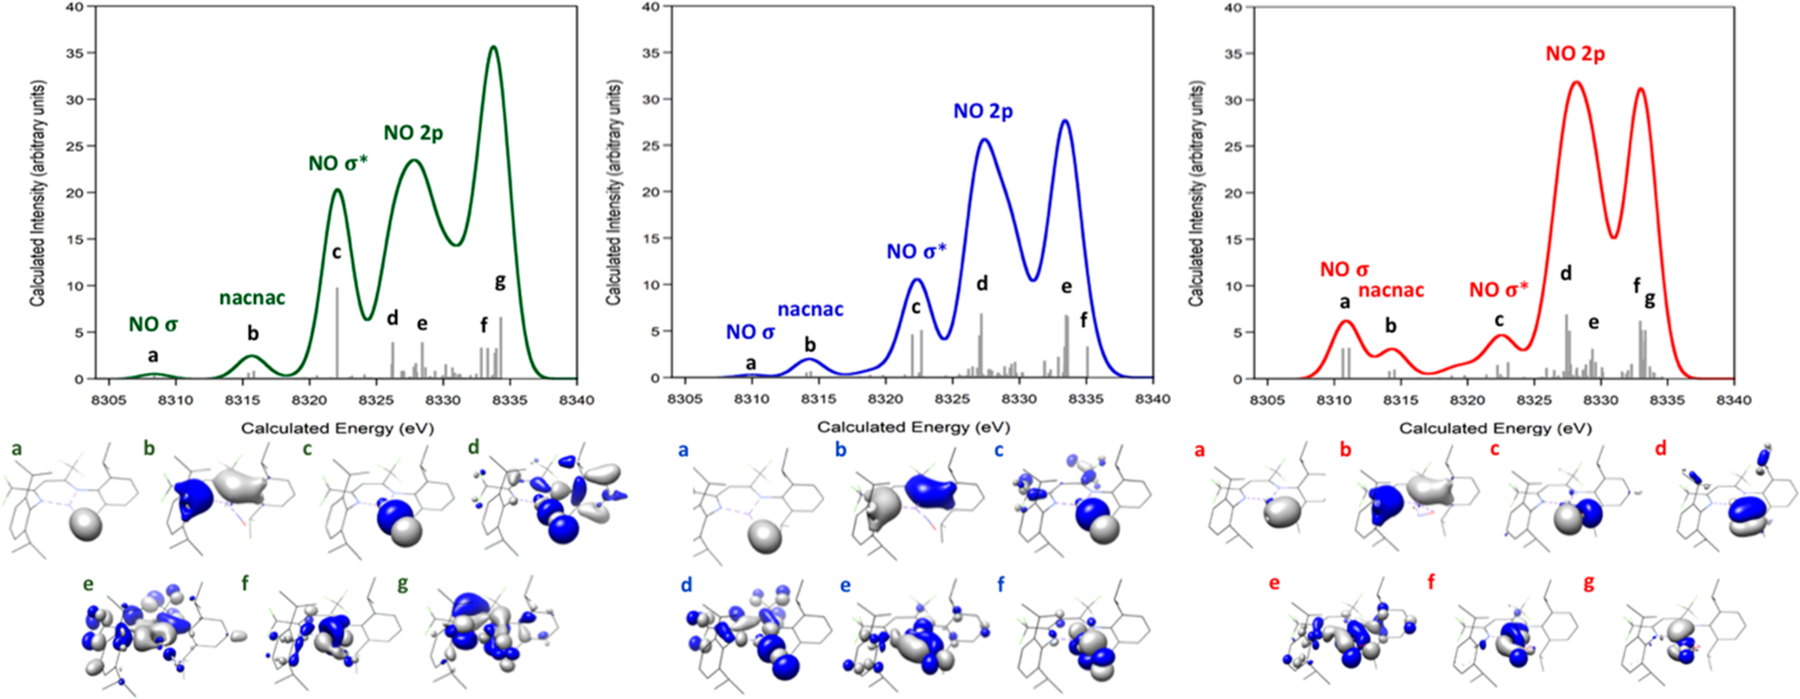
Calculated VtC XES spectrum of end-on Ni–(NO1−) (left), end-on Ni–(NO2−) (middle), and side-on Ni–(NO2−) (right) with the molecular orbitals that strongly contribute to the observed transitions. A shift of 217.0 eV and a broadening of 2.5 eV were applied.
A closer examination of the orbitals reveals a shift to higher energy for the 2s(N)–2s(O) σ bonding orbital upon NO reduction from end-on NO1− at 8308.5 eV to end-on NO2− at 8310.1 eV. This is consistent with previous XES observations of increased energy of the 2s σ bonding orbital upon reduction of N2,28 NO,27 and O2.30 In the current work, the 2s(N)–2s(O) σ* orbital shifts to slightly higher energy upon NO reduction from end-on NO1− at 8322.1 eV to end-on NO2− at 8322.5 eV; however, the shift is much smaller. The energy difference between the 2s(N)–2s(O) σ and σ* decreases from 13.6 eV for end-on Ni–(NO1−) to 12.4 eV for end-on Ni–(NO2−) and 11.5 eV for side-on Ni–(NO2−). These are consistent with differences of 8.4–12.4 eV as calculated for free NO1− and NO2− (Figure S2). The magnitude is generally larger than reported 2s σ and σ* energy differences of 5–6 eV in Fe–NO,27 6–8 eV in Cu–O22− and Mn–O22−,30,43 and 12 eV in Fe–N2,28 which is consistent with more activated NO. The highest energy NO π* signal shifts to lower energy from 8334.0 to 8333.6 eV upon reduction. This suggests that XES is sensitive to NO reduction, although the intensity of 2s(N)–2s(O) σ bonding orbital is too low to be experimentally resolved within current detection limits for nickel. Therefore, the shift in higher energy of the 2s(N)–2s(O) σ* orbital and the shift to lower energy of the NO π* can be used to assess NO reduction from NO1− to NO2− using XES.
Connecting XES Spectra with Ni–NO Molecular Orbitals.
The observed effects on the XES spectrum of NO coordination geometry as end-on or side-on are clarified by examining the molecular orbitals (Figure 3). The 2s(N)–2s(O) σ bonding feature at 8308–8311 eV has a greater intensity for side-on Ni–(NO2−) than end-on Ni–(NO2−). This is a result of increased orbital overlap between Ni and the oxygen atom of NO. Strong overlap of the side-on NO2− π orbital with Ni results in the feature at ~8328 eV having higher intensity for side-on NO2− than end-on NO2−. For all three complexes, transitions from the NO π* orbitals are at energies >8325 eV.
From previously reported geometry optimization calculations,33 strong orbital overlap of the Ni dxy and dyz orbitals with the NO π* orbitals contributes to complex formation for end-on Ni–(NO1−) and NO activation. Upon one-electron reduction to Ni–(NO2−), the Ni–N bond distance lengthens, while the Ni–nacnac bond distances shorten. Because the Ni dyz orbital also has the correct symmetry to interact with nacnac π* orbitals, the Ni dyz orbital can be stabilized through backbonding to nacnac π* orbitals, allowing the NO π* orbitals to accept the electron and be further activated. These effects are manifest in the VtC XES spectra by the slight shift to lower energy of the nacnac peak b observed upon reduction from Ni–(NO1−) to Ni–(NO2−). Similarly, the highest energy peak, which has NO π* contributions, shifts to lower energy upon reduction from Ni–(NO1−) to Ni–(NO2−). Because the dyz orbital has weaker backbonding to NO2−, both end-on and side-on coordination are possible with minimal effects on the orbital energies.
Probing the Effect of Ni–N–O Bond Angle.
To probe capabilities for XES to distinguish NO coordination modes, XES calculations of Ni–NO complexes with hypothetical Ni–N–O angles ranging from 102° to 176° for Ni–(NO1−) and 80° to 160° for Ni–(NO2−) were commenced (Figure 4 and Figures S3–S6). A geometry optimization was conducted at each probed angle, while keeping the Ni–N–O angle fixed. It was not possible to find solutions for Ni–(NO1−) complexes with angles smaller than 102.3°. For both Ni–(NO1−) and Ni–(NO2−), the feature to lowest energy (around 8306–8311 eV) increases in intensity for decreasing Ni–N–O angles, while the feature around 8322 eV decreases. The lowest energy feature around 8310.7 eV corresponds to the 2s(N)–2s(O) σ bonding orbital and increases in intensity for smaller Ni–N–O angles due to increased overlap with metal orbitals (Figure S5). The Ni p-character of the 2s(N)–2s(O) σ bonding orbital increases the most strongly with increased intensity by ~2%; however, both Ni s-character and d-character also increase with intensity over the calculated range of angles for Ni–(NO2−). Nitrogen s-character (~25%) and p-character (~13%) as well as oxygen s-character (50%) and p-character (~8%) of the 2s(N)–2s(O) σ bonding orbital remain relatively consistent over the calculated range of angles for Ni–(NO2−).
Figure 4.
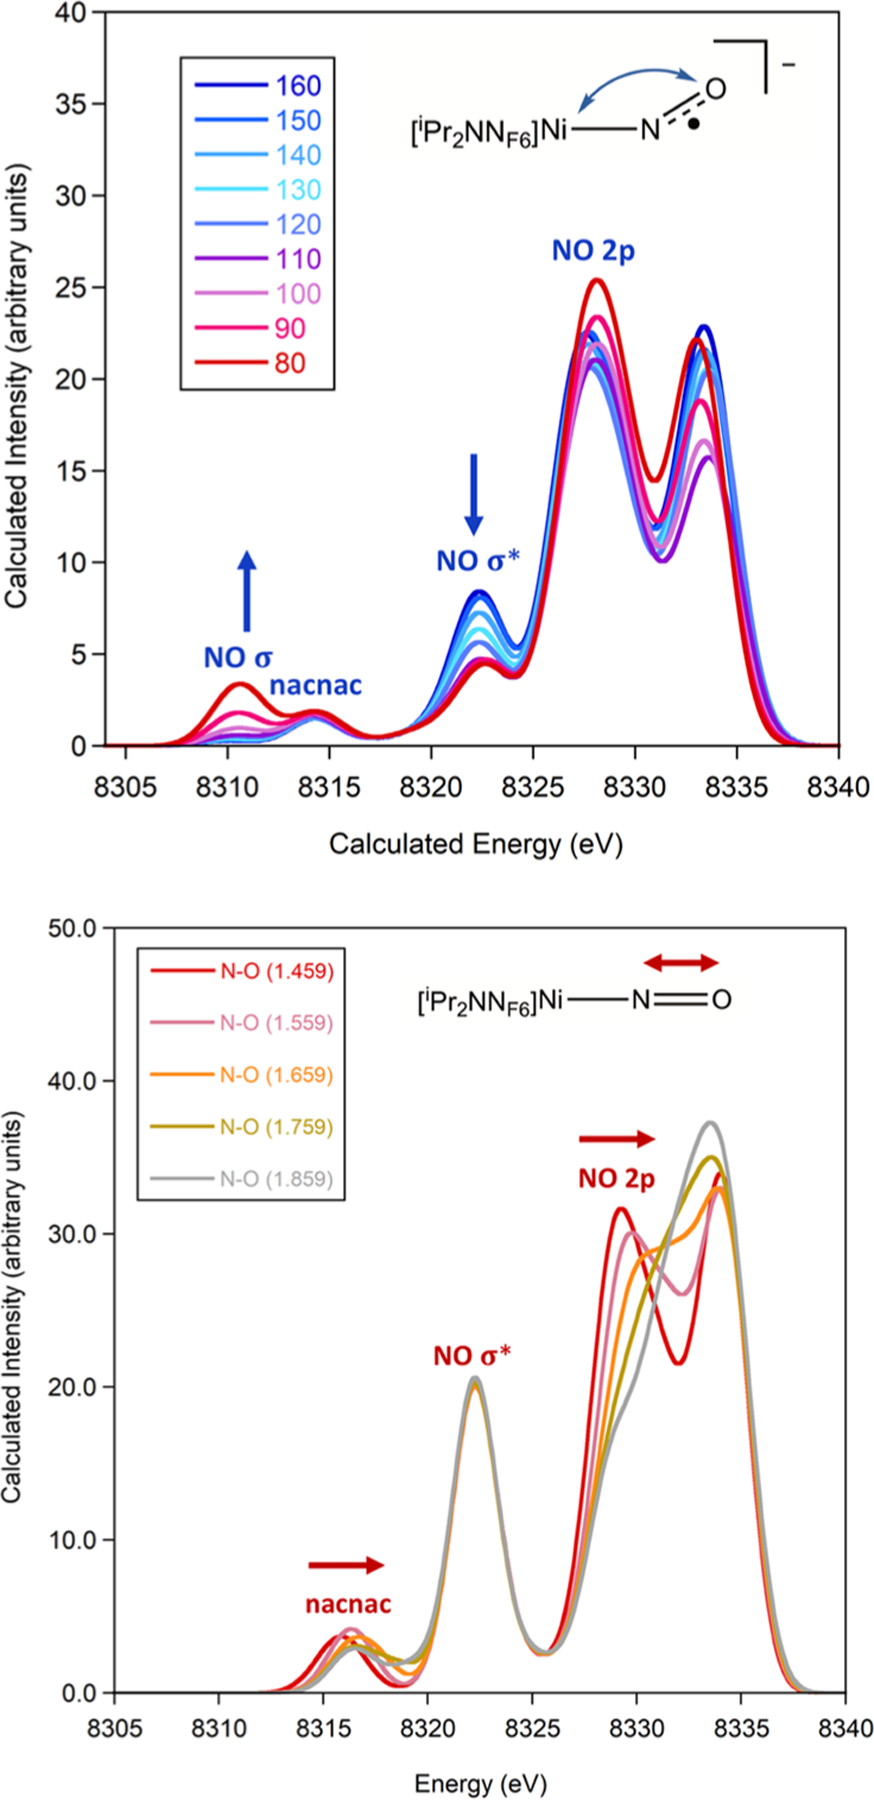
Calculated VtC XES spectrum of Ni–(NO2−) with varying the Ni–N–O angle from 80° to 160°. A shift of 217.0 eV and a broadening of 2.5 eV were applied.
The feature around 8322 eV corresponds to the 2s(N)–2s(O) σ* orbital and decreases in intensity with decreasing bond angle. The Ni p-character of the 2s(N)–2s(O) σ* orbital increases by 2.6% with increasing signal intensity over the 70° range of angles probed for Ni–(NO2−), while both Ni s-character and d-character increase by ~2% (Figure S6). With increasing intensity, the nitrogen s-character and p-character generally increased by 8–10%, while the oxygen s-character and p-character generally decreased by 8–10% in the 2s(N)–2s(O) σ* orbital over the calculated range of angles for Ni–(NO2−). One complication in the geometry optimizations is that the Ni–N bond distance lengthened by ~0.1 Å with decreasing Ni–N–O angle (Table S1), so the observed effects will be slightly affected by this (see the following). The N–O distance only changed by 0.05 Å across the series, so there is no significant activation. These results suggest that XES is potentially sensitive to changes in Ni–N–O bond angle of as small as 10°.
Probing the Effects of Ni–N and N–O Distances.
The effect of NO reduction on the XES spectral features was further examined through calculations of Ni–(NO1−) where the N–O bond distance was fixed from 1.459 to 1.859 Å in a series of single point calculations without additional geometry optimization (Figure 5). These calculations reveal that both the lowest energy nacnac feature around 8316 eV and the feature around 8330 eV shift to higher energy upon lengthening of the N–O bond. The lowest energy nacnac feature shifts from 8315.9 to 8316.5 eV along with an increase in N–O bond length from 1.459 to 1.859 Å. The larger effect is observed in the 2p(N)–2p(O) feature at 8329.3 eV, which shifts to higher energy and significantly decreases in intensity along with an increase in N–O bond length from 1.459 to 1.859 Å. Notably, the 2s(N)–2s(O) σ* feature around 8322 eV is not affected by the N–O bond distance, supporting that it is not sensitive to NO reduction in this nacnac ligand system. Combined, these calculations support that XES is sensitive to changes in nitrosyl N–O bond distances and therefore sensitive to NO reduction.
Figure 5.
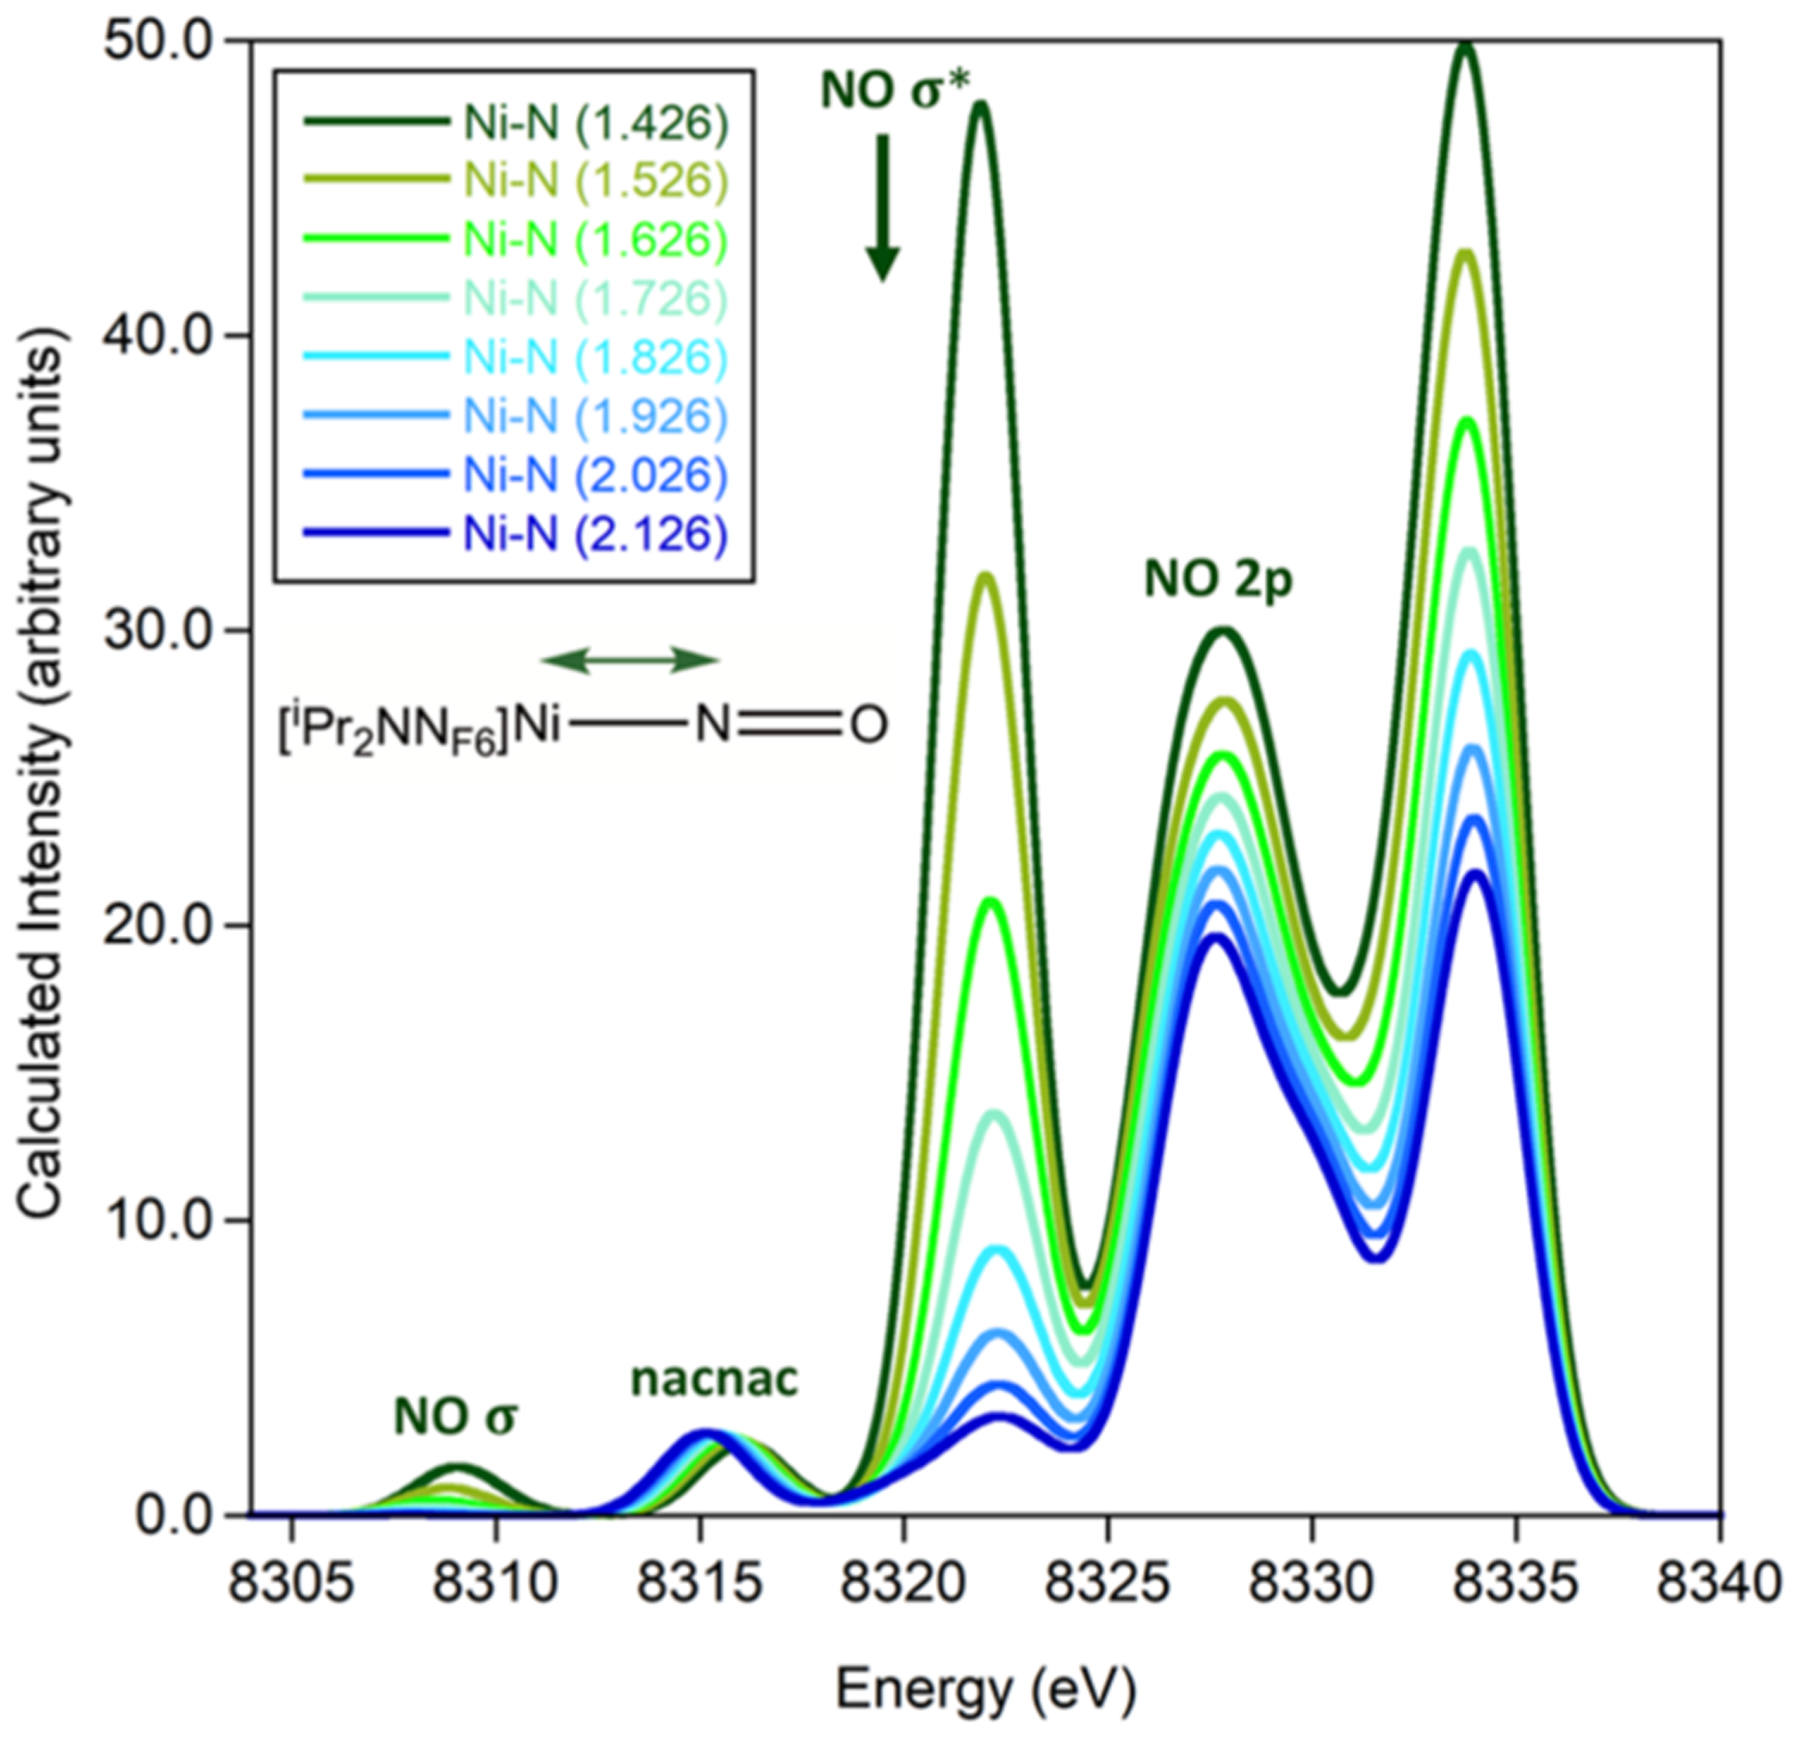
Calculated VtC XES spectrum of end-on Ni–(NO1−) with fixed N–O distances (top) and fixed Ni–N distances (bottom). A shift of 217.0 eV and a broadening of 2.5 eV were applied.
Effects of Ni–NO bond lengths were examined through XES calculations of Ni–(NO1−) where the Ni–N bond distance was fixed from 1.426 to 2.126 Å without geometry optimization (Figure 5). The resulting XES spectra reveal that features above 8318 eV sequentially increase in intensity with decreasing Ni–N distance and that features below 8318 eV are not significantly altered. The increasing intensity of the NO 2s(N)–2s(O) σ* feature around 8322 eV correlates with the increasing Ni 4s character in the molecular orbital contributing to the observed transition (Figure S7). A correlation of XES VtC intensity, as determined by the total oscillator strength, and Ni p-character was determined to have an exponential correlation (Figure S7).
The correlation of XES VtC intensity with metal np character has been well-established and is consistent with previous reports.39,44,45 The XES VtC intensity was also found to correlate exponentially to Ni s-character (Figure S7), which is in contrast to previous reports where no correlation of XES VtC intensity to metal s-character was observed.46 It is likely that this is due to the low symmetry of the current system being studied as compared to previous reports with higher symmetry molecules.
Application of XES to Cu–NO in CuNiR.
The applicability of these XES findings to metalloenzymes was probed through XES calculations of the active site in copper nitrite reductase (NiR). The crystal structures of a side-on Cu–NO and Cu–NO2 moiety within NiR were previously reported (Figure 6) and are a rare example of structural characterization of this motif within an enzyme.1 Structural coordinates for the side-on [(his)3Cu-NO]+ and [(his)3Cu–NO2]+ centers and surrounding histidine ligands were used directly for XES calculations without further optimization (Figure 6), and a hypothetical end-on Cu-NO was also calculated.1 The reported crystal structures were consistent with either side-on Cu(I)–(NO+) or side-on Cu(II)–(NO−),1 so both possibilities were input for XES calculations (see Figure S8).
Figure 6.
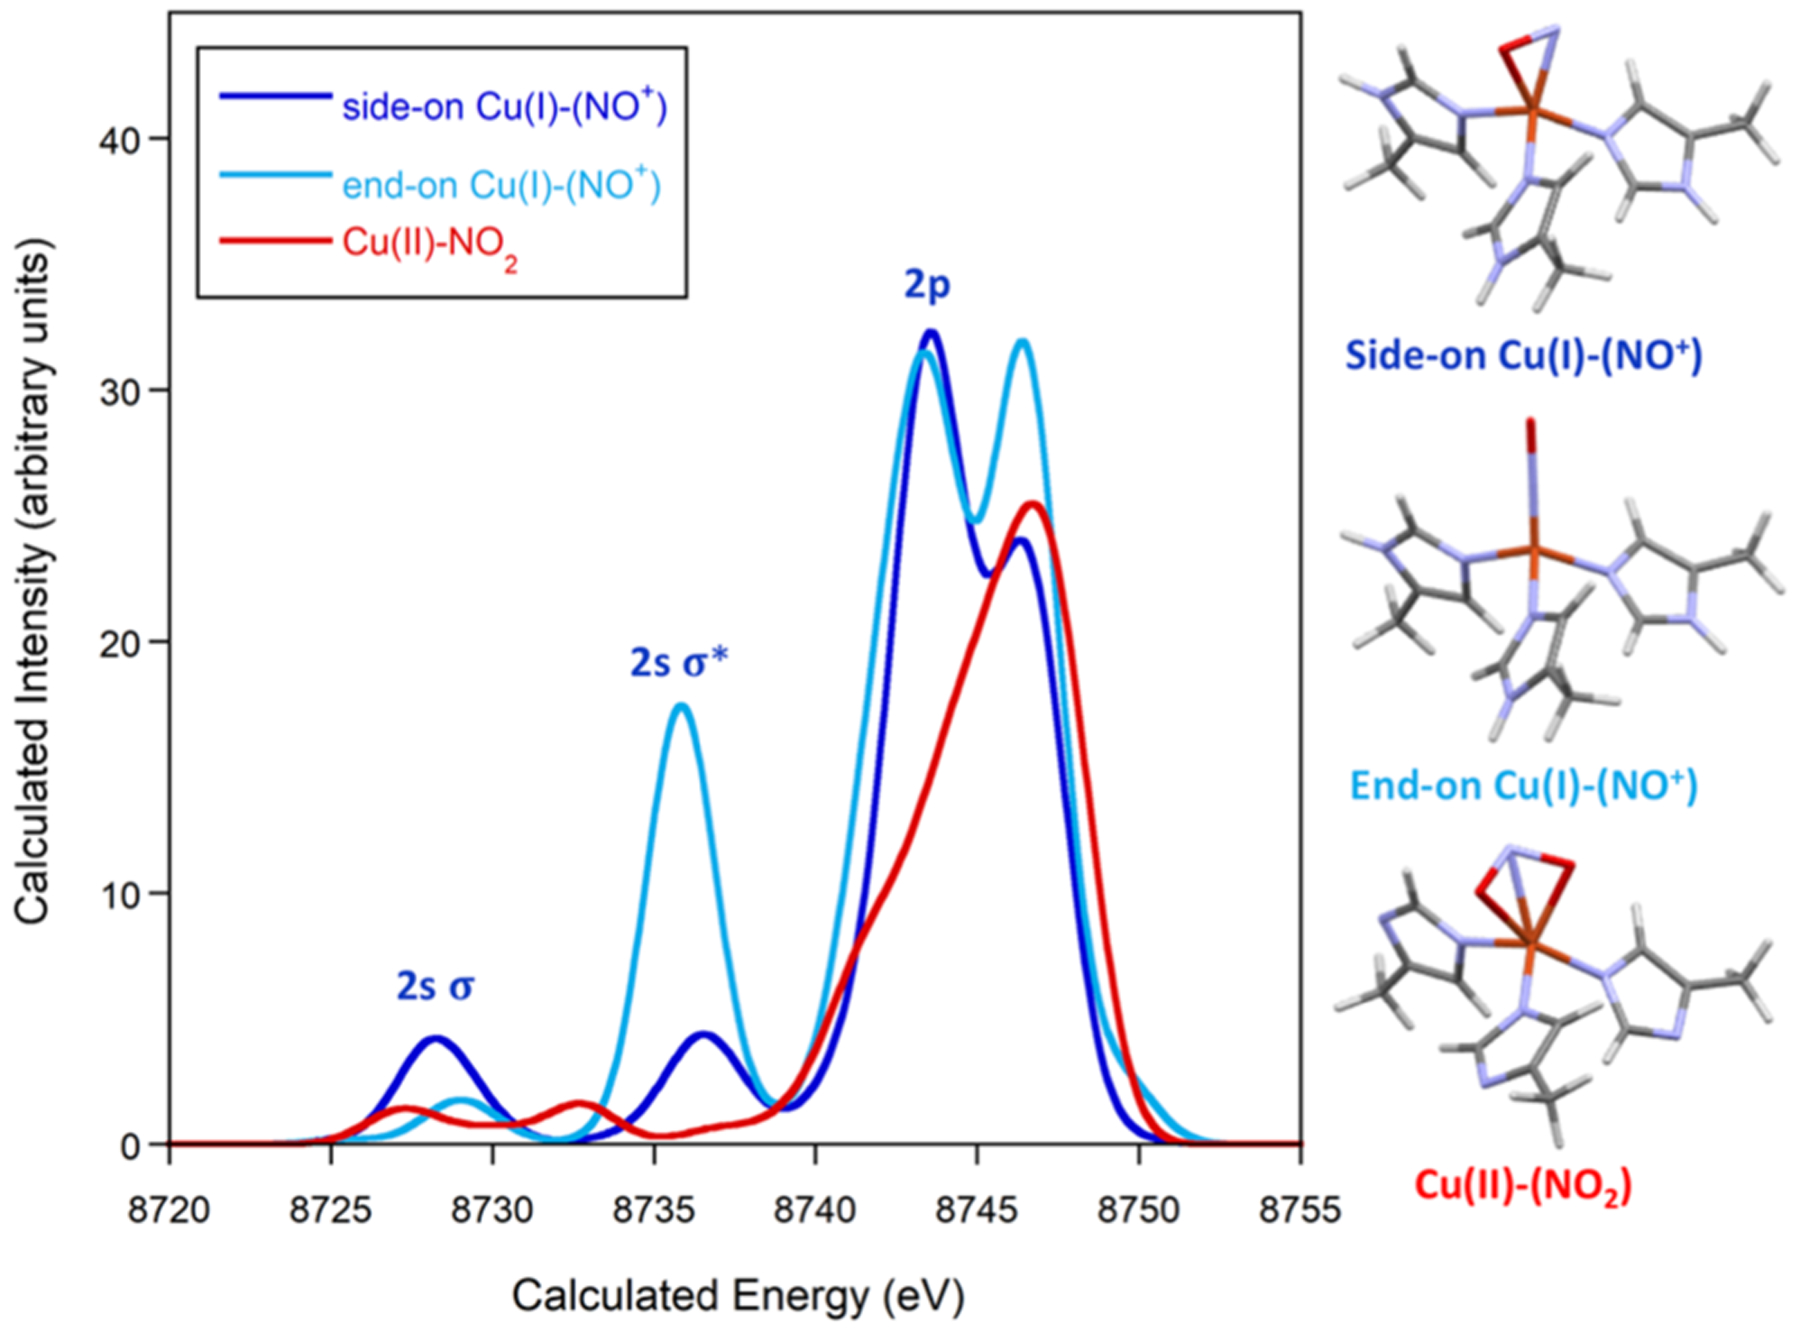
Calculated VtC XES spectrum of NiR for side-on Cu(I)–(NO+), end-on Cu(I)–(NO+), and Cu(II)–NO2 along with structural models (orange = copper, red = oxygen, purple = nitrogen, gray = carbon, and white = hydrogen). Calculated energies are not calibrated, and a broadening of 2.5 eV was applied to calculated spectra.
The calculated XES spectra for Cu NiR reveal that side-on Cu–NO, end-on Cu–NO, and Cu–NO2 centers should be experimentally distinguishable by XES. This is significant for potential mechanistic studies using time-resolved XES methods.47–50 A closer look at the spectra reveals similar trends and molecular orbital contributions to what was observed in the Ni–NO system (Figures S9–S11). The lowest energy 2s(N)–2s(O) σ bonding feature at 8278.3 eV for side-on Cu(I)–(NO+) is shifted 0.8 eV to lower energy than for end-on Cu(I)–(NO+) and has a higher intensity. The 2s(N)–2s(O) σ* feature at 8736.6 eV has significantly lower intensity for side-on Cu(I)–(NO+) and shifts 0.7 eV to lower energy for end-on Cu(I)–(NO+). There is no equivalent feature around this energy for Cu–NO2. The 2p(N)–2p(O) feature around 8743 eV significantly decreases in intensity for Cu–NO2, supporting considerable nitrosyl contributions to this feature as was observed for Ni–NO.
CONCLUSIONS
The Ni Kβ VtC XES spectra of end-on Ni–(NO1−), end-on Ni–(NO2−), and side-on Ni–(NO2−) indicate that XES is sensitive to the oxidation states of NO1− vs NO2−, and end-on vs side-on NO coordination, and is among the first Ni Kβ VtC XES reports.31 This is a new example of the sensitivity of XES to the coordination mode of a small molecule, as demonstrated by sensitivity to Ni–N–O bond angle changes of as small as 10°. Calculations of Cu NiR suggest that these results are applicable for characterizing side-on vs end-on NO in Cu metalloenzymes and that these intermediates can be distinguished from Cu–NO2. This expands capabilities for XES to characterize bond activation of small molecules and demonstrates the potential for XES to be used to characterize enzyme intermediates in NO and NOx reduction. Specifically, future time-resolved XES experiments47–50 have the potential to probe previously uncharacterized intermediates in nitrite reductases.
EXPERIMENTAL SECTION
General Methods.
Samples of [iPr2NNF6]NiNO (end-on Ni–(NO1−)), [iPr2NNF6]Ni(μ-η1:η1-NO)K[2.2.2-cryptand] (end-on Ni–(NO2−)), and [iPr2NNF6]Ni(μ-η2:η2-NO)K(18-crown-6)(THF) (side-on Ni–(NO2−)) were synthesized as previously reported.33 Structural coordinates for Cu NiR active sites including side-on Cu–NO and Cu–NO2 were taken from reported crystal structures of the full enzyme with PDB codes 1SNR and 1SJM.1
X-ray Emission Spectroscopy (XES) Experiments.
The EXS experiments were conducted on beamline 6-2 (3 GeV, 500 mA) at the Stanford Synchrotron Radiation Lightsource (SSRL).51 Beamline 6-2 is equipped with a liquid-N2-cooled Si[111] monochromator, which was calibrated to a nickel foil at 8332.8 eV (first inflection point). The multicrystal Johann spectrometer used three spherically bent Si[551] crystals (100 mm diameter, 1 m radius of curvature) on a Rowland geometry; a Si drift detector (SDD) with a 1.5 mm vertical slit was used. The spectrometer energy was calibrated across its overall operational energy range by using a sequence of elastic scattering measurements from the incident tunable monochromatic X-ray beam. Ni samples were sealed in ampules for shipment to the synchrotron facility. The samples were manipulated in an Ar glovebox at the synchrotron facility. Samples were finely ground and pressed into a 1 mm Al holder without further dilution and sealed with Kapton tape. The samples were transferred to the beamline under liquid N2 and attached to the sample rod under liquid N2. A liquid helium Oxford CFI208 cryostat was attached to maintain a sample temperature of ~10 K. To reduce signal attenuation, a He-filled flight path was employed. To prevent sample damage, aluminum filters were utilized before the sample to attenuate the incident X-ray. Radiation damage scans were conducted for each sample prior to measurements. In addition, two scans were collected per sample spot to assess radiation damage, and only scans that showed no evidence for radiation damage were used for data averages. The incident flux was measured with a He-filled ion chamber and used to normalize the measured emission signal. Data were processed and normalized by using PyMCA52 and visualized with Kaleidagraph.
DFT Calculations.
DFT calculations were conducted by using the ORCA program, as previously described,26,35 and using the XSEDE computational resources.53 Avogadro was used to center coordinates and modify structural inputs.54 Geometry optimizations were performed at the B3LYP level of theory.55–57 B3LYP is a hybrid functional that has been shown to offer a more accurate description for metal–ligand bond lengths and interactions in 3d transition metal compounds.58 The all-electron Ahlrichs basis sets were applied,59–61 utilizing triple-ξ def2-TZVP basis sets on the metal center and all atoms directly bound to the metal center. All other atoms were described by using double-ξ def2-SV(P) basis sets. Auxiliary basis sets were selected to match the orbital basis.62,63 The RIJCOSX approximation was used for computational expediency. For broken symmetry calculations, the notation BS(x,y) signifies x spin-up electrons and y spin-down electrons.64,65 The resulting coupled orbital pair was visualized by plotting the corresponding orbitals (uco). Orbitals and spin density plots were visualized by using the program Chimera.66
The XES spectra were calculated by using the simple one-electron approximation as previously described,26 with the BP86 functional, the CP(PPP) basis set on nickel and copper,41 and the TZVP basis set on all other atoms.42 A dense integration grid with an integration accuracy of 7 was applied to increase radial integration accuracy. Calculated XES spectra (XESQ) were plotted by using ORCA_MAPSPC over a range of 7500–8500 eV for Ni and 8000–9000 eV for Cu, with a weighting of 2.5 eV and 10000 points. Calculated spectra for Ni were shifted by 271.0 eV, and Cu XES spectra were not energy calibrated. All orbitals and spin density distributions were plotted by using Chimera.66 XAS and XES spectra were visualized by using Kaleidagraph.
Supplementary Material
ACKNOWLEDGMENTS
S.C.E.S. acknowledges NSF CAREER (1847926), a CSUPERB New Investigator Grant, and NSF XSEDE (CHE160059, ACI-1548562). T.H.W. acknowledges funding from the NIH (R01GM126205) and the Georgetown Environment Initiative. P.N.P. was supported by a Louis Stokes Alliance for Minority Participation Research Fellowship. P.N.P. and C.E.G. were supported by NSF XSEDE EMPOWER. Use of Stanford Synchrotron Radiation Lightsource, SLAC National Accelerator Laboratory, supported by DOE, Office of Science, BES (DE-AC02-76SF00515). The SSRL Structural Molecular Biology Program is supported by the DOE Office of Biological and Environmental Research and by the National Institutes of Health, National Institute of General Medical Sciences (including P41GM103393). The contents of this publication are solely the responsibility of the authors and do not necessarily represent the official views of NIGMS or NIH.
Footnotes
Supporting Information
The Supporting Information is available free of charge at https://pubs.acs.org/doi/10.1021/acs.inorgchem.0c02724.
XES and computational details (PDF)
Complete contact information is available at: https://pubs.acs.org/10.1021/acs.inorgchem.0c02724
The authors declare no competing financial interest.
Computational xyz input files may be obtained free of charge at https://zenodo.org under DOI: 10.5281/zenodo.3911324.
Contributor Information
Phan N. Phu, Department of Chemistry & Biochemistry, California State Polytechnic University, Pomona, California 91768, United States.
Carlos E. Gutierrez, Department of Chemistry & Biochemistry, California State Polytechnic University, Pomona, California 91768, United States
Subrata Kundu, Department of Chemistry, Georgetown University, Washington, D.C. 20057, United States; School of Chemistry, Indian Institute of Science Education and Research Thiruvananthapuram, Kerala 695551, India.
Dimosthenis Sokaras, Stanford Synchrotron Radiation Lightsource, SLAC National Accelerator Laboratory, Menlo Park, California 94025, United States.
Thomas Kroll, Stanford Synchrotron Radiation Lightsource, SLAC National Accelerator Laboratory, Menlo Park, California 94025, United States.
Timothy H. Warren, Department of Chemistry, Georgetown University, Washington, D.C. 20057, United States.
S. Chantal E. Stieber, Department of Chemistry & Biochemistry, California State Polytechnic University, Pomona, California 91768, United States.
REFERENCES
- (1).Tocheva EI Side-On Copper-Nitrosyl Coordination by Nitrite Reductase. Science 2004, 304 (5672), 867–870. [DOI] [PubMed] [Google Scholar]
- (2).Chakraborty S; Reed J; Sage JT; Branagan NC; Petrik ID; Miner KD; Hu MY; Zhao J; Alp EE; Lu Y Recent Advances in Biosynthetic Modeling of Nitric Oxide Reductases and Insights Gained from Nuclear Resonance Vibrational and Other Spectroscopic Studies. Inorg. Chem 2015, 54 (19), 9317–9329. [DOI] [PMC free article] [PubMed] [Google Scholar]
- (3).Matsumoto Y; Tosha T; Pisliakov AV; Hino T; Sugimoto H; Nagano S; Sugita Y; Shiro Y Crystal Structure of Quinol-Dependent Nitric Oxide Reductase from Geobacillus Stearothermophilus. Nat. Struct. Mol. Biol 2012, 19 (2), 238–245. [DOI] [PubMed] [Google Scholar]
- (4).Blomberg MRA; Siegbahn PEM Mechanism for N2 O Generation in Bacterial Nitric Oxide Reductase: A Quantum Chemical Study. Biochemistry 2012, 51 (25), 5173–5186. [DOI] [PubMed] [Google Scholar]
- (5).Caranto JD; Vilbert AC; Lancaster KM Nitrosomonas Europaea Cytochrome P460 Is a Direct Link between Nitrification and Nitrous Oxide Emission. Proc. Natl. Acad. Sci. U. S. A 2016, 113 (51), 14704–14709. [DOI] [PMC free article] [PubMed] [Google Scholar]
- (6).Solomon EI; Heppner DE; Johnston EM; Ginsbach JW; Cirera J; Qayyum M; Kieber-Emmons MT; Kjaergaard CH; Hadt RG; Tian L Copper Active Sites in Biology. Chem. Rev 2014, 114 (7), 3659–3853. [DOI] [PMC free article] [PubMed] [Google Scholar]
- (7).Tomson NC; Williams KD; Dai X; Sproules S; DeBeer S; Warren TH; Wieghardt K Re-Evaluating the Cu K Pre-Edge XAS Transition in Complexes with Covalent Metal-Ligand Interactions. Chem. Sci 2015, 6 (4), 2474–2487. [DOI] [PMC free article] [PubMed] [Google Scholar]
- (8).Enemark JH; Feltham RD Principles of Structure, Bonding, and Reactivity for Metal Nitrosyl Complexes. Coord. Chem. Rev 1974, 13 (4), 339–406. [Google Scholar]
- (9).Ampßler T; Monsch G; Popp J; Riggenmann T; Salvador P; Schröder D; Klüfers P Not Guilty on Every Count: The “Non-Innocent” Nitrosyl Ligand in the Framework of IUPAC′s Oxidation-State Formalism. Angew. Chem., Int. Ed 2020, 59, 12381. [DOI] [PMC free article] [PubMed] [Google Scholar]
- (10).McCleverty JA Chemistry of Nitric Oxide Relevant to Biology. Chem. Rev 2004, 104 (2), 403–418. [DOI] [PubMed] [Google Scholar]
- (11).Teillet-Billy D; Fiquet-Fayard F The NO−3 Σ− and 1Δ resonances: theoretical analysis of electron scattering data. J. Phys. B: At. Mol. Phys 1977, 10 (4), L111–L117. [Google Scholar]
- (12).Nitrosyl Complexes in Inorganic Chemistry, Biochemistry and Medicine II; Mingos DMP, Ed.; Structure and Bonding; Springer-Verlag: Berlin, 2014. [Google Scholar]
- (13).Balcells D; Carbo JJ; Maseras F; Eisenstein O Self-Consistency versus “Best-Fit” Approaches in Understanding the Structure of Metal Nitrosyl Complexes. Organometallics 2004, 23, 6008–6014. [Google Scholar]
- (14).Kowalska JK; Lima FA; Pollock CJ; Rees JA; DeBeer S A Practical Guide to High-Resolution X-Ray Spectroscopic Measurements and Their Applications in Bioinorganic Chemistry. Isr. J. Chem 2016, 56 (9–10), 803–815. [Google Scholar]
- (15).Bergmann U; Glatzel P X-Ray Emission Spectroscopy. Photosynth. Res 2009, 102 (2–3), 255–266. [DOI] [PubMed] [Google Scholar]
- (16).Glatzel P; Bergmann U High Resolution 1s Core Hole X-Ray Spectroscopy in 3d Transition Metal Complexes—Electronic and Structural Information. Coord. Chem. Rev 2005, 249 (1), 65–95. [Google Scholar]
- (17).Eeckhout SG; Safonova OV; Smolentsev G; Biasioli M; Safonov VA; Vykhodtseva LN; Sikora M; Glatzel P Cr Local Environment by Valence-to-Core X-Ray Emission Spectroscopy. J. Anal. At. Spectrom 2009, 24 (2), 215–223. [Google Scholar]
- (18).Smolentsev G; Soldatov AV; Messinger J; Merz K; Weyhermüller T; Bergmann U; Pushkar Y; Yano J; Yachandra VK; Glatzel P X-Ray Emission Spectroscopy To Study Ligand Valence Orbitals in Mn Coordination Complexes. J. Am. Chem. Soc 2009, 131 (36), 13161–13167. [DOI] [PMC free article] [PubMed] [Google Scholar]
- (19).Delgado-Jaime MU; Dible BR; Chiang KP; Brennessel WW; Bergmann U; Holland PL; DeBeer S Identification of a Single Light Atom within a Multinuclear Metal Cluster Using Valence-to-Core X-Ray Emission Spectroscopy. Inorg. Chem 2011, 50 (21), 10709–10717. [DOI] [PMC free article] [PubMed] [Google Scholar]
- (20).Lancaster KM; Roemelt M; Ettenhuber P; Hu Y; Ribbe MW; Neese F; Bergmann U; DeBeer S X-Ray Emission Spectroscopy Evidences a Central Carbon in the Nitrogenase Iron-Molybdenum Cofactor. Science 2011, 334 (6058), 974–977. [DOI] [PMC free article] [PubMed] [Google Scholar]
- (21).Martinie RJ; Blaesi EJ; Krebs C; Bollinger JM; Silakov A; Pollock CJ Evidence for a Di-μ-Oxo Diamond Core in the Mn(IV)/Fe(IV) Activation Intermediate of Ribonucleotide Reductase from Chlamydia Trachomatis. J. Am. Chem. Soc 2017, 139 (5), 1950–1957. [DOI] [PMC free article] [PubMed] [Google Scholar]
- (22).Martinie RJ; Blaesi EJ; Bollinger JM; Krebs C; Finkelstein KD; Pollock CJ Two-Color Valence-to-Core X-Ray Emission Spectroscopy Tracks Cofactor Protonation State in a Class I Ribonucleotide Reductase. Angew. Chem., Int. Ed 2018, 57 (39), 12754–12758. [DOI] [PMC free article] [PubMed] [Google Scholar]
- (23).Martin-Diaconescu V; Chacon KN; Delgado-Jaime MU; Sokaras D; Weng T-C; DeBeer S; Blackburn NJ Kβ Valence to Core X-Ray Emission Studies of Cu(I) Binding Proteins with Mixed Methionine - Histidine Coordination. Relevance to the Reactivity of the M- and H-Sites of Peptidylglycine Monooxygenase. Inorg. Chem 2016, 55 (7), 3431–3439. [DOI] [PMC free article] [PubMed] [Google Scholar]
- (24).Lim H; Baker ML; Cowley RE; Kim S; Bhadra M; Siegler MA; Kroll T; Sokaras D; Weng T-C; Biswas DR; Dooley DM; Karlin KD; Hedman B; Hodgson KO; Solomon EI Kβ X-Ray Emission Spectroscopy as a Probe of Cu(I) Sites: Application to the Cu(I) Site in Preprocessed Galactose Oxidase. Inorg. Chem 2020, 59 (22), 16567–16581. [DOI] [PMC free article] [PubMed] [Google Scholar]
- (25).Pollock CJ; DeBeer S Insights into the Geometric and Electronic Structure of Transition Metal Centers from Valence-to-Core X-Ray Emission Spectroscopy. Acc. Chem. Res 2015, 48 (11), 2967–2975. [DOI] [PubMed] [Google Scholar]
- (26).Stieber SCE; Milsmann C; Hoyt JM; Turner ZR; Finkelstein KD; Wieghardt K; DeBeer S; Chirik PJ Bis(Imino)Pyridine Iron Dinitrogen Compounds Revisited: Differences in Electronic Structure Between Four- and Five-Coordinate Derivatives. Inorg. Chem 2012, 51 (6), 3770–3785. [DOI] [PubMed] [Google Scholar]
- (27).Lu T-T; Weng T-C; Liaw W-F X-Ray Emission Spectroscopy: A Spectroscopic Measure for the Determination of NO Oxidation States in Fe-NO Complexes. Angew. Chem., Int. Ed 2014, 53 (43), 11562–11566. [DOI] [PubMed] [Google Scholar]
- (28).Pollock CJ; Grubel K; Holland PL; DeBeer S Experimentally Quantifying Small-Molecule Bond Activation Using Valence-to-Core X-Ray Emission Spectroscopy. J. Am. Chem. Soc 2013, 135 (32), 11803–11808. [DOI] [PMC free article] [PubMed] [Google Scholar]
- (29).Lassalle-Kaiser B; Boron TT; Krewald V; Kern J; Beckwith MA; Delgado-Jaime MU; Schroeder H; Alonso-Mori R; Nordlund D; Weng T-C; Sokaras D; Neese F; Bergmann U; Yachandra VK; DeBeer S; Pecoraro VL; Yano J Experimental and Computational X-Ray Emission Spectroscopy as a Direct Probe of Protonation States in Oxo-Bridged MnIV Dimers Relevant to Redox-Active Metalloproteins. Inorg. Chem 2013, 52 (22), 12915–12922. [DOI] [PMC free article] [PubMed] [Google Scholar]
- (30).Cutsail GE; Gagnon NL; Spaeth AD; Tolman WB; DeBeer S Valence-to-Core X-Ray Emission Spectroscopy as a Probe of O-O Bond Activation in Cu2O2 Complexes. Angew. Chem., Int. Ed 2019, 58 (27), 9114–9119. [DOI] [PMC free article] [PubMed] [Google Scholar]
- (31).Hugenbruch S; Shafaat HS; Krämer T; Delgado-Jaime MU; Weber K; Neese F; Lubitz W; DeBeer S In Search of Metal Hydrides: An X-Ray Absorption and Emission Study of [NiFe] Hydrogenase Model Complexes. Phys. Chem. Chem. Phys 2016, 18 (16), 10688–10699. [DOI] [PubMed] [Google Scholar]
- (32).Burkhardt L; Holzwarth M; Plietker B; Bauer M Detection and Characterization of Hydride Ligands in Iron Complexes by High-Resolution Hard X-Ray Spectroscopy and Implications for Catalytic Processes. Inorg. Chem 2017, 56 (21), 13300–13310. [DOI] [PubMed] [Google Scholar]
- (33).Kundu S; Phu PN; Ghosh P; Kozimor SA; Bertke JA; Stieber SCE; Warren TH Nitrosyl Linkage Isomers: NO Coupling to N 2 O at a Mononuclear Site. J. Am. Chem. Soc 2019, 141 (4), 1415–1419. [DOI] [PMC free article] [PubMed] [Google Scholar]
- (34).Kowalska JK; Hahn AW; Albers A; Schiewer CE; Bjornsson R; Lima FA; Meyer F; DeBeer S X-Ray Absorption and Emission Spectroscopic Studies of [L2 Fe2 S2]n Model Complexes: Implications for the Experimental Evaluation of Redox States in Iron-Sulfur Clusters. Inorg. Chem 2016, 55 (9), 4485–4497. [DOI] [PMC free article] [PubMed] [Google Scholar]
- (35).Neese F Orca: An Ab Initio, DFT and Semiempirical Electronic Structure Package; Max Planck Institute for Chemical Energy Conversion: Mülheim an der Ruhr, Germany. [Google Scholar]
- (36).MacMillan SN; Walroth RC; Perry DM; Morsing TJ; Lancaster KM Ligand-Sensitive But Not Ligand-Diagnostic: Evaluating Cr Valence-to-Core X-Ray Emission Spectroscopy as a Probe of Inner-Sphere Coordination. Inorg. Chem 2015, 54 (1), 205–214. [DOI] [PMC free article] [PubMed] [Google Scholar]
- (37).Krewald V; Lassalle-Kaiser B; Boron TT; Pollock CJ; Kern J; Beckwith MA; Yachandra VK; Pecoraro VL; Yano J; Neese F; DeBeer S The Protonation States of Oxo-Bridged MnIV Dimers Resolved by Experimental and Computational Mn K Pre-Edge X-Ray Absorption Spectroscopy. Inorg. Chem 2013, 52 (22), 12904–12914. [DOI] [PMC free article] [PubMed] [Google Scholar]
- (38).Pollock CJ; Lancaster KM; Finkelstein KD; DeBeer S Study of Iron Dimers Reveals Angular Dependence of Valence-to-Core X-Ray Emission Spectra. Inorg. Chem 2014, 53 (19), 10378–10385. [DOI] [PMC free article] [PubMed] [Google Scholar]
- (39).Lee N; Petrenko T; Bergmann U; Neese F; DeBeer S Probing Valence Orbital Composition with Iron Kβ X-Ray Emission Spectroscopy. J. Am. Chem. Soc 2010, 132 (28), 9715–9727. [DOI] [PubMed] [Google Scholar]
- (40).Schwalenstocker K; Paudel J; Kohn AW; Dong C; Van Heuvelen KM; Farquhar ER; Li F Cobalt Kβ Valence-to-Core X-Ray Emission Spectroscopy: A Study of Low-Spin Octahedral Cobalt(III) Complexes. Dalton Trans. 2016, 45, 14191. [DOI] [PMC free article] [PubMed] [Google Scholar]
- (41).Kirchner B; Wennmohs F; Ye S; Neese F Theoretical bioinorganic chemistry: the electronic structure makes a difference. Curr. Opin. Chem. Biol 2007, 11, 134. [DOI] [PubMed] [Google Scholar]
- (42).Schaefer A; Horn H; Ahlrichs R TZVP. J. Chem. Phys 1992, 97, 2571. [Google Scholar]
- (43).Rees JA; Martin-Diaconescu V; Kovacs JA; DeBeer S X-Ray Absorption and Emission Study of Dioxygen Activation by a Small-Molecule Manganese Complex. Inorg. Chem 2015, 54 (13), 6410–6422. [DOI] [PMC free article] [PubMed] [Google Scholar]
- (44).Delgado-Jaime MU; DeBeer S; Bauer M Valence-to-Core X-Ray Emission Spectroscopy of Iron-Carbonyl Complexes: Implications for the Examination of Catalytic Intermediates. Chem. - Eur. J 2013, 19 (47), 15888–15897. [DOI] [PubMed] [Google Scholar]
- (45).Bergmann U; Horne CR; Collins TJ; Workman JM; Cramer SP Chemical Dependence of Interatomic X-Ray Transition Energies and Intensities - a Study of Mn Kβ″ and Kβ2,5 Spectra. Chem. Phys. Lett 1999, 302 (1), 119–124. [Google Scholar]
- (46).Pollock CJ; DeBeer S Valence-to-Core X-Ray Emission Spectroscopy: A Sensitive Probe of the Nature of a Bound Ligand. J. Am. Chem. Soc 2011, 133 (14), 5594–5601. [DOI] [PubMed] [Google Scholar]
- (47).Szlachetko J; Nachtegaal M; de Boni E; Willimann M; Safonova O; Sa J; Smolentsev G; Szlachetko M; van Bokhoven JA; Dousse J.-Cl.; Hoszowska J; Kayser Y; Jagodzinski P; Bergamaschi A; Schmitt B; David C; Lücke A A von Hamos X-Ray Spectrometer Based on a Segmented-Type Diffraction Crystal for Single-Shot x-Ray Emission Spectroscopy and Time-Resolved Resonant Inelastic x-Ray Scattering Studies. Rev. Sci. Instrum 2012, 83 (10), 103105. [DOI] [PubMed] [Google Scholar]
- (48).Alonso-Mori R; Kern J; Gildea RJ; Sokaras D; Weng T-C; Lassalle-Kaiser B; Tran R; Hattne J; Laksmono H; Hellmich J; Glöckner C; Echols N; Sierra RG; Schafer DW; Sellberg J; Kenney C; Herbst R; Pines J; Hart P; Herrmann S; Grosse-Kunstleve RW; Latimer MJ; Fry AR; Messerschmidt MM; Miahnahri A; Seibert MM; Zwart PH; White WE; Adams PD; Bogan MJ; Boutet S; Williams GJ; Zouni A; Messinger J; Glatzel P; Sauter NK; Yachandra VK; Yano J; Bergmann U Energy-Dispersive X-Ray Emission Spectroscopy Using an X-Ray Free-Electron Laser in a Shot-by-Shot Mode. Proc. Natl. Acad. Sci. U. S. A 2012, 109 (47), 19103–19107. [DOI] [PMC free article] [PubMed] [Google Scholar]
- (49).Davis KM; Mattern BA; Pacold JI; Zakharova T; Brewe D; Kosheleva I; Henning RW; Graber TJ; Heald SM; Seidler GT; Pushkar Y Fast Detection Allowing Analysis of Metalloprotein Electronic Structure by X-Ray Emission Spectroscopy at Room Temperature. J. Phys. Chem. Lett 2012, 3 (14), 1858–1864. [DOI] [PMC free article] [PubMed] [Google Scholar]
- (50).March AM; Assefa TA; Boemer C; Bressler C; Britz A; Diez M; Doumy G; Galler A; Harder M; Khakhulin D; Németh Z; Pápai M; Schulz S; Southworth SH; Yavas H; Young L; Gawelda W; Vankó G Probing Transient Valence Orbital Changes with Picosecond Valence-to-Core X-Ray Emission Spectroscopy. J. Phys. Chem. C 2017, 121 (5), 2620–2626. [DOI] [PMC free article] [PubMed] [Google Scholar]
- (51).Sokaras D; Weng T-C; Nordlund D; Alonso-Mori R; Velikov P; Wenger D; Garachtchenko A; George M; Borzenets V; Johnson B; Rabedeau T; Bergmann U A Seven-Crystal Johann-Type Hard x-Ray Spectrometer at the Stanford Synchrotron Radiation Lightsource. Rev. Sci. Instrum 2013, 84 (5), 053102. [DOI] [PMC free article] [PubMed] [Google Scholar]
- (52).Solé VA; Papillon E; Cotte M; Walter Ph; Susini J A Multiplatform Code for the Analysis of Energy-Dispersive X-Ray Fluorescence Spectra. Spectrochim. Acta, Part B 2007, 62 (1), 63–68. [Google Scholar]
- (53).Towns J; Cockerill T; Dahan M; Foster I; Gaither K; Grimshaw A; Hazlewood V; Lathrop S; Lifka D; Peterson GD; Roskies R; Scott JR; Wilkins-Diehr N XSEDE: Accelerating Scientific Discovery. Comput. Sci. Eng 2014, 16 (5), 62–74. [Google Scholar]
- (54).Hanwell MD; Curtis DE; Lonie DC; Vandermeersch T; Zurek E; Hutchison GR Avogadro: An Advanced Semantic Chemical Editor, Visualization, and Analysis Platform. J. Cheminf 2012, 4 (1), 17. [DOI] [PMC free article] [PubMed] [Google Scholar]
- (55).Perdew JP Density-Functional Approximation for the Correlation Energy of the Inhomogeneous Electron Gas. Phys. Rev. B: Condens. Matter Mater. Phys 1986, 33 (12), 8822–8824. [DOI] [PubMed] [Google Scholar]
- (56).Perdew JP Erratum: Density-Functional Approximation for the Correlation Energy of the Inhomogeneous Electron Gas. Phys. Rev. B: Condens. Matter Mater. Phys 1986, 34 (10), 7406–7406. [PubMed] [Google Scholar]
- (57).Lee C; Yang W; Parr RG Development of the Colle-Salvetti Correlation-Energy Formula into a Functional of the Electron Density. Phys. Rev. B: Condens. Matter Mater. Phys 1988, 37 (2), 785–789. [DOI] [PubMed] [Google Scholar]
- (58).Neese F; Solomon EI Interpretation and Calculation of Spin-Hamiltonian Parameters in Transition Metal Complexes. In Magnetism: Molecules to Materials IV; John Wiley & Sons, Ltd: 2003; pp 345–466. [Google Scholar]
- (59).Schäfer A; Horn H; Ahlrichs R Fully Optimized Contracted Gaussian Basis Sets for Atoms Li to Kr. J. Chem. Phys 1992, 97 (4), 2571–2577. [Google Scholar]
- (60).Schäfer A; Huber C; Ahlrichs R Fully Optimized Contracted Gaussian Basis Sets of Triple Zeta Valence Quality for Atoms Li to Kr. J. Chem. Phys 1994, 100 (8), 5829–5835. [Google Scholar]
- (61).Weigend F; Ahlrichs R Balanced Basis Sets of Split Valence, Triple Zeta Valence and Quadruple Zeta Valence Quality for H to Rn: Design and Assessment of Accuracy. Phys. Chem. Chem. Phys 2005, 7 (18), 3297–3305. [DOI] [PubMed] [Google Scholar]
- (62).Eichkorn K; Treutler O;Öhm H; Häser M; Ahlrichs R Auxiliary Basis Sets to Approximate Coulomb Potentials. Chem. Phys. Lett 1995, 240 (4), 283–290. [Google Scholar]
- (63).Eichkorn K; Weigend F; Treutler O; Ahlrichs R Auxiliary Basis Sets for Main Row Atoms and Transition Metals and Their Use to Approximate Coulomb Potentials. Theor. Chem. Acc 1997, 97 (1), 119–124. [Google Scholar]
- (64).Ginsberg AP Magnetic Exchange in Transition Metal Complexes. 12. Calculation of Cluster Exchange Coupling Constants with the X. Alpha.-Scattered Wave Method. J. Am. Chem. Soc 1980, 102 (1), 111–117. [Google Scholar]
- (65).Noodleman L; Peng CY; Case DA; Mouesca J-M Orbital Interactions, Electron Delocalization and Spin Coupling in Iron-Sulfur Clusters. Coord. Chem. Rev 1995, 144, 199–244. [Google Scholar]
- (66).Pettersen EF; Goddard TD; Huang CC; Couch GS; Greenblatt DM; Meng EC; Ferrin TE Chimera. J. Comput. Chem 2004, 25, 1605. [DOI] [PubMed] [Google Scholar]
Associated Data
This section collects any data citations, data availability statements, or supplementary materials included in this article.


