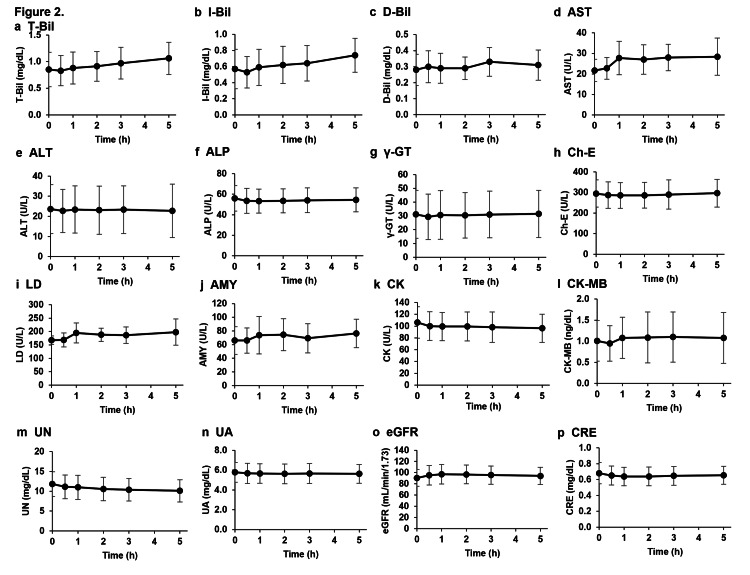
Figure 3. Effects of intravenous NMN administration on metabolic markers of liver, pancreas, heart, and kidney.
Levels of metabolic markers of the liver, pancreas, heart, and kidney were measured in plasma obtained from subjects before and at 0.5, 1, 2, 3, and 5 h after intravenous NMN administration. The effects of the intravenous NMN administration on liver metabolism were evaluated via (a) T-Bill, (b) I-Bill, (c) D-Bill, (d) AST, (e) ALT, (f) ALP, (g) γ-GT, (h) Ch-E, and (i) LD; pancreatic metabolism was evaluated based on (j) AMY; cardiac metabolism was observed based on (k) CK and (l) CK-MB; renal metabolism was evaluated based on (m) UN, (n) UA, (o) eGFR, and (p) CRE. The results are expressed as mean ± standard deviation (n = 10).
NMN: Nicotinamide mononucleotide; T-Bill: Total bilirubin; I-Bill: Indirect bilirubin; D-Bill: Direct bilirubin; AST: Aspartate transaminase; ALT: Alanine aminotransferase; ALP: Alanine phosphotransferase; γ-GT: Gamma-glutamyl transferase; LD: Lactate dehydrogenase; Ch-E: Cholinesterase; AMY: Amylase; CK: Creatine kinase; CK-MB: CK myocardial band; UN: Urea nitrogen; CRE: Creatinine; UA: Urinalysis; eGFR: Estimated glomerular filtration rate

