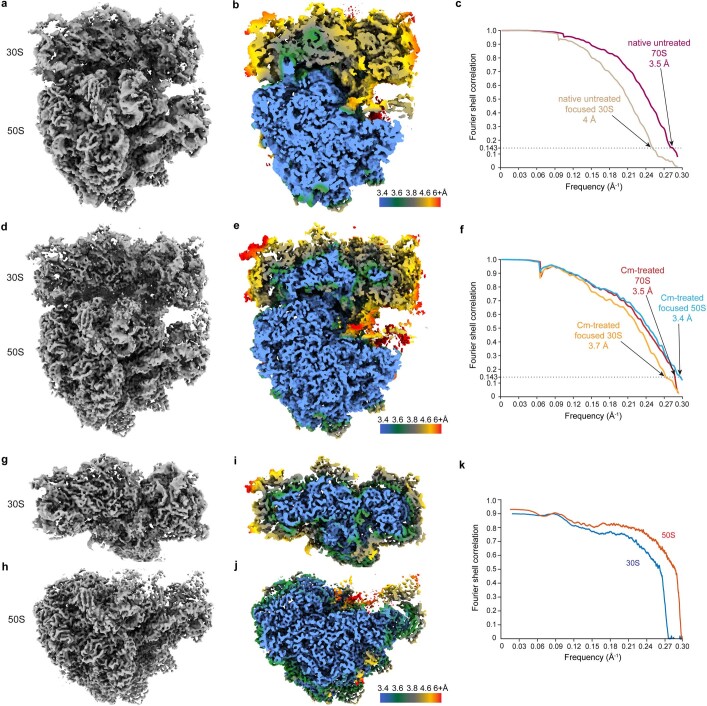
Extended Data Fig. 1. M. pneumoniae in-cell ribosome maps.
a, 70S ribosome map determined from 77,539 sub-tomograms from 356 untreated M. pneumoniae cells. b, Map coloured by local resolutions. 50S has the highest local resolutions as it dominates the overall alignment. The relatively lower local resolutions of the 30S indicate their high flexibility during active translation. c, Fourier shell correlation (FSC) curves for global 70S and focused 30S refinement, and the reported resolution value at FSC = 0.143. The Nyquist limit for the data is 3.4 Å. d, 70S ribosome map determined from 18,987 sub-tomograms from 65 Cm-treated cells. e, Map coloured by local resolutions. f, FSC curves of the Cm-treated 70S ribosome, and of focused refinements on 30S and 50S respectively. g-h, Focused refined 30S and 50S maps from the Cm-treated dataset. i-j, The corresponding local-resolution maps. Atomic models for 30S and 50S were first built based on maps in g and h. k, Model-to-map FSC curves for 30S and 50S, respectively.

